 Qihui Chai1,2
 Fang Wan
- 1School of Water Resources, North China University of Water Resources and Electric Power, Zhengzhou, China
- 2Henan Key Laboratory of Water Resources Conservation and Intensive Utilization in the Yellow River Basin, Zhengzhou, China
Introduction: A new method is introduced to test the tensile strength of concrete: the cylinder transverse splitting test. Compared with the cylinder splitting (or Brazilian) test, the cylinder transverse splitting test involves different load positions and offers the advantages of doubling the data volume with the same number of specimens and improving the detection accuracy.
Methods: Finite element analysis software was used to simulate the concrete cylinder transverse splitting test and the stress distribution on the failure surface was determined.
Results and Discussion: The results show that the fracture of a cylinder is mainly determined by tensile stress. The splitting strength of normal concrete and crumb rubber concrete, a new environmentally friendly concrete material that has gathered considerable attention in recent years, was obtained by cylinder transverse and cube splitting tests. The cylinder transverse splitting test data show a stable correlation with the cube splitting test data and well characterize the concrete strength. The relationship between the cylinder nominal transverse splitting strength (f2) and cube splitting strength (f1) was established on the basis of linear analysis of the test data: f1 = 0.51f2. The calculated cube splitting strength is in good agreement with the test values.
1 Introduction
The tensile strength of concrete is substantially less than its compressive strength. Cracks in concrete easily propagate under tension, which can affect its service life and durability (Bhanja and Sengupta, 2005; Ge et al., 2022). A large number of laboratory studies have evaluated the tensile strength of concrete using three main methods: direct tensile tests; beam flexural tests; and splitting tensile tests (Rashid, et al., 2002; Lu and Li, 2011). Direct tension is theoretically considered to yield a tensile strength similar to the true strength of the concrete under pure uniaxial tension (Wu et al., 2012), but is often difficult to apply owing to the lack of control over the initial crack position, local stress concentrations, and eccentricity strain (Swaddiwudhipong et al., 2003; Zi et al., 2008; Sarfarazi et al., 2018). Furthermore, tensile strength values derived from beam flexural tests tend to be higher than those obtained from direct tensile tests (Raphael, 1984). There are two types of splitting tensile tests listed in GB/T50081-2002. (2002): the cube splitting test (Figure 1A) and the cylinder splitting (or Brazilian) test (Figure 1B). Previous studies have shown that the tensile strength obtained from cylinder splitting tests are closer to the true tensile strength than flexural tests (Mindess et al., 2002; Wang et al., 2022). The results of cylinder splitting tests have also been shown to provide better tensile strength predications than cube splitting tests (Nilsson, 1961).
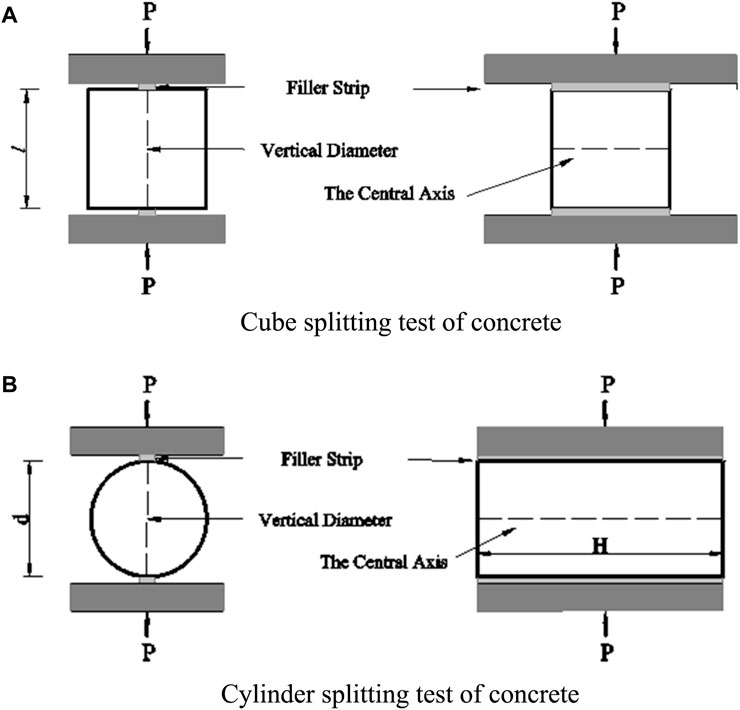
FIGURE 1. Two types of concrete specimen splitting tests: the cube splitting test (A) and the cylinder splitting test (B).
The measurement of concrete strength is important for evaluating the construction quality of completed concrete projects. The drilled-core method is commonly used to detect the concrete structure strength because of its immediacy and reliability (Ge et al., 2020). In this approach, cylindrical specimens with a diameter of 100 mm are drilled from a concrete structure and the compressive strength and splitting strength are tested. The Brazilian test is used to measure the tensile strength of concrete within the core-drilling method. The drilling position and number of samples is stipulated to ensure minimum damage to the concrete structure within the detection range (JGJ/T384-2016, 2016), which can be difficult. The drilled-core method has strict requirements on the height-diameter ratio, perpendicularity, and flatness of the end face of the cylindrical specimen, which increases the difficulty of drilling and specimen processing.
The following limitations are often encountered when using cylinder splitting to measure the tensile strength of concrete following the drilled-core method (JGJ/T384-2016, 2016). 1) Differing from cylindrical specimens made in the laboratory, cylindrical core specimens that are drilled on concrete structures often have variable lengths with uneven end faces. Cylinder core specimens must thus be processed prior to testing with a height-to-diameter ratio of 2. 2) Tensile strength data are often limited because each cylindrical core specimen has only one tensile strength value and concrete structures have a limited amount of available specimen owing to drill core damage (Wang et al., 2023). 3) Specialized skills, tools, and working conditions are required to obtain a complete concrete cylinder core. To improve this situation, Yuan et al. (2006) presented the cylinder transverse splitting method to test the splitting strength of concrete cylinder specimens. Differing from the Brazilian test, the load in the cylinder transverse splitting method is applied across the diameter and perpendicular to the central axis. The direction of the specimen bus bar is thus pulled, which results in splitting tensile failure of the cross-section (Figure 2). The transverse splitting method has the following advantages: 1) increased amount of tensile strength data (a concrete cylinder specimen can be split multiple times); 2) reduced concrete core specimen processing procedure (the end of the concrete core specimen does not need to be cut and leveled); and 3) increased use ratio of the concrete core specimen (a specimen that is shorter than the minimum length specified in JGJ/T384-2016. (2016) can be tested).
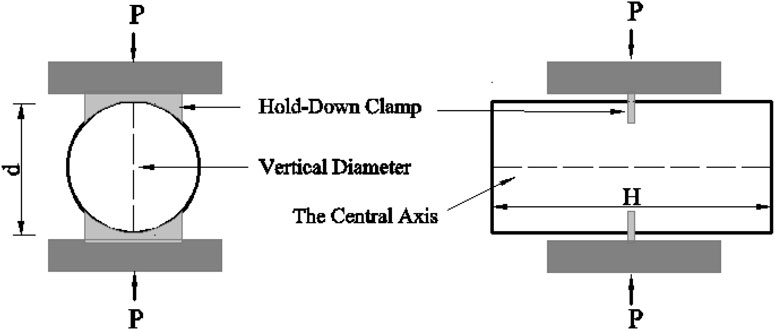
FIGURE 2. Cylinder transverse splitting method.
Yu et al. (2010) theoretically verified the rationality of multiple transverse cleavage rafting and concluded that higher specimen quantity improves the detection accuracy and reduces the confidence interval difference and upper limit of the variation coefficient. An experimental study by Xiao et al. (2011) showed that the splitting strength (detected by the cylinder transverse splitting method) of a concrete cylinder correlates well with the concrete compressive strength, and that the cylinder transverse splitting method can be used to more accurately and conveniently determine the concrete materiality than traditional core axial compression methods. Yuan et al. (2016) used a finite element model to analyze the rationality of the stress distribution on the transection of cylindrical concrete and found that the tensile failure of the transection depends on the cylinder’s axial tensile stress.
Although the cylinder transverse splitting method has been shown to be feasible for testing the concrete tensile strength in many aspects (e.g., testing, mathematical statistics, finite element modeling), the cylinder transverse splitting strength is difficult to determine using a reasonable calculation formula. The cylinder transverse splitting strength was previously expressed by the nominal transverse splitting strength, P/A, where P is the failure load and A is the surface area cleavage. In this study, a strong correlation is found between the nominal transverse splitting strength of cylindrical concrete obtained by the cylinder transverse splitting method and the splitting strength of cubic concrete. A calculation formula to test the concrete tensile strength by the cylindrical transverse splitting method is established using the regression of a large number of experimental data. On the basis of previous tests, this study developed an improved specimen clamp for the cylinder transverse splitting method. In addition to normal concrete (NC), crumb rubber concrete (CRC) was also investigated to increase the amount of data and explore a wider range of concrete composition.
CRC is a new environmentally friendly concrete material made by the addition of rubber particles (e.g., crushed automobile tire waste) into ordinary concrete and has broad engineering application prospects (Lin et al., 2023). The rubber particles have a good elasticity, which can alleviate the stress concentration inside the concrete and reduce the probability of primary crack formation and concrete structural damage caused by an external load (Youssf et al., 2023). The addition of rubber particles to NC improves its crack resistance (Li et al., 2021; Elsayed et al., 2022; Feng et al., 2022), impact resistance (Topcu and Avcular, 1997), freeze-thaw durability (Savas et al., 1997; Paine and Dhir, 2002; Khan et al., 2021), abrasion resistance (Hang and Fan, 2011; Sun et al., 2021; Zhang et al., 2023), and reduces its elasticity modulus (Hernandez et al., 2002; Benazzouk et al., 2003; Haldar and Karmakar, 2021). Rubber particles can also reduce the concrete strength (Xu et al., 2020; Xu et al., 2021; Han et al., 2023). Segre et al. (2002) pointed out that zinc stearate tends to reduce the binding force between rubber particles and cement by infrared rays and chemical titration. Although Segre and Jocke (2000) found that rubber particles soaked in saturated NaOH solution for 20 min prior to mixing with the cement slurry improved the compressive strength, splitting strength, and bending strength of rubber cement mortar, they were unable to reach the strength level without the addition of rubber particles. The CRC tensile strength testing method must be thoroughly investigated to ensure engineering application safety (Adeboje et al., 2020).
2 Materials and methods
2.1 Materials
Ordinary Portland Cement 42.5 was used in this study and its properties are listed in Table 1. The coarse aggregates were limestone gravel and the fine aggregates were natural river sand and rubber particles of 1–3 and 3–6 mm, the latter of which were obtained by crushing scrap tires. The properties of the coarse and fine aggregates are listed in Table 2. The apparent density of the rubber particles is 1119 kg/m3. The grading curve of the fine aggregates and rubber particles is shown in Figure 3. The indexes of the fine and coarse aggregates meet the requirements of GB/T14684-2011. (2011) and GB/T14685-2011. (2011).

TABLE 1. Cement properties.

TABLE 2. Aggregate properties.
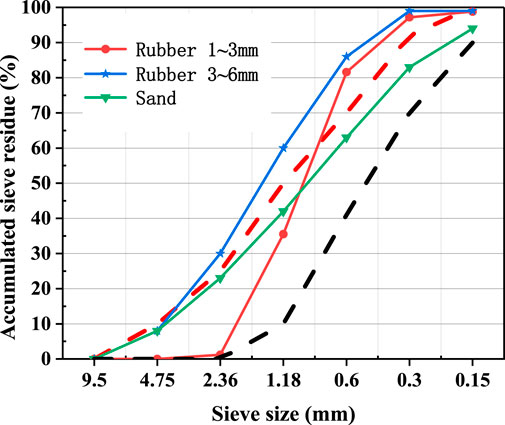
FIGURE 3. Grading curves of sand and rubber particles.
2.2 Mixtures
Six water-cement ratios (W/C) were used, as listed in Table 3. The CRC was produced by partially replacing the fine aggregates with rubber particles in volumetric proportions of 1%, 3%, 5%, 10%, and 15% (Table 4). The samples covered a relevant concrete strength range that is commonly used in concrete engineering.
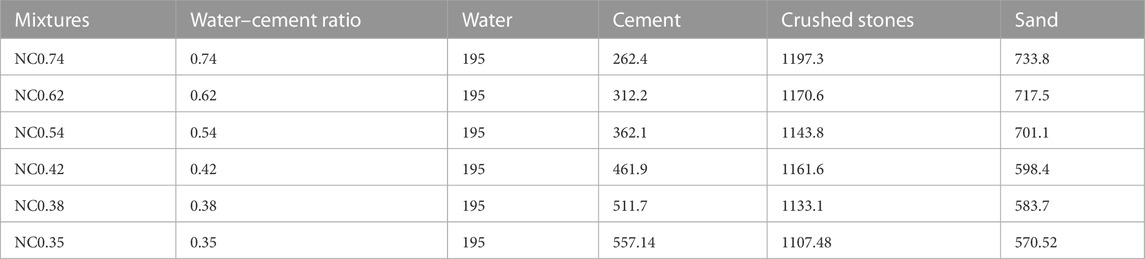
TABLE 3. Mixture proportions of NC (kg/m3).
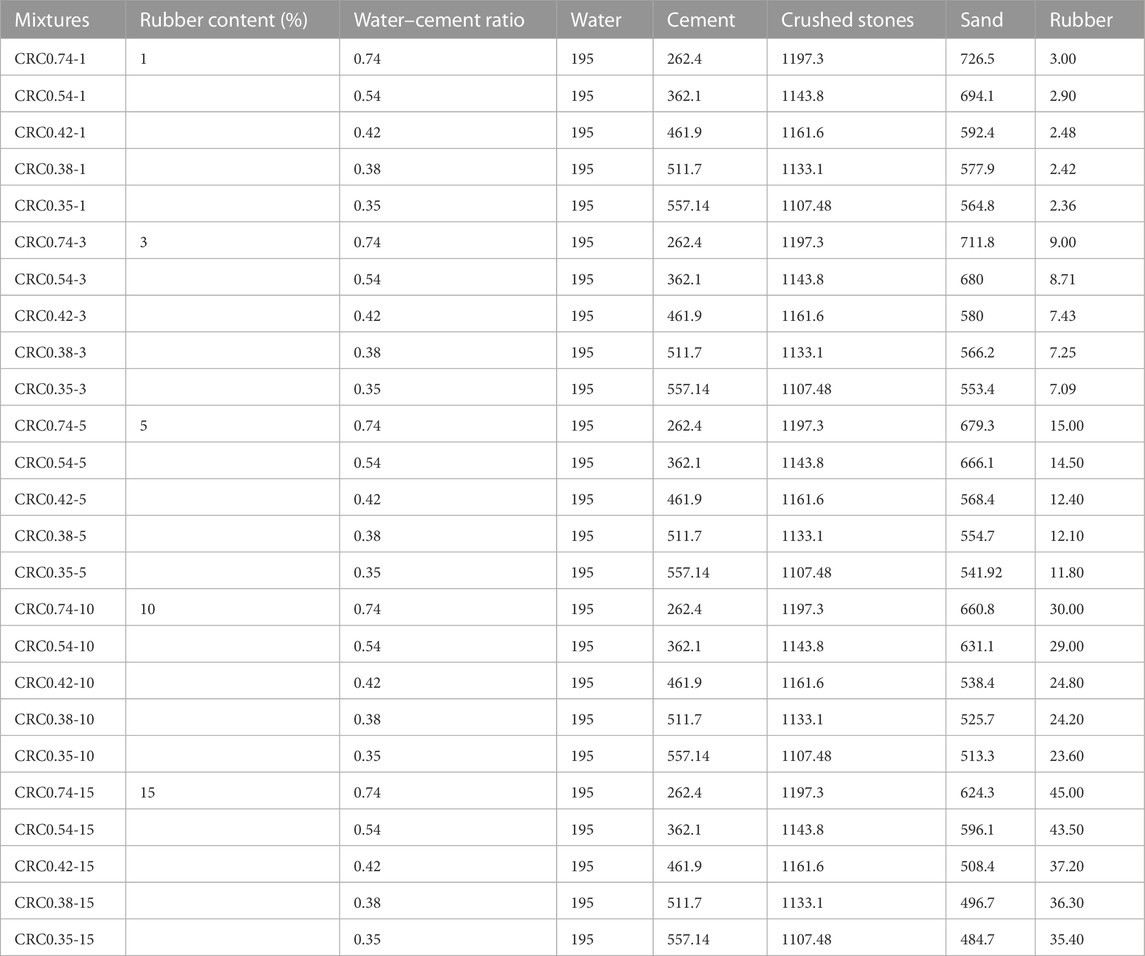
TABLE 4. Mixture proportions of CRC (kg/m3).
2.3 Specimen preparation
Each mixture proportion contained cubic and cylindrical transverse splitting specimens. The specimens for testing the mechanical properties were prepared based on SL352-2006. (2006) and the number and size are listed in Table 5.

TABLE 5. Specimen number and size for each group.
2.4 Test method
2.4.1 Finite element simulations
ANSYS software was used to simulate the transverse splitting tests of the concrete cylinders. The simulations included solid 65 as the concrete material, a sample size of Φ0.1 × 0.1 m, elastic modulus of 30,000 MPa, and Poisson’s ratio of 0.2. The constitutive relation adopts the Drucher-Prager model. The failure criterion is an improved William-Warnke five-parameter failure surface, which requires that the following parameters be defined: uniaxial tensile strength; uniaxial compression strength; biaxial compression strength; and uniaxial and biaxial compression strength under a certain confining pressure. Owing to the lack of multi-axis test parameters, ANSYS only requires uniaxial tensile strength and uniaxial compression strength input values, and the other parameters were calculated by the ANSYS default formula. The fracture opening shear transfer coefficient of concrete was 0.3, the fracture closing shear transfer coefficient was 0.9, and the uniaxial tensile strength was 3 MPa. Concrete crushing failure was not considered in the calculation. The remaining concrete parameters were set to the ANSYS default values. The parameters are selected according to the mechanical properties of the most common C30 concrete. The elastic modulus is about 30000 MPa, and the tensile strength is about 3 MPa (1/10 of the compressive strength). The shear stress transfer coefficient of open fissure in concrete is 0.3–0.5, which is 0.3 in this paper. The shear stress transfer coefficient of closed cracks is 0.9–1.0, which is 0.9 in this paper.
2.4.2 Cube splitting tests
Cube splitting tests were performed in accordance with SL352-2006. (2006). The test instrument was a hydraulic universal testing machine with a maximum test force of 2000 kN. The experimental device is shown in Figure 4, which includes a steel square filler strip with a cross-section of 5 × 5 mm and length of 200 mm. To apply a linear uniform load on the concrete surface, the filler strip was placed between the concrete surface and pressure plate (Tang, 1994; Rocco et al., 2000; Olesen et al., 2006). The cube splitting strength of concrete was calculated according to:
where
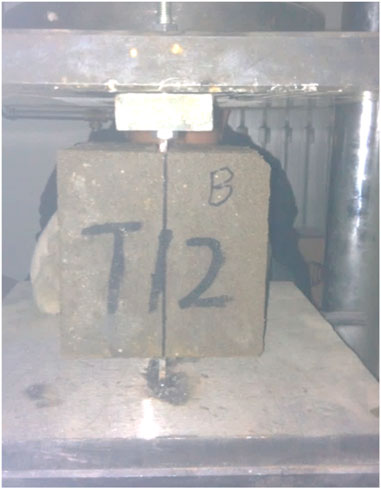
FIGURE 4. Cube splitting test.
2.4.3 Cylinder transverse splitting method
The setup used in the cylinder transverse splitting test is shown in Figure 5. One of each of the upper and lower pressure plates of the hydraulic servo universal testing machine was used (Figure 6). The test instrument was a hydraulic universal testing machine with a maximum test force of 1000 kN. The contact position with the concrete specimen was an anti-arc pressure cutter (equivalent of a filler strip) and the contact surface was 5-mm wide.
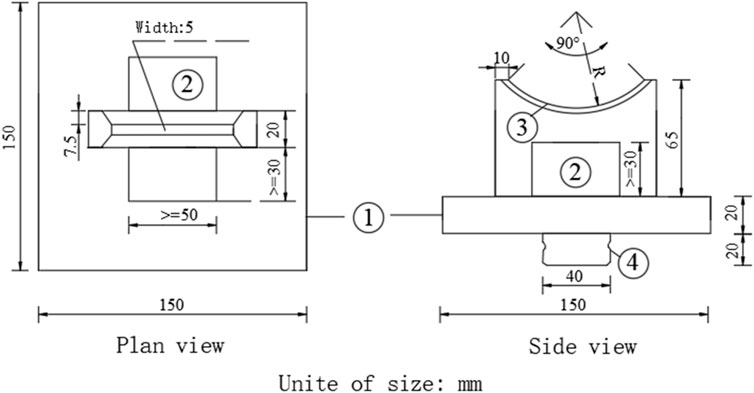
FIGURE 5. Schematic diagram of the test fixture: ① pressing plate; ② stiffening rib; ③ pressure cutter; and ④ connecting bolt.
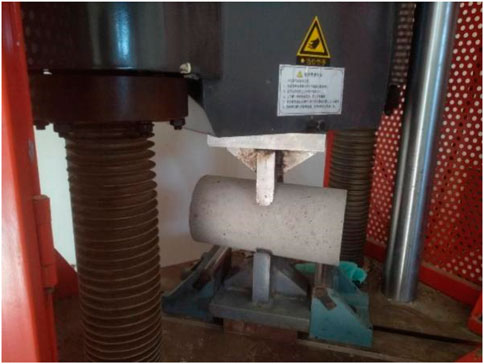
FIGURE 6. Setup installation.
The cylinder transverse splitting test process was as follows. The cylinder specimens were cured in a standard curing room for 28 days and immediately tested after removing the surface moisture. A pencil was used to mark the circumference parallel to the specimen cross-section to determine the splitting position (Figure 7A). The displacement boundary conditions of the cylinder specimens are related closely to the cylinder shape (Jia, 1997; Kanos et al., 2006; Yang and Li, 2002; Zhou et al., 2008; Wu et al., 2021) and the height-diameter ratio is the basic parameter that reflects the cylinder shape characteristics. Yuan et al. (2016) found that the transverse fracture failure load changed little with increasing specimen height when the cylinder height-diameter ratio was greater than or equal to 0.7 and is thus considered stable. The cylinder specimen could therefore be uniformly split three times. The height-diameter ratio was 2 in the first splitting and 1 in the second and third splittings (Figure 7B). A vernier caliper was used to measure the cylinder diameter along the predetermined splitting position. The mean value of three measurements was taken as the effective specimen diameter to calculate the cross-sectional area
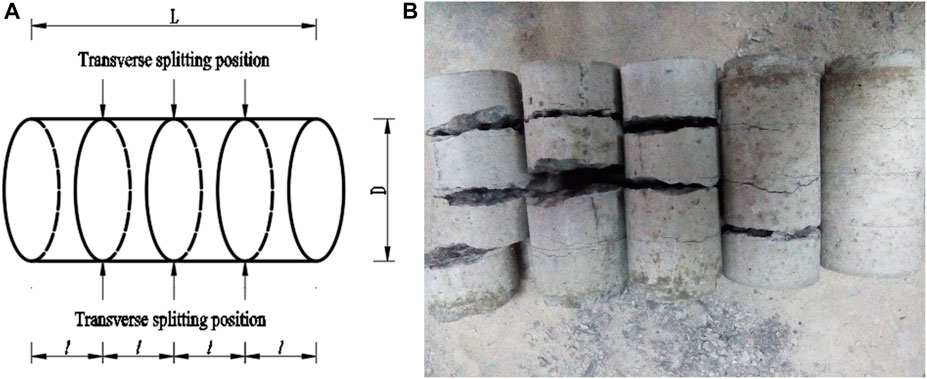
FIGURE 7. Transverse splitting position of cylinder specimen (D = 100 mm, L = 200 mm, l = 50 mm) (A). The cylinder specimen could be uniformly split three times (B).
The cylinder nominal transverse strength of concrete is defined as:
where
3 Results and discussion
3.1 Comparison of forces
In the cube splitting tests, an evenly distributed compression load was applied to the middle of the upper and lower surfaces of the concrete specimen (Figure 8A). The compression load caused compressive stress in the axial surface of the concrete specimen (same plane as the load) and uniform tensile stress in most of the middle area (Figure 8B). The fracture surface exhibited failure under tensile stress (Figure 8C). The cylinder transverse splitting tests differed in that the cylinder specimen was uniformly loaded on the cross-sectional curve along the circumference (Figure 9A). The load direction was the plumb direction, the same as in the cube splitting tests. The results from the ANSYS stress analysis show that the concrete specimen cross-section was under a state of tension and compression complex stress (Figure 9B), whereas most of the central area was under a state of tension stress, which influences the splitting failure. The fracture surface performance is consistent with the stress analysis results (Figure 9C), which indicates that the cylinder transverse splitting test can be used to effectively measure the concrete splitting strength.
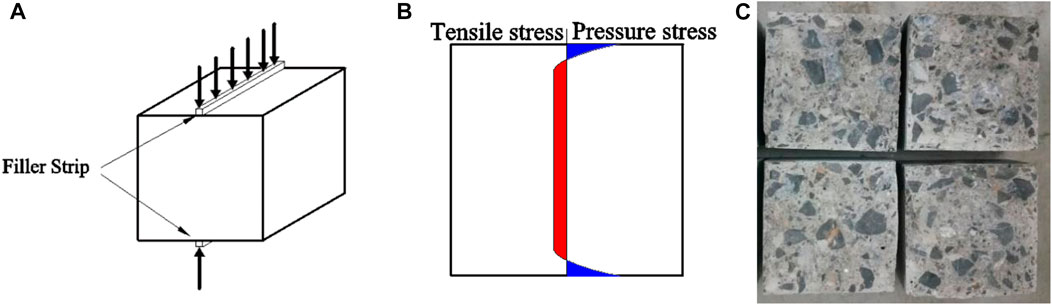
FIGURE 8. In the cube splitting tests, an evenly distributed compression load was applied to the middle of the upper and lower surfaces of the concrete specimen (A). The compression load caused compressive stress in the axial surface of the concrete specimen and uniform tensile stress in most of the middle area (B). The fracture surface exhibited failure under tensile stress (C).
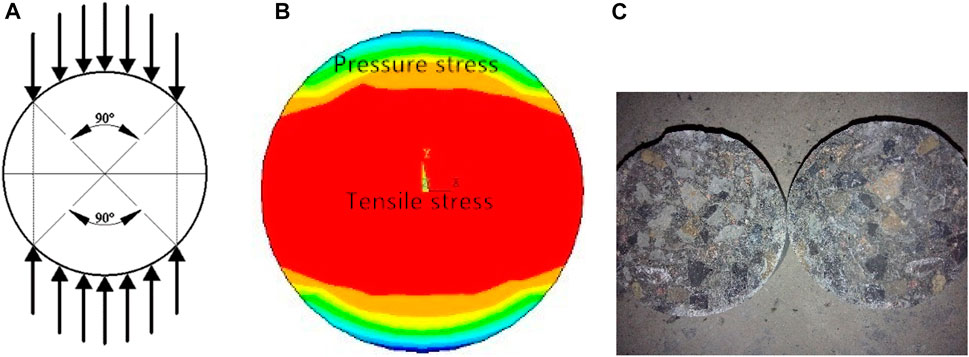
FIGURE 9. In the cylinder transverse splitting tests, the cylinder specimen was uniformly loaded on the cross-sectional curve along the circumference (A). The concrete specimen cross-section was under a state of tension and compression complex stress (B), whereas most of the central area was under a state of tension stress, which influences the splitting failure. The fracture surface performance is consistent with the stress analysis results (C).
3.2 Comparison of standard deviations
Three batches of cubic and cylindrical specimens of NC were made at different times (in 2011, 2014, and 2017) for the cube and cylinder transverse splitting tests. The standard deviation indicates the degree of data dispersion; smaller standard deviations reflect more concentrated data distributions. The relative precision of the test data can thus be explained by comparing the standard deviations obtained during the cylinder transverse splitting versus the cube splitting tensile failure loads. Each group of the second test (in 2014) consisted of three cubic and two cylindrical specimens and thus involved three cubic splitting tensile failure tests and six cylinder transverse splitting failure tests, as shown in Table 6. The standard deviation of the cylinder transverse splitting test results are generally smaller than those obtained from the cube splitting test results. The precision of the concrete tensile strength values obtained by the cylinder transverse splitting test is slightly higher than that of the cube splitting tests.
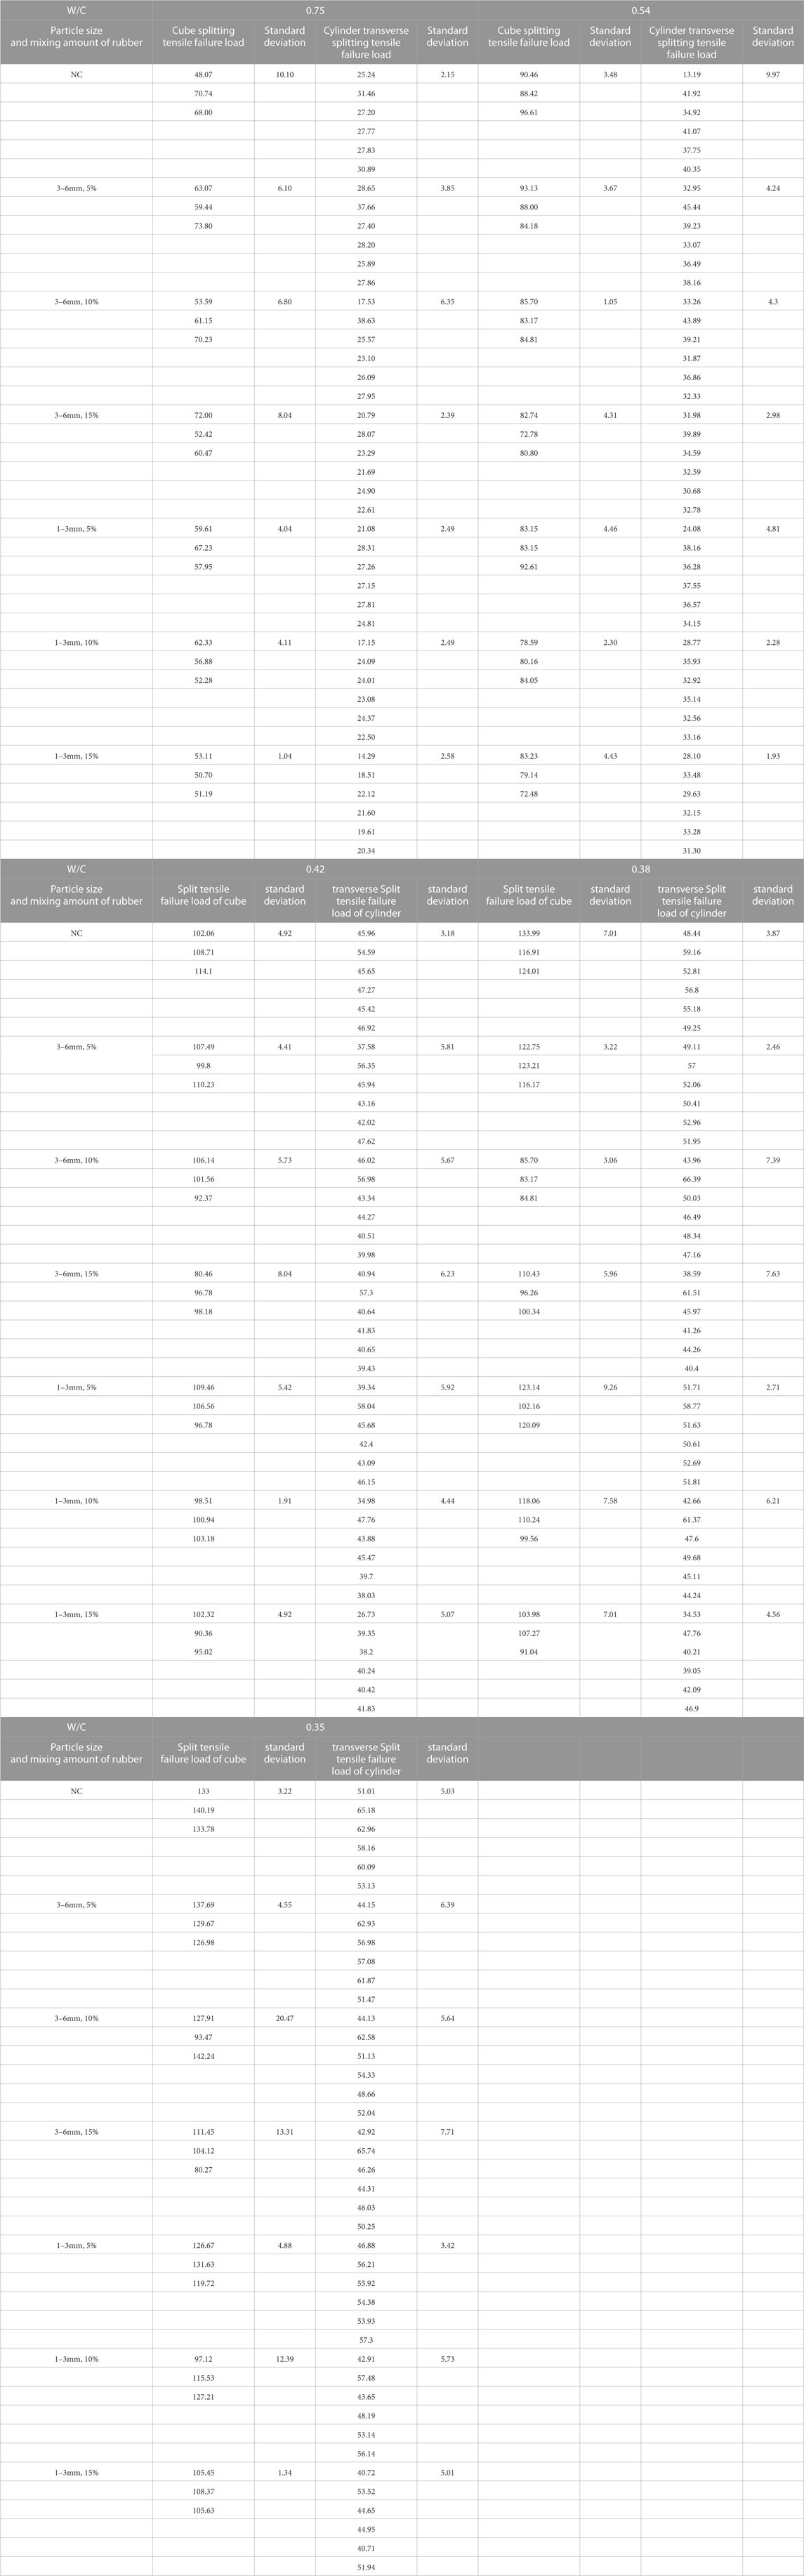
TABLE 6. Test result.
3.3 NC splitting strength
The cube splitting strength and cylinder nominal transverse splitting strength of the NC show similar negative dependencies with W/C (Figure 10), which is in agreement with the W/C law of Abrams. The cylinder nominal transverse splitting strength is found to be higher than the cube splitting strength for concrete with the same W/C. These results are in agreement with previous studies (Malhotra, 1970; Hang and Fan, 2011) mainly because of the size effect.
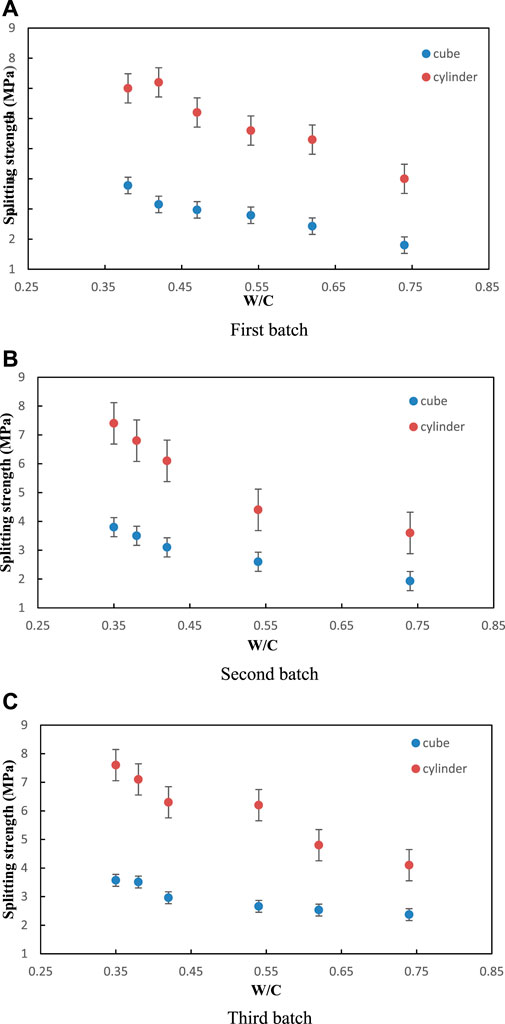
FIGURE 10. Relationship between splitting strength (NC) and W/C: First batch (A); Second batch (B); Third batch (C).
3.4 CRC splitting strength
Similar to NC, the cube splitting strength and cylinder nominal transverse splitting strength of CRC decrease with increasing W/C (Figure 11) and show the same trend regardless of the rubber particle size (3–6 or 1–3 mm) or rubber particle content (5%, 10%, or 15%). This regularity shows no correlation with rubber particle size and content. The samples with 1% and 3% rubber particle contents show the same behavior and are not discussed further.
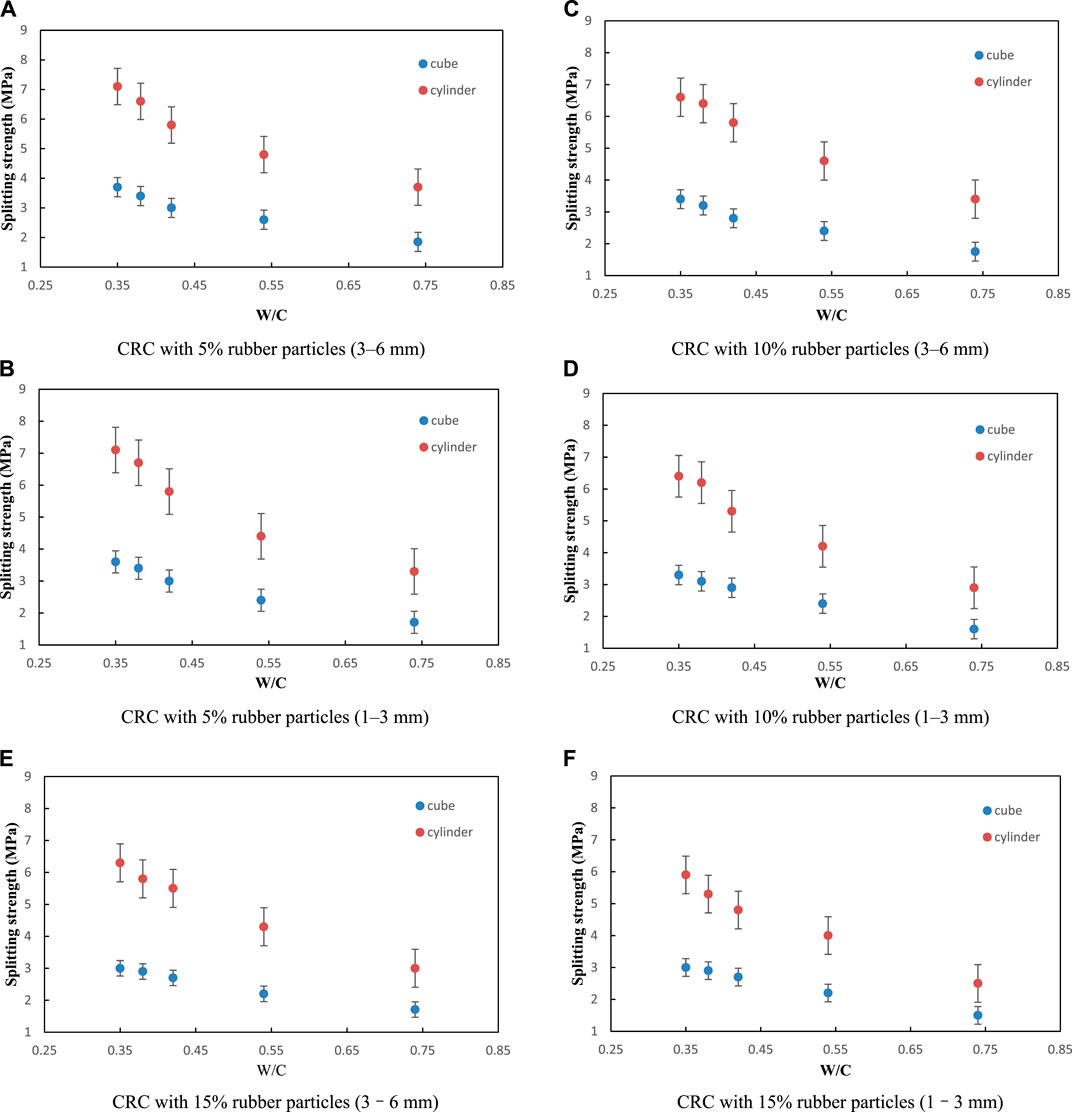
FIGURE 11. Relationship between splitting strength (CRC) and W/C: CRC with 5% rubber particles (3–6 mm) (A); CRC with 5% rubber particles (1–3 mm) (B); CRC with 10% rubber particles (3–6 mm) (C); CRC with 10% rubber particles (1–3 mm) (D); CRC with 15% rubber particles (3–6 mm) (E); CRC with 15% rubber particles (1–3 mm) (F).
As shown in Figure 12, regardless of rubber particle size (3–6 or 1–3 mm) and W/C (0.35, 0.42, or 0.74), the cube splitting strength and cylinder nominal transverse splitting strength both consistently decrease with increasing rubber particle content. This is mainly because the rubber particle strength is far less than the sand strength, and the bond strength between the rubber and cement is far less than the bond strength between the sand and cement. The samples with 0.38 and 0.54 W/C show the same behavior and are not discussed here. The influence of rubber particle content on concrete strength is similar to previous results (Eldin and Senouci, 1993; Topcu, 1995; Toutanji, 1996; Ali et al., 2000). For the same rubber particle content, the cylinder nominal transverse splitting strength is higher than the cube splitting strength.
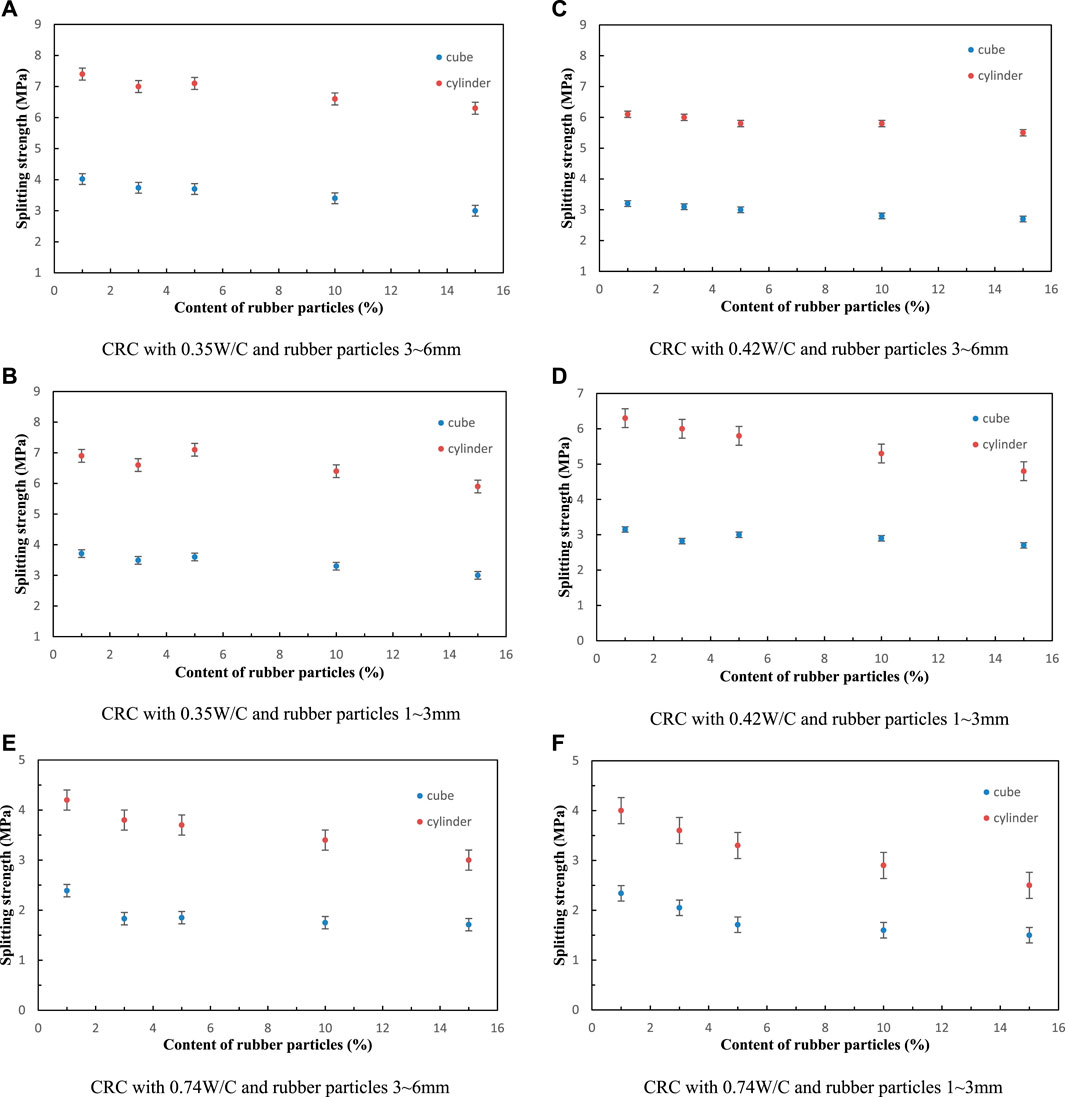
FIGURE 12. Relationship between splitting strength (CRC) and content of rubber particles: CRC with 0.35W/C and rubber particles 3∼6 mm (A); CRC with 0.35W/C and rubber particles 1∼3 mm (B); CRC with 0.42W/C and rubber particles 3∼6 mm (C); CRC with 0.42W/C and rubber particles 1∼3 mm (D); CRC with 0.74W/C and rubber particles 3∼6 mm (E); CRC with 0.74W/C and rubber particles 1∼3 mm (F).
On the basis of the above analysis, the cylinder nominal transverse splitting strength can be used to represent the concrete tensile strength, similar to the cube splitting strength.
3.5 Relationship between cube and cylinder nominal transverse splitting strength
The cube splitting strength is given in SL352-2006. (2006) as Eq. 1. The concrete splitting surface has a similar stress distribution under the condition of cylinder transverse and cube splitting (Figure 8B; Figure 9B). The cylinder transverse splitting strength is assumed to follow a formula in the same form as the cube splitting strength, namely:
where
where
For
The linear fitting results (that pass through the origin) of Eq. 6 are shown in Figure 13. The
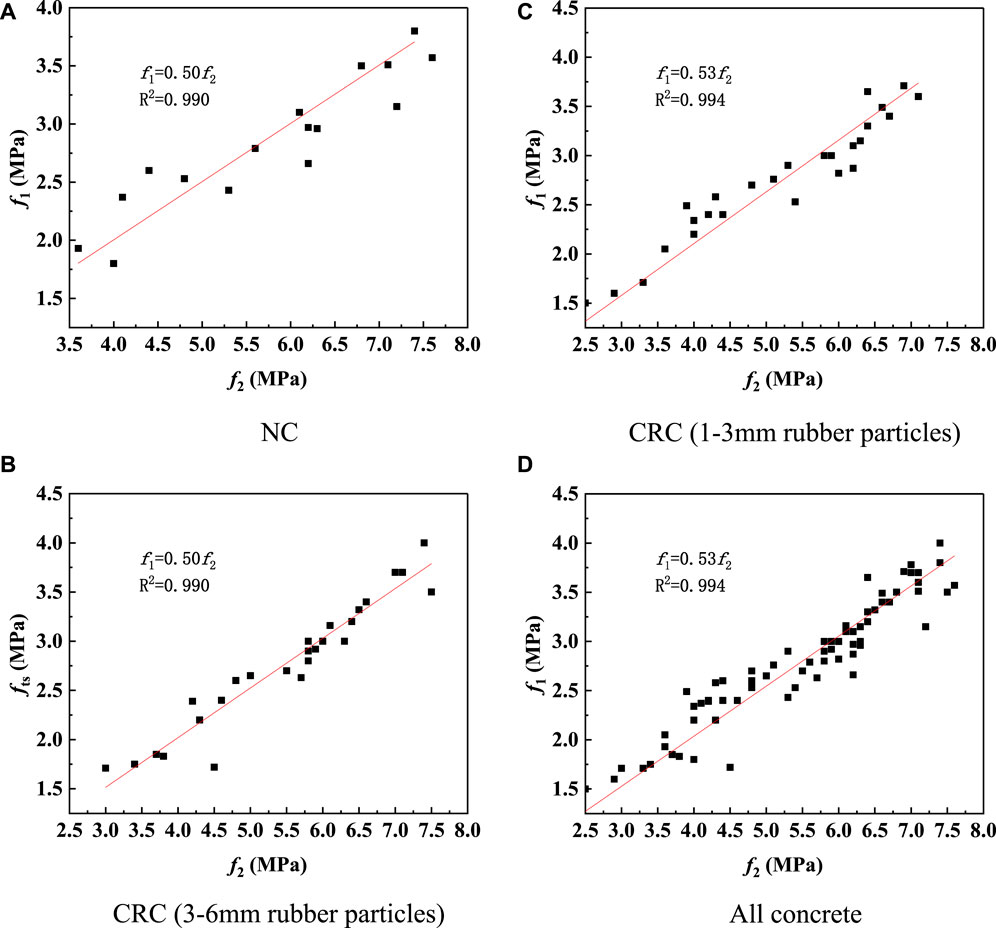
FIGURE 13. Linear fitting of Ep. (6): NC (A); CRC (3–6 mm rubber particles) (B); CRC (1–3 mm rubber particles) (C); All concrete (D).
An insertion of the value of
The test value is compared to the calculated value.
The calculated
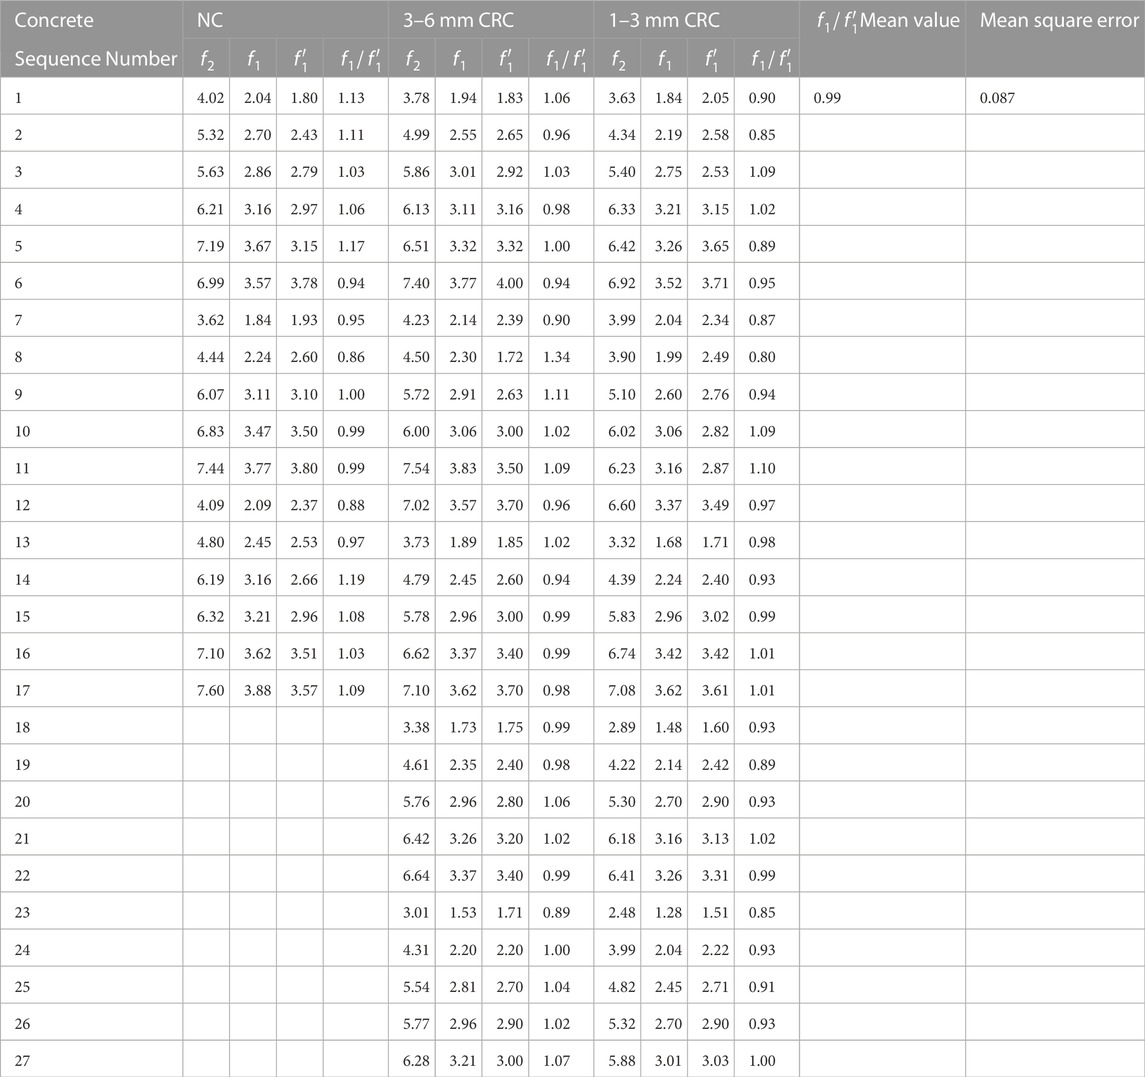
TABLE 7. Calculated and test splitting strengths of concrete.
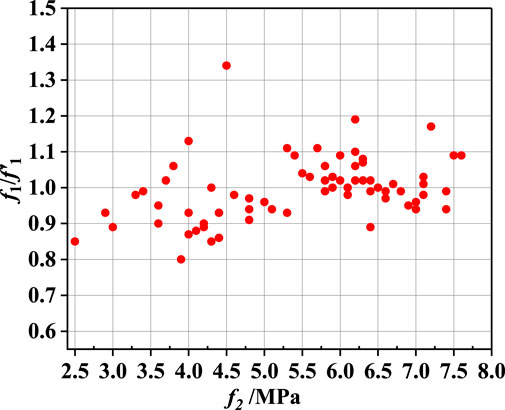
FIGURE 14. Distribution of ratio of calculated and tested cube splitting strength.
4 Conclusion
The cube and cylinder nominal transverse splitting strengths of NC and CRC were determined and compared. On the basis of the results, the following conclusions can be drawn.
• The stress distribution in the tensile direction of concrete is obtained by simulating the cylinder transverse splitting test using finite element analysis software. The tensile stress distribution area of the splitting tensile failure surface is large, which is similar to the stress distribution of the cube splitting tensile failure surface. This indicates that failure during concrete cylinder transverse splitting tests is mainly determined by the tensile stress.
• The standard deviation of each group of concrete cylinder transverse splitting failure load tests is slightly lower than that obtained from the cube splitting failure load tests. This indicates a slightly higher precision of the cylinder tensile strength detected by the cylinder transverse splitting tests than that obtained by the cube splitting tensile tests.
• The cube and cylinder nominal transverse splitting strengths of NC and CRC regularly decrease with increasing water-cement ratio and rubber content, which indicates a certain internal relationship between the cube and cylinder nominal transverse splitting strengths.
• The relationship between the cube (150 × 150 × 150 mm) and cylinder (∅100 mm) nominal transverse splitting strength is established,
Data availability statement
The original contributions presented in the study are included in the article/Supplementary material, further inquiries can be directed to the corresponding author.
Author contributions
QC and SH performed material preparation, data collection, and modeling. FW performed result analysis and discussion. FW edited the manuscript. LF reviewed the manuscript. All authors contributed to the article and approved the submitted version.
Funding
The research was supported by The National Key Research and Development Program of China (2022YFC3202300), Major Science and Technology Special Projects in Henan Province (201300311400), General Science Foundation Program of Henan Province (222300420491).
Conflict of interest
The authors declare that the research was conducted in the absence of any commercial or financial relationships that could be construed as a potential conflict of interest.
Publisher’s note
All claims expressed in this article are solely those of the authors and do not necessarily represent those of their affiliated organizations, or those of the publisher, the editors and the reviewers. Any product that may be evaluated in this article, or claim that may be made by its manufacturer, is not guaranteed or endorsed by the publisher.
Supplementary material
The Supplementary Material for this article can be found online at: https://www.frontiersin.org/articles/10.3389/fmats.2023.1216747/full#supplementary-material
References
Adeboje, A. O., Kupolati, W. K., Sadiku, E. R., and Ndambuki, J. M. (2020). Characterization of modified crumb rubber concrete. Int. J. Sustain. Dev. Plan.15 (3), 377–383. doi:10.18280/ijsdp.150315
Ali, N. A., Amos, A. D., and Roberts, M. (2000). Use of ground rubber tires in Portland cement concrete,” in Proc. Int. Conf. Concrete (UK: University of Dundee), 379–390.
Benazzouk, A., Mezreb, K., Doyen, G., Goullieux, A., and Quéneudec, M. (2003). Effect of rubber aggregates on the physico-mechanical behaviour of cement–rubber composites-influence of the alveolar texture of rubber aggregates. Cem. Concr. Comp.25, 711–720. doi:10.1016/s0958-9465(02)00067-7
Bhanja, S., and Sengupta, B. (2005). Influence of silica fume on the tensile strength of concrete. Cem. Concr. Res.35, 743–747. doi:10.1016/j.cemconres.2004.05.024
Eldin, N. N., and Senouci, A. B. (1993). Rubber-tire particles as concrete aggregate. J. Mater Civ. Eng.5, 478–496. doi:10.1061/(asce)0899-1561(1993)5:4(478)
Elsayed, M., Tayeh, B. A., Taha, Y., and El-Azim, A. A. (2022). Experimental investigation on the behaviour of crumb rubber concrete columns exposed to chloride–sulphate attack. Structures46, 246–264. doi:10.1016/j.istruc.2022.10.077
Feng, W. H., Chen, Z., Tang, Y. C., Liu, F., Yang, F., Yang, Y., et al. (2022). Fracture characteristics of sustainable crumb rubber concrete under a wide range of loading rates[J]. Constr. Build. Mater.359, 129474. doi:10.1016/j.conbuildmat.2022.129474
GB/T50081-2002 (2002). Standard for test method of mechanical properties on ordinaty concrete. China: Ministry of Construction of the People's Republic of China.
Ge, W., Jiao, Y., Wu, M., Li, Z., Wang, T., Li, W., et al. (2022). Estimating loss of life caused by dam breaches based on the simulation of floods routing and evacuation potential of population at risk. J. Hydrology612, 128059. doi:10.1016/j.jhydrol.2022.128059
Ge, W., Qin, Y., Li, Z., Zhang, H., Gao, W., Guo, X., et al. (2020). An innovative methodology for establishing societal life risk criteria for dams: A case study to reservoir dam failure events in China. Int. J. Disaster Risk Reduct.49, 101663. doi:10.1016/j.ijdrr.2020.101663
Haldar, P., and Karmakar, S. (2021). An experimental study on the fatigue properties of Alccofine-based crumb rubber concrete. Proc. Institution Civ. Eng. Eng. Sustain.174 (5), 235–250. doi:10.1680/jensu.20.00080
Han, T. H., Ji, J. H., Dong, Z. Q., Zhu, H., and Wu, G. (2023). Compression behavior of concrete columns strengthened by a hybrid BFRP/HDPE tube coupled with a crumb rubber concrete cladding layer[J]. Constr. Build. Mater.364, 129969. doi:10.1016/j.conbuildmat.2022.129969
Hang, J. F., and Fan, K. (2011). Abrasion resistance of rubberized concrete. J. Tianjin Univ.44, 727–731. doi:10.3969/j.issn.0493-2137.2011.08.012
Hernandez, Q. F., Barluenga, G., and Bollati, M. (2002). Static and dynamic behaviour of recycled tyre rubbe-filled concrete. Cem. Concr. Res.32, 1587–1596. doi:10.1016/S0008-8846(02)00833-5
JGJ/T384-2016 (2016). Technical specification for testing concrete strength with drilled core method. China: Wiley.
Jia, F. (1997). Experimental research on the test of the compressive strength of the heated concrete with small diameter cores of 45mm and 70mm by transverse cutting method. J. Northwest Ins. Archit. Eng.1, 8–11. doi:10.13204/j.gyjz199606012
Kanos, A., Giannakopoulis, A. E., and Perdikaria, P. C. (2006). “Size effect on concrete splitting tensile strength and modulus of elasticity,” in Measuring, monitoring and modeling concrete properties (Netherlands: Springer).
Khan, I., Shahzada, K., Bibi, T., Ahmed, A., and Ullah, H. (2021). Seismic performance evaluation of crumb rubber concrete frame structure using shake table test. J. Struct.30, 41–49. doi:10.1016/j.istruc.2021.01.003
Li, Z., Zhang, Y., Wang, J., Ge, W., Li, W., Song, H., et al. (2021). Impact evaluation of geomorphic changes caused by extreme floods on inundation area considering geomorphic variations and land use types. Sci. Total Environ.754, 142424. doi:10.1016/j.scitotenv.2020.142424
Lin, Q., Liu, Z. Q., Sun, J. L., and Yu, L. (2023). Comprehensive modification of emulsified asphalt on improving mechanical properties of crumb rubber concrete[J]. Constr. Build. Mater.369, 130555. doi:10.1016/j.conbuildmat.2023.130555
Lu, Y. B., and Li, Q. M. (2011). About the dynamic uniaxial tensile strength of concrete-like materials. Int. J. Impact Eng.38, 171–180. doi:10.1016/j.ijimpeng.2010.10.028
Malhotra, V. M. (1970). Effect of specimen size on tensile strength of concrete. ACI J.67, 1. doi:10.14359/7292
Mindess, S., Young, J. F., and Darwin, D. (2002). Concrete. 2nd Ed. Upper Saddle River (USA): Pearson Education, Inc.
Nilsson, S. (1961). The tensile strength of concrete determined by splitting tests on cubes. RILEM Bulletin11, 63–67.
Olesen, J. F., Ostergaard, L., and Stang, H. (2006). Nonlinear fracture mechanics and plasticity of the split cylinder test. Mater Struct.39, 421–432. doi:10.1617/s11527-005-9018-3
Paine, K. A., and Dhir, R. K. (2002). Kopasakis. Use of crumb rubber to achieve freeze thaw resisting concrete,” in Proceedings of the international conference concrete for extreme conditions (ICE) (London, United Kingdom: Thomas Telford Limited), 485–498.
Raphael, J. M. (1984). Tensile strength of concrete. J. Am. Concr. Institution81, 158–165. doi:10.14359/10653
Rashid, M. A., Mansur, M. A., and Paramasivam, P . (2002). Correlations between mechanical properties of high-strength concrete. J. Mater Civ. Eng.14 (3), 230–238. doi:10.1061/(asce)0899-1561(2002)14:3(230)
Rocco, C., Guinea, G. V., Planas, J., and Elices, M. (2000). Review of the splitting-test standards from a fracture mechanics point of view. Cem. Concr. Res.31, 73–82. doi:10.1016/s0008-8846(00)00425-7
Sarfarazi, V., Haeri, H., Ebneabbasi, P., Shemirani, A. B., and Hedayat, A. (2018). Determination of tensile strength of concrete using a novel apparatus. Constr. Build. Mater166, 817–832. doi:10.1016/j.conbuildmat.2018.01.157
Savas, B. Z., Ahmad, S., and Fedroff, D. (1997). Freeze-thaw durability of concrete with ground waste tire rubber. Transp. Res. Rec.1574, 80–88. doi:10.3141/1574-11
Segre, N., and Jocke, L. (2000). Use of tire rubber particles as addition to cement paste. Cem. Concr. Res.30, 1421–1425. doi:10.1016/s0008-8846(00)00373-2
Segre, N., Monteiro, P. J. M., and Sposito, G . (2002). Surface characterization of recycled tire rubber to be used in cement paste matrix. Colloid Interfac Sci248, 521–523. doi:10.1006/jcis.2002.8217
Sun, J. J., Chen, X., Fu, Z. W., and Lacidogna, G. (2021). Damage pattern recognition and crack propagation prediction for crumb rubber concrete based on acoustic emission techniques. Appl. Sci.11 (23), 11476. doi:10.3390/app112311476
Swaddiwudhipong, S., Lu, H. R., and Wee, T. H. (2003). Direct tension test and tensile strain capacity of concrete at early age. Cem. Concr. Res.33 (12), 2077–2084. doi:10.1016/s0008-8846(03)00231-x
Tang, T. (1994). Effects of load-distribute width on split tension of unnotched and notched cylindrical specimens. J. Test. Eval.22, 401–409. doi:10.1520/JTE12656J
Topcu, I. B., and Avcular, N. (1997). Collision behaviours of rubberized concrete. Cem. Concr. Res.27, 1893–1898. doi:10.1016/s0008-8846(97)00204-4
Topcu, I. B. (1995). The properties of rubberized concretes. Cem. Concr. Res.25, 304–310. doi:10.1016/0008-8846(95)00014-3
Toutanji, H. A. (1996). The use of rubber tire particles in concrete to replace mineral aggregates. Cem. Concr. Comp.18, 135–139. doi:10.1016/0958-9465(95)00010-0
Wang, T., Li, Z., Ge, W., Zhang, H., Zhang, Y., Sun, H., et al. (2023). Risk consequence assessment of dam breach in cascade reservoirs considering risk transmission and superposition. Energy265, 126315. doi:10.1016/j.energy.2022.126315
Wang, T., Li, Z., Ge, W., Zhang, Y., Jiao, Y., Sun, H., et al. (2022). Calculation of dam risk probability of cascade reservoirs considering risk transmission and superposition. J. Hydrology609, 127768. doi:10.1016/j.jhydrol.2022.127768
Wu, M., Wu, Z., Ge, W., Wang, H., Shen, Y., and Jiang, M. (2021). Identification of sensitivity indicators of urban rainstorm flood disasters: A case study in China. J. Hydrology599, 126393. doi:10.1016/j.jhydrol.2021.126393
Wu, S., Chen, X., and Zhou, J. (2012). Tensile strength of concrete under static and intermediate strain rates: Correlated results from different testing methods. Nucl. Eng. Des.250, 173–183. doi:10.1016/j.nucengdes.2012.05.004
Xiao, F., Yu, J., and Lu, Z. (2011). Experimental study on the test of multiple transverse splitting method of concrete core sample. Low. Temp. Build. Technol.3, 40–42.
Xu, J., Niu, X. L., Yao, Z. Y., Wang, M., Wang, L., Li, J., et al. (2021). Rapid identification of plasmid replicon type and coexisting plasmid-borne antimicrobial resistance genes by S1-pulsed-field gel electrophoresis-droplet digital polymerase chain reaction. Constr. Build. Mater.18, 298–305. doi:10.1089/fpd.2020.2865
Xu, X. Q., Zhang, Z. G., Hu, Y. G., and Wang, X. (2020). Bearing strength of crumb rubber concrete under partial area loading. J. Mater.13 (11), 2446. doi:10.3390/ma13112446
Yang, Z. M., and Li, N. P. (2002). Application of small diameter core sample to the compressive strength identification of concrete structure. J Xi’an Univ Archit Tech34, 407–409. doi:10.3969/j.issn.1006-7930.2002.04.026
Youssf, O., Swilam, A., and Tahwia, A. M. (2023). Performance of crumb rubber concrete made with high contents of heat pre-treated rubber and magnetized water[J]. J. Mater. Res. Technol.23, 2160–2176. doi:10.1016/j.jmrt.2023.01.146
Yu, J., Jiang, J., and Lu, Z. (2010). One suggestion on the coredrilling method of concrete testing:several times oftransverse cutting. Sichuan Buiding Sci.36 (1), 84–87.
Yuan, Q., Du, W. B., Li, Z. K., and Li, S. (2006). Research on the test of the tensile strength of concrete cylinder by transverse cutting method. Ind. Constr.36,83–87. doi:10.13204/j.gyjz200606023
Yuan, Q., Li, L. Q., and Lu, Y. (2016). Extension and application of transverse cutting method for tensile strength measurement of concrete. J. Hydro Eng.1, 125–135. doi:10.11660/slfdxb.20160116
Zhang, H., Ge, W., Zhang, Y., Li, Z., Li, W., Zhu, J., et al. (2023). Risk management decision of reservoir dams based on the improved life quality index. Water Resour. Manag.37, 1223–1239. doi:10.1007/s11269-023-03426-y
Zhou, H., Che, Y., and Chen, G. (2008). Size effect on tensile splitting strength of concrete cubes and cylinders. Concrete8, 13–16. doi:10.3969/j.issn.1002-3550.2010.08.005
Keywords: cylinder transverse splitting method, nominal transverse splitting strength, cube splitting strength, crumb rubber concrete, rubber content
Citation: Chai Q, Huang S, Wan F, Wu F and Feng L (2023) A new experimental method to measure and calculate the tensile strength of concrete. Front. Mater. 10:1216747. doi: 10.3389/fmats.2023.1216747
Received: 04 May 2023; Accepted: 28 June 2023;
Published: 20 July 2023.
Edited by:
Wei Ge, Zhengzhou University, ChinaReviewed by:
Wei Dongle, Dalian University of Technology, ChinaZhang Lei, Yellow River Institute of Hydraulic Research, China
Copyright © 2023 Chai, Huang, Wan, Wu and Feng. This is an open-access article distributed under the terms of the Creative Commons Attribution License (CC BY). The use, distribution or reproduction in other forums is permitted, provided the original author(s) and the copyright owner(s) are credited and that the original publication in this journal is cited, in accordance with accepted academic practice. No use, distribution or reproduction is permitted which does not comply with these terms.
*Correspondence: Fang Wan, d2FueGYxMDIzQDE2My5jb20=