 Alexander Schmid1*†
 Angelo Pasquale2,3*†
 Christian Ellersdorfer1
 Victor Champaney2,3Marco Raffler1Simon Guévelou4Stephan Kizio5Mustapha Ziane4Florian Feist1‡
 Francisco Chinesta2,3,4‡
- 1Vehicle Safety Institute, Graz University of Technology, Graz, Austria
- 2PIMM Lab, ENSAM Institute of Technology, Paris, France
- 3ESI Group Chair, ENSAM Institute of Technology, Paris, France
- 4ESI Group, Paris, France
- 5Audi, Neckarsulm, Germany
Despite the existence of computationally efficient tools, the effort for parametric investigations is currently high in industry. In this paper, within the context of Li-Ion batteries, an efficient meta-modelling approach based on the Proper Generalized Decomposition (PGD) is considered. From a suitable design of experiments, a parametric model is trained and then exploited to predict, in real time, the system response to a specific parameter combination. In particular, two different methods are considered, the sparse PGD (sPGD) and the anchored-ANOVA based one (ANOVA-PGD). As a use case for the method the dynamic indentation test of a commercial lithium-ion pouch cell with a cylindrical impactor is selected. The cell model considers a homogenised macroscopic structure suitably calibrated for explicit finite element simulations. Four parameters concerning the impactor are varied, both non-geometric (mass and initial velocity) and geometric (diameter and orientation). The study focuses on multi-dimensional outputs, such as curves and contour plots. Inspired by earlier studies, the sPGD is used to predict the force-displacement curves. As a further development, the impactor kinetic energy curve and the displacement contours are both predicted using its recently developed variant ANOVA-PGD. Moreover, a novel curve alignment technique based on the Gappy Proper Orthogonal Decomposition (Gappy-POD) is suggested here. The meta-model is compared to the results of an FE simulation and the resulting deviations are then discussed.
1 Motivation
Electric vehicles involved in crashes can pose hazards to all persons involved in the accident. The installed energy storage devices (mostly lithium-ion cells) mainly cause these. The hazards can be electrical, thermal and chemical in character (Geisbauer et al., 2021). The so-called thermal runaway can be caused by mechanical, thermal or electrical abuse (Essl et al., 2020). Both, experiments (Cannarella et al., 2014) and simulations (Wierzbicki and Sahraei, 2013) are used to assess the mechanical behaviour of these cells and their components.
In addition to considerations of purely mechanical behaviour, there are also mutiphysical models that depict the coupled influence of mechanical and thermal loading (Li et al., 2020; Yue et al., 2022) or mechanical and electrochemical behaviour (Zhou et al., 2013; Zhou, 2015).
There are different approaches for modelling the mechanical behaviour of lithium-ion cells, which can be roughly divided into three categories. Macroscopic models neglect the heterogeneous layer structure consisting of anodes, cathodes and separators. Here, the cell is modelled as a homogeneous structure. This is usually done for efficiency reasons. However, a large number of cell experiments are required for characterisation. (Sahraei et al., 2012a; Raffler et al., 2017; Beaumont et al., 2021).
In so-called RVE models, a unit cell of the cell structure is modelled heterogeneously in detail. The entire mechanical behaviour is determined with the help of homogenisation theories. The results are then used to calibrate the material models of homogeneous battery models. Thus, only a few cell tests are required for the characterisation of these models, as mainly component properties are used via the unit cell (Sahraei et al., 2016; AriefBudiman et al., 2022).
Only with detailed models, the behaviour of the individual components (anodes, cathodes and separators) can also be analysed. In these approaches, the structure of the cell is modelled heterogeneously. However, the representation of the individual component layers increases not only the level of detail but also the computational effort. This can be justified by the large number of small elements used for the discretisation (Breitfuss et al., 2013; Gilaki and Avdeev, 2016; Wang et al., 2019).
There is also no standardised procedure for the experiments. In the case of cell tests alone, there are a large number of experimental set-ups in the literature. These usually differ in the dominant load type that is attempted to be applied, such as in-plane compression, bending or penetration (Liu et al., 2020).
These mechanical loads are applied at different rates to determine the quasi-static (Sahraei et al., 2012b) and dynamic behaviour (Xu et al., 2015; Kisters et al., 2022) of the cell. Indentation tests differ w.r.t. shape and size of the impactor. Dixon et al. investigated, among other parameters, the influence of size in hemispherical impactors with a diameter-range of 12.6–44 mm (Dixon et al., 2018). Raffler et al. used a cylindrical impactor with a diameter of 30 mm with full overlap to investigate the effect of loading speed and impactor orientation on mechanical behaviour and intrusion to internal short circuit (Raffler et al., 2022).
Many other factors influence the behaviour of lithium-ion cells under mechanical load: strength, ductility and anisotropy of the individual plies, interlaminar friction, liquid electrolyte content, to name but a few. On the other hand, many cell-models require calibration, e.g., the models described by Schaufelberger et al. where interlaminar shear stiffness (Schaufelberger et al., 2021) is iteratively approximated. To analyse the influence of the individual parameters and their combination, a numerical parametric study can be carried. A certain number of simulations covering the parameter space is performed. The Design of Experiments (DoE) defines the parameter combinations. Such results can be combined with Machine Learning techniques to build a parametric model.
Comprehensive DoEs with conventional FEM, require huge computational efforts, even when using efficient macroscopic models. This is exactly the problem the authors tried to solve. In this work, a way to generate a parametric model with a limited number of training simulations is proposed. This model is able to reproduce the result of a certain parameter combination in real time. This concerns not only the contour plot but also the time history curves that are used for the evaluation of the simulation result.
First, the structure of the lithium-ion cell used in this work is discussed. A macroscopic cell model of this cell was created for explicit finite element simulations. The main focus was on the representation of the transverse compression behaviour under quasi-static and dynamic loads. The simulation of a dynamic indentation test with a cylindrical impactor was chosen as an application for the creation of a meta-model.
Since this is a model for assessing the mechanical behaviour of the lithium ion cell, the force-displacement curve was predicted. This was chosen because it is an essential quantity for the evaluation of experiments (Zhu et al., 2016; Ratner et al., 2020) as well as for the calibration (Beaumont et al., 2021) and validation (Sahraei et al., 2016; Kermani et al., 2021) of mechanical models. Since it is a dynamic load case, the kinetic energy over time is also predicted. Assuming constant mass over time, this quantity is representative of the degree of dynamic loading equivalent to the loading velocity, which also has a significant influence on the behaviour of the cell (Kisters et al., 2017; Kisters et al., 2022). The deformation pattern is also used to evaluate the dynamic behaviour, so this is also predicted in the form of the contour plot (Qin et al., 2023).
Afterwards the Proper Generalized Decomposition (PGD) methods, which are used in this work, are described. Within the context of parametric models, many works see the application of the sPGD method. Literature on sPGD methods mostly concerns scalar quantities and contours, but recent works have shown its effectiveness also for curves metamodeling (Champaney et al., 2022a), in particular when combined with curves dilatation and alignment techniques. For the prediction of force-displacement curves, benefitting from these past studies outcomes, we also employ the sPGD. However, to go a step further, the prediction of both the impactor kinetic energy curve and the contours are performed using its newly proposed variant ANOVA-PGD (el FallakiIdrissi et al., 2022). Subsequently, the varied parameters, the resulting design of experiments and the data preparation are presented.
2 Methods
2.1 Cell under study
In this work, a macroscopic model of a commercial lithium-ion cell in pouch format is used. The cell weighs around 0.9 kg and has dimensions of 260 × 216 × 7.8 mm (Figure 1); Kovachev et al. (2019) carried out a detailed analysis of the cell. The structure essentially consists of a stack of 42 separators, 21 cathodes and 22 anodes, which is enclosed, in the pouch. The anodes are copper foils coated on both sides with graphite. The core of the cathodes is made of aluminium and the active material on both sides is LiNiMnCoO2 (NMC). The porous separators, positioned between the electrodes, consist mainly of polypropylene. Due to the porous structure, the separator is permeated with the electrolyte, which enables the flow of ions. The pouch, the anode, the cathode and the separator have a thickness of 190 μm, 140 μm, 170 µm and 20 μm, respectively.
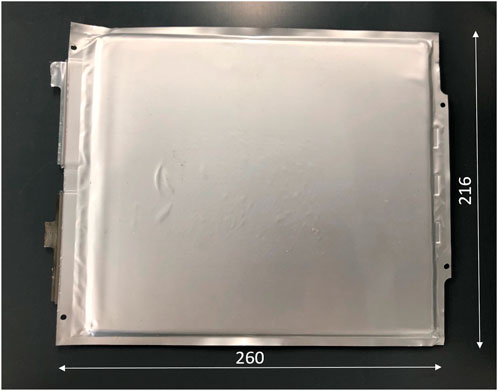
FIGURE 1. Cell under study.
This cell was modelled in the software LS-DYNA version 9.3.1. The basic concept is shown in Figure 2A. It is based on the model described by Raffler et al. (2017) where beam elements also play a central role (Raffler et al., 2017). However, instead of a cylindrical cell, a cell in pouch format is modelled here. The basic concept can be divided into four essential components, which are highlighted in Figure 2A. The model was calibrated to fit the experimental data described by Raffler et al. (2022); Schmid et al. (2022). The macroscopic model is shown in Figure 2B.
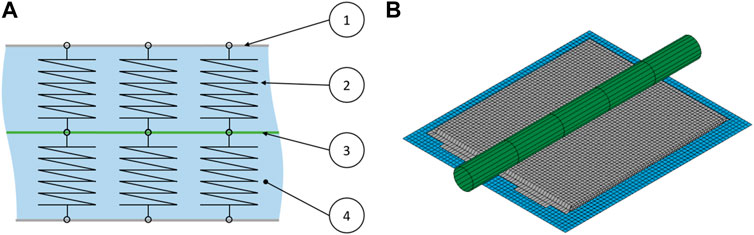
FIGURE 2. (A) Basic concept of the cell model and its essential components: ① Outer shell layers ② Beam elements ③ Middle shell layer ④ Volume elements (B) Macroscopic cell model in cylindrical indentation test configuration.
The outer layers ① represent the pouch shell. This is modelled by shell elements. An isotropic elastic-plastic material model (*MAT_PLASTICITY_COMPRESSION_TENSION) is used for this. The required parameters can be determined by tensile tests of samples of the pouch. As with the other components, samples of 15 × 5 mm are tested at 20 and 600 mm/min. The samples are taken in different directions to assess the anisotropy in addition to the strain-rate influence. All samples were saturated with substitute electrolyte to test them as realistic as possible. For statistical validation, each test configuration was repeated 5 times. In order to increase flexibility during calibration, a non-symmetrical material behaviour is used (different tensile and compressive behaviour). Thus, for example, the buckling of the shell under compressive load can also be represented in a simple way. The parameters for the compression behaviour are calibrated by a quasi-static three-point bending test of the cell (Figure 3A). The velocity of the impactor is 1 mm/s, as in all quasi-static cell tests.
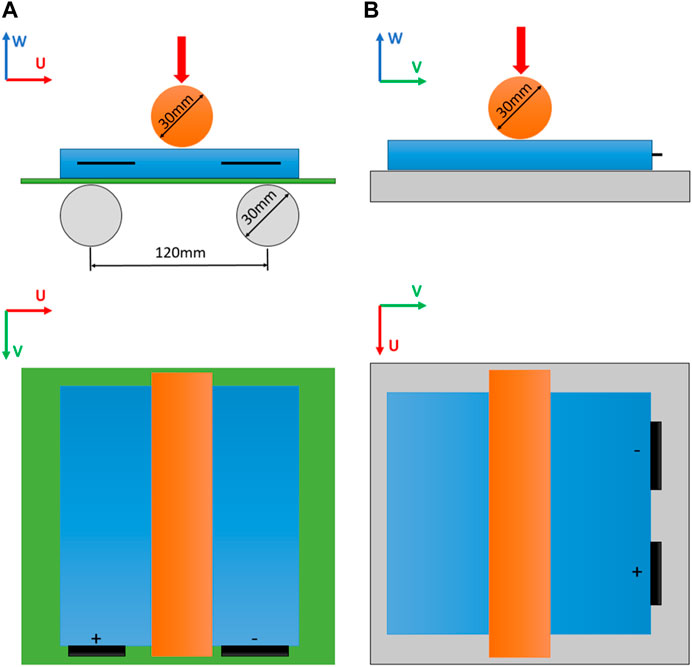
FIGURE 3. Types of cell tests used for calibration: (A) Three-point bending test (B) Cylindrical indentation test.
The quasi-static behaviour in thickness direction is reflected by beam elements ②. To avoid decreasing time step (explicit simulation) upon transverse compression, a discrete element formulation is used. The required load curves for the non-linear behaviour are calibrated by a quasi-static indentation test with cylindrical impactor (Figure 3B).
The middle layer, employing shell elements, ③ replicates the in-plane behaviour of the jelly stack. The same isotropic elastic-plastic material model was used for this as for the outer layers. For the parameterisation of the tensile behaviour, the results of the tensile tests of the individual components are used. According to Eq. 1, the total stress
The last characteristic component of this modelling approach are the solid elements ④, which are used to replicate strain-rate dependency and incompressibility of the electrolyte. Cells show a considerable strain-rate dependency, both w.r.t. Initial stiffness and displacement to failure, particularly upon out-of-plane compression (Tancogne-Dejean et al., 2022). The solid elements provide the dynamic over-stress, i.e., the difference between the dynamic and quasi-static behaviour. For this purpose, a strain-rate dependent honeycomb material model (*MAT_MODIFIED_HONEYCOMB) is used. The same test configuration as shown in Figure 3B is used for the calibration. However, the impactor velocity is 3 m/s, which is significantly higher than the quasi-static level (1 mm/s). (Remark: Clearly, this could have been modelled through rate-dependent dampening of the beam elements, too. However, it turned out, that the stable time-step chosen by the solver drops massively once dampening is enabled in the non-linear 6 DoF beam material model).
To summarize, the macroscopic model is calibrated through tensile tests of the four components anode, cathode, separator and pouch. In addition, the data from two quasi-static and one dynamic cell tests are used to calibrate the model.
The quasi-static experiments were performed with a hydraulic press. The system had a maximum force of 420 kN and allowed displacements of up to 400 mm. The possible load velocities were between 0.5 and 6 mm/s. To measure the indentation force, a load cell type K 500 kN from GTM in Bickenbach, Germany, was utilized. For displacement measurement, a linear glass scale with a 1 µm resolution and an accuracy of ± 0.01 mm/m was used. The dynamic experiments were carried out with the sled test rig. Ellersdorfer et al. described its construction and function in detail (Ellersdorfer et al., 2023).
2.2 Proper Generalized Decomposition
For the prediction of the time history curves, as well as for the contours, the Proper Generalized Decomposition–PGD–method is used (Chinesta et al., 2013), in particular two of its non-intrusive variants, the sparse PGD–sPGD–and the ANOVA-PGD, both presented in (Sancarlos et al., 2021). This choice is mostly motivated by two reasons. The first reason is the capability of these regression tools to address the high-dimensionality (i.e., a high number of parameters involved in the model) at the low-data limit (i.e., a small number of data points to build the model). Indeed, when dealing with complex models and problems, sample data points (numerical simulations) may be expensive to gather, so that we would like to reduce their number as much as possible. Second, non-intrusive PGD techniques have demonstrated good efficiency in industrial settings involving various engineering applications (Champaney et al., 2022a; el FallakiIdrissi et al., 2022; Champaney et al., 2022b; Chinesta et al., 2022; Champaney et al., 2021; Pasquale et al., 2022). Such techniques are developed by ESI Group Chair teams at ENSAM ParisTech and industrialized by the ESI Group Research and Innovation teams (Scientific Department) through the Hybrid-Twin AdMoRe platform, whose workflow and roadmap can be found in (Champaney et al., 2021; Chinesta et al., 2022).
The non-intrusive PGD techniques (Sancarlos et al., 2021; Champaney et al., 2022a; Pasquale et al., 2022) are nonlinear regression methods inspired by the separation of variables, which is at the heart of the PGD (Chinesta et al., 2013). This means that a generic function of space
Even though in this work we are interested in the prediction of curves and contours (vector-valued functions), for the sake of simplicity, we will present the algorithm in the simplest form of a scalar quantity prediction. The reader will find all the generalizations concerning vector-valued quantities in (Champaney et al., 2022a).
Moreover, it shall be noticed that in this work we aim at building a parametric model, which also involves geometric parameters, such as the diameter of the impactor and its orientation. This feature is handled directly by AdMoRe platform. To be able to interpolate the snapshots, all the contours are mapped onto a common reference mesh where the regression is performed (usually the one corresponding to the last run of the DoE). This mapping is executed as a data pre-processing prior to the execution of all the Model Order Reduction algorithms.
2.2.1 sPGD
Here we just give a quick overview of the methodology when building a model for a scalar output quantity and refer to (Champaney et al., 2022a) for generalizations to vector-valued ones, as well as to the integration within a PODI (Proper Orthogonal Decomposition with Interpolation) based Model Reduction framework.
If
Following the standard PGD rationale, we seek a low rank separated approximation of it. This means that the function
Where
Denoting with
Such problem is solved by sequential enrichment of modes, up to a given stagnation of the solution. This means that at the enrichment step
A suitable approximation basis (such as the polynomial one) is chosen to express the univariate functions
Where
These unknown coefficients are found by solving the minimization problem iteratively by means of the Alternating Direction Strategy (ADS), which conducts to the solution of small algebraic systems in each direction
An important point regarding the method is the collection of data points. The algorithm is called sparse PGD because it fits the data from a sparse sampling. In general, the Design of Experiments for the sPGD is built from a Latin Hypercube Sampling.
The implementation of the sPGD is performed in Python 3.8.
2.2.2 ANOVA PGD
The ANOVA-PGD algorithm (el FallakiIdrissi et al., 2022; Sancarlos et al., 2021) is inspired by the ANOVA-based variance decomposition widely used in statistics. The high-dimensional function of the parameters is decomposed in the interaction of many (univariate and multivariate) functions as shown in Eq. 8. Where the functions of the last sum satisfy Eq. 9.
Here
Due to the computational drawbacks of computing all the integrals involved in the ANOVA decomposition, as suggested by the so-called anchored-ANOVA, an anchor point satisfying
As a first step, a specific sampling (multidimensional cross centered in
Also, for the ANOVA case, the generalization to vector-valued functions is done following (Champaney et al., 2022a).
In addition, the implementation of the ANOVA-PGD is performed in Python 3.8 and integrated in some beta versions of AdMoRe (being one of the latest developed algorithms).
2.3 Design of experiments
An indentation test with a cylindrical impactor, as shown in Figure 3B, is used as an application. Here, however, a dynamic case is examined. Four different parameters are varied. All four are related to the impactor but can be divided into geometric and non-geometric. The geometric parameters include the diameter and orientation of the impactor. For orientation, the impactor is positioned over the centre of the cell. The rotation occurs around the w-axis. The initial position refers to the configuration shown in Figure 3B. Because of the change in diameter, the position in the w-direction is adjusted such that there is always an initial distance of 0.2 mm between the cell and the impactor. The non-geometric parameters are the initial velocity and the mass of the impactor. The value ranges of the individual parameters are listed in Table 1.
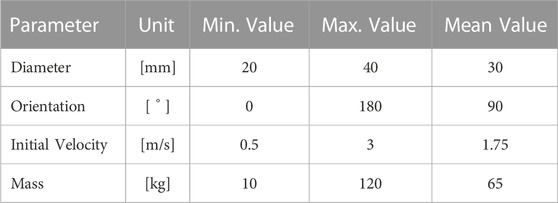
TABLE 1. Parameters and their range of values.
To generate a data basis, 100 simulations with different parameter combinations are carried out. The corresponding combinations were determined using Latin Hypercube Sampling (LHS) for the first regression model based on the sPGD. This sampling method is an alternative to the classical random distribution (Monte Carlo Strategy). For the second regression method (ANOVA-PGD) another enhanced LHS sampling strategy is used. For each parameter, a nominal, which corresponds to mean value, is used. Those nominal values of all parameters are listed in Table 1. For the first run, all the parameters are set to the nominal value. The following runs are then defined by changing only one parameter while the others remain at the nominal value, until all the line segments around the nominal point are discretized, creating a sort of multi-dimensional cross in the parametric domain. These runs will be used by the model to study the effect of each parameter on the output independently of the others. Additional runs are generated from an LHS to allow the method to capture interactions between the parameters.
All runs are carried out with the same simulation duration. From all simulations, both the visual result in the form of the contour plot and the time history curves are available. In addition to impactor force over penetration depth, the kinetic energy of the impactor over time is also considered. For the prediction of the force-displacement curve the sPGD method is used. The kinetic energy over time as well as the contour plot is predicted using ANOVA-PGD.
Finally, the data basis is divided into training data and test data in a ratio of 80/20. The training data is used to create the meta-model. The quality can then be checked with the help of the test data, as these are not used for training.
2.4 Data pre-processing
Before the data can be used for the training of the meta-model, some physics-informed data pre-processing can help to improve regression results and is sometimes necessary. This mainly concerns the regression on time history curves since those data do not have the same end-points or may exhibit clearly some localizations (Champaney et al., 2022a). An example of the former are the force-displacement curves, while the latter is observed in the case of the kinetic energy curves due to the classical evolution of this quantity (localization at shifted minimum points).
A curve alignment and dilatation strategy based on Gappy POD is proposed for the pre-processing of the force-displacement curves, while the kinetic energy evolution curves are aligned with respect to the minimum point, as suggested in (Champaney et al., 2022a). Since the maximum points of the force-displacement curves are not uniform, these curves have different lengths. To achieve a better prediction, all curves are extended to the range
Thus, a prediction of two aspects with respect to the force-displacement curve is required: the path of the curve and its end point. To extend all curves, missing data points must be added. These points should be chosen in such a way that the course fit the overall characteristic. The Gappy POD method is used for this.
This method is based on the Proper Orthogonal Decomposition approach. The approach assumes that a high-dimensional system can be approximated by a linear combination of low-dimensional basis functions (eigenmodes). This does not require a-priori knowledge of the system itself, as it is a method of data analysis. This is shown in Eq. 13, where
There are different methods for calculating the coefficients and modes. The snapshot method is very well known (Sirovich, 1987). As shown in Eq. 14, the spatial modes
Thus, the temporal coefficients
The Gappy Proper Orthogonal Decomposition (GPOD) is an extension of the classical POD method. It is used for data preparation. Data gaps can be filled, incorrect entries can be replaced and data sets can be completed. Several GPOD methods are well known in literature, such as the Everson Sirovich Method (Everson and Sirovich, 1995), Gunes Method (Gunes et al., 2006) or Field Smoothness Method (Raben et al., 2012). In this work, the Gunes Method is used to bring all force-displacement curves to the length
This is an addition of missing data points, which is done iteratively in several steps. In the first step of this method, all missing entries are replaced by an initial guess. This is shown in Eq. 17. If there is a valid entry (
In the next step, a POD analysis is performed on this prepared data set, see Eq. 18 By solving the problem as described in Eqs 14–16, a new approximated data set
The newly calculated values are now taken over for those places where the data set is to be extended (
This routine is carried out until convergence occurs. To assess this, the parameter
This procedure is used to bring all
3 Results
3.1 Results of calibration process
For anode, cathode and pouch, both anisotropy and strain-rate dependency were extremely low. As a result, both effects were neglected in the modelling for the components mentioned. Accordingly, only the mean values of all curves are shown for the results in Figures 4A–C.
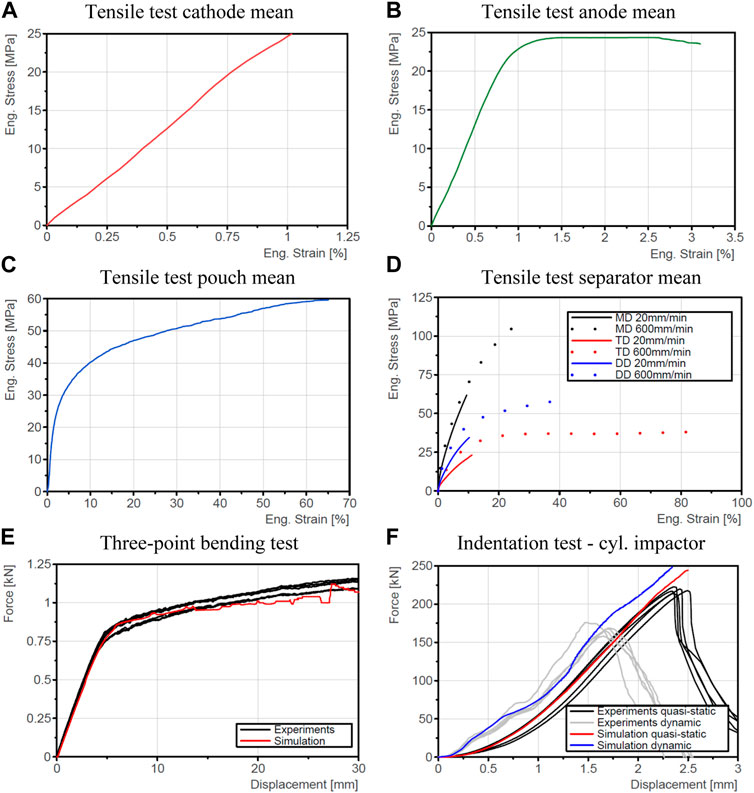
FIGURE 4. Results of tensile tests of components (A) Cathode (B) Anode (C) Pouch (D) Separator—Results of quasi-static and dynamic cell tests: (E) Three-point bending (F) Indentation test with cyl. Impactor.
With separators, both anisotropy and strain-rate effect cannot be neglected. The corresponding mean value curves are shown in Figure 4D. However, if Eq. 1 is considered and the ratio of the component thicknesses is added, it is noticeable that the separator has a minor influence on the behaviour of the entire jelly stack. This justifies the assumption of an isotropic material for the middle layer.
In addition to the component data, data from cell experiments are required for calibration. The comparison between the experiments and the simulation of the three-point bending test is shown in Figure 4E. The maximum impactor travel thereby is 30 mm. The resulting force is about 1.2 kN.
The comparison of experiment and simulation of the indentation test with cylindrical impactor is shown for both the dynamic (3 m/s) and the quasi-static (1 mm/s) case in Figure 4F. The maximum force in the quasi-static test is around 220 kN. The impactor penetrates the cell by about 2.4 mm. In the dynamic case, a penetration of about 1.6 mm is already sufficient to cause the cell to fail.
3.2 Data generation
To create the database, 100 simulations were carried out with different parameter combinations. The results are shown in Figure 5. The left subplot shows the contact force between impactor and cell over the penetration depth. The maximum force reached around 340 kN. The respective parameter combination also gives the largest penetration depth of around 2.8 mm. It can be seen that all force-displacement curves have a similar characteristic shape. The force increases up to the maximum and then the contact force decreases.

FIGURE 5. Result curves of all 100 runs: (A) Force over displacement (B) Kinetic energy over time.
The right subplot of the figure shows the kinetic energy of the impactor over time. The time range that was simulated was the same for all 100 runs. The termination time was 5 m. However, the initial value varies between the individual parameter combinations. It lies in the range of 4.6 and 465 kNmm. Furthermore, it can be seen that the assumption is confirmed that all curves with a minimum value have the same characteristic shape. Please note that different sampling strategies were used for the results shown in Figure 5.
In order to improve the meta-model quality, as suggested in (Champaney et al., 2022a), a suitable data pre-processing based on curves alignment was performed. The force-displacement curves in Figure 5A were first clipped at the maximum point as shown in Figure 6A. Then, within the data set, the curve showing maximum displacement (abscissa) is taken as reference and all the others are filled up to this displacement using the Gappy POD strategy. In such a way, we obtain the aligned curves in Figure 6C. A value of
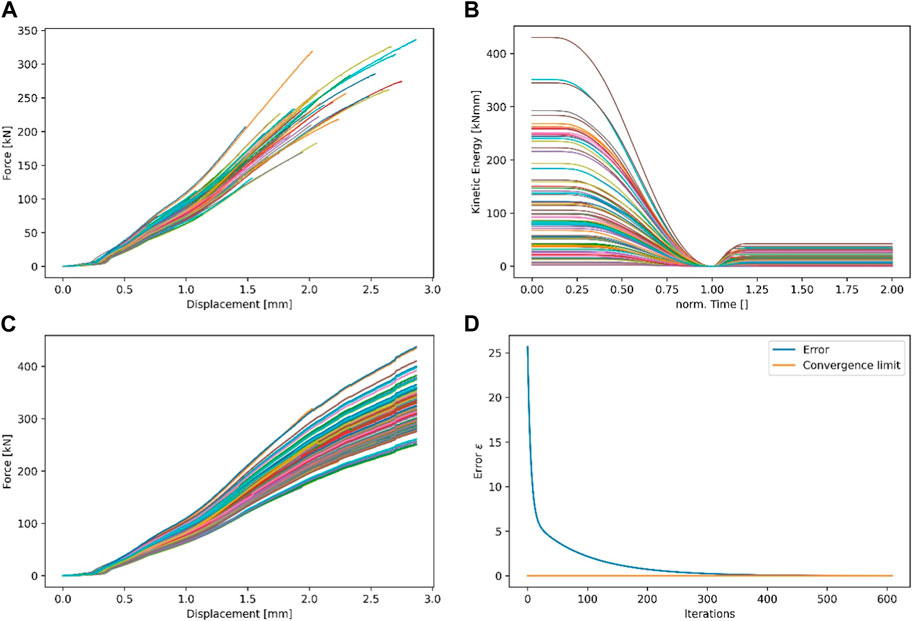
FIGURE 6. Pre-processing of the data basis: (A) Force over displacement (B) Kinetic energy over time (C) Force over displacement with Gappy POD (D) Convergence of Gappy POD algorithm.
For what concerns the kinetic energy curves in Figure 5B, the alignment and expansion with respect to the minimum point was performed, following the procedure explained in (Champaney et al., 2022a). This leads to the curves of Figure 6B.
Of course, after the regression is performed on the pre-processed data, the original curves are reconstructed through inverse mapping (Champaney et al., 2022a).
3.3 Data prediction
The database consists of 100 runs for both methods, sPGD and ANOVA-PGD. Of these, 80 are used for the training phase. The remaining 20 runs are available for validation. Here, five comparisons between HD model and meta-model are discussed as examples. This is the case for the prediction of the force-displacement curve, the kinetic energy over time and the contour plot. These combinations were picked randomly out of the validation data of the sPGD DoE. The corresponding parameter combinations are listed in Table 2.
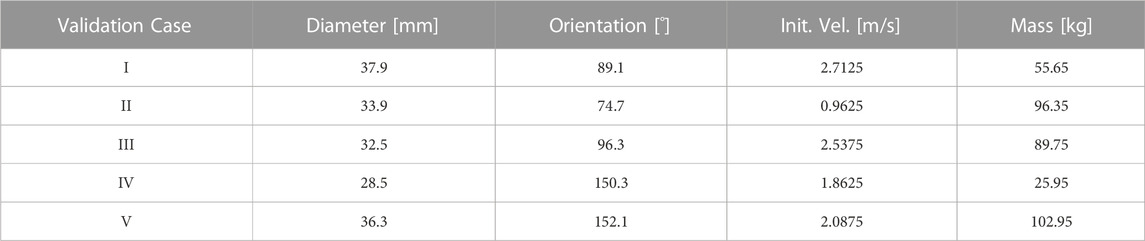
TABLE 2. Parameter combinations for validation (sPGD).
3.3.1 Force over displacement (sPGD)
The force-displacement predictions are obtained coupling a newly suggested pre-processing (Gappy-POD based) with a consolidated regression technique (sPGD).
The corresponding force-displacement curves are shown in Figure 7. The blue curves represent the results of the HD model (FE simulation). The corresponding results of the meta-model are shown in red. To evaluate the quality of the meta-model, both the maximum deviation between the curves and the deviation with respect to the end of the curves are considered.
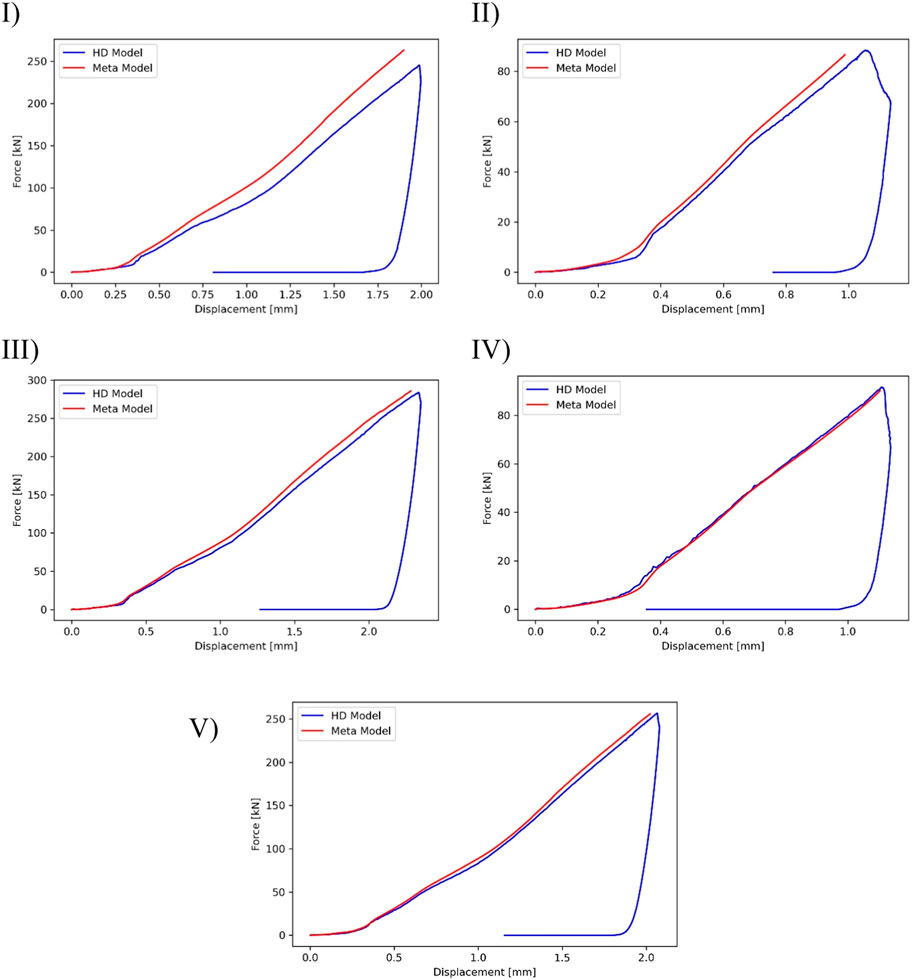
FIGURE 7. Comparison of force—displacement curves of meta-model and HD model.
The corresponding values of all five load cases are listed in Table 3. The values for the FE model and the meta-model, as well as the respective relative deviations are listed. The maximum intrusion (
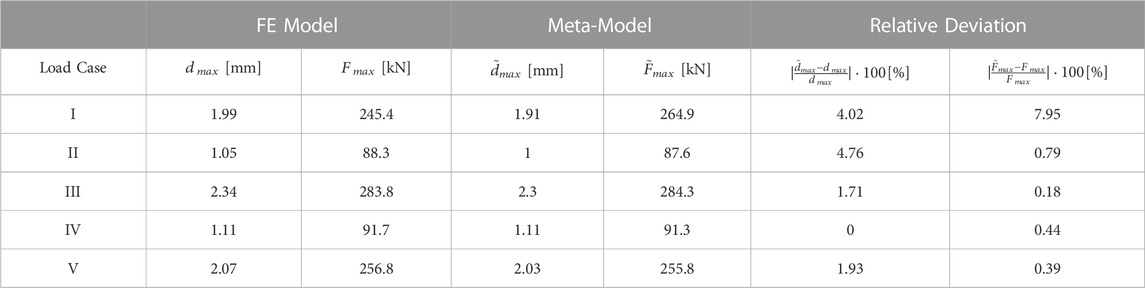
TABLE 3. Comparison results Force - Displacement HD Model vs. Meta-Model (sPGD).
3.3.2 Kinetic energy over time (ANOVA-PGD)
The kinetic energy curves are pre-processed considering the minimum point location, as suggested in (Xu et al., 2015), but the regression is based on the recently developed ANOVA-PGD.
For the validation, the same parameter combinations as for the force over displacement (Table 2) are used. For this purpose, the curves of the FE simulation are taken as reference and the results with ANOVA-PGD are compared with them. The corresponding five comparisons are shown in Figure 8.
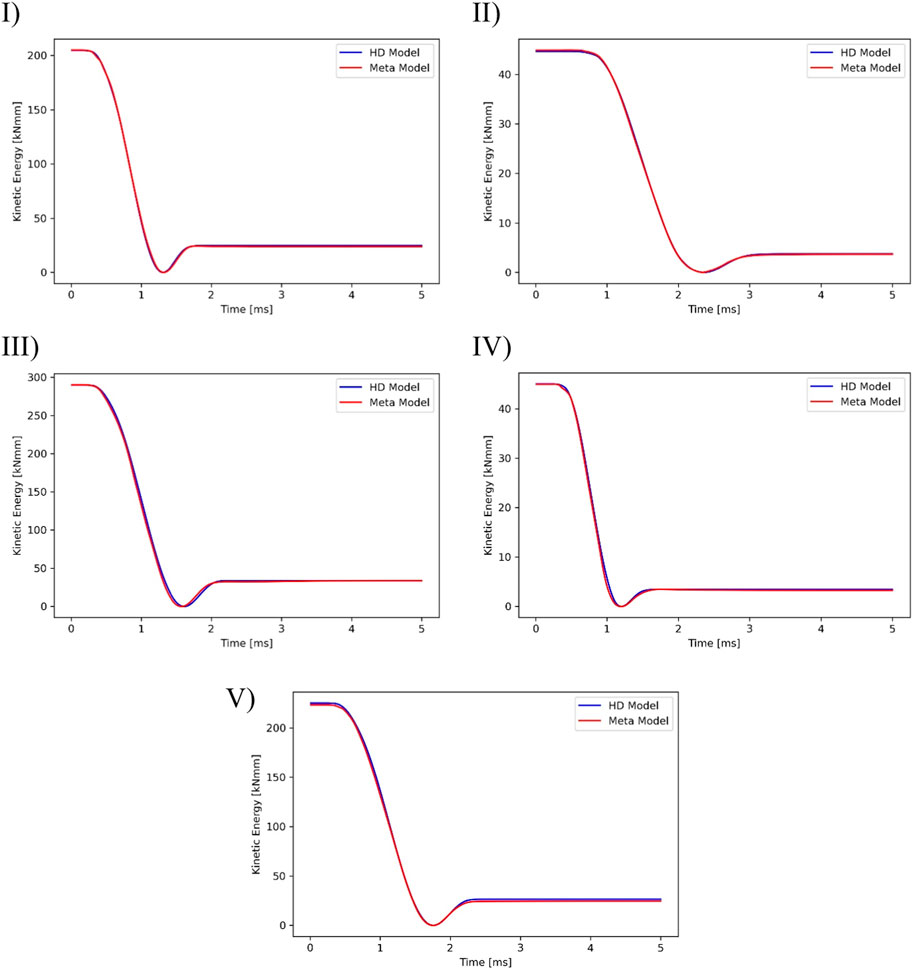
FIGURE 8. Comparison of kinetic energy—time curves of meta-model and HD model.
Equivalent to the evaluation of the prediction of the force displacement curves, the results for the kinetic energy over time are listed in Table 4. Here, too, the results of the FE model and the meta-model are shown with the corresponding relative deviations. The values for
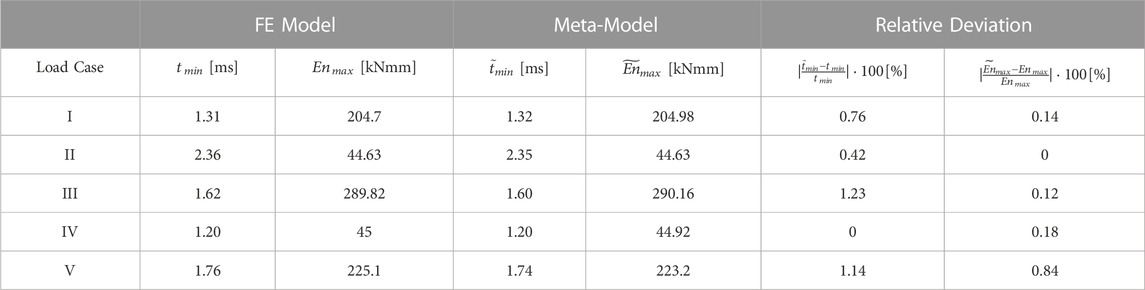
TABLE 4. Comparison results Kinetic Energy–Time HD Model vs. Meta-Model (ANOVA-PGD).
3.3.3 Contour plot (ANOVA-PGD)
The ANOVA variant of the Proper Generalised Decomposition was also used to predict the contour plot. To validate the meta-model, the results of selected parameter combinations were compared with the results of the high-dimensional model. The comparisons of these five parameter combinations, which were also used for the validation of the result curves, are shown in Figure 9. On the left are the results of the high-dimensional model. The results generated with the meta-model are shown on the right. The field variable displacement norm is illustrated here at different times. The explanation of the colour scheme is given in Figure 9-bottom. It can be seen that a range between 0 and 2 mm is represented. For better representation, both the impactor and the rigid bearing have been hidden. For the first comparison the deformation pattern is shown for a simulation time of 1.2 ms. It can be seen that both the position and the penetration depth are predicted correctly. Only the width of the deformation area differs. In the second validation case, the field variable at 2.2 ms is shown. In this case, the orientation, contact situation and penetration depth are accurately predicted. The third comparison shows the displacement norm of the cell at a simulation time of 2.8 ms. In this validation case there are slight deviations with respect to the contact situation. This is because the maximum penetration depth is predicted correctly, but this value varies slightly over the length of the impactor. In the fourth case, the prediction of the displacement field at 1.2 ms can be considered sufficiently good. Both the orientation of the deformation and the penetration depth are well predicted. However, deformations are predicted at a few concentrated locations where the cell is not in contact with the impactor. This occurs also in the last validation case. Therefore, the deformation after 1.8 ms is shown. The maximum penetration depth is predicted correctly. However, the intrusion decreases towards the edges of the cell. From the last two load cases it is obvious that especially the rotation of the impactor can lead to problems in predicting the deformation pattern. Here, indentations in the longitudinal direction are displayed although this does not correspond to the actual orientation of the impactor.
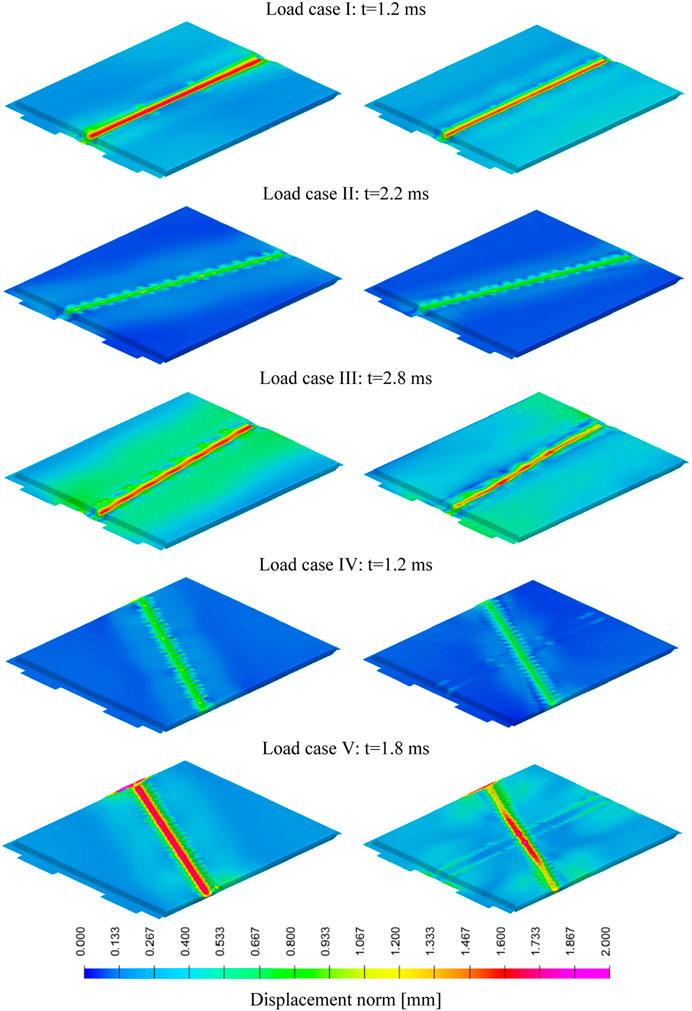
FIGURE 9. Comparison of contour plot: left) HD model right) meta-model.
4 Conclusion
This work presented some new machine learning techniques to accelerate the numerical simulation in the framework of battery systems.
The meta-model was built in a non-intrusive manner using as data the high-fidelity finite element simulations of a lithium-ion battery. The machine learning algorithms consist of non-linear regressions based on the Proper Generalized Decomposition (PGD) rationale. This choice has several motivations: a) due to its ability of dealing with high-dimensional parametric spaces and within the low data limit, the PGD is particularly attractive for industrial applications (Champaney et al., 2022a; el FallakiIdrissi et al., 2022; Champaney et al., 2022b; Chinesta et al., 2022; Champaney et al., 2021; Pasquale et al., 2022), b) recent advances combine the PGD regression with physics-informed pre-processing steps to predict curves as model outputs (Champaney et al., 2022a), which perfectly meets the needs of this study (prediction of force over displacement and of kinetic energy over time), c) the anchored-ANOVA variant of PGD-based regressions (ANOVA-PGD) is a really recent development and, so far, not much investigated in industrial contexts (el FallakiIdrissi et al., 2022).
The just mentioned motivations were successfully accomplished within the present work. Indeed, a) the paper extended the usage of the PGD in the industrial setting of lithium-ion batteries, b) a new physics-informed pre-processing step was here developed using the Gappy-POD method, enriching the existing literature, c) the ANOVA-PGD has been applied for the prediction of curves and contours, also including geometrical parameters, being an additional point of novelty.
The kinetic-energy curves (Section 3.3.2) are instead aligned with respect to the location of the minimum point, following (Xu et al., 2015), but predicted using a novel strategy, which is the ANOVA-PGD. Moreover, also the contours (Section 3.3.3) consider the ANOVA-PGD, being another point of novelty with respect to previous studies.
With an error range of 0%–7.95% (force over displacement) and 0%–1.23% (kinetic energy over time), both time history variables were well predicted.
5 Discussion
The deviations between the FE model and the meta-model are due to the approximation of the results as described in Section 2.2. Since the approximation is based on data generated in an offline phase (training simulations), a further minimisation of the errors can be achieved by adapting the DoE. Either this means the increasing of the number of training simulations or the reduction of parameter ranges. Both measures result in an increase in the density of the training data and thus have a positive influence on the quality of the prediction model.
Another possible improvement in the prediction of the contours can be achieved using parametric optimal transport (Torregrosa et al., 2022a; Torregrosa et al., 2022b) as an interpolation technique to better account for localisations.
Apart from the great advantage of this method that results of certain parameter combinations can be predicted without having to carry out the corresponding simulation, the method presented here also has limitations that should not go unmentioned. For example, the possible parameters are limited to scalar values. The specification of a velocity curve over time (vector) instead of the initial velocity is not possible. For this, the curve would have to be approximated by an analytical function, whose scalar parameters can, however, be used.
Another limitation is that, in this study, all the snapshots (FE simulations) were performed over the same mesh, to avoid a projection of the fields over a common mesh prior to interpolation.
Despite the limitations, another possible application of the method presented here would be the calibration of cell models. Especially in modelling approaches where several parameters have to be determined that have an influence on several load scenarios. Thus, an application to the parameterisation of multi-physical models would be conceivable. This method could increase the efficiency of these calibration processes.
Data availability statement
The original contributions presented in the study are included in the article/Supplementary Material, further inquiries can be directed to the corresponding authors.
Author contributions
Writing—Original Draft: AS and AP Conceptualization: AP, AS, MR, VC, CE, FC, and FF Data Curation: AS, AP, MR, VC, and SG Methodology: AP, AS, MR, CE, FC, and FF Validation: AS, MR, AP, and VC Visualization: AP and AS Writing—Review and Editing: AS, AP, CE, FF, MZ, VC, SG, MR, SK, and FC Supervision: CE, FF, and FC Project administration: CE, FF, and FC. All authors contributed to the article and approved the submitted version.
Acknowledgments
This work was conducted during the realisation of the project SafeLIB (Grant agreement No. 882506) with data from the previous project SafeBattery as a collaboration of Vehicle Safety Institute of Graz University of Technology and Arts et Métiers ParisTech (Paris Campus, PIMM Lab). SafeBattery was funded within the framework of COMET–Competence Centers for Excellent Technologies and by the Province of Styria, as well as the Styrian Business Promotion Agency SFG. The follow up SafeLIB has additionally been funded by the Province of Upper Austria. Both projects are administered by the Austrian Research Promotion Agency (FFG). The authors would like to thank the mentioned agencies and the cooperating companies. Additionally, the authors acknowledge the support of the ESI Group through its research chair CREATE-ID at ENSAM ParisTech. Supported by TU Graz Open Access Publishing Fund.
Conflict of interest
Authors SG, MZ, and FC were employed by the company ESI Group. Author SK was employed by the company Audi.
The remaining authors declare that the research was conducted in the absence of any commercial or financial relationships that could be construed as a potential conflict of interest.
Publisher’s note
All claims expressed in this article are solely those of the authors and do not necessarily represent those of their affiliated organizations, or those of the publisher, the editors and the reviewers. Any product that may be evaluated in this article, or claim that may be made by its manufacturer, is not guaranteed or endorsed by the publisher.
References
Arief Budiman, B., Rahardian, S., Saputro, A., Hidayat, A., Pulung Nurprasetio, I., and Sambegoro, P. (2022). Structural integrity of lithium-ion pouch battery subjected to three-point bending. Eng. Fail. Anal. 138, 106307. doi:10.1016/j.engfailanal.2022.106307
Beaumont, R., Masters, I., Das, A., Lucas, S., Thanikachalam, A., and Williams, D. (2021). Methodology for developing a macro finite element model of lithium-ion pouch cells for predicting mechanical behaviour under multiple loading conditions. Energies 14 (7), 1921. doi:10.3390/en14071921
Breitfuss, C., Sinz, W., Feist, F., Gstrein, G., Lichtenegger, B., Knauder, C., et al. (2013). A ‘microscopic’ structural mechanics FE model of a lithium-ion pouch cell for quasi-static load cases. SAE Int. J. Passeng. Cars - Mech. Syst. 6 (2), 1044–1054. doi:10.4271/2013-01-1519
Cannarella, J., Liu, X., Leng, C. Z., Sinko, P. D., Gor, G. Y., and Arnold, C. B. (2014). Mechanical properties of a battery separator under compression and tension. J. Electrochem. Soc. 161 (11), F3117–F3122. doi:10.1149/2.0191411jes
Champaney, V., Chinesta, F., and Cueto, E. (2022b). Engineering empowered by physics-based and data-driven hybrid models: a methodological overview. Int. J. Material Form. 15, 31. doi:10.1007/s12289-022-01678-4
Champaney, V., Pasquale, A., Ammar, A., and Chinesta, F. (2022a). Parametric curves metamodelling based on data clustering, data alignment, POD-based modes extraction and PGD-based nonlinear regressions. Front. Mater. 9. doi:10.3389/fmats.2022.904707
Champaney, V., Sancarlos, A., Chinesta, F., Cueto, E., González, D., Alfaro, I., et al. (2021). Hybrid twins - a highway towards a performance-based engineering. Part I: advanced model order reduction enabling real-time physics. ESAFORM 2021, 2017. doi:10.25518/esaform21.2017
Chinesta, F., Cueto, E., and Guévelou, S. (2022). Material forming digital twins: the alliance between physics-based and data-driven models. Key Eng. Mater. 926, 3–14. doi:10.4028/p-234d4y
Chinesta, F., Keunings, R., and Leygue, A. (2013). The proper generalized decomposition for advanced numerical simulations: A primer. Incorporated: Springer Publishing Company.
Dixon, B., Mason, A., and Sahraei, E. (2018). Effects of electrolyte, loading rate and location of indentation on mechanical integrity of li-ion pouch cells. J. Power Sources 396, 412–420. doi:10.1016/j.jpowsour.2018.06.042
el Fallaki Idrissi, M., Praud, F., Champaney, V., Chinesta, F., and Meraghni, F. (2022). Multiparametric modeling of composite materials based on non-intrusive PGD informed by multiscale analyses: application for real-time stiffness prediction of woven composites. Compos. Struct. 302, 116228. doi:10.1016/j.compstruct.2022.116228
Ellersdorfer, C., Höschele, P., Heider, E., Kovachev, G., and Gstrein, G. (2023). Safety assessment of high dynamic pre-loaded lithium ion pouch cells. Batteries 9 (2), 71. doi:10.3390/batteries9020071
Essl, C., Golubkov, A. W., and Fuchs, A. (2020). Comparing different thermal runaway triggers for two automotive lithium-ion battery cell types. J. Electrochem. Soc. 167 (13), 130542. doi:10.1149/1945-7111/abbe5a
Everson, R., and Sirovich, L. (1995). Karhunen-Loeve procedure for gappy data. J. Opt. Soc. Am. A, Opt. Image Sci. 12 (8), 1657–1664. doi:10.1364/josaa.12.001657
Geisbauer, C., Wöhrl, K., Lott, S., Nebl, C., Schweiger, H. G., Goertz, R., et al. (2021). Scenarios involving accident-damaged electric vehicles. Transp. Res. Procedia 55, 1484–1489. doi:10.1016/j.trpro.2021.07.136
Gilaki, M., and Avdeev, I. (2016). Impact modeling of cylindrical lithium-ion battery cells: a heterogeneous approach. J. Power Sources 328, 443–451. doi:10.1016/j.jpowsour.2016.08.034
Gunes, H., Sirisup, S., and Karniadakis, G. E. (2006). Gappy data: to krig or not to krig? J. Comput. Phys. 212 (1), 358–382. doi:10.1016/j.jcp.2005.06.023
Kermani, G., Keshavarzi, M. M., and Sahraei, E. (2021). Deformation of lithium-ion batteries under axial loading: analytical model and Representative Volume Element. Energy Rep. 7, 2849–2861. doi:10.1016/j.egyr.2021.05.015
Kisters, T., Gilaki, M., Nau, S., and Sahraei, E. (2022). Modeling of dynamic mechanical response of Li-ion cells with homogenized electrolyte-solid interactions. J. Energy Storage 49, 104069. doi:10.1016/j.est.2022.104069
Kisters, T., Sahraei, E., and Wierzbicki, T. (2017). Dynamic impact tests on lithium-ion cells. Int. J. Impact Eng. 108, 205–216. doi:10.1016/j.ijimpeng.2017.04.025
Kovachev, G., Schröttner, H., Gstrein, G., Aiello, L., Hanzu, L., Wilkening, H., et al. (2019). Analytical dissection of an automotive Li-ion pouch cell. Batteries 5 (4), 67. doi:10.3390/batteries5040067
Li, H., Liu, B., Zhou, D., and Zhang, C. (2020). Coupled mechanical–electrochemical–thermal study on the short-circuit mechanism of lithium-ion batteries under mechanical abuse. J. Electrochem. Soc. 167 (12), 120501. doi:10.1149/1945-7111/aba96f
Liang, Y., Lee, H., Lim, S., Lin, W., Lee, K., and Wu, C. (2002). Proper orthogonal decomposition and its applications Part I: theory. J. Sound Vib. 252 (3), 527–544. doi:10.1006/jsvi.2001.4041
Liu, B., Jia, Y., Yuan, C., Wang, L., Gao, X., Yin, S., et al. (2020). Safety issues and mechanisms of lithium-ion battery cell upon mechanical abusive loading: a review. Energy Storage Mater. 24, 85–112. doi:10.1016/j.ensm.2019.06.036
Pasquale, A., Champaney, V., Kim, Y., Hascoët, N., Ammar, A., and Chinesta, F. (2022). A parametric metamodel of the vehicle frontal structure accounting for material properties and strain-rate effect: application to full frontal rigid barrier crash test. Heliyon 8, e12397. doi:10.1016/j.heliyon.2022.e12397
Qin, D., Wang, P., Wang, T., and Chen, J. (2023). Modeling and dynamic impact analysis of prismatic lithium-ion battery. Sustainability 15 (10), 8414. doi:10.3390/su15108414
Raben, S. G., Charonko, J. J., and Vlachos, P. P. (2012). Adaptive gappy proper orthogonal decomposition for particle image velocimetry data reconstruction. Meas. Sci. Technol. 23 (2), 025303. doi:10.1088/0957-0233/23/2/025303
Raffler, M., Sevarin, A., Ellersdorfer, C., Heindl, S. F., Breitfuss, C., and Sinz, W. (2017). Finite element model approach of a cylindrical lithium ion battery cell with a focus on minimization of the computational effort and short circuit prediction. J. Power Sources 360, 605–617. doi:10.1016/j.jpowsour.2017.06.028
Raffler, M., Sinz, W., Erker, S., Brunnsteiner, B., and Ellersdorfer, C. (2022). Influence of loading rate and out of plane direction dependence on deformation and electro-mechanical failure behavior of a lithium-ion pouch cell. J. Energy Storage 56, 105906. doi:10.1016/j.est.2022.105906
Ratner, A., Beaumont, R., and Masters, I. (2020). Dynamic mechanical compression impulse of lithium-ion pouch cells. Energies 13 (8), 2105. doi:10.3390/en13082105
Sahraei, E., Bosco, E., Dixon, B., and Lai, B. (2016). Microscale failure mechanisms leading to internal short circuit in Li-ion batteries under complex loading scenarios. J. Power Sources 319, 56–65. doi:10.1016/j.jpowsour.2016.04.005
Sahraei, E., Campbell, J., and Wierzbicki, T. (2012a). Modeling and short circuit detection of 18650 Li-ion cells under mechanical abuse conditions. J. Power Sources 220, 360–372. doi:10.1016/j.jpowsour.2012.07.057
Sahraei, E., Hill, R., and Wierzbicki, T. (2012b). Calibration and finite element simulation of pouch lithium-ion batteries for mechanical integrity. J. Power Sources 201, 307–321. doi:10.1016/j.jpowsour.2011.10.094
Sancarlos, A., Champaney, V., Duval, J.-L., Cueto, E., and Chinesta, F. (2021). PGD-based advanced nonlinear multiparametric regressions for constructing metamodels at the scarce-data limit. arXiv. doi:10.48550/ARXIV.2103.05358
Schaufelberger, B., Altes, A., and Matura, P. (2021). “Modeling the mechanical behaviour of a Li-ion pouch cell under three-point bending,” in 13th European LS-DYNA Conference, Ulm, Germany.
Schmid, A., Ellersdorfer, C., Raffler, M., Karajan, N., and Feist, F. (2022). An efficient detailed layer model for prediction of separator damage in a Li-Ion pouch cell exposed to transverse compression. SSRN 2022, 4273879. doi:10.2139/ssrn.4273879
Sirovich, L. (1987). Turbulence and the dynamics of coherent structures. Part I: coherent structures. Q. Appl. Math. 45 (3), 561–571. doi:10.1090/qam/910462
Tancogne-Dejean, T., Grolleau, V., and Mohr, D. (2022). Strain rate dependent plasticity of lithium-ion pouch cells: experiments and simulations. Int. J. Impact Eng. 159, 104048. doi:10.1016/j.ijimpeng.2021.104048
Torregrosa, S., Champaney, V., Ammar, A., Herbert, V., and Chinesta, F. (2022b). Hybrid twins based on optimal transport. Comput. Math. Appl. 127, 12–24. doi:10.1016/j.camwa.2022.09.026
Torregrosa, S., Champaney, V., Ammar, A., Herbert, V., and Chinesta, F. (2022a). Surrogate parametric metamodel based on Optimal Transport. Math. Comput. Simul. 194, 36–63. doi:10.1016/j.matcom.2021.11.010
Wang, L., Yin, S., and Xu, J. (2019). A detailed computational model for cylindrical lithium-ion batteries under mechanical loading: from cell deformation to short-circuit onset. J. Power Sources 413, 284–292. doi:10.1016/j.jpowsour.2018.12.059
Wierzbicki, T., and Sahraei, E. (2013). Homogenized mechanical properties for the jellyroll of cylindrical Lithium-ion cells. J. Power Sources 241, 467–476. doi:10.1016/j.jpowsour.2013.04.135
Xu, J., Liu, B., Wang, L., and Shang, S. (2015). Dynamic mechanical integrity of cylindrical lithium-ion battery cell upon crushing. Eng. Fail. Anal. 53, 97–110. doi:10.1016/j.engfailanal.2015.03.025
Yue, F., Xia, Q., Gong, Y., Wang, M., Xia, H., and Huang, X. (2022). A fully coupled electrochemical-mechanical-thermal model of all-solid-state thin-film Li-ion batteries. J. Power Sources 539, 231614. doi:10.1016/j.jpowsour.2022.231614
Zhou, W. (2015). Effects of external mechanical loading on stress generation during lithiation in Li-ion battery electrodes. Electrochimica Acta 185, 28–33. doi:10.1016/j.electacta.2015.10.097
Zhou, W., Hao, F., and Fang, D. (2013). The effects of elastic stiffening on the evolution of the stress field within a spherical electrode particle of lithium-ion batteries. Int. J. Appl. Mech. 05 (04), 1350040. doi:10.1142/S1758825113500403
Zhu, J., Zhang, X., Sahraei, E., and Wierzbicki, T. (2016). Deformation and failure mechanisms of 18650 battery cells under axial compression. J. Power Sources 336, 332–340. doi:10.1016/j.jpowsour.2016.10.064
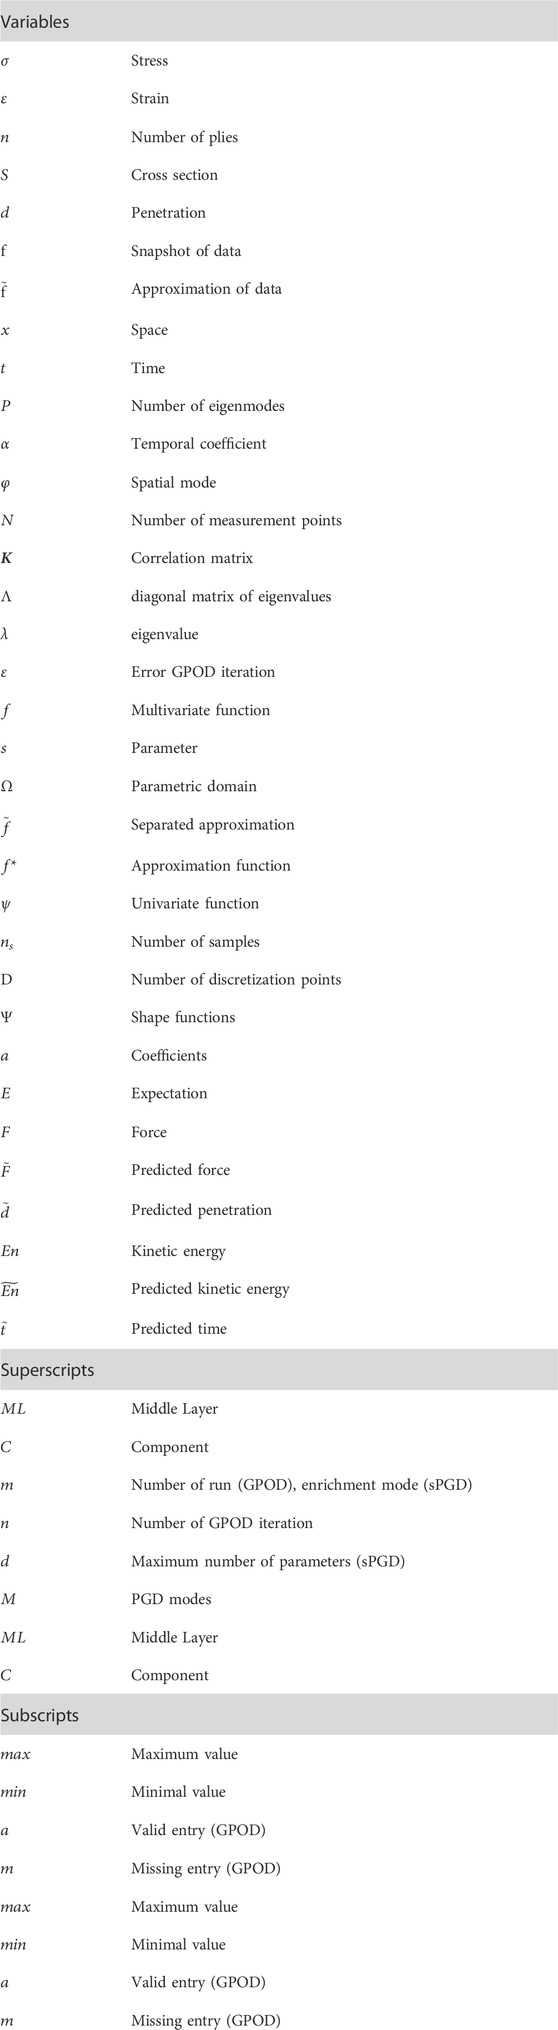
Glossary
Keywords: proper generalized decomposition, parametric models, nonlinear regression, lithium-ion battery, real time simulation
Citation: Schmid A, Pasquale A, Ellersdorfer C, Champaney V, Raffler M, Guévelou S, Kizio S, Ziane M, Feist F and Chinesta F (2023) PGD based meta modelling of a lithium-ion battery for real time prediction. Front. Mater. 10:1245347. doi: 10.3389/fmats.2023.1245347
Received: 23 June 2023; Accepted: 01 August 2023;
Published: 14 August 2023.
Edited by:
Minglei Sun, University of Antwerp, BelgiumReviewed by:
Wenbin Zhou, University of Dundee, United KingdomHui Guo, Shanghai University of Engineering Sciences, China
Copyright © 2023 Schmid, Pasquale, Ellersdorfer, Champaney, Raffler, Guévelou, Kizio, Ziane, Feist and Chinesta. This is an open-access article distributed under the terms of the Creative Commons Attribution License (CC BY). The use, distribution or reproduction in other forums is permitted, provided the original author(s) and the copyright owner(s) are credited and that the original publication in this journal is cited, in accordance with accepted academic practice. No use, distribution or reproduction is permitted which does not comply with these terms.
*Correspondence: Alexander Schmid, YWxleGFuZGVyLnNjaG1pZEB0dWdyYXouYXQ=; Angelo Pasquale, YW5nZWxvLnBhc3F1YWxlQGVuc2FtLmV1
†These authors have contributed equally to this work and share first authorship
‡These authors have contributed equally to this work and share last authorship