 Pablo de Vera
 Isabel Abril2
 Rafael Garcia-Molina
- 1Centro de Investigación en Óptica y Nanofísica, Departamento de Física, Universidad de Murcia, Murcia, Spain
- 2Departament de Física Aplicada, Universitat d’Alacant, Alacant, Spain
Understanding and quantifying the electronic inelastic interactions of swift ions and electrons in metals is fundamental for many applications of charged particle beams. A common theoretical approach is moreover desirable for the case of both types of projectiles, as large numbers of secondary electrons arise as the result of ion interaction with metals. The electronic cross section, stopping power and energy-loss straggling resulting from the interaction of swift protons, alpha particles and electrons when moving through the metals aluminum, iron, copper, molybdenum, platinum and gold, are calculated theoretically for a wide energy range of the projectiles. The model is based on the dielectric formalism, which realistically accounts for the excitation spectrum of each metal through the Mermin Energy-Loss Function–Generalized Oscillator Strength (MELF-GOS) methodology. The impact of the complexity of the excitation spectrum of each metal (encompassing interband transitions and collective excitations), as well as the different sources of (sometimes conflicting) optical data is analysed in detail. Specific interactions are considered for each projectile, such as electron capture/loss and electron cloud polarisation for ions, and indistinguishability, exchange and low-energy corrections for electrons. An estimate of possible contributions of surface excitations to the interaction probabilities of low energy electrons is given. Comparison of our results with a large collection of available experimental data shows good agreement. As a practical and useful outcome of the work, we provide analytical expressions fitting all our calculated quantities, which can be applied for simulation or comparison purposes.
1 Introduction
The interaction of energetic charged particles (either electrons or ions) with condensed matter underpins numerous techniques for both analysing and tailoring materials properties (Nastasi et al., 1996; Sigmund, 2006). Among the former, electron microscopy is nowadays routinely used not only for microscopic imaging, but also for various spectroscopies, such as electron energy-loss (EELS) or energy-dispersive X-ray (EDX) spectroscopies (Egerton, 2011; Goldstein et al., 2018; Dapor, 2020), giving important information on the electronic structure and composition of materials. Lately, focused ion beam (FIB) imaging is also gaining popularity (Utke et al., 2008; Córdoba et al., 2019), and Rutherford backscattering (RBS) is a well established analytical technique (Jeynes et al., 2012), among others.
Materials modification can be accomplished by focused beams of charged particles in techniques such as electron- or ion-beam lithography (Udalagama et al., 2009; Manfrinato et al., 2014; Jesse et al., 2016; Huth et al., 2018) or ion-induced sputtering (Mookerjee et al., 2008; Sigmund, 2013). For these purposes, ion beams are particularly useful, as they deposit larger amounts of energy per unit path length as compared to electrons, but they also do it in nanometric radial distances from their path (a quality referred to as a high linear energy transfer, LET). This feature is exploited both in nanofabrication techniques (Utke et al., 2008; Sigmund, 2013; Jesse et al., 2016) and in cancer treatment by hadrontherapy (Schardt et al., 2010; Loeffler and Durante, 2013; Solov’yov, 2017). The latter benefit from the complex damage patterns induced in the scales of sensitive molecules, such as lithography resists, writing precursor molecules or the DNA in living cells. However, it should be kept in mind that the high LET of ion beams originates from the generation and propagation of large numbers of (mainly low energy) secondary electrons, being the latter the responsible of the energy propagation around the ion’s path, so ion and electron interactions are intimately interlinked in all ion beam applications.
Particularly, the interaction of charged particles with metals is of great interest, both basic and applied. Metals are not only essential components for advanced nanodevices for electronics (Janes et al., 2000), catalysis (Heiz and Landman, 2014) or many other fields, but they are also finding new applications in nanomedicine. Transition metal (such as Au or Pt) nanoparticles are being explored as sensitisers for hadrontherapy (Kuncic and Lacombe, 2018; Kempson, 2021), as they can be coated with specific molecules that allow targeting cancer cells. Ion interaction with the metals prompts the production of a considerable number of electrons, which enhance the large nanoscopic doses along ion tracks, improving their relative biological effectiveness.
From the fundamental point of view, the interaction of ions and electrons with metals is also a complex problem. Charge exchange between the impinging ion and the metal results in a collection of possible charge states, whose distribution depends on both ion’s velocity and ion-target combination, strongly affecting the ion electronic energy loss. In the case of primary electrons, the interaction is even more intricate due to their indistinguishability with the target’s electrons (Mott, 1930; Berger and Seltzer, 1982). This brings about several complexities related to exchange, but also to the complex electronic structure of metals, as individual and collective excitations need to be treated differently (de Vera and Garcia-Molina, 2019). Last, but not least, in most cases low energy electrons (≲ 100 eV) are the most relevant in practice. However, larger discrepancies are reported in the literature with regard to their interaction probabilities, both from the experimental (Knapp et al., 1979; Ogawa et al., 1997; Bourke and Chantler, 2010; Chantler and Bourke, 2010; Bauer et al., 2015) and theoretical (Emfietzoglou and Nikjoo, 2005; Bourke and Chantler, 2012; Emfietzoglou et al., 2013; Nguyen-Truong, 2017) sides.
In this context, the dielectric formalism (Lindhard, 1954; Ritchie, 1959) (a theory dating back to Fermi (Fermi, 1940)) is gaining popularity in recent years for obtaining the necessary cross sections for different materials (Nguyen-Truong, 2017; Azzolini et al., 2019; Flores-Mancera et al., 2020; Poignant et al., 2020; Gibaru et al., 2021), as it represents a very convenient theoretical approach for the study of this problem. First of all, its independent description of projectile’s and target’s properties facilitates the implementation of methods to both treat primary ions and electrons. The target’s electronic excitation spectrum is modelled through its complex dielectric function, which can be both obtained from optical or electron energy-loss experiments (Palik and Ghosh, 1999; Werner et al., 2009; Xu et al., 2017; Pauly et al., 2020) and phenomenological models (Garcia-Molina et al., 2012), or from advanced ab initio calculations (Nguyen-Truong, 2017; Pedrielli et al., 2021; Taioli et al., 2021), providing a good balance between easiness of implementation and theoretical rigour. Finally, several extensions of the dielectric formalism allow the consideration of the particularities arising from low energy electrons, including their increased probabilities for surface excitation (Chen and Kwei, 1996; Zhang et al., 2004; Chen et al., 2007; Dapor, 2022) and the improvement of the method accuracy at low energies (Emfietzoglou and Nikjoo, 2005; de Vera and Garcia-Molina, 2019). Thus, the dielectric formalism represents a method of choice for the practical yet physically motivated modelling of ion and electron interaction with metals in a wide range of energies.
In the present article, we focus our study on the electronic interactions of protons, alpha particles and electrons beams with bulk Al, Fe, Cu, Mo, Pt, and Au targets by means of the dielectric formalism. The different models to deal with ion and electron projectiles will be discussed, including the improvements necessary to describe low energy electrons. The metals chosen include Al, a representative free electron-like metal with a spectrum dominated by an intense plasmon excitation, and a selection of transition metals along the d-block in the periodic table presenting complex excitation spectra, combining plasmon, intra- and interband excitations. These materials count on with a rather extensive compilation of experimental data on electronic interactions (both for electron and ion beams) with which the calculations can be compared. Particularly, for Cu and Mo there are recent X-ray absorption fine structure spectroscopy (XAFS) measurements of very low energy electrons inelastic mean free paths (Bourke and Chantler, 2010; Chantler and Bourke, 2010), which are in conflict with previous experimental data (Knapp et al., 1979; Ogawa et al., 1997; Bauer et al., 2015), allowing for the discussion of some theoretical considerations. The noble metals Au and Pt are commonly used as radioenhancing nanoparticles (Kuncic and Lacombe, 2018; Kempson, 2021), and accurate information on ion and electron interaction with them is necessary to advance in the understanding of the mechanisms underlying their application in therapy. For most of these metals there are several datasets for their optical properties available (sometimes in conflict among them) (Palik and Ghosh, 1999; Werner et al., 2009; Xu et al., 2017; Pauly et al., 2020), whose consistency can be analysed by means of theoretical tests and comparison to experimental observables obtained from ion and electron interactions.
2 Theory of the energy loss of swift charged particles in metals
In the quantum theory of electronic excitations of atoms or molecules by a charged particle impact (see, e.g., (Fano, 1963; Moiseiwitsch and Smith, 1968; Inokuti, 1971; Bichsel, 1988)), the most fundamental quantity is the inelastic doubly differential cross section (DDCS),
The last term in Eq. (1) accounts for the interference between the direct and exchange scattering amplitudes.
In the first Born approximation (FBA) only the direct scattering amplitude is taken into account, so the exchange and interference terms in Eq. (1) are neglected. Within the FBA, the dielectric formalism provides a compact expression for the DDCS for a charged particle of charge Z, mass M and kinetic energy T inelastically interacting with the electrons of a condensed-phase medium (see Ref (Lindhard, 1954) for the derivation from electrodynamics, Refs (Fano, 1963; Moiseiwitsch and Smith, 1968; Inokuti, 1971; Bichsel, 1988) for quantum-mechanical treatments, and Ref (Nikjoo et al., 2012) for a comprehensive review):
Here e is the elementary charge and ρq(k) represents the Fourier transform of the electronic charge density corresponding to the incident particle, for a given charge state q. For electrons, which are point charges,
For projectiles of sufficient velocity (i.e., when the energy loss is small with respect to the projectile’s kinetic energy), the FBA is sufficiently accurate, so Eq. (2) will be used in what follows; all equations without subscript will correspond to FBA results, except when otherwise stated. At low and intermediate energies, different projectile charge states q are possible for the case of ion beams, which have to be taken into account, as will be explained in Section 4.1. However, when the primary projectile is an electron, its indistinguishability and exchange with the secondary (target) electron must be considered; the influence of this contribution will be more sizeable when both electrons have similar velocities, i.e., for the lower primary electron energies (of the order of tens and hundreds of eV). The treatment of the exchange, together with low-energy corrections for electrons, are discussed in Section 4.2.
Appropriate integration of the DDCS over energy and momentum transfers yields integral energy-loss quantities that are necessary for modelling the propagation of charged particles in the condensed phase metals, and which can be experimentally measured. The inverse mean free path (IMFP) is given by:
the stopping power is given by:
and the energy-loss straggling is:
While the mean free path λ = Λ−1 represents the average distance between inelastic collisions, Λ denotes the average number of inelastic interactions per unit path length of the charged particle. The stopping power S characterises the average energy lost by the projectile per unit path length, and Ω2 corresponds to the second moment of the energy-loss distribution, related to the statistical deviations from the average energy lost per unit path length. As it will be discussed in Section 4, the energy and momentum transfer limits depend on both the type of projectile and on the characteristics of the electronic excitation spectrum. Whereas Eq. (3) is used mainly for electrons, particular versions of Eqs. (3), (4) and (5) will be given later for ions and electrons.
3 Description of the target excitation spectrum
In the dielectric framework (Lindhard, 1954; Fermi, 1940; Ritchie, 1957) the electronic excitation spectrum of a material is connected to its energy-loss function (ELF), which can be divided into the excitation of the loosely-bound outer-shell electrons and of the atomic-like inner-shell electrons (Heredia-Avalos et al., 2005):
The second term in the right hand side of the equation accounts for the excitation of the inner-shells (with quantum numbers nl) of the atoms j forming the material with stoichiometric weight νj. Their ELF can be obtained by means of atomic hydrogenic generalised oscillator strengths (GOS) for the K-, L- and M-shells (Heredia-Avalos et al., 2005), which analytically provide the dispersion relation over the whole (k, E)-space:
where
The ELF describing the excitation of the outer-shell electrons can be obtained either from optical experiments (k = 0) extended to finite momentum transfer by appropriate models (Garcia-Molina et al., 2012), or alternatively by means of time-dependent density functional theory (TDDFT) calculations (Nguyen-Truong, 2017; Pedrielli et al., 2021; Taioli et al., 2021; Taioli et al., 2023). While the latter approach allows a totally ab initio calculation of the excitation spectrum (which could be very convenient for targets that are difficult to study experimentally, such as nanostructured materials), the description of bulk matter has typically relied on the use of optical experimental data, which is usually rather reliable (Raether, 1965; Egerton, 2011). There exist many techniques to study the optical properties of materials, and several sources for metals are available, such as the classical compilation of refractive indexes and extinction coefficients by Palik and Ghosh (Palik and Ghosh, 1999) or the most recent electron energy-loss measurements by Werner et al. (Werner et al., 2009), among others.
In the optical limit, the experimental ELF (k = 0, E) can be described by a linear combination of Drude-type functions with energy thresholds (de Vera and Garcia-Molina, 2019):
where Ai, Ei and γi are fitting parameters denoting the intensities, positions and widths of the peaks comprising the optical spectrum; notice that the form
which provides a soft onset for the excitation of some outer shells. The additional fitting parameter Δi determines the steepness of the soft threshold.
Among the different available approaches to extend the optical outer-shells ELF to finite momentum transfers (ℏk ≠ 0) (Garcia-Molina et al., 2012), here we use Mermin energy-loss functions (Mermin, 1970), which have been successfully applied to many condensed-phase targets by means of the so-called Mermin Energy-Loss Function–Generalised Oscillator Strengths (MELF-GOS) methodology (Heredia-Avalos et al., 2005; Heredia-Avalos and Garcia-Molina, 2007; Denton et al., 2008a; Denton et al., 2008b; Garcia-Molina et al., 2011; de Vera et al., 2014; de Vera and Garcia-Molina, 2019). The Mermin functions, which are identical to the Drude functions at the optical limit, automatically account for the dispersion to finite k-values including the damping of the excitations.
Traditionally, the sum of Drude-type functions in Eq. (8) is just meant to provide an appropriate fitting of the optical ELF, assessed by the fulfillment of physically motivated sum rules (Smith and Shiles, 1978; Tanuma et al., 1993; Smith, 1998). However, following detailed parameterisations of the excitation spectra (ϵ2 (k = 0, E)) of materials such as liquid water (Dingfelder et al., 1998; Emfietzoglou, 2003) and some metals and oxides (Kwei et al., 1993), it was suggested in Ref. (de Vera and Garcia-Molina, 2019) that Drude ELFs can be also approximately identified with particular energy-loss channels, such as plasmon, intra- and interband excitations.
The quality of a model ELF can be checked in terms of sum-rules (Tanuma et al., 1993), of which it is particularly important the f-sum rule, which gives the effective number of electrons participating in the excitations with energy transfers lower or equal than E:
This equation, when using the full ELF, Eq. (6), must converge to the total number Zt of electrons per atom (or molecule, in the case of compounds) in the target material, when E → ∞. However, it was also shown in Ref. (de Vera and Garcia-Molina, 2019) that individual contributions of the outer-shells ELF given by the corresponding terms in Eq. (8) should also approximately converge to the number of electrons expected in a particular transition. Therefore, the f-sum rule will be very useful for assessing the quality of a particular set of optical data, both in terms of total and partial numbers of electrons. Additionally, the Kramers-Kronig (KK) sum rule must be also fulfilled for the complete ELF, which for conductors becomes (Tanuma et al., 1993):
4 Description of the projectile
4.1 Ion projectiles
As commented in Section 2, exchange and interference terms in the DDCS can be ignored for ion projectiles, and FBA results are discussed in the following. Ions large mass M in comparison with electron mass m makes them more energetic than electrons for the same velocity, thus the dielectric formalism becomes valid for ions at lower velocities as compared to electron projectiles (Rudd et al., 1992). Later on, the range of validity of the dielectric approach will be checked in comparison to the available experimental data for ion projectiles.
However, ions can lose electrons and capture them from the target, dynamically changing their charge state q, which affects their energy-loss quantities through the term
where the sum goes over all possible charge states q, typically from 0 to Z. Analogously, the energy-loss straggling is calculated as:
The charge fractions ϕq(T) can be obtained from the parameterisation included in the CasP code (Schiwietz and Grande, 2001), based on a large compilation of experimental measurements for several projectiles and targets.
The model implemented in Ref. (Heredia-Avalos and Garcia-Molina, 2002) for Spol,q is used in this work for both protons and alpha particles:
The previous equation can be written as Spol,q = (Sq + Se) + Sinterf, where the terms in parentheses correspond to the stopping due to the nucleus and to the electron cloud, while the last term accounts for their interference, in clear analogy with the result obtained by Arista (Arista, 1978) for the energy loss of a pair of charges in correlated motion. The present expression corrects some misprints appearing in Refs. (Denton et al., 2008a; Denton et al., 2008b), which did not affect the results presented in those works. The energy-loss straggling including polarisation,
As for the integration limits, they are obtained from energy and momentum conservation in an inelastic collision. Assuming scattering with a free electron at rest, the upper limit in the energy transfer is E+ = 4 (m/M)T (Rudd et al., 1992). For metals, which have no band gap, the lower limit for the energy transfer is E− = 0. The limits for the momentum transfer are:
which correspond to complete forward (ℏk−) or backward (ℏk+) scattering.
The displacement of the center of the electron cloud from its nucleus is
This expression corrects misprints appearing in Ref. (Heredia-Avalos and Garcia-Molina, 2002), which did not affect its results.
The electron capture and loss processes can also lead to additional energy losses. For both protons and alpha particles, an approximate model to account for this energy loss was implemented in Ref. (Denton et al., 2008b), based on the charge-exchange cross section from Ref. (Brandt and Sizmann, 1975). The electron capture and loss (C&L) contribution, if only single-electron exchange processes are considered, is given by (Denton et al., 2008b):
where σi→j are the cross sections for electron loss or capture, changing from the charge state i to the j, and ΔTi→j is the energy loss associated to these processes. When charge equilibrium is reached, ϕq(T) σq→q+1(T) = ϕq+1(T) σq+1→q(T), so the previous expression reduces to:
The energy lost by the projectile in an electron loss and capture cycle can be estimated as
The loss cross section for K-shell electrons (for hydrogen and helium ions, in our case) (Brandt and Sizmann, 1975; Chateau-Thierry et al., 1976) is given, following Ref. (Denton et al., 2008b), by:
where nK is the number of K-shell electrons in the projectile, v0 is the Bohr velocity, v is the projectile velocity, ϒ is a screening length (introduced in the next paragraph), and Zt is the target’s atomic number.
The Fourier transform of the electronic density ρq(k) is obtained here through the modified Brandt-Kitagawa approach (Brandt, 1982), which is suitable for ions with 1 or 2 bound electrons:
Here, the screening length ϒ is given by (Brandt, 1982):
with a0 being the Bohr radius.
4.2 Electron projectiles
One of the main aspects that influences the energy loss for primary electrons (i.e., projectiles) is their indistinguishability from the secondary electrons (i.e., those resulting from the ionisation of the target atoms). This affects their maximum energy loss E+ in two ways. First, the primary electron moves in the conduction band of the metal with a kinetic energy T that is measured from the bottom of that band, which is filled with target electrons up to the Fermi energy EF. Therefore, Pauli’s exclusion principle forbids that the primary electron losses an energy larger than T − EF, as otherwise it would fall into already occupied levels.
Apart from this, any energy loss E that results in the transition of a bound electron from a band with binding energy Ba to the conduction band, with final kinetic energy W = E − Ba, results into two indistinguishable electrons. By convention, the primary electron is always the most energetic one after the collision, so this situation imposes an additional restriction to the maximum energy loss E+,a = (T + Ba)/2. Since this maximum energy loss is now shell-dependent through Ba, Eqs. (3), (4) and (5) have to be rewritten for electron projectiles, within the FBA, as:
and:
Notice that we have recovered in these equations the subscript FBA because, later on, we will introduce corrections to the first Born approximation. For any intra- or interband transition, the energy integration limits are:
where the subscript ‘a’ refers either to an outer-shell Mermin function i or to an inner-shell with quantum numbers nl of an atom j, with Ba = Eth,i for the former and
The integration limits for the momentum transfer are given by Eq. (15).
The FBA ignores the electron exchange and interference terms in Eq. (1). However, for primary electrons with an energy closer to that of the target electrons (
where d2ΛFBA(T, E, k)/dE dk ∝|f|2 and d2Λxc(T, E, k)/dE dk ∝|g|2 − Re[fg*].
Despite the existence of more rigorous and complex methodologies accounting for the exchange amplitude (Rudge, 1968; Emfietzoglou et al., 2017), Ochkur developed convenient analytical approximations (based on the Born-Oppenheimer perturbation treatment (Oppenheimer, 1928)), which are proportional to the FBA direct amplitude (Ochkur, 1965). The Born-Ochkur (BO) exchange amplitude for the ionisation process is given by (Ochkur, 1965; Prasad, 1965; Rudge, 1968):
where fFBA denotes the direct scattering amplitude calculated within the FBA,
where:
which reproduces the classical Mott exchange for binary collision theory (Rudd et al., 1996) at high electron energies and is similar to the expression for ionisation given by Fernández-Varea et al. (Fernández-Varea et al., 1993). Note, however, that plasmon or collective excitations are distinguishable from the primary electron, so in this case Fxc (T, k) = 0.
Additionally, for primary electrons with energies T ≤ 100 eV, primary and secondary electrons may have similar kinetic energies, so the FBA expressions, Eqs. (22), (23), and (24), require further corrections to increase their accuracy. Some theoretical approaches have been developed to try to account for these corrections (Emfietzoglou et al., 2017), although usually they result too complex to be easily generalised to arbitrary materials. As a consequence, other simpler phenomenological approaches are usually preferred (Emfietzoglou and Nikjoo, 2005). In this work, we implement a classical Coulomb-field correction, in which the primary electron gains an additional amount of potential energy due to the interaction with the field of the target atoms, then increasing its kinetic energy T to T ′ as (Emfietzoglou and Nikjoo, 2005):
where Ba is the electron binding energy (Ba = Eth,i for the target outer shells and
As a result of the above low-energy corrections to the FBA plus addition of the exchange term, the inverse mean free path for electrons is finally written as:
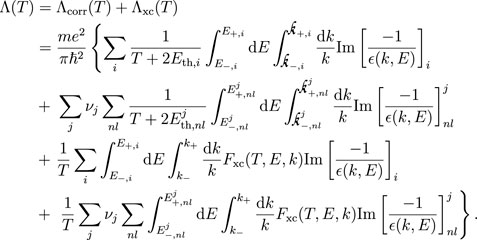
Similar expressions arise for the stopping power S(T) = Scorr(T) + Sxc(T) and the energy-loss straggling

with Ba = Eth,i for the outer shells and
5 Results and discussion
In the following, the methodology described above will be used to obtain the stopping power and energy-loss straggling of protons and alpha particles, as well as the inelastic cross section (ICS), stopping power and energy-loss straggling of electrons in the bulk (i.e., neglecting surface effects) metals Al, Fe, Cu, Mo, Pt and Au. Rather than discussing the results for the metals in order of ascending atomic number, we rather proceed in a way that facilitates the discussion of the different physical considerations involved. The materials whose electron inelastic mean free paths were already analysed in Ref (de Vera and Garcia-Molina, 2019). (Al, Au and Cu, which results for protons and alpha particles also prsented here) are discussed first, and then continue with the other targets Mo, Fe, and Pt. Aluminum will serve to discuss the nature of collective excitations for electrons, as well as the role of electron capture and loss, and polarisation processes for ions. With gold, the importance of low-energy corrections to the dielectric formalism for electrons will become evident. Copper, molybdenum, iron and platinum will serve to discuss the possible influence of surface excitations for low energy electrons (when required for some experimental situations), as well as to point out the influence of different and conflicting experimental datasets for the optical ELF of the materials.
The main physical properties of the targets analysed are gathered in Table 1, namely, atomic number Zt, atomic weight At, mass density ρt, Fermi energy EF, and bulk plasmon energy Epl. As outer- and inner-shell electron excitations are treated differently in our model (see section 3), we specify in Table 2 which shells are considered as outer or as inner for each material. An additional fundamental property of each metal can be obtained from the integration of its optical ELF over the entire excitation energy range, namely, the mean excitation energy I (Shiles et al., 1980):
which is the main parameter determining the stopping power at high ion or electron energies through the Bethe equation (Inokuti, 1971). In Table 3 the values of I obtained in this work for each target, from different sources of the optical experimental ELF (Palik and Ghosh, 1999; Werner et al., 2009; Pauly et al., 2020; Xu et al., 2017), are presented and compared to the values compiled in the ICRU Reports 37 (Berger et al., 1984) and 49 (ICRU, 1993). These I -values correspond to substances in the condensed phase, and the uncertainties reported by ICRU attempt to take into account the uncertainties of the underlying measurements, the errors inherent to the data analysis and the dispersion in the I-values derived from various sources.
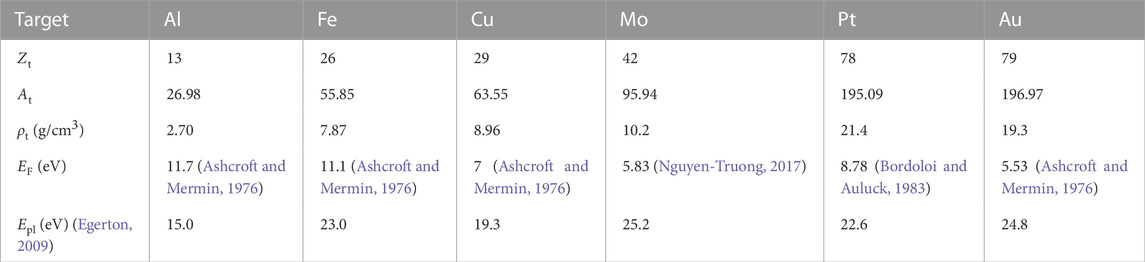
TABLE 1. Physical properties of the targets discussed in this work: atomic number (Zt), atomic mass (At), mass density (ρt), Fermi energy (EF) and plasmon energy (Epl).
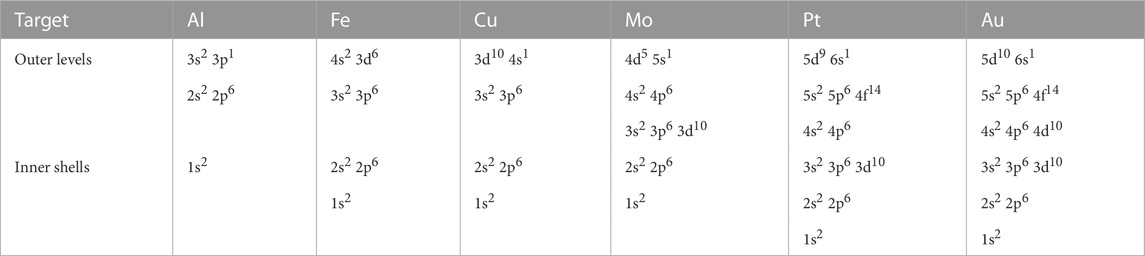
TABLE 2. Outer and inner excitation levels of the targets described by the MELF-GOS model.
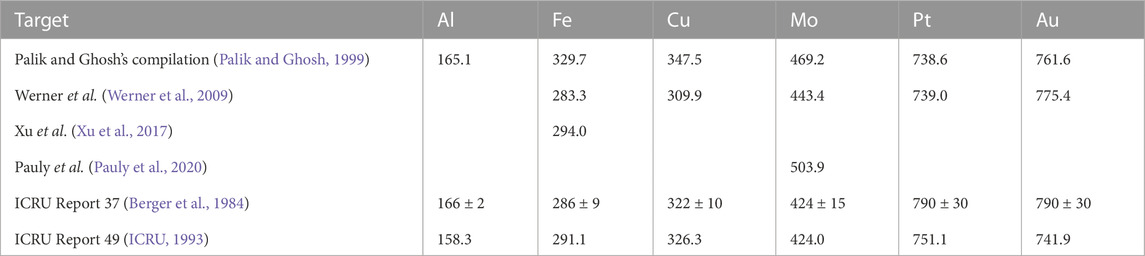
TABLE 3. Mean excitation energy I (in eV) of the metals discussed in this work, obtained by the MELF-GOS model from different sources of the optical ELF. Values appearing in ICRU Reports 37 (Berger et al., 1984) and 49 (ICRU, 1993) are also provided for comparison purposes.
5.1 Aluminum
Aluminum is a paradigmatic free electron-like metal, whose spectrum is dominated by an intense plasmon excitation at
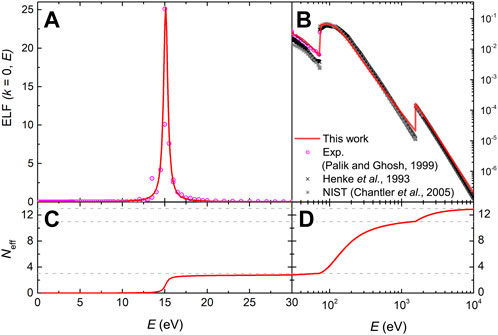
FIGURE 1. (A) and (B): Optical ELF (k = 0) of Al as a function of the excitation energy E. Round magenta symbols are experimental data from Palik and Ghosh’s compilation (Palik and Ghosh, 1999) and the fit by the MELF-GOS model is depicted by a red solid line. Calculations from Henke (Henke et al., 1993) and NIST (Chantler et al., 2005) are also included. (C) and (D): effective number of electrons in Al as a function of the excitation energy E, as calculated from both datasets.
The effective number of electrons Neff in Al as a function of the excitation energy E, as calculated from the MELF-GOS fit, is depicted in Figures 1C, D. Dashed gray lines correspond to 3 electrons (outer shells), 11 electrons (where the K-shell excitations start) and 13 electrons (the total number of electrons). The MELF-GOS fitting allows to approximately assign Mermin functions to particular electronic excitations. In this case, we assumed that the first Mermin function accounts for the intense plasmon excitation, the second one for the interband transitions of the 3s and 3p electrons to the conduction band (which should be the ones appearing at lower excitation energies), while the third function represents the excitation of the semi-core 2p and 2s electrons to the conduction band. The excitation of the 1s inner-shell is modelled through the K-shell GOS. The quality of such an assignment can be assessed by means of their partial f-sum rules (obtained by means of Eq. (10) applied to each Mermin or GOS function), which are given in Table 4; these values are in excellent agreement with the results reported by Shiles et al. (Shiles et al., 1980). As can be seen, the first two Mermin functions nearly contain the 3 outermost 3p and 3s electrons, which mainly interact through the plasmon excitation. Similarly, the third Mermin function contains around the 8 expected 2p and 2s electrons.
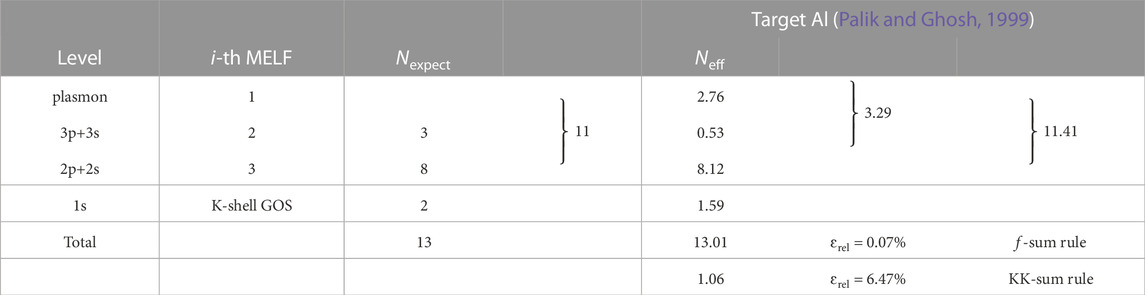
TABLE 4. Comparison of the expected number of electrons Nexpect in each excitation level of aluminum, and the corresponding effective number of electrons Neff, as obtained from Eq. (10) with the MELF-GOS model fit to the experimental optical ELF (Palik and Ghosh, 1999). The values of the f- and KK-sum rules (with their corresponding relative errors, compared to the expected values) appear in the last two rows.
In total, 11.41 outer-shell electrons are found. The slight excess of 0.41 electrons in the outer shells compensates for the electrons missing from the K-shell GOS. These differences arise from Pauli’s exclusion principle: as inner-shell electrons cannot transit to upper energy levels occupied by the outer-shell electrons, they lack some amount of oscillator strength; similarly, the outer electrons cannot decay to lower energy levels occupied by the inner-shell electrons, thus lacking some amount of negative oscillator strength (Egerton, 2011). This is a general feature for all materials, which makes the number of electrons in the outer shells always slightly larger than expected. Overall, each assumed transition contains nearly the expected number of electrons, and the total f-sum rule is fulfilled within a negligible relative error (ɛrel = 0.07%). The error in the KK-sum rule is larger (ɛrel = 6.47%), but still within a tolerable level. Furthermore, for the mean excitation energy we obtain a value of I = 165.1 eV, which is in reasonable agreement with the values appearing in ICRU Reports 37 (Berger et al., 1984) and 49 (ICRU, 1993) (see Table 3). All the previous validates the experimental optical ELF, as well as the partial excitation assignment in terms of the MELF-GOS model. Please note that the ELF data obtained in this work go up to excitation energies of 30 keV. We have checked that the integrals over the ELF, at this upper energy range, increase around 10–5% per energy step, while at the bottom of the range these increments can be as high as 100% or more, so at 30 keV all integrals are converged, as can be seen in Figure 1D. The same applies to the rest of metals analysed in this work.
The ELF of Al obtained by means of the MELF-GOS methodology over the whole (k, E) plane is used to calculate the stopping power of protons and alpha particles as explained in Section 4.1. In Figures 2A,B our results are shown by red solid lines, which are compared with available experimental data, depicted by letters, from the extensive database gathered by the late Helmut Paul (International Atomic Energy Agency Nuclear Data Services, 2021), now maintained by the International Atomic Energy Agency. The latest measurements by Moro et al. (Moro et al., 2016) are also included in the figure, although they are completely indistinguishable from the overlapped data from the database. Our theoretical results agree with the experiments at energies larger than around 50 keV/u including the region of the maximum stopping power. The underestimation at lower energies may be due to the possible inaccuracy of the dielectric formalism at this energy range, or perhaps to the existence of negatively charged ions due to electron capture and loss processes in aluminum (Penalba et al., 1992), a case that is not considered in our model. The insets of Figures 2A,B compare our calculations with the most recent experimental data around the maximum of the stopping power curve, for protons (Eppacher and Semrad, 1992; Martínez-Tamayo et al., 1996; Shiomi-Tsuda et al., 1999; Møller et al., 2002) and for helium ions (Bianconi et al., 2005; Hsu et al., 2005; Diwan and Kumar, 2015; Moussa et al., 2015; Trzaska et al., 2018), where it can be seen that our calculations are within error bars of the experiments above
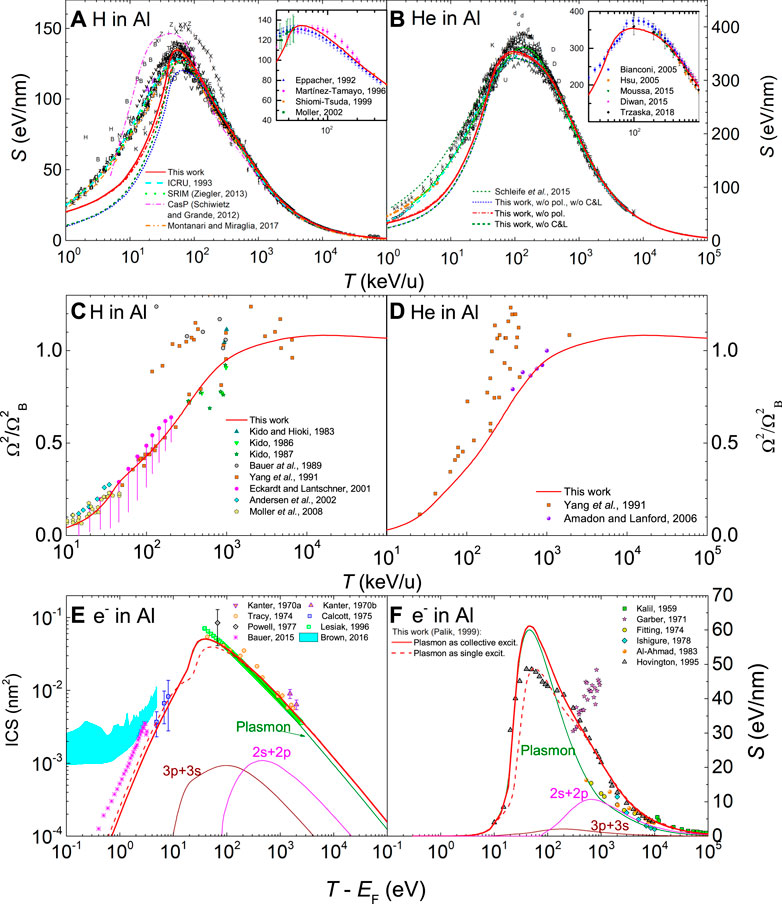
FIGURE 2. Energy-loss quantities for charged particles in Al as a function of energy: (A) electronic stopping power for H and (B) for He, (C) electronic energy-loss straggling for H and (D) for He, (E) inelastic cross section (ICS) for electrons and (F) stopping power for electrons. Red solid lines correspond to calculations from the dielectric formalism with the MELF-GOS model fit to the experimental optical ELF (Palik and Ghosh, 1999). A comparison with experimental data (symbols) is made for ions stopping power (International Atomic Energy Agency Nuclear Data Services, 2021) (the insets show the corresponding stopping power around its maximum value for the most recent experimental data (Eppacher and Semrad, 1992; Martínez-Tamayo et al., 1996; Shiomi-Tsuda et al., 1999; Møller et al., 2002; Bianconi et al., 2005; Hsu et al., 2005; Diwan and Kumar, 2015; Moussa et al., 2015; Trzaska et al., 2018)), ions straggling (Kido and Hioki, 1983; Kido, 1986; Kido, 1987; Bauer et al., 1989; Yang et al., 1991; Yang et al., 1991; Eckardt and Lantschner, 2001; Andersen et al., 2002; Amadon and Lanford, 2006; Møller et al., 2008), electrons ICS (Kanter, 1970b; Kanter, 1970a; Tracy, 1974; Callcott and Arakawa, 1975; Powell et al., 1977; Lesiak et al., 1996; Bauer et al., 2015) and electrons stopping power (Kalil et al., 1959; Garber et al., 1971; Fitting et al., 1974; Ishigure et al., 1978; Al-Ahmad and Watt, 1983; Hovington et al., 1996; Joy, 1995), as well as with other theoretical models (ICRU, 1993; Grande and Schiwietz, 2002; Schiwietz and Grande, 2012; Ziegler, 2013; Schleife et al., 2015; Brown et al., 2016; Montanari and Miraglia, 2017). For the other lines, please see details on the text.
We further report results from the present model in Figures 2A,B, but without considering some of the terms appearing in Eq. (12), i.e., ignoring both the energy losses due to the projectile polarisation and the electron capture and loss processes (dotted blue line), only ignoring polarisation (dash-dotted red line) and only ignoring capture and loss (dashed dark green line). As can be seen, disregarding these processes makes the calculated stopping power noticeably deviate from the experimental data around and below the maximum (T ≤ 200 keV/u). For protons, both processes present similar contributions around the maximum, with capture and loss having an increasing influence at lower energies. For helium ions polarisation has an almost negligible contribution.
Results from other widely used codes are also included in Figures 2A,B. The cyan dashed line corresponds to the stopping values recommended by the International Commission on Radiation Units and Measurements (ICRU) (ICRU, 1993) based on the PSTAR and ASTAR programs, where the stopping power at the lower energies is based on a fit to experimental data, extrapolated to high energies using a corrected Bethe equation. The dotted green line depicts the results of the semiempirical code SRIM (Ziegler, 2013). Results of the CasP code within the Unitary Convolution Approximation (UCA) by Grande and Schiwietz (Grande and Schiwietz, 2002; Schiwietz and Grande, 2012) are depicted by a magenta dot-dashed line. The orange dot-dot-dashed line corresponds to dielectric calculations for protons by Montanari and Miraglia (Montanari and Miraglia, 2017) where, for low and intermediate energies, a nonlinear model based on a central screened potential for a projectile moving in a free-electron gas was used. We note the similarity between Montanari and Miraglia’s and our calculations at energies around the maximum stopping power and beyond, and our departure from them and from experiments for T ≤ 40 keV/u. This may point to the deficiencies of the dielectric formalism at this low energy range, due to its lack of nonlinearity. First-principles calculations based on real-time propagation within time-dependent density functional theory are shown by a short-dashed olive line (Schleife et al., 2015) for He in crystalline aluminum at energies lower than 40 keV/u. Overall, our methodology based on the dielectric formalism provides reliable stopping powers both for protons and alpha particles for energies larger than 40 keV/u, covering the maximum of the stopping curve and all larger energies within a single theoretical formalism, without any particular fitting to experimental data (apart from that to the ELF in the optical limit).
In Figures 2C,D we present results for the energy-loss straggling of H and He beams in Al as a function of the ions kinetic energy. High energy ions present an asymptotic value, known as Bohr straggling,
The results for the inelastic cross section (ICS) and stopping power for electrons in aluminum (based on the same model ELF, and obtained according to the procedures explained in section 4.2) are shown by red solid lines in Figures 2E,F. The theoretical ICS is compared with available experimental data (symbols) (Kanter, 1970b; Kanter, 1970a; Tracy, 1974; Callcott and Arakawa, 1975; Powell et al., 1977; Lesiak et al., 1996; Bauer et al., 2015) in the panel E, where also a comparison with the results of ab initio calculations is included (Brown et al., 2016). We obtain an excellent agreement with experiments down to energies as low as 5 eV above the Fermi energy. The contributions of the plasmon and electronic transitions to the ICS are also presented by thin solid lines. Clearly, the plasmon excitation at around 15 eV makes the main contribution to the ICS over the entire energy range, with the contribution from the semi-core 2s and 2p shells slightly increasing the cross section for energies larger than 300 eV.
The panel F of Figure 2 reports by a thick solid line the calculated stopping power of electrons in aluminum, along with the contribution from each type of excitation (thin lines). Again, at energies around and lower than the maximum stopping power the main contribution comes from the collective plasmon excitation, while interband transitions from the 2s and 2p bands only have an influence at high energies. The comparison with available experimental data (symbols) at energies higher than 200 eV (Kalil et al., 1959; Garber et al., 1971; Fitting, 1974; Ishigure et al., 1978; Al-Ahmad and Watt, 1983) is satisfactory, especially at energies
The comparison of our calculations and the experimental data for the ICS for the case of electrons in aluminum allows us to discuss the role of collective electronic excitations, as this material is basically dominated by its bulk plasmon. Particularly, for a long time there has been a controversy around the maximum energy loss which is allowed for primary electrons in metals (Denton et al., 2008a; Bourke and Chantler, 2012; Nguyen-Truong, 2013; de Vera and Garcia-Molina, 2019). While in a previous work of our group we considered the latter to be given by E+ ∼ T/2 due to indistinguishability (Denton et al., 2008a) (see Section 4.2), Bourke and Chantler considered that excitations in metals are dominated by collective excitations, thus making this limit too restrictive (Bourke and Chantler, 2012). They then assumed that it has to be determined exclusively by Pauly’s exclusion principle as E+ = T − EF. In Figure 2E, the solid lines show the calculations assuming the limit E+ = T − EF for the plasmon excitation (which dominates the spectrum), while the dashed lines use the limit E+ = T/2. As can be seen for the ICS, calculations reproduce very well the experimental data over the entire energy range when the maximum energy loss for the plasmon excitation is solely determined by Pauly’s exclusion principle, confirming Bourke and Chantler’s hypothesis (Bourke and Chantler, 2012) for the case of Al. Results for other metals in the following subsections, where interband transitions coexist with the plasmon, will serve to further elucidate this issue. Regarding the stopping power, it should be noted in panel F of Figure 2 that when the maximum energy loss is (incorrectly) considered to be solely determined by exchange, our calculations converge with those by Hovington et al. (Hovington et al., 1996; Joy, 1995), who probably used the same upper limit (E+ ≃ T/2).
Experimental measurements for the stopping power of low energy electrons would be needed to further assess the current calculations around the maximum of the energy loss. However, experimental measurements over the entire energy range are available for the ICS, which coincide very well with our calculations, supporting the assumptions of our energy-loss model for the case of electron projectiles.
Figure 3 shows by lines the calculated energy-loss straggling for electrons in all the materials studied in this work. The black solid line corresponds to the case of Al, based on the experimental optical ELF. Unfortunately, it has been impossible for us to find experimental information on the energy-loss straggling for electron beams. However, Ashley et al. (Ashley et al., 1975) reported theoretical calculations, which are depicted in the figure by a gray dash-dotted line. As can be seen, both curves are rather close, which indicates that these probably provide reasonable estimates of the energy-loss straggling for electrons in Al. It would be desirable to perform experimental measurements of this quantity.
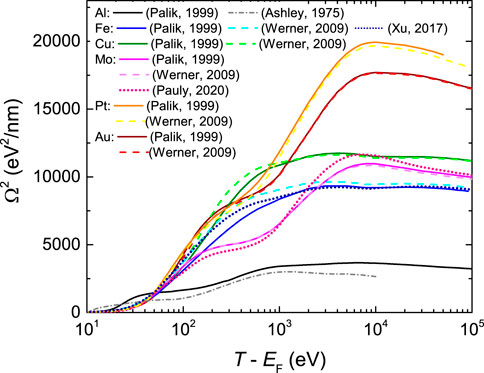
FIGURE 3. Electronic energy-loss straggling of electrons in all metals studied in this work, as a function of the incident energy. Solid lines correspond to calculations using the experimental optical ELF from Ref. (Palik and Ghosh, 1999), dashed lines are calculations based on the ELF obtained from REELS experiments (Werner et al., 2009), and the dotted lines for Mo and Fe are additional calculations using the optical ELFs from Refs. (Pauly et al., 2020; Xu et al., 2017), respectively. The grey dash-dotted line for Al depicts a previous calculation by Ashley et al. (Ashley et al., 1975).
Once all the calculated results have been presented for H, He and electron beams in Al, we emphasize the fact that it is possible to provide empirical fitting formulas for all the quantities, i.e., stopping power, straggling, and inelastic cross section. Such a fitting is very convenient for the straightforward implementation of these energy-loss quantities in Monte Carlo codes. We provide in the Supplementary Material a description of all the empirical formulas used, and we provide in tabular form the parameters that can be used to fit all the calculated results. This has been done for aluminum, as well as for the rest of metals analysed in the rest of the manuscript.
5.2 Gold
Now we turn our attention to gold, which is a very important material, whose complex excitation spectrum contains both collective excitations as well as intra- and interband transitions. Two important experimental sources for the optical ELF of gold exist (Palik and Ghosh, 1999; Werner et al., 2009). Figures 4A, B depict by symbols the data from Palik and Ghosh’s compilation of refractive index and extinction coefficient (Palik and Ghosh, 1999) (magenta circles), together with the most recent data by Werner et al. (Werner et al., 2009) (blue squares) obtained from reflection electron energy-loss spectroscopy (REELS). Panel A shows in linear scale the complex excitation spectrum of the outer-shell electrons, whereas panel B depicts in log-log scale the excitation of the semi-core and inner shells. Calculations based on atomic data from Henke et al. (crosses) (Henke et al., 1993) and NIST (stars) (Chantler et al., 2005) are also included, which are only valid at large excitations energies.
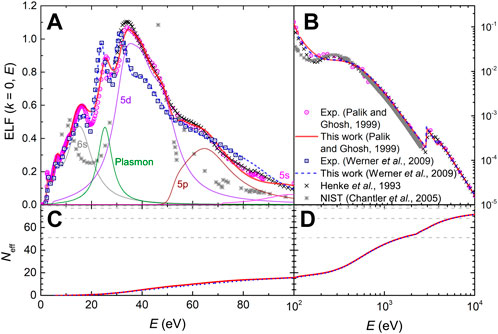
FIGURE 4. (A) and (B): Optical energy-loss function, ELF (k = 0, E), of Au as a function of the energy transfer E. The experimental data come from Palik and Ghosh compilation (Palik and Ghosh, 1999) (magenta circles), and from Werner et al. (Werner et al., 2009) (blue squares); solid lines correspond to the fit by the MELF-GOS model. Calculations from Henke et al. (Henke et al., 1993) (black crosses) and NIST (Chantler et al., 2005) (gray stars) are included. (C) and (D): Effective number of electrons, Neff, in Au as a function of the excitation energy E, as obtained from both datasets (Henke et al., 1993; Chantler et al., 2005).
The thick solid red and dashed blue lines in Figure 4 represent the MELF-GOS fittings to these two sets of experimental data for Au, where the K, L and M electron shells are treated by GOS. The outer-shells are described by a sum of Mermin-type ELFs which, as in the case of Al, have been assigned to particular excitation channels. Thin lines in Figure 4A depict the Mermin functions attributed to each excitation (for the particular case of the fitting to Palik and Ghosh’s data (Palik and Ghosh, 1999)), and a summary of the assignment is given in Table 5. First of all, the plasmon energy of 24.8 eV has been taken from Ref. (Egerton, 2011), which coincides with the main second peak in the spectrum. The rest of main features of the optical ELF are attributed following the order of growing binding energies for the different atomic shells (Chantler et al., 2005). Features below 20 eV are attributed to the excitation of the outermost 6s electrons to the conduction band, those immediately above the plasmon energy to the 5d excitations (as also done for Au by Verkhovtsev et al. (Verkhovtsev et al., 2015)), then the 5p electrons above 45 eV and the 5s above 80 eV. The excitation of the semi-core levels 4s, 4p, 4d and 4f is contained in the broad feature above 100 eV. Please note that different assignements of the peaks in the spectrum of gold have been proposed in other references [see e.g. Ref. (Taioli et al., 2023)], and that the current assignment may be subject to revision in future work. The fitting parameters are given in Supplementary Tables S2, S3 in the Supplementary Material.
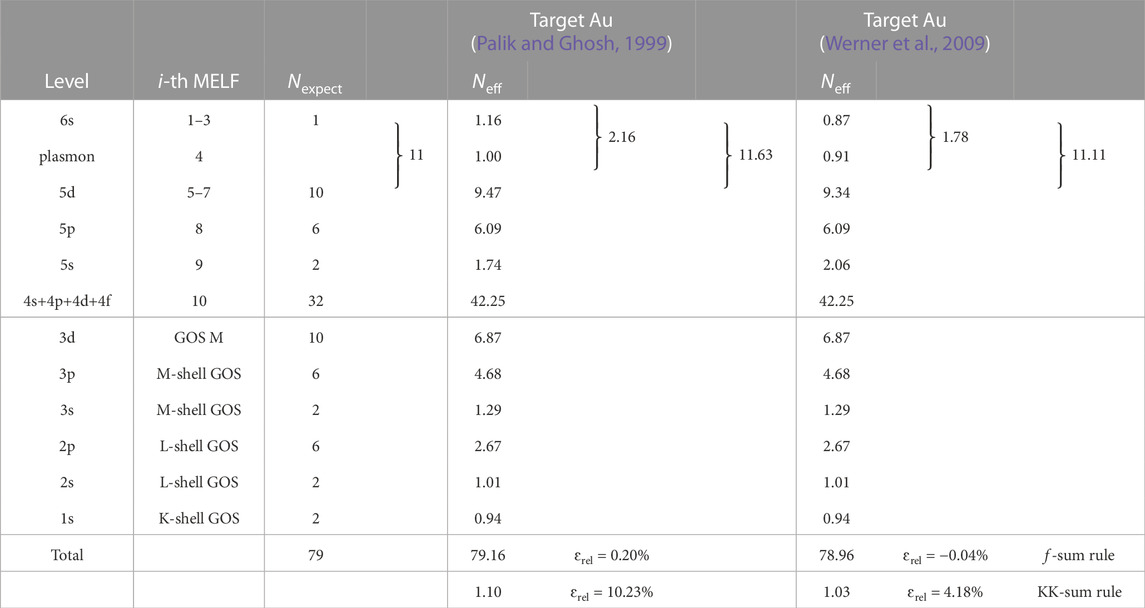
TABLE 5. Comparison of the expected number of electrons Nexpect in each excitation level of gold, and the corresponding effective number of electrons Neff, as obtained from Eq. (10) with the MELF-GOS model fit to the experimental optical ELF from Palik and Ghosh (Palik and Ghosh, 1999) and Werner et al. (Werner et al., 2009). The values of the f- and KK-sum rules appear in the last two rows.
In Figures 4C, D, the effective number of electrons Neff, Eq. (10), is plotted as a function of the transferred energy E. As can be seen, the fitting to both datasets for the optical ELF leads to the correct atomic number at high excitation energies. Thin grey dashed lines correspond to 51 electrons (including the outer shells as well as the semi-core electrons 4s, 4p, 4d, and 4f, all described by MELF), 69 (including the M-shell electrons), 77 (with the L-shell electrons already accounted for) and 79 electrons (the total number of electrons in Au). The results of the evaluation of individual f-sum rules for each excitation are gathered in Table 5, together with the total sum rules, for the optical ELFs by Palik and Ghosh (Palik and Ghosh, 1999) and Werner et al. (Werner et al., 2009). The total errors in the f-sum rules are very small for both sets of data, although the total KK-sum rule is better fulfilled for the case of Werner et al.’s data (Werner et al., 2009), which may indicate a better representation of the optical ELF at low excitation energies.
Let us take a closer look to the number of electrons contained in the outermost shells. Particularly, we should consider together excitation of the 6s and 5d electrons together with the plasmon, as both 6s and 5d electrons may contribute to the bulk plasmon. As can be seen in Table 5, for both Palik and Ghosh’s (Palik and Ghosh, 1999) and Werner et al.‘s ELF (Werner et al., 2009) the plasmon is built up mainly by 2s electrons, with a small contribution coming from 5d electrons. The third Mermin function sums up, in both cases, almost the 10 electrons expected in the 5d shell. In any case, for both experimental ELFs, the three first functions contain nearly the 11 6s+5d expected electrons. However, Werner et al.‘s data (Werner et al., 2009) matches slightly better the expected number of 6s+5d electrons, which could be related to the better fulfillment of the overall KK-sum rule. For the rest of shells, both sets of optical ELFs satisfy rather well the expected number of electrons, with a slight greater agreement in the REELS data for the 5s shell. Again, the electrons missing from the inner-shell GOS are redistributed among the outer-shell Mermin functions. The mean excitation energies obtained from optical (I = 761.6 eV) and REELS data (I = 775.4 eV) are both in between the values recommended by ICRU37 (I = 790 ± 30 eV) (Berger et al., 1984) and ICRU49 (I = 741.9 eV) (ICRU, 1993).
Once the two sources of optical ELFs for Au have been analysed, they can be extended to arbitrary momentum transfers by means of the MELF-GOS method in order to obtain the stopping power for protons and alpha particles. The results are depicted by solid red lines (using Palik and Ghosh’s ELF (Palik and Ghosh, 1999)) and by dotted blue lines (using Werner et al.‘s ELF (Werner et al., 2009)) in Figures 5A,B. As the two optical ELFs are not radically different, they provide very similar results, which are in rather good agreement with the large collection of experimental data (letters) (International Atomic Energy Agency Nuclear Data Services, 2021) almost in the entire energy range, both for protons and helium ions. The insets present the most recent experimental data around the maximum stopping power with the corresponding error bars, for protons (Semrad et al., 1990; Eppacher and Semrad, 1992; Martínez-Tamayo et al., 1996; Heredia-Avalos et al., 2007; Denton et al., 2008a; Primetzhofer, 2012) and alpha particles (Trzaska et al., 2002; Hsu et al., 2004; Heredia-Avalos et al., 2007; Zhang et al., 2005; Primetzhofer, 2012; Kumar et al., 2018; Trzaska et al., 2018), which are in a fair agreement with our calculations. The results of other widely used codes are also displayed: the recommended values of ICRU49 (ICRU, 1993) are shown by a cyan dashed line, the semiempirical results from SRIM (Ziegler, 2013) by a dotted green line, the theoretical model from Montanari et al. (Montanari et al., 2009) by an orange dash-dot-dotted line, as well as the Casp 5.2 calculations by Grande and Schiwietz (Schiwietz and Grande, 2012) by a magenta dash-dotted line. As for Al, for proton energies similar and larger than the maximum stopping power, our results agree well with those by Montanari et al. (Montanari et al., 2009), although this time with smaller deviations at lower energies as well as in better agreement with the experiments.
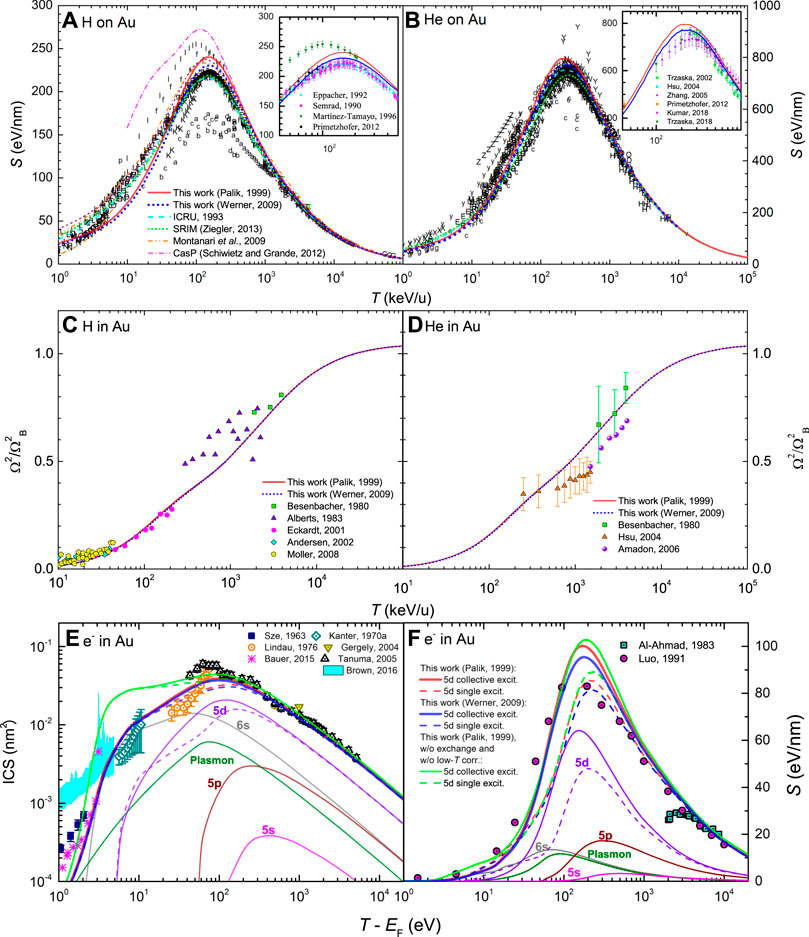
FIGURE 5. Energy-loss quantities for charged particles in Au as a function of energy: (A) electronic stopping power for H and (B) for He, (C) electronic energy-loss straggling for H and (D) for He, (E) inelastic cross section (ICS) for electrons and (F) stopping power for electrons. Red solid and blue dotted lines correspond to calculations from the dielectric formalism with the MELF-GOS model fit to the experimental optical ELF from Refs. (Palik and Ghosh, 1999; Werner et al., 2009), respectively. A comparison with experimental data (symbols) is made for ions stopping power (International Atomic Energy Agency Nuclear Data Services, 2021) (the insets show the corresponding stopping power around its maximum value for the most recent experimental data (Semrad et al., 1990; Eppacher and Semrad, 1992; Martínez-Tamayo et al., 1996; Trzaska et al., 2002; Hsu et al., 2004; Heredia-Avalos et al., 2007; Heredia-Avalos et al., 2007; Denton et al., 2008a; Zhang et al., 2005; Primetzhofer, 2012; Primetzhofer, 2012; Kumar et al., 2018; Trzaska et al., 2018)), ions straggling (Besenbacher et al., 1980; Alberts and Malherbe, 1983; Eckardt and Lantschner, 2001; Andersen et al., 2002; Hsu et al., 2004; Amadon and Lanford, 2006; Møller et al., 2008), electrons ICS (Sze et al., 1963; Kanter, 1970b; Lindau et al., 1976; Gergely et al., 2004; Tanuma et al., 2005; Bauer et al., 2015) and electrons stopping power (Al-Ahmad and Watt, 1983; Luo et al., 1991), as well as with other theoretical models (Montanari et al., 2009; Schiwietz and Grande, 2012; Ziegler, 2013; Brown et al., 2016). For the other lines, please see details on the text.
Figures 5C,D shows the energy-loss straggling of H and He beams in Au. Red solid lines depict our calculated results based on the experimental optical ELF by Palik and Ghosh (Palik and Ghosh, 1999), while dotted blue lines correspond to Werner et al.’s ELF (Werner et al., 2009). Symbols depict experimental data (Besenbacher et al., 1980; Alberts and Malherbe, 1983; Eckardt and Lantschner, 2001; Andersen et al., 2002; Hsu et al., 2004; Amadon and Lanford, 2006; Møller et al., 2008), The lines reproduce very well the experimental points, very often within error bars. The experimental datasets are less scattered in this case, supporting the reliability of our calculations.
Regarding electron projectiles, Figure 5E shows the results of the inelastic cross section (ICS) in Au. The symbols correspond to experimental data (Sze et al., 1963; Kanter, 1970b; Lindau et al., 1976; Gergely et al., 2004; Tanuma et al., 2005; Bauer et al., 2015) and the cyan shaded region depicts results from ab initio calculations (Brown et al., 2016). The dashed red and blue lines in this figure represent our calculations as described in Section 4.2, using Palik and Ghosh’s (Palik and Ghosh, 1999) and Werner et al.’s (Werner et al., 2009) optical ELFs, respectively; thin lines depict the contributions from the different excitation channels. In this case, despite the plasmon has a noticeable contribution, the ICS is dominated by the excitation of the 6s electrons at low energies and by the 5d electrons around the maximum and larger energies. These calculations (which are not very dependent on the optical ELF used for Au) agree well with the experimental data for energies
Surprisingly, the calculated ICS for electrons in Au agrees rather well with experimental data down to energies as low as 2 eV above the Fermi energy, while the dielectric formalism is not expected to work as well in this energy range. At this point, it is reasonable to wonder if this is due to the use of exchange and low-energy corrections in our formalism (Section 4.2). Figure 5E shows by a green line our results when such exchange and low-energy corrections are not used. As can be seen, the agreement with experimental data (especially in the 5–10 eV range) is significantly worsened, what supports the algorithms implemented in this work for these low-energy corrections to the dielectric formalism.
Figure 5F presents the results for the stopping power of electrons in Au, where experimental data are shown by symbols (Al-Ahmad and Watt, 1983; Luo et al., 1991). As in the case of the ICS, red and blue lines correspond to calculations using Palik and Ghosh’s (Palik and Ghosh, 1999) or Werner et al.’s (Werner et al., 2009) optical ELFs, considering (solid) and not considering (dashed) the 5d-electron excitations as collective. The green line corresponds to the calculation without including exchange and low-energy corrections. For the stopping power, these low-energy corrections are not as crucial as for the ICS (as stopping power arises mainly from the excitation of higher-energy shells), but the individual or collective character of the 5d-electron excitations changes significantly the stopping power for energies ≤500–1,000 eV. The agreement with the experimental data by Al-Ahmad et al. (Al-Ahmad and Watt, 1983) at high energies (
Our calculated energy-loss straggling for electrons in Au is shown in Figure 3, for the two sets of ELF, as indicated in the figure caption.
5.3 Copper
In the case of copper, we now face a more noticeable discrepancy in its optical ELFs, depending whether it comes from optical parameters measurements (Palik and Ghosh, 1999) or from REELS experiments (Werner et al., 2009). These ELFs are depicted, respectively, by magenta circles and blue squares in Figures 6A, B, in linear scale for the outer shells (A) and log-log scale for the semi-core and inner shells (B). Henke and Ghosh’s (crosses) (Henke et al., 1993) and NIST’s (stars) (Chantler, 2003) calculations based on atomic data are also included, which are valid at large excitation energies.
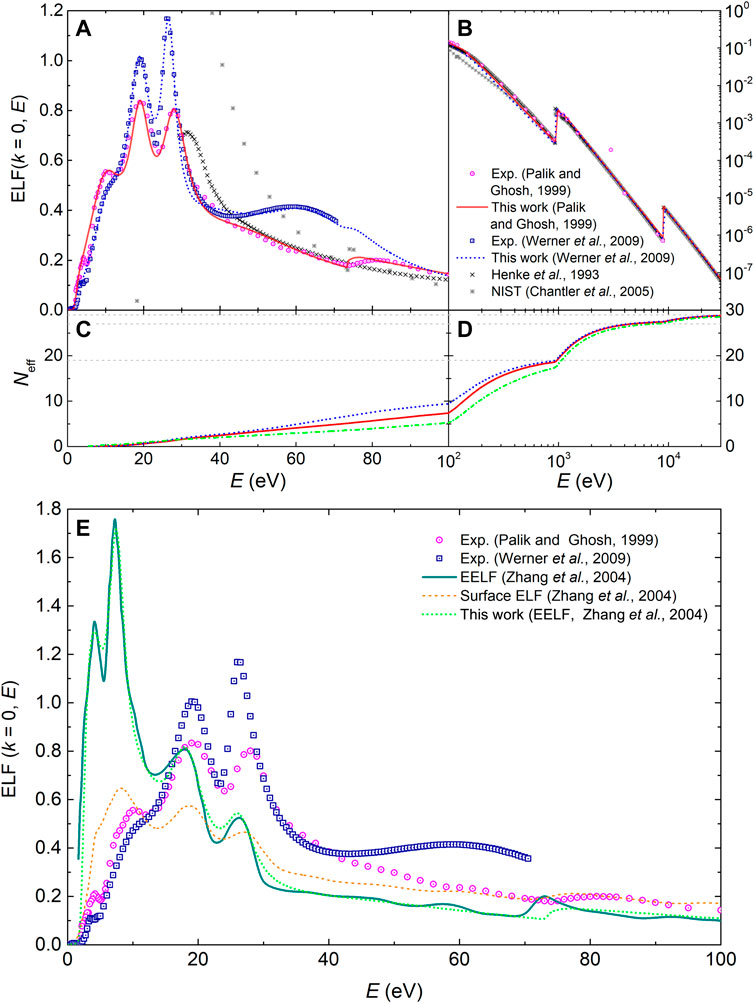
FIGURE 6. (A) and (B): Optical energy-loss function, ELF (k = 0, E), of Cu as a function of the energy transfer E. The experimental data from Palik and Ghosh’s compilation (Palik and Ghosh, 1999) (magenta circles) and from Werner et al. (Werner et al., 2009) (square blue symbols) are presented as well as the MELF-GOS fit to these experimental data. Calculations from Henke et al. (Henke et al., 1993) and the NIST (Chantler et al., 2005) are included. (C) and (D): Effective number of electrons in Cu as a function of the excitation energy E, obtained from the MELF-GOS model fitted to Palik and Ghosh (Palik and Ghosh, 1999) (red solid line), to Werner et al. (Werner et al., 2009) (blue dotted line) and to the effective ELF from Zhang (Zhang et al., 2004) (dash-dotted green line). (E) Effective optical ELF (k = 0) of Cu as a function of the excitation energy E derived from experimental REELS measurements (solid dark cyan line) (Zhang et al., 2004), and surface ELF (dashed orange line) (Zhang et al., 2004). The MELF-GOS model fitted to the effective ELF is presented by a dotted green line and other symbols are as in panels (A) and (B).
The MELF-GOS fitting to these data (solid red line for optical data, dotted blue line for REELS data in Figure 6) have been done assuming that the bulk plasmon is located at 19.3 eV (Egerton, 2011) (second major feature in the ELF). Excitation of the 4s electrons is at lower energies, and of 3d, 3p, and 3s electrons at larger energies in order of ascending binding energies. Inner-shell electrons 1s, 2s, and 2p are described by K and L GOS. The fitting parameters can be found in Supplementary Tables S3, S4 in the Supplementary Material.
As in the previous cases, the effective number of electrons as a function of the excitation energy are plotted in Figures 6C, D and the effective number of electrons per shell are those indicated in Table 6. For Cu, Palik and Ghosh’s optical ELF (Palik and Ghosh, 1999) provides a closer approximation to the 11 electrons expected in the excitation of the 4s and 3s shells (including the plasmon excitation) than Werner et al’s (Werner et al., 2009). Similarly, the errors both in the total f- and KK-sum rules are significantly smaller for the optical measurements dataset (Palik and Ghosh, 1999). Also, the mean excitation energy I can be obtained from the optical ELF from Eq. (34), getting the values of I = 347.5 eV for Palik and Ghosh’s ELF (Palik and Ghosh, 1999) and I = 309.9 eV for Werner et al.‘s ELF (Werner et al., 2009), which are in rather good agreement with the values recommended by ICRU37 (Berger et al., 1984) and ICRU49 (ICRU, 1993), see Table 3.
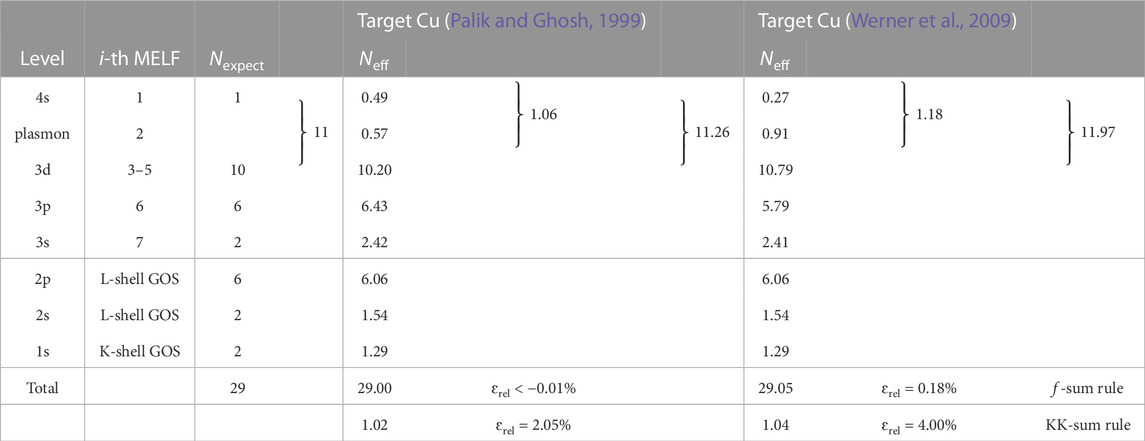
TABLE 6. Comparison of the expected number of electrons Nexpect in each excitation level of copper, and the corresponding effective number of electrons Neff, as obtained from Eq. (10) with the MELF-GOS model fit to the experimental optical ELF by Palik and Ghosh (Palik and Ghosh, 1999) or Werner et al. (Werner et al., 2009). The values of the f- and KK-sum rules appear in the last two rows.
Let us analyse the impact of both optical ELFs, extended to arbitrary momentum transfer by means of the MELF-GOS methodology, in the calculation of the stopping power of H and He ions in Cu. Figures 7A,B show by red solid and blue dotted lines the calculations done with the optical and REELS ELFs, respectively, together with the large compilation of experimental data (letters) (International Atomic Energy Agency Nuclear Data Services, 2021). For Cu, the slightly more intense ELF by Werner et al. (Werner et al., 2009) gives slightly larger stopping powers around the maxima as compared to Palik and Ghosh’s ELF (Palik and Ghosh, 1999), although both calculations are close to the cloud of experimental points in the entire energy range. The insets focus around the maxima of the stopping power, showing the most recent sets of experimental determinations with their error bars for H (Kido and Hioki, 1983; Semrad et al., 1983; Bauer et al., 1984; Khodyrev et al., 1984; Sirotinin et al., 1984; Semrad et al., 1986) and He (Desmarais and Duggan, 1984; Kuldeep and Jain, 1985; Harith et al., 1987; Majackij and Pucherov, 1988). In general, the calculations based on optical data seem to coincide somewhat better than those based on REELS data (which seems to go in line with the somewhat better fulfillment of the sum rules), although the differences are not very significant in any case. We also compare with the recommended values of ICRU49 (ICRU, 1993) (cyan dash line), the semiempirical SRIM2013 code (Ziegler, 2013) (green short-dotted line) and the theoretical model by Montanari and Miraglia (Montanari and Miraglia, 2013).
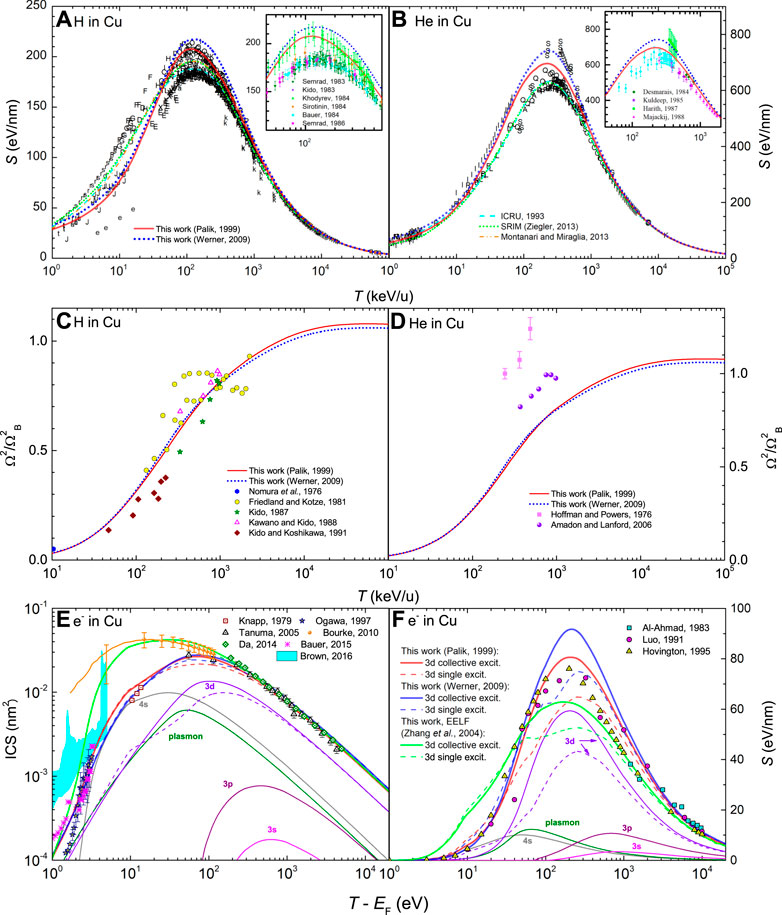
FIGURE 7. Energy-loss quantities for charged particles in Cu as a function of energy: (A) electronic stopping power for H and (B) for He, (C) electronic energy-loss straggling for H and (D) for He, (E) inelastic cross section (ICS) for electrons and (F) stopping power for electrons. Red solid and blue dotted lines correspond to calculations from the dielectric formalism with the MELF-GOS model fit to the experimental optical ELF from Refs. (Palik and Ghosh, 1999; Werner et al., 2009), respectively. A comparison with experimental data (symbols) is made for ions stopping power (International Atomic Energy Agency Nuclear Data Services, 2021) (the insets show the corresponding stopping power around its maximum value for the most recent experimental data (Kido and Hioki, 1983; Semrad et al., 1983; Bauer et al., 1984; Desmarais and Duggan, 1984; Khodyrev et al., 1984; Sirotinin et al., 1984; Kuldeep and Jain, 1985; Semrad et al., 1986; Harith et al., 1987; Majackij and Pucherov, 1988)), ions straggling (Hoffman and Powers, 1976; Nomura et al., 1976; Friedland and Kotze, 1981; Kido, 1987; Kawano and Kido, 1988; Kido and Koshikawa, 1991; Amadon and Lanford, 2006), electrons ICS (Sze et al., 1963; Kanter, 1970b; Lindau et al., 1976; Gergely et al., 2004; Tanuma et al., 2005; Bauer et al., 2015) and electrons stopping power (Al-Ahmad and Watt, 1983; Luo et al., 1991), as well as with other theoretical models (ICRU, 1993; Montanari and Miraglia, 2013; Ziegler, 2013; Brown et al., 2016). For the other lines, please see details on the text.
The energy-loss straggling of H and He beams in Cu appears in Figures 7C,D. Red solid lines depict our calculated results based on the experimental optical ELF by Palik and Ghosh (Palik and Ghosh, 1999), while dotted blue lines correspond to Werner et al.’s ELF (Werner et al., 2009). Experimental data are represented by symbols (Hoffman and Powers, 1976; Nomura et al., 1976; Friedland and Kotze, 1981; Kido, 1987; Kawano and Kido, 1988; Kido and Koshikawa, 1991; Amadon and Lanford, 2006). The lines agree well with the experimental data for protons, and reasonably reproduce the few data for helium.
Figure 7E shows the results for the ICS of electrons in Cu, calculated using the ELF from optical data (red lines) (Palik and Ghosh, 1999) and that from REELS (blue lines) (Werner et al., 2009), in comparison with a relatively wide collection of experimental data (symbols). In this case, there are experiments performed for energies larger than 50 eV (Tanuma et al., 2005; Da et al., 2014), and for lower energies there is a discrepancy between the classical experiments (Knapp et al., 1979; Ogawa et al., 1997; Bauer et al., 2015) and the most recent ones obtained from XAFS measurements (Bourke and Chantler, 2010), which differ in more than one order of magnitude. Ab initio calculations are also shown by a cyan shaded area (Brown et al., 2016) which, although very noisy, seem to correlate better with the classical experimental determinations. Dashed lines treat the 3d-electron excitations as individual, while solid lines as collective. Both sets of optical ELF give ICS which agree very well with the experimental data for energies
Our calculations (as well as the ab initio results from Ref (Brown et al., 2016)) seem to support the classical experimental data for the ICS of electrons in bulk Cu. However, the question arises of why there is such a big discrepancy with the most recent XAFS measurements by Bourke and Chantler (Bourke and Chantler, 2010). In Ref (de Vera and Garcia-Molina, 2019). we suggested that these most recent experiments may be affected in some way by surface excitations. In Figure 6E we plot, together with the two already discussed sets of optical ELF for Cu (Palik and Ghosh, 1999; Werner et al., 2009), the surface excitation ELF and the effective ELF (corresponding to 500 eV primary electrons) determined by Zhang et al. from REELS experiments (Zhang et al., 2004). The concept of effective ELF was developed as an empirical approximation to reproduce by simulations the REELS spectra obtained experimentally in conditions where surface excitations affect the energy spectrum of reflected electrons. As can be seen, the effective ELF (which depends on the energy of the primary electrons) mixes the surface and bulk contributions to the ELF in a way that enhances the surface excitations, while also retaining the bulk ones. In order to test the surface excitation hypothesis, we have fitted this effective ELF (corresponding to 500 eV, the lowest energy reported by Zhang et al. (Zhang et al., 2004)) by means of the MELF-GOS methodology and then performed new calculations of the ICS. The results are shown by a green thick solid line in Figure 7E. Strikingly, the ICS obtained using the effective ELF, which weights bulk and surface excitations, matches almost perfectly Bourke and Chantler’s data at low energies (Bourke and Chantler, 2010), within error bars down to 5 eV above the Fermi energy. The calculation converges with the high energy data (Tanuma et al., 2005; Da et al., 2014), for which surface excitations are deemed to be less relevant. Therefore, these results seem to point out to the contribution of these surface excitations in the most recent XAFS data (Bourke and Chantler, 2010), which would explain the discrepancy with the classical experiments (Knapp et al., 1979; Ogawa et al., 1997; Bauer et al., 2015).
Results for the stopping power of electrons in Cu are given in Figure 7F. Here, pure experimental data (squares) are only available from Al-Ahmad et al. at high energies (Al-Ahmad and Watt, 1983), which agree very well with our calculations. Red lines represent results using the optical ELF (Palik and Ghosh, 1999) and blue lines using the REELS ELF (Werner et al., 2009). Solid lines are calculations treating the 3d-electron excitations as collective while dashed lines as individual. The latter coincide well with the results reported by (Luo et al., 1991) and Hovington et al. (Hovington et al., 1996), although it should be remembered that these are rather calculations than experiments, as discussed previously. Surface excitations (accounted by means of the effective ELF (Zhang et al., 2004) and represented by a green solid line) tend to diminish the stopping power around the maximum at
Finally, Figure 3 shows by lines our calculated energy-loss straggling for electrons in Cu, for the two sets of ELF, as indicated in the figure caption which, as for the other cases, cannot be compared with any other experiment or reference calculation.
5.4 Molybdenum
The next metal we analyse is molybdenum, for which, as in the case of copper, there exist very low-energy electron measurements of the ICS by XAFS (Bourke and Chantler, 2010) that will serve us to check the assumptions made for the case of copper. For this material, there are three sets of experimental data available for the optical ELF, one relying on measured optical data (Palik and Ghosh, 1999) and two based on REELS experiments (Werner et al., 2009; Pauly et al., 2020). These sets of data are depicted in Figures 8A,B: magenta circles denote the experiments compiled by Palik and Ghosh (Palik and Ghosh, 1999), which are very different, above 30 eV, from those from Werner et al. (blue squares) (Werner et al., 2009) and Pauly et al. (red triangles) (Pauly et al., 2020) (these being rather similar to the results reported by Windt et al. (Windt et al., 1988)). In fact, the MELF-GOS fitting to Palik and Ghosh’s compiled data (Palik and Ghosh, 1999) did not fulfill the total f-sum rule. It should be mentioned that the measured data from Weaver (Weaver et al., 1974) goes up to 30 eV, and at larger excitation energies it is just an extrapolation. These experiments may possibly be affected by oxidation, impurities or roughness in the surface of the target, as mentioned in Palik and Ghosh’s book (Palik and Ghosh, 1999). Therefore, above 30 eV we better rely on the atomic information by Henke et al. (black crosses) (Henke et al., 1993), which, together with NIST’s (Chantler et al., 2005) (gray starts), are also represented, and are more relevant for Figure 8B where a log-log scale is used at large excitation energies.
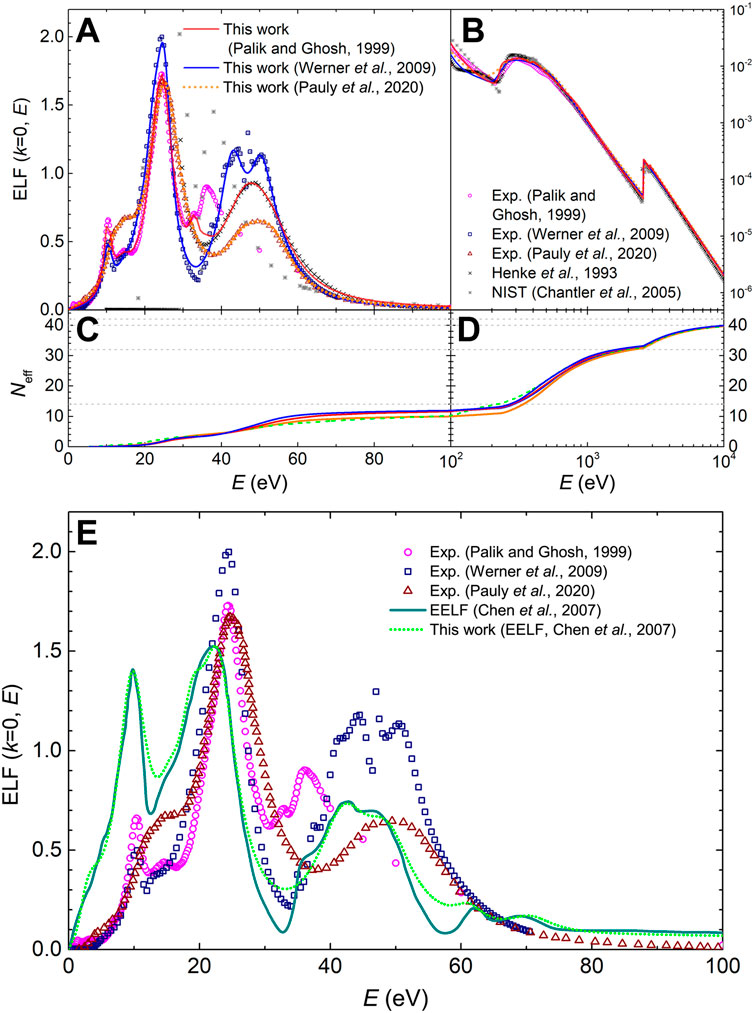
FIGURE 8. (A) and (B): Optical energy-loss function, ELF (k = 0, E), of Mo as a function of the energy transfer E. The experimental data from Palik and Ghosh’s compilation (Palik and Ghosh, 1999) (magenta circles), from Werner et al. (Werner et al., 2009) (square blue symbols) and from Pauly et al. (Pauly et al., 2020) (red triangle symbols) are presented as well as the MELF-GOS fit to these experimental data. Calculations from Henke et al. (Henke et al., 1993) and the NIST (Chantler et al., 2005) are included. (C) and (D): Effective number of electrons in Mo as a function of the excitation energy E, obtained from the MELF-GOS model fitted to Palik and Ghosh (Palik and Ghosh, 1999) (red solid line), to Werner et al. (Werner et al., 2009) (blue dotted line), to Pauly et al. (Pauly et al., 2020) and to the effective ELF from Zhang (Chen et al., 2007) (dashed green line). (E) Effective optical ELF (k = 0) of Mo as a function of the excitation energy E derived from experimental REELS measurements (solid dark cyan line) (Chen et al., 2007). The MELF-GOS model fitted to the effective ELF is presented by a dotted green line and other symbols are as in panels (A) and (B).
The MELF-GOS fittings to these sets of data are shown in Figures 8A,B by lines, and the corresponding parameters are gathered in Supplementary Tables S6–S8 in the Supplementary Material. The effective number of electrons Neff in Mo (calculated from the MELF-GOS model) as a function of the excitation energy E is depicted in Figures 8C,D. No important differences appear in the evolution of Neff with the excitation energy, except for a slight underestimation of the number of outer-shell electrons below 100–300 eV for Pauly et al.’s data (Pauly et al., 2020). The grey dashed lines correspond to 42 (the total number of electrons), 40 (where the K-shell starts), 32 (where the L-shell starts) and 14 (where the M-shell starts). Table 7 indicates that the total f- and KK-sum rules are fulfilled for the three fittings when the excitation energy tends to infinity. The effective number of electrons for each electronic excitation is reasonably satisfied, with Pauly et al.’s data (Pauly et al., 2020) slightly better respecting the expected number of 5s and 4d electrons. Noticeably, for Mo a vast majority of the outermost electrons participate in the plasmon excitation slightly above 20 eV. Another noticeable difference is observed for the excitation of the 4p electrons above 35 eV, which is underestimated by Pauly et al.’s data (Pauly et al., 2020), hence giving the lower number of outer-shell electrons with respect to Palik and Ghosh’s (Palik and Ghosh, 1999) (combined with Henke’s (Henke et al., 1993)) and Werner et al.’s (Werner et al., 2009) datasets. Regarding the mean excitation energies I obtained from these optical ELFs, they have values of 443.4 eV when Werner et al.’s ELF (Werner et al., 2009) is used, 469.2 eV for Palik and Ghosh’s (Palik and Ghosh, 1999) and 503.9 eV for Pauly et al.’s (Pauly et al., 2020), while the recommended values by ICRU37 and ICRU49 are, respctively, 424 ± 15 eV (Berger et al., 1984) and 424 eV (ICRU, 1993).
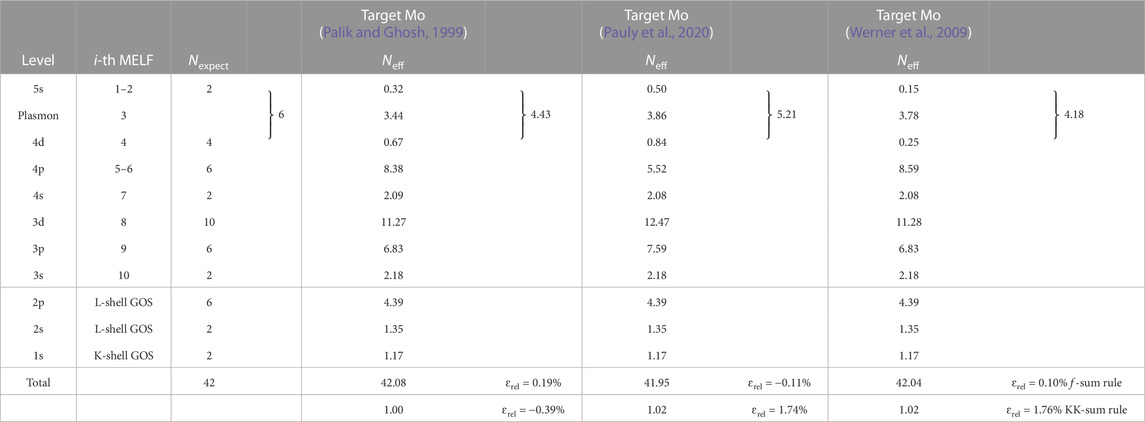
TABLE 7. Comparison of the expected number of electrons Nexpect in each excitation level of molybdenum, and the corresponding effective number of electrons Neff, as obtained from Eq. (10) with the MELF-GOS model fit to the experimental optical ELF from Palik and Ghosh (Palik and Ghosh, 1999) and Werner et al. (Werner et al., 2009). The values of the f- and KK-sum rules appear in the last two rows.
The stopping powers for H and He ions in Mo obtained by means of the MELF-GOS model from the different optical ELFs are represented by lines in Figures 9A,B respectively. Results obtained from Palik and Ghosh’s data (Palik and Ghosh, 1999) are shown by solid red lines, from Werner et al.’s data (Werner et al., 2009) by blue dotted lines and from Pauly et al.’s experiments (Pauly et al., 2020) by orange dashed lines. All calculations agree at high and low energies but are different around the maximum. The experimental data available from Paul’s database (International Atomic Energy Agency Nuclear Data Services, 2021), which are rather scarce for Mo, are depicted by letters. We note that the most recent measurements for H by Moro et al. (Moro et al., 2016) (yellow symbols) coincide almost perfectly with the calculated stopping powers based on Palik and Ghosh’s (Palik and Ghosh, 1999) and Werner et al.’s (Werner et al., 2009) ELFs, while the use of Pauly et al.’s data (Pauly et al., 2020) underestimates them. In the insets, the most recent measurements around the maximum are presented. In the case of H in Mo we include the data from Refs. (Izmailov et al., 1980; Sirotinin et al., 1984), whereas for He we represent measurements from Refs. (Chu et al., 1973; Lin et al., 1973; Leminen and Fontell, 1974). For H, all calculations underestimate the scarce experimental data, although those based on Palik and Ghosh’s (Palik and Ghosh, 1999) and Werner et al.’s (Werner et al., 2009) data coincide very well with experiments above 200 keV/u. For the case of He, calculations based on Palik and Ghosh’s and, especially, on Werner et al.’s ELF coincide very well with the data data by Ref. (Leminen and Fontell, 1974). Calculations based on Pauly et al.’s data (Pauly et al., 2020) significantly underestimate all experimental data. However, further measurements will be needed to confirm such trends. A comparison with the semiempirical code SRIM (Ziegler, 2013) is also included (green dotted line), together with the theoretical calculations by Montanari and Miraglia (Montanari and Miraglia, 2019).
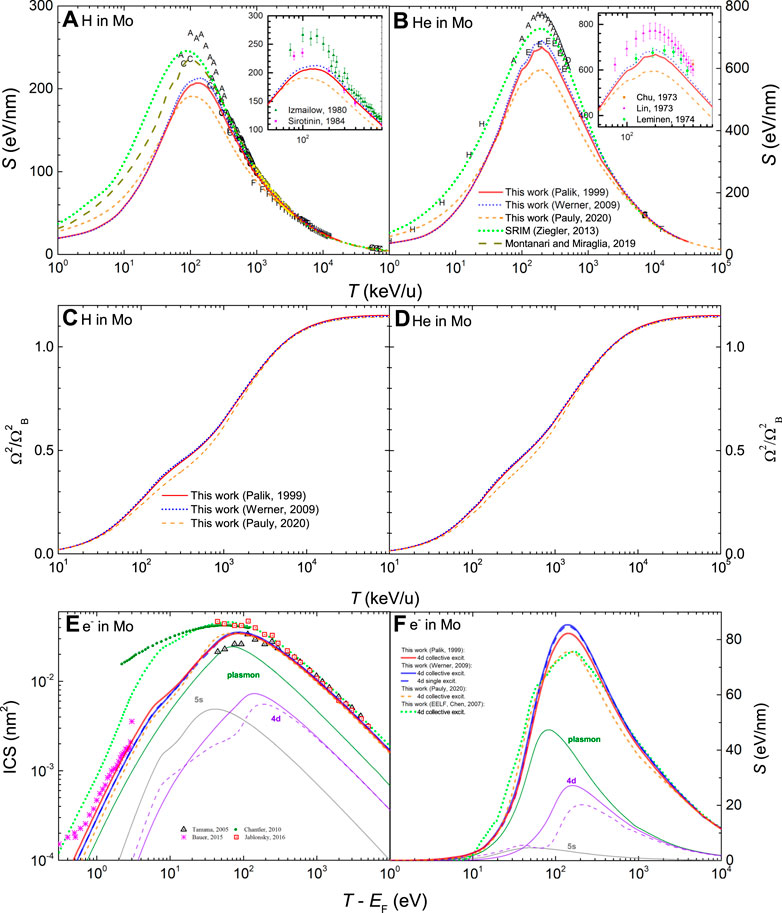
FIGURE 9. Energy-loss quantities for charged particles in Mo as a function of energy: (A) electronic stopping power for H and (B) for He, (C) electronic energy-loss straggling for H and (D) for He, (E) inelastic cross section (ICS) for electrons and (F) stopping power for electrons. Red solid and blue dotted lines correspond to calculations from the dielectric formalism with the MELF-GOS model fit to the experimental optical ELF from Refs. (Palik and Ghosh, 1999; Werner et al., 2009), respectively. A comparison with experimental data (symbols) is made for ions stopping power (International Atomic Energy Agency Nuclear Data Services, 2021) (the insets show the corresponding stopping power around its maximum value for the most recent experimental data (Chu et al., 1973; Lin et al., 1973; Leminen et al., 1974; Izmailow et al., 1980; Sirotinin et al., 1984), electrons ICS (Tanuma et al., 2005; Chantler and Bourke, 2010; Bauer et al., 2015; Jablonski, 2016), as well as with other theoretical models (Ziegler, 2013; Montanari and Miraglia, 2019). For the other lines, please see details on the text.
Figures 9C,D depict the energy-loss straggling of H and He beams in Mo. Red solid and blue dotted lines show our calculated results based either on the experimental optical ELF by Palik and Ghosh (Palik and Ghosh, 1999) or by Werner et al.’s ELF (Werner et al., 2009). In this case, there are no experimental data to compare with.
In what follows, we discuss the energy-loss quantities of electrons in Mo. As we are going to analyse the possible influence of surface excitation effects, as we did for Cu, we will use the effective ELF for Mo obtained from 500 eV-electron REELS measurements by Chen and coworkers (Chen et al., 2007), which is shown by a solid line in Figure 8E. The MELF-GOS fitting is shown by a green dotted line, which is used to calculate the energy-loss quantities.
The inelastic cross section (ICS) of electrons in Mo is presented in Figure 9E. Calculations based on Palik and Ghosh’s (red line) (Palik and Ghosh, 1999), Werner et al.‘s (blue lines) (Werner et al., 2009) and Pauly et al.’s (Pauly et al., 2020) (orange dashed line) optical ELFs are depicted, as well as those obtained from the effective ELF by Chen et al. (Chen et al., 2007) (dotted green line). For the case of Werner et al. ELF, we present contributions from the excitation of each band, including calculations treating the excitation of the 4d electrons as individual transitions (thin blue dashed line) and collective excitations (thin blue solid line). As in the case of Cu, treating the 4d electrons as collective causes an increment of the ICS value around the maximum, although in this case the increase is considerably smaller, as Mo has less d electrons than Cu. Symbols in the figure correspond to experimental data from Tanuma et al. (Tanuma et al., 2005), Chantler and Bourke (Chantler and Bourke, 2010), Bauer et al. (Bauer et al., 2015), and Jablonski (Jablonski, 2016). The comparison between the calculated and experimental ICS is excellent at energies larger than 100 eV and very good even around the maximum for all three optical ELFs. At very-low electron energies all calculations agree reasonably well with the measurements by Bauer et al. (Bauer et al., 2015), but are much lower than those by Chantler and Bourke (Chantler and Bourke, 2010). Notably, the latter high accuracy XAFS measurements (Chantler and Bourke, 2010), as well as the data by Jablonski around the maximum (Jablonski, 2016), perfectly agree with the results obtained from the effective ELF (Chen et al., 2007), again indicating that they might be affected by surface excitations.
The stopping power of electrons in Mo is shown in Figure 9F. Calculations are derived from the three different experimental optical ELFs (Werner et al., 2009): (blue lines), (Pauly et al., 2020), (dashed orange line), and the effective ELF (Chen et al., 2007) (dotted green line). In all cases the values at high and low electron energies are rather similar, and they only differ around the maximum. Unfortunately, to our knowledge there are no experimental data or other calculations to compare with. Pauly et al.‘s ELF (Pauly et al., 2020) leads to a somewhat lower stopping power around the maximum as compared to the other experimental ELFs, which is similar to that obtained using the effective ELF (Chen et al., 2007). However, the latter ELF gives rise to slightly larger stopping powers at energies lower than 50 eV.
Figure 3 shows by lines our calculated energy-loss straggling for electrons in Mo for the two sets of ELF, as indicated in the figure caption.
5.5 Iron
Iron is a metal with a reasonable amount of experimental data for the energy-loss quantities, both for ions and electrons, and for which three conflicting sources of optical ELF are available, from optical (Palik and Ghosh, 1999) and REELS (Werner et al., 2009; Xu et al., 2017) measurements. These are shown, respectively, by magenta circles, blue squares and orange triangles in Figure 10A. The MELF-GOS fittings are depicted by solid red, dotted blue and dashed orange lines, respectively, with parameters given in Supplementary Tables S9–S11 in the Supplementary Material. As can be seen, REELS-based measurements seem to provide much sharper and intense peaks, while the optical data are broader and in general less intense, with the maxima being around half of the source of data by Werner et al. (Werner et al., 2009). As a consequence, although all optical ELFs respect the total f-sum rule, as well as the KK-sum rule to a good extent, Palik and Ghosh’s data (Palik and Ghosh, 1999) give a somewhat lower number of electrons for excitation energies up to several hundreds of eV, as can be seen in Figure 10C. Total and individual sum-rules are given in Table 8. Individual effective number of electrons are close to expected numbers for all excitation channels for all optical ELFs, although the error in the total KK-sum rule is significantly larger for Palik and Ghosh’s (Palik and Ghosh, 1999) and Xu et al.’s data (Xu et al., 2017) as compared to Werner et al.’s (Werner et al., 2009). Nonetheless, Xu et al.’s ELF (the most recent one, based on a reverse Monte Carlo algorithm using REELS measurements (Da et al., 2013; Xu et al., 2017)) seems to give, overall, a somewhat lower error in the individual sum rule for the electrons described by Mermin functions.
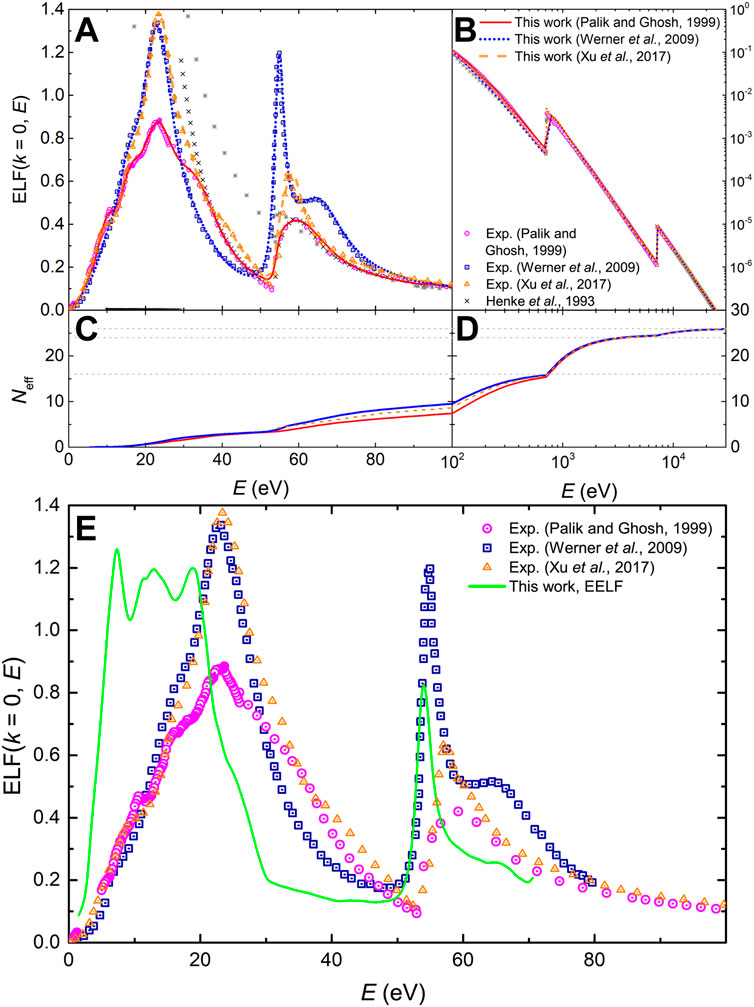
FIGURE 10. (A) and (B): Optical energy-loss function, ELF (k = 0, E), of Fe as a function of the energy transfer E. The experimental data from Palik and Ghosh’s compilation (Palik and Ghosh, 1999) (magenta circles), from Werner et al. (Werner et al., 2009) (square blue symbols) and from Xu et al. (Xu et al., 2017) (orange triangles) are presented as well as the MELF-GOS fit to these experimental data. Calculations from Henke et al. (Henke et al., 1993) and the NIST (Chantler et al., 2005) are included. (C) and (D): Effective number of electrons in Fe as a function of the excitation energy E, obtained from the MELF-GOS model fitted to different optical ELF. (E) Effective optical ELF (k = 0) of Fe as a function of the excitation energy (green line), estimated as explained in the text. Other symbols are as in panels (A) and (B).
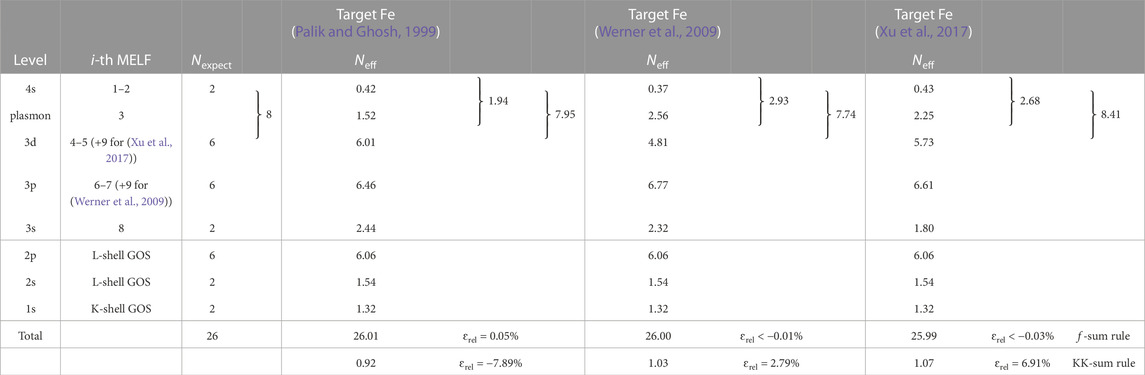
TABLE 8. Comparison of the expected number of electrons Nexpect in each excitation level of iron, and the corresponding effective number of electrons Neff, as obtained from Eq. (10) with the MELF-GOS model fit to the experimental optical ELF from Palik and Ghosh (Palik and Ghosh, 1999), Werner et al. (Werner et al., 2009) and Xu et al. (Xu et al., 2017). The values of the f- and KK-sum rules appear in the last two rows.
The calculated stopping powers for H and He in Fe are presented by lines (solid red line for Palik and Ghosh’s ELF (Palik and Ghosh, 1999), blue dotted line for Werner et al.’s (Werner et al., 2009), orange dashed line for Xu et al.’s (Xu et al., 2017)) in Figures 11A,B, and compared to the experimental data (letters) compiled in Paul’s database (International Atomic Energy Agency Nuclear Data Services, 2021). Although the amount of experimental information is not very large for Fe, we can clearly see, both for H and for He ions, that Werner et al.’s (Werner et al., 2009) and Xu et al.’s (Xu et al., 2017) optical ELFs gives place to stopping powers in rather good agreement with experiments, while Palik and Ghosh’s ELF (Palik and Ghosh, 1999) leads to an important underestimation around the maximum. The inset of Figure 11A zooms, for protons, the most recent experimental data around the maximum, revealing that the agreement with calculations based on Xu et al.’s ELF coincide very well in the maximum and around, while those based on Werner et al.’s ELF slightly overestimate them for energies larger than 200 keV/u.
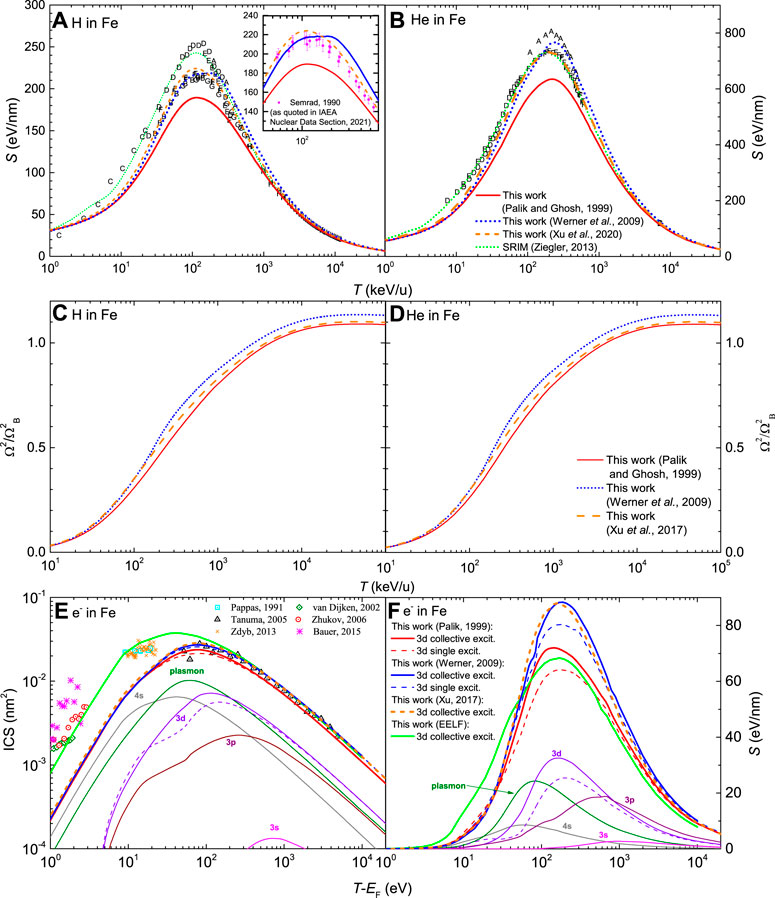
FIGURE 11. Energy-loss quantities for charged particles in Fe as a function of energy: (A) electronic stopping power for H and (B) for He, (C) electronic energy-loss straggling for H and (D) for He, (E) inelastic cross section (ICS) for electrons and (F) stopping power for electrons. Red solid, blue dotted and orange dashed lines correspond to calculations from the dielectric formalism with the MELF-GOS model fit to the experimental optical ELF from Refs. (Palik and Ghosh, 1999; Werner et al., 2009; Xu et al., 2017), respectively. A comparison with experimental data (symbols) is made for ions stopping power (International Atomic Energy Agency Nuclear Data Services, 2021) (the insets show the corresponding stopping power around its maximum value for the most recent experimental data) electrons ICS (Pappas et al., 1991; van Dijken et al., 2002; Tanuma et al., 2005; Zdyb et al., 2013; Bauer et al., 2015) as well as with other theoretical models (ICRU, 1993; Montanari and Miraglia, 2013; Ziegler, 2013; Brown et al., 2016). For the other lines, please see details on the text.
Figures 11C,D show the energy-loss straggling of H and He beams in Fe. Red solid lines correspond to our calculations based on the optical ELF by Palik and Ghosh (Palik and Ghosh, 1999), while dotted blue lines correspond to Werner et al.’s ELF (Werner et al., 2009) and dashed orange lines to Xu et al.’s data (Xu et al., 2017). For this metal, there are no experimental data to compare with.
Let us now study electrons in Fe. For this material there is no effective ELF available. However, we estimated an effective ELF, equivalent to those measured for Cu and Mo for 500 eV electrons (Zhang et al., 2004; Chen et al., 2007). For that purpose, we determined the ratio of the effective ELF for Cu with respect to its measured surface ELF (Zhang et al., 2004), and applied this ratio to the surface ELF measured by Werner et al. for Fe (Werner et al., 2009). The result is depicted by a solid line in Figure 10F.
The calculated ICS for electrons in Fe are shown by lines in Figure 11E, together with experimental data (symbols) by Refs. (Pappas et al., 1991; van Dijken et al., 2002; Tanuma et al., 2005; Zhukov et al., 2006; Zdyb et al., 2013; Bauer et al., 2015). Thick dashed lines are calculations treating the excitation of the 3d electrons as individual transitions, and solid thick lines treat them as collective. As the number of d electrons is not very large in this case, both calculations are not so different and they agree rather well with Tanuma’s experimental data (Tanuma et al., 2005) above 50 eV. The dispersion of the data around the maximum avoids drawing conclusions about the quality of the optical ELFs used, although both Werner et al.’s (Werner et al., 2009) and Xu et al.’s ELFs (Xu et al., 2017) agree better with the experimental ICS above 100 eV. None of the calculations agree with the experimental data at lower energies (Zhukov et al., 2006; Zdyb et al., 2013; Bauer et al., 2015; Pappas et al., 1991), even though for other metals the agreement with the experiments by Bauer (Bauer et al., 2015) was typically good. The use of the estimated effective ELF somewhat improves the agreement, bringing the calculation (green line) closer to the data by (Pappas et al., 1991; Zdyb et al., 2013; Zhukov et al., 2006), but still underestimating Bauer’s data (Bauer et al., 2015). This calls for the measurement of the effective ELF for electrons in Fe, which might help to close this gap.
The calculated stopping powers of electrons are shown by thick lines in Figure 11F, although in this case there are no experimental data to compare with. Thin curves showing the contribution of different excitations correspond to the values obtained from Palik and Ghosh’s optical data (Palik and Ghosh, 1999). The difference appearing by treating the excitation of the 3d electrons as individual or collective is more clearly seen here, with the slight increase of the stopping around the maximum when they are treated as collective. The stopping power obtained by using Palik and Ghosh’s optical ELF (Palik and Ghosh, 1999) is significantly lower than that using Werner et al.‘s (Werner et al., 2009) and Xu et al.‘s ELFs (Xu et al., 2017). The use of the effective ELF (based on Werner et al.‘s data) produces a maximum value of the stopping power similar to calculations based on Palik and Ghosh’s data, and it is slightly increased for low electron energies below 50 eV.
Figure 3 contains our calculated energy-loss straggling for electrons in Fe for the three sets of ELF (see figure caption).
5.6 Platinum
We finalise our analysis with platinum, a relevant material for catalysis and nanoparticle enhancement of radiotherapy, with again two sets of experimental data available for the optical ELF, coming from optical data (Palik and Ghosh, 1999) and REELS (Werner et al., 2009), which are shown in Figure 12 as a function of the excitation energy E. The optical ELF from Palik and Ghosh’s compilation (Palik and Ghosh, 1999), which is based on reflectivity measurements, is shown by magenta circles, and the most recent optical ELF based on REELS experiments developed by Werner et al. (Werner et al., 2009) is depicted by blue squares. Panel A shows data in linear scale in order to appreciate the complex excitation spectrum, whereas panel B appears in a log-log scale, which is more appropriate at high excitation energies, where inner shells excitation are presented. Atomic calculations by Henke et al. (Henke et al., 1993) (black crosses) and NIST (Chantler, 2003) (grey stars) are also included which are valid at large excitations energies. Lines represent the fit by the MELF-GOS model to Palik and Ghosh’s (Palik and Ghosh, 1999) (red solid line) and to Werner et al.’s ELFs (Werner et al., 2009) (blue dotted line), which parameters are given in Supplementary Tables S12, S13 in the Supplementary Material.
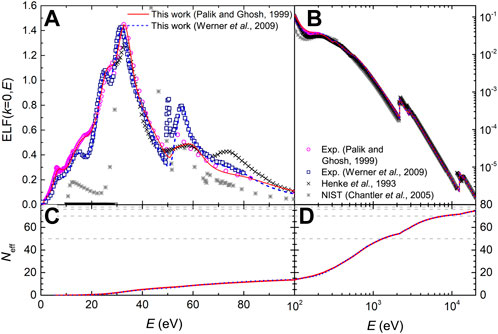
FIGURE 12. (A) and (B): Optical ELF (k = 0, E) of Pt as a function of the excitation energy E. Experimental data from Palik and Ghosh (Palik and Ghosh, 1999) and Werner et al. (Werner et al., 2009) are depicted by symbols and the fitting by the MELF-GOS model by lines. Henke et al. (Henke et al., 1993) and the NIST (Chantler, 2003) calculations are included. (C) and (D): Effective number of electrons, Neff, in Pt as a function of the excitation energy E.
Panels C and D in Figure 12 correspond to the effective number Neff of electrons in Pt, as a function of the excitation energy E. The dashed gray lines correspond to 78 (the total number of electrons), 76 (where the K-shell starts), 68 (where the L-shell starts) and 50 (where the M-shell starts). It is immediate to verify that the total f-sum rule is verified and that at high transferred energies the number of electrons approaches the atomic number of the target, 78 electrons, for both sources of the optical ELF. The partial numbers of effective electrons appear in Table 9, where it can be seen that, in general, both optical ELFs fulfill rather well the expected number of electrons. The total KK-sum rule is better satisfied by Werner et al.’s optical ELF (Werner et al., 2009). The I-values obtained are 738.6 eV for Palik and Ghosh’s and 739.0 eV for Werner et al.’s ELFs, while the value recommended by ICRU37 is 790 ± 30 eV (Berger et al., 1984) and by ICRU49 741.9 eV (ICRU, 1993).
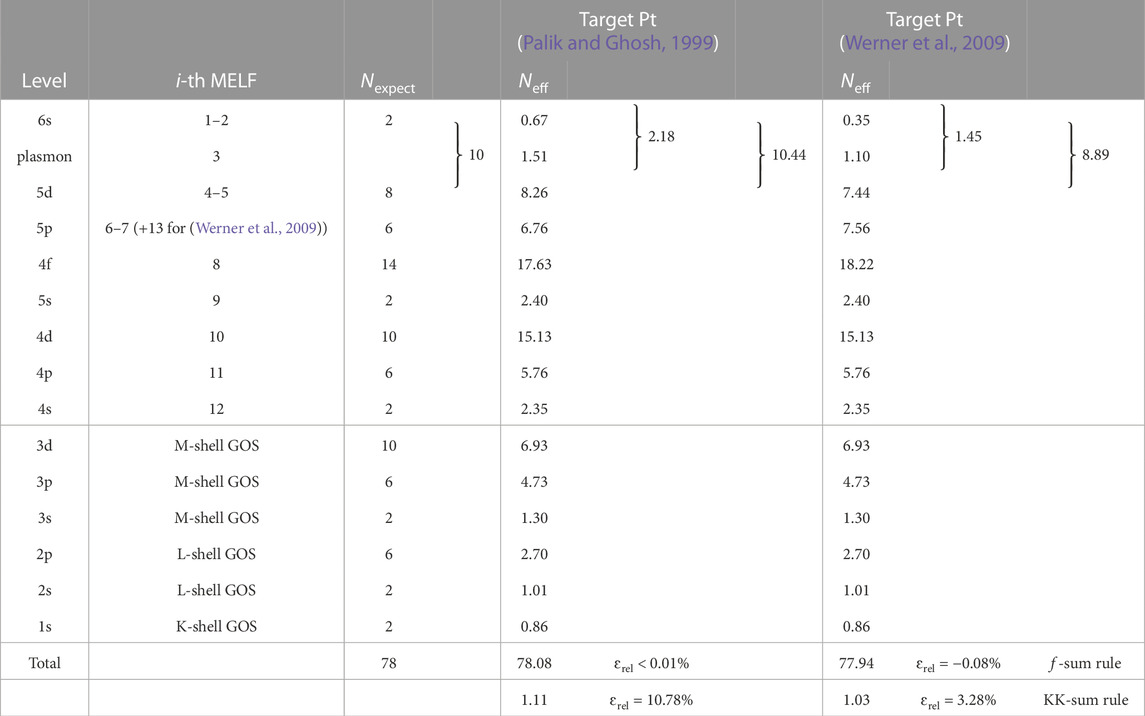
TABLE 9. Effective number Neff of electrons in each excitation level for Pt obtained by the MELF-GOS model fit to the experimental optical ELF from Palik and Ghosh (Palik and Ghosh, 1999) and Werner et al. (Werner et al., 2009).
The electronic stopping powers of Pt for H and He ions are presented in Figures 13A,B as a function of the incident ion energy. The experimental data (letters) are from Paul’s database (International Atomic Energy Agency Nuclear Data Services, 2021). Our calculations based on the ELF from Palik and Ghosh (Palik and Ghosh, 1999) are depicted by a red solid line and the results based on Werner et al.’s ELF (Werner et al., 2009) are shown by a blue dotted line. Both results are very similar for the energy range analysed, with only slight differences below 200 keV/u, and are compatible with the collection of experimental data down to 30–40 keV/u. The insets in the figure compare the calculated stopping powers in Pt with the most recent experimental data around the maximum stopping, from Refs. (Selau et al., 2020; Moro et al., 2020) for H, and from Ref. (Moro et al., 2020) for He. As can be seen, the agreement is excellent, with the calculations within error bars for H and also for He above 100 keV/u. The recommended values of the stopping power from ICRU49 (ICRU, 1993) (cyan dashed line) and from the semiempirical SRIM code (Ziegler, 2013) (green dotted line) are also presented. It should be noted that the values predicted by the SRIM code (Ziegler, 2013) for H in Pt do not agree with the most recent experimental determinations.
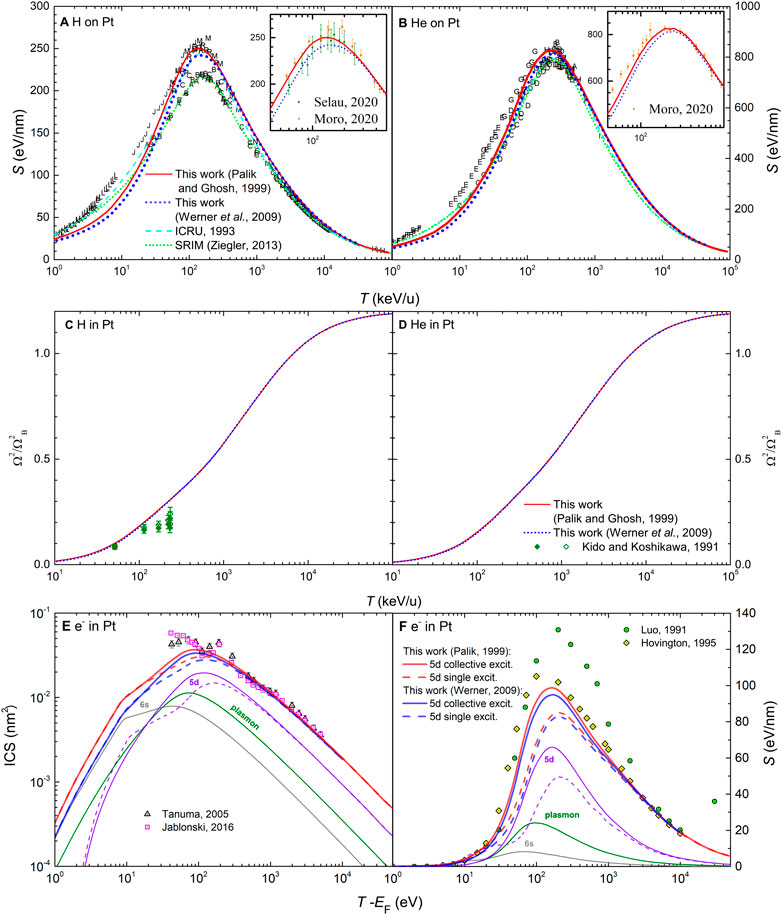
FIGURE 13. Energy-loss quantities for charged particles in Pt as a function of energy: (A) electronic stopping power for H and (B) for He, (C) electronic energy-loss straggling for H and (D) for He, (E) inelastic cross section (ICS) for electrons and (F) stopping power for electrons. Red solid and blue dotted lines correspond to calculations from the dielectric formalism with the MELF-GOS model fit to the experimental optical ELF from Refs. (Palik and Ghosh, 1999; Werner et al., 2009), respectively. A comparison with experimental data (symbols) is made for ions stopping power (International Atomic Energy Agency Nuclear Data Services, 2021) [the insets show the corresponding stopping power around its maximum value for the most recent experimental data (Selau et al., 2020; Moro et al., 2020)], ions straggling (Kido and Koshikawa, 1991), electrons ICS (Tanuma et al., 2005; Jablonski, 2016) and electrons stopping power (Luo, 1991; Hovington et al., 1996), as well as with other theoretical models (ICRU, 1993; Ziegler, 2013). For the other lines, please see details on the text.
In Figures 13C,D we show the energy-loss straggling of H and He beams in Pt. Red solid lines and blue dotted lines represent our calculations based on the experimental optical ELF by Palik and Ghosh’s (Palik and Ghosh, 1999) and by Werner et al.’s ELF (Werner et al., 2009) respectively, which are close to the experimental data for protons (Kido and Koshikawa, 1991).
For electron interactions in Pt, experimental data for the ICS are very scarce (being only available at the maximum value and larger energies), while there are no experimental data for the stopping power. The experimental ICS by Tanuma et al. (Tanuma et al., 2005) and Jablonski (Jablonski, 2016) are shown by symbols in Figure 13E, along with our calculations based on Palik and Ghosh’s (red line) (Palik and Ghosh, 1999) and Werner et al.’s (blue line) (Werner et al., 2009) ELFs. In the theoretical calculation, we can treat the 5d-electron excitations as collective (solid thin line) or as individual transitions (dashed thin line). At high electron energies the ICS are rather similar independently of the optical ELF used and they match quite well with the experimental data (Tanuma et al., 2005; Jablonski, 2016). However at low electron energies the ICS calculated from Palik and Ghosh’s ELF (Palik and Ghosh, 1999) is somewhat larger than the values obtained from Werner et al.’s ELF (Werner et al., 2009), but the scattering of the experimental results and the absence of data for lower energies prevents drawing further conclusions. In any case, considering the d electrons as collective excitations again seems to improve agreement with experiments.
The calculated stopping powers are similarly shown by lines in Figure 13F, together with the data by Luo et al. (Luo et al., 1991) and Hovington et al. (Hovington et al., 1996) (symbols) that appear in Joy’s compilation (Joy, 1995), which are dielectric calculations based on EELS measured spectra. Our calculations are very similar to those by Hovington et al. (Hovington et al., 1996) at high energies, and also at lower energies around the maximum when the excitation of the 5d electrons is considered as collective. However, more measurements of the stopping power would be desirable to draw more conclusions.
Our calculated energy-loss straggling for electrons in Pt appears in Figure 3, for the two sets of ELF, as indicated in the figure caption.
6 Summary and conclusion
The dielectric formalism approach for charged particle interaction with condensed-phase metals has been reviewed, and models for the particular treatment of the electronic inelastic scattering of light ion (protons and alpha particles) and electron beams have been explained.
For ions, we considered the electron capture and loss processes with the target (resulting in the dependence of their charge fractions with energy, which affect their stopping), the energy loss due to these charge exchange processes themselves, as well as the effect of the ion’s electron cloud polarisation to the energy loss.
For electrons, especial attention has been payed to the indistinguishability between the primary and target’s electrons in terms of exchange (through the Born-Ochkur exchange term) and how it affects the maximum allowed energy loss in inelastic collisions during individual and collective electronic excitations. A simple low-energy modification to the dielectric formalism (based on a Coulomb-field correction) has been also implemented.
The application of the present methodology for both light ion and electron beams has been tested by analysing and comparing energy-loss quantities for these projectiles in the relevant metals Al, Fe, Mo, Cu, Pt, and Au. These targets are good representatives of metals with complex excitation spectra, featuring both collective plasmon excitations and individual interband transitions. They also count on with a relatively large collection of experimental data to compare with, as well as with different sources for their optical excitation spectra (the ELF at vanishing momentum transfer k = 0), derived either from light or electron scattering experiments. These provide, in some cases, conflicting results, and the same happens for some of the experimental energy-loss quantities, particularly for very low energy electrons. Such discrepancies have been analysed in terms of the theoretical calculations, which use the MELF-GOS methodology to extend the experimental optical ELF to finite momentum transfers, both for the excitation of the outer and the inner-shell electrons, through the Mermin dielectric function and hydrogenic generalised oscillator strengths, respectively. A possible interpretation of the ELF in terms of contributions from the excitation of different electronic bands is proposed, which is based on the approximate fulfillment of partial f-sum rules.
Aluminum is an example of a metal with an excitation spectrum dominated by a very intense plasmon. An excellent agreement of the calculated stopping powers of Al for H and He ions is obtained in comparison with the abundant experimental data compiled in the database by the late Helmut Paul (International Atomic Energy Agency Nuclear Data Services, 2021), down to energies around 40 keV/u, well below the stopping maximum. To achieve these results, it is necessary to include in the model both the projectile’s polarisation and the energy loss due to electron capture and loss processes as, otherwise, the agreement with experiments is only attained for energies larger than 200 keV/u (already above the maximum S). This highlights the role of energy loss due to projectile’s polarisation and electron capture and loss for ions at the energies around the maximum of the stopping, so relevant for practical applications.
For electrons in Al, an excellent agreement with the experimental inelastic cross sections (ICS) available in the whole energy range is obtained, down to energies as low as 5 eV above the Fermi energy. The best agreement is obtained when, for the collective plasmon excitation, the maximum energy loss E+ = T − EF is considered, instead of the limit E+ ∼ T/2 appropriate for individual transitions due to electron indistinghishability. This clarifies a controversy on this point arisen in a series of works by several authors (Denton et al., 2008a; Bourke and Chantler, 2012; Nguyen-Truong, 2013; de Vera and Garcia-Molina, 2019), a point which is also further demonstrated for other metals.
In the case of gold, we find two different sets of its optical ELF, derived from Palik and Ghosh’s optical parameters’ compilations (Palik and Ghosh, 1999) and from REELS experiments by Werner et al. (Werner et al., 2009), as it will happen for all the rest of materials. In this case, however, the analysis of the sum rules does not reveal major differences between these two optical ELFs, what is confirmed by the calculation of the energy-loss quantities both for ions and electrons, which are very similar using both sources of data.
For H and He ions in Au, full calculations give excellent agreement with the most recent experimental stopping power data down to ∼ 40 keV/u (or even lower energies for He), despite of the scattering in the abundant experimental measurements.
The comparison with the rich collection of experimental ICS for electrons in gold permits to assess the good performance of the calculations in the entire energy range, down to energies as low as 2 eV above the Fermi energy, and to further test other assumptions in the model. An almost perfect agreement with experiments is got when all excitations (individual transitions) are treated with the maximum energy loss E+ = (T + Ba)/2 (where Ba is the binding energy of the involved band), except for the plasmon and the excitation of 5d electrons. When the latter are considered as collective excitations (and hence E+ = T − EF), an excellent agreement with experiments is found. To treat the excitation of the 5d electrons as collective may be justified on the claim from Verkhovtsev et al. (Verkhovtsev et al., 2015) that these are excited through giant atomic resonances, and from other authors who discuss the presence of multiple plasmons in transition metals due to the excitation of the d-electrons (Chen et al., 2007; Iakoubovskii et al., 2008). However, here we limit ourselves to remark the almost perfect agreement with experiments when this is considered. Also, it was demonstrated with the case of electrons in gold that, when exchange and low-energy correction terms are not included in the calculations, results become unreliable below ∼ 100 eV, highlighting the importance of these improvements.
Similar arguments can be used for the case of copper. Calculations based on the optical ELF from Palik and Ghosh’s compilation (Palik and Ghosh, 1999) give very good results for H and He ions stopping powers in comparison with experimental data down to a few tens of keV/u. Calculations based on the REELS optical ELF (Werner et al., 2009) also give good results, although apparently slightly off from the most recent experimental data. This may be the result of a slight better fulfilling of the total and partial sum rules for Palik and Ghosh’s data, although both sets of optical experiments seem to be very reasonable in this case.
As for electrons in Cu, the better agreement with most of the experimental ICS is got again considering the excitation of the 3d electrons as collective. Calculations based on both optical ELFs give excellent results. However, a big discrepancy is found when comparing with the most recent XAFS experimental determinations by Bourke and Chantler (Bourke and Chantler, 2010), which are off from calculations and previous experiments by more than an order of magnitude for energies below 50 eV.
This issue has been here analysed in the context of potential surface excitations. These can be qualitatively taken into account in the calculations by using the effective ELF obtained experimentally by Zhang et al. for 500 eV-electrons in copper (Zhang et al., 2004). The effective ELF is claimed to include a weighted sum of bulk and surface electronic excitations, which can be used to interpret REELS experiments. Notably, when this effective ELF is used for performing the calculation of the electrons ICS in Cu, results almost perfectly matching the XAFS determinations are obtained (Bourke and Chantler, 2010). This fact seems to point out to a possible influence of surface excitations in these experimental measurements, a point which is further analysed for other targets. The use of the effective ELF also prompts a reduction in the stopping power around the maximum and an increase at energies below 50 eV, which could have relevant implications for situations in which low energy electrons are ejected in the vicinity of surfaces, such as in nanoparticle radiosensitisation.
The case of molybdenum serves to further discuss some of the above aspects. In this case, there is the ELF from optical measurements (Palik and Ghosh, 1999) as well as two sets obtained from REELS (Werner et al., 2009; Pauly et al., 2020). While Palik and Ghosh’s (Palik and Ghosh, 1999) and Werner et al.’s (Werner et al., 2009) data give almost identical results for H and He stopping powers (which agree well with the most recent experimental data for H above 200 keV/u and also for He around the maximum), Pauly et al.’s optical ELF (Pauly et al., 2020) gives stopping powers significantly underestimated. This seems to be mainly related to the somewhat week excitation of the 4p electrons starting at ∼ 35 eV, which underestimates the partial number of expected electrons. This remarks the important role of semi-core levels in the stopping power.
The effective ELF for 500 eV-electron REELS has also been measured for Mo (Chen et al., 2007), for which again there are recent XAFS measurements for its low-energy ICS available (Chantler and Bourke, 2010). Full calculations give good results with the high energy ICS measured by Tanuma et al. (Tanuma et al., 2005), as well as with very low energy determinations compiled by Bauer et al. (Bauer et al., 2015), while calculations using the effective ELF provide again an excellent comparison with the XAFS measurements (Chantler and Bourke, 2010) for energies around 100 eV and below, and with the experiments by Jablonski (Jablonski, 2016) around 100 eV and above, remarking the potential impact of surface excitations on the determination of low energy electron ICS.
For iron, there are also conflicting data for the optical ELF coming from optical (Palik and Ghosh, 1999) and electron experiments (Werner et al., 2009; Xu et al., 2017) as, even though their shapes are similar, the ones based on REELS are much sharper and intense. In this case, the calculated stopping powers of Fe for H and He ions are only in reasonable agreement with the scarce experimental data when Werner et al.’s (Werner et al., 2009) or Xu et al.’s (Xu et al.., 2017) ELFs are used, whereas calculations based on Palik and Ghosh’s (Palik and Ghosh, 1999) significantly underestimate S around the maximum. Particularly, Xu et al.’s data (the most recent determination based on the reverse Monte Carlo method) gives results in very good agreement with the ion stopping power experiments. This case highlights the importance of the semi-core excitations and of counting with reliable methods for the ELF determination.
The differences between the optical ELF datasets does not seem to be so critical for calculating the electron ICS, although again Werner et al.’s and Xu et al.’s data (Werner et al., 2009; Xu et al., 2017) seem to give results closer to experiments at high energies. In this case, low-energy experiments (Pappas et al., 1991; Zhukov et al., 2006; Zdyb et al., 2013; Bauer et al., 2015) disagree with the calculations. However, although there is no effective ELF measured for this material, we estimated it based on the data for Cu (Zhang et al., 2004), again finding a very significant improvement in the agreement with the cited experimental data at low energies.
Finally, similar results are obtained for the relevant metal platinum, for which both sets of optical ELF based on optical measurements and REELS also give almost identical results for H and He stopping powers, in excellent agreement with very recent experimental determinations from Refs. (Selau et al., 2020; Moro et al., 2020), both within experimental error bars. Experimental data is very scarce for electron ICS in Pt, but calculations are in reasonable good agreement with them around and above 100 eV.
Overall, the proposed methodology is capable of yielding, within a common theoretical framework, accurate electronic energy-loss quantities for both H and He ions, as well as electrons, in comparison with experimental measurements, in a very wide energy range down to energies as low as ∼ 40 keV/u for light ions and ∼ 2 eV for electrons, sometimes even for lower energies. For that, it is important that energy-loss due to electron capture and loss and projectile electronic cloud polarisation is considered for ions, and that exchange and indistinguishability and low-energy corrections are appropriately accounted for electrons. Unfortunately, there is a lack of experimental stopping powers for electrons, especially around the maximum value, at energies T ∼ 100 eV, data which would be very useful to further check models at the low energy range.
In some cases, it is also important to appropriately chose the experimental optical ELF to be used for calculations. Judging by the comparison between calculated I-values and the ones recommended by ICRU (Berger et al., 1984) (see Table 3), in general the optical ELF derived from REELS by Werner et al. (Werner et al., 2009) seem to give a somewhat better agreement for all the metals analysed. Total and partial sum rules are also advisable to perform in order to detect possible inconsistencies. The clearer examples shown in this work are those of the optical ELFs of Mo derived from REELS experiments by Pauly et al. (Pauly et al., 2020) and of Fe obtained from Palik and Ghosh’s compilation (Palik and Ghosh, 1999); the former seems to underestimate the number of electrons expected in the excitation of the 4p-band, while the latter underestimates all outer-shell electrons. This turns out to be important for correctly assessing the stopping power for light ions. By judging the available optical ELFs in the light of the calculation results, for Au, Mo and Pt, both Palik and Ghosh’s (Palik and Ghosh, 1999) and Werner et al.’s (Werner et al., 2009) ELFs give correct and similar energy-loss quantities for both ions and electrons. The differences are small for Cu, with Palik and Ghosh’s data providing somewhat closer agreement with the experimental stopping powers for H and He ions. For Fe, both Xu et al.’s and Werner et al’s ELF give correct stopping powers for H and He around the maximum, the latter slightly overestimating the experiments above 200 keV/u. Both datasets provide a better agreement with experimental electron ICS for energies larger than 100 eV.
For the assessment of optical ELF data, apart from relying on total and partial sum rules (which could give some guidance in their assessment, but are not always so conclusive), one could nowadays also count on with the help of ab initio time-dependent density functional theory calculations (TDDFT). It was already shown by Werner et al. (Werner et al., 2009) that DFT calculations on the random-phase approximation can provide reasonable estimates of the optical ELF. However, more recently it is becoming clear that already established TDDFT codes are able to provide prediction of the ELF that almost perfectly match the experimental data available for some materials (Pedrielli et al., 2021; Taioli et al., 2021; Taioli et al., 2023). These methods might then be very useful to check conflicting sets of optical ELF data which could affect the reliability of the dielectric formalism calculations. Both experimental optical data and ab initio calculations can be also combined to provide recommended optical ELFs in wide energy ranges, as it was done, for example, for Si by Bichsel (Bichsel, 1988).
Furthermore, the proposed theoretical method for calculating the electronic cross sections may further benefit from TDDFT calculations. It has been already made evident here how surface excitations can very importantly affect the interaction probabilities for very low energy electrons. This fact, apart from affecting the experimental determination of electron mean free paths, can have important practical applications in contexts in which low energy electrons are produced in the vicinity of metal surfaces, as it is the case of using metal nanoparticles for the enhancement of ion beam cancer therapy (Kuncic and Lacombe, 2018; Kempson, 2021). Ab initio TDDFT calculations could be exploited for understanding the excitation spectrum not only of bulk metals, but also of nanostructured ones, which could then extend the use of the dielectric formalism, already demonstrated very effective for bulk materials, to accurately describe the electronic interactions of ions and (especially low energy) electrons with metallic nanosystems, an endeavour which is currently underway.
We would like to highlight that analytical expressions have been provided to calculate (by fitting) all the energy-loss quantities obtained and discussed in this paper. These formulas and the corresponding parameters are gathered in the Supplementary Material, due to the interest for providing analytical expression to compare with or to be used in simulation codes.
Data availability statement
The raw data supporting the conclusion of this article will be made available by the authors, under reasonable request.
Author contributions
All authors listed have made a substantial, direct, and intellectual contribution to the work and approved it for publication.
Funding
This work is part of the R&D project no. PID2021-122866NB-I00 funded by the Spanish Ministerio de Ciencia e Innovación (MCIN/AEI/10.13039/501100011033/) and by the European Regional Development Fund (“ERDF A way to make Europe”), as well as of the R&D project no. 22081/PI/22 funded by the Autonomous Community of the Region of Murcia through the call “Projects for the development of scientific and technical research by competitive groups”, included in the Regional Program for the Promotion of Scientific and Technical Research (Action Plan 2022) of the Fundación Séneca—Agencia de Ciencia y Tecnología de la Región de Murcia.
Conflict of interest
The authors declare that the research was conducted in the absence of any commercial or financial relationships that could be construed as a potential conflict of interest.
Publisher’s note
All claims expressed in this article are solely those of the authors and do not necessarily represent those of their affiliated organizations, or those of the publisher, the editors and the reviewers. Any product that may be evaluated in this article, or claim that may be made by its manufacturer, is not guaranteed or endorsed by the publisher.
Supplementary material
The Supplementary Material for this article can be found online at: https://www.frontiersin.org/articles/10.3389/fmats.2023.1249517/full#supplementary-material
References
Al-Ahmad, K. O., and Watt, D. E. (1983). Stopping powers and extrapolated ranges for electrons (1-10 keV) in metals. J. Phys. D - Appl. Phys. 16, 2257–2267. doi:10.1088/0022-3727/16/11/028
Alberts, H. W., and Malherbe, J. B. (1983). Energy loss and straggling of p, d and alpha-particles in Au in the energy region 0.2 to 2.4 MeV. Radiat. Eff. 69, 231–238. doi:10.1080/00337578308217825
Amadon, S., and Lanford, W. A. (2006). He stopping power and straggle in Al, Ti, Co, Cu, Ag, Ta and Au from 1.5 to 4MeV. Nucl. Instrum. Methods Phys. Res. B - Beam Interact. Mater. Atoms 249, 34–37. doi:10.1016/j.nimb.2006.03.017
Andersen, H., Csete, A., Ichioka, T., Knudsen, H., Møller, S., and Uggerhøj, U. (2002). An apparatus to measure stopping powers for low-energy antiprotons and protons. Nucl. Instrum. Methods Phys. Res. B - Beam Interact. Mater. Atoms 194, 217–225. doi:10.1016/s0168-583x(02)00692-4
Arista, N. R. (1978). Erergy loss of correlated charges in an electron gas. Phys. Rev. B 18, 1–8. doi:10.1103/physrevb.18.1
Ashcroft, N. W., and Mermin, N. D. (1976). Solid state physics. Fort Worth, USA: Harcourt College Published.
Ashley, J. C., Tung, C. J., Anderson, V. E., and Ritchie, R. H. (1975). Inverse mean free path, stopping power, CSDA range, and straggling in aluminum and aluminum oxide for electrons of energy = or > 10 keV - Air Force Cambridge Research Laboratory Report No. AFCRL-TR-75-0583.
Azzolini, M., Angelucci, M., Cimino, R., Larciprete, R., Pugno, N. M., Taioli, S., et al. (2019). Secondary electron emission and yield spectra of metals from Monte Carlo simulations and experiments. J. Phys. Condens. Matter 31, 055901. doi:10.1088/1361-648x/aaf363
Bauer, G. H., Antolak, A. J., Pontau, A. E., Morse, D. H., Heikkinen, D. W., and Proctor, I. D. (1989). Proton energy straggling measurements in aluminum, titanium, silver and tungsten foils. Nucl. Instrum. Methods Phys. Res. B - Beam Interact. Mater. Atoms 43, 497–501. doi:10.1016/0168-583x(89)90396-0
Bauer, M., Marienfeld, A., and Aeschlimann, M. (2015). Hot electron lifetimes in metals probed by time-resolved two-photon photoemission. Prog. Surf. Sci. 90, 319–376. doi:10.1016/j.progsurf.2015.05.001
Bauer, P., Aumayr, F., Semrad, D., and Scherzer, B. (1984). Measurement of the stopping cross section for protons in copper by backscattering using various methods for foil-thickness determination. Nucl. Instrum. Methods Phys. Res. B - Beam Interact. Mater. Atoms 1, 1–8. doi:10.1016/0168-583x(84)90469-5
Bennett, H. E., Silver, M., and Ashley, E. J. (1963). Infrared reflectance of aluminum evaporated in ultra-high vacuum. J. Opt. Soc. Am. 53, 1089–1095. doi:10.1364/josa.53.001089
Berger, M. J., Inokuti, M., Anderson, H. H., Bichsel, H., Dennis, J. A., Powers, D., et al. (1984). ICRU Report 37: Stopping powers for electrons and positrons.
Berger, M. J., and Seltzer, S. M. (1982). “Stopping powers and ranges of electrons and positrons,” in NBSIR 82-2550 Tech. (Washington, DC: National Bureau of Standards).
Besenbacher, F., Andersen, J. U., and Bonderup, E. (1980). Straggling in energy loss of energetic hydrogen and helium ions. Nucl. Instrum. Methods 168, 1–15. doi:10.1016/0029-554x(80)91224-0
Bianconi, M., Barradas, N. P., and Correra, L. (2005). The stopping cross-section of aluminum for He ions. Nucl. Instrum. Methods Phys. Res. B - Beam Interact. Mater. Atoms 239, 127–134.
Bichsel, H. (1988). Straggling in thin silicon detectors. Rev. Mod. Phys. 60, 663–699. doi:10.1103/revmodphys.60.663
Bordoloi, A. K., and Auluck, S. (1983). Electronic structure of platinum. J. Phys. F - Metal Phys. 13, 2101–2105. doi:10.1088/0305-4608/13/10/019
Bourke, J. D., and Chantler, C. T. (2012). Electron energy loss spectra and overestimation of inelastic mean free paths in many-pole models. J. Phys. Chem. A 116, 3202–3205. doi:10.1021/jp210097v
Bourke, J. D., and Chantler, C. T. (2010). Measurements of electron inelastic mean free paths in materials. Phys. Rev. Lett. 104, 206601. doi:10.1103/physrevlett.104.206601
Brandt, W. (1982). Effective charges of ions and the stopping power of dense media. Nucl. Instrum. Methods Phys. Res. 194, 13–19. doi:10.1016/0029-554x(82)90482-7
Brown, A. M., Sundararaman, R., Narang, P., Goddard, W. A., and Atwater, H. A. (2016). Nonradiative plasmon decay and hot carrier dynamics: effects of phonons, surfaces, and geometry. ACS Nano 10, 957–966. doi:10.1021/acsnano.5b06199
Callcott, T. A., and Arakawa, E. T. (1975). Volume and surface photoemission processes from plasmon resonance fields. Phys. Rev. B 11 (8), 2750–2758. doi:10.1103/physrevb.11.2750
Chantler, C. T. (2003). Atomic form factors and photoelectric absorption cross-sections near absorption edges in the soft X-ray region. AIP Conf. Proc. 652, 370–377. doi:10.1063/1.1536398
Chantler, C. T., and Bourke, J. D. (2010). X-Ray spectroscopic measurement of photoelectron inelastic mean free paths in molybdenum. J. Phys. Chem. Lett. 1, 2422–2427. doi:10.1021/jz100776h
Chantler, C. T., Olsen, K., Dragoset, R. A., Chang, J., Kishore, A. R., Kotochigova, S. A., et al. (2005). X-ray form factor, attenuation and scattering tables. Available at: http://physics.nist.gov/ffast.
Chateau-Thierry, A., Gladieux, A., and Delaunay, B. (1976). Experimental neutral charge fractions in proton beams emerging from solids. Nucl. Instrum. Methods 132, 553–558. doi:10.1016/0029-554x(76)90791-6
Chen, R. B., Chang, C. P., Lee, C. H., and Lin, M. F. (2007). Electron energy loss spectra of finite carbon nanotubes. J. Appl. Phys. 101, 114305. doi:10.1063/1.2737627
Chen, Y. F., and Kwei, C. M. (1996). Electron differential inverse mean free path for surface electron spectroscopy. Surf. Sci. 364, 131–140. doi:10.1016/0039-6028(96)00616-4
Chu, W., Ziegler, J., Mitchell, I., and Mackintosh, W. (1973). Energy-loss measurements of 4He ions in heavy metals. Appl. Phys. Lett. 22, 439–437. doi:10.1063/1.1654703
Córdoba, R., Orús, P., Strohauer, S., Torres, T. E., and De Teresa, J. M. (2019). Ultra-fast direct growth of metallic micro- and nano-structures by focused ion beam irradiation. Sci. Rep. 9, 14076. doi:10.1038/s41598-019-50411-w
Da, B., Shinotsuka, H., Yoshikawa, H., Ding, Z. J., and Tanuma, S. (2014). Extended Mermin method for calculating the electron inelastic mean free path. Phys. Rev. Lett. 113, 063201. doi:10.1103/physrevlett.113.063201
Da, B., Sun, Y., Mao, S. F., Zhang, Z. M., Jin, H., Yoshikawa, H., et al. (2013). A reverse Monte Carlo method for deriving optical constants of solids from reflection electron energy-loss spectroscopy spectra. J. Appl. Phys. 113, 214303. doi:10.1063/1.4809544
Dapor, M. (2022). Aluminum electron energy loss spectra. A comparison between Monte Carlo and experimental data. Front. Mater. 9, 1068196. doi:10.3389/fmats.2022.1068196
Dapor, M. (2020). Transport of energetic electrons in solids. Computer simulation with applications to materials analysis and characterization. Cham, Switzerland: Springer International Publishing AG.
de Vera, P., Abril, I., and Garcia-Molina, R. (2021). Excitation and ionisation cross-sections in condensed-phase biomaterials by electrons down to very low energy: application to liquid water and genetic building blocks. Phys. Chem. Chem. Phys. 23, 5079–5095. doi:10.1039/d0cp04951d
de Vera, P., and Garcia-Molina, R. (2019). Electron inelastic mean free paths in condensed matter down to a few electronvolts. J. Phys. Chem. C 123, 2075–2083. doi:10.1021/acs.jpcc.8b10832
de Vera, P., Surdutovich, E., Abril, I., Garcia-Molina, R., and Solov’yov, A. V. (2014). Analytical model of ionization and energy deposition by proton beams in subcellular compartments. Eur. Phys. J. D 68, 96. doi:10.1140/epjd/e2014-50041-7
Denton, C. D., Abril, I., Garcia-Molina, R., Moreno-Marín, J. C., and Heredia-Avalos, S. (2008a). Influence of the description of the target energy-loss function on the energy loss of swift projectiles. Surf. Interface Analysis 40, 1481–1487. doi:10.1002/sia.2936
Denton, C. D., Abril, I., Moreno-Marín, J. C., Heredia-Avalos, S., and Garcia-Molina, R. (2008b). Energy loss of swift H and He projectiles in Al, Si, Ni and Cu targets. Phys. Status Solidi B- Basic Sol. State Phys. 245, 1498–1504. doi:10.1002/pssb.200743283
Desmarais, D., and Duggan, J. L. (1984). An undergraduate α-particle time-of-flight experiment for determining the mean excitation energy for electronic stopping power of Al, Cu, Ag, and Au. Am. J. Phys. 52, 408–411. doi:10.1119/1.13626
Dingfelder, M., Hantke, D., Inokuti, M., and Paretzke, H. G. (1998). Electron inelastic-scattering cross sections in liquid water. Radiat. Phys. Chem. 53, 1–18. doi:10.1016/s0969-806x(97)00317-4
Ditchburn, R. W., and Freeman, G. H. C. (1966). The optical constants of aluminium from 12 to 36 eV, in Proceedings of the Royal Society of London. Series A. Math. Phys. Sci. 294, 20–37.
Diwan, P., and Kumar, S. (2015). d E/d x and range of α-radiations in Al, Ti and Ni metallic foils. Nucl. Instrum. Methods Phys. Res. B - Beam Interact. Mater. Atoms 359, 78–84. doi:10.1016/j.nimb.2015.07.093
Eckardt, J. C., and Lantschner, G. H. (2001). Experimental energy straggling of protons in thin solid foils. Nucl. Instrum. Methods Phys. Res. B - Beam Interact. Mater. Atoms 175-177, 93–97. doi:10.1016/s0168-583x(00)00623-6
Egerton, R. F. (2011). Electron energy-loss spectroscopy in the electron microscope. New York: Springer.
Egerton, R. F. (2009). Electron energy-loss spectroscopy in the TEM. Rep. Prog. Phys. 72, 016502. doi:10.1088/0034-4885/72/1/016502
Emfietzoglou, D. (2003). Inelastic cross-sections for electron transport in liquid water: A comparison of dielectric models. Radiat. Phys. Chem. 66, 373–385. doi:10.1016/s0969-806x(02)00504-2
Emfietzoglou, D., Kyriakou, I., Garcia-Molina, R., and Abril, I. (2013). The effect of static many-body local-field corrections to inelastic electron scattering in condensed media. J. Appl. Phys. 114, 144907. doi:10.1063/1.4824541
Emfietzoglou, D., Kyriakou, I., Garcia-Molina, R., and Abril, I. (2017). Inelastic mean free path of low-energy electrons in condensed media: beyond the standard models. Surf. Interface Analysis 49, 4–10. doi:10.1002/sia.5878
Emfietzoglou, D., and Nikjoo, H. (2005). The effect of model approximations on single-collision distributions of low-energy electrons in liquid water. Radiat. Res. 163, 98–111. doi:10.1667/rr3281
Eppacher, C., and Semrad, D. (1992). Dependence of proton and helium energy loss in solids upon plasma properties. Nucl. Instrum. Methods Phys. Res. B - Beam Interact. Mater. Atoms 69, 33–38. doi:10.1016/0168-583x(92)95735-a
Fano, U. (1963). Penetration of protons, alpha particles, and mesons. Annu. Rev. Nucl. Sci. 13, 1–66. doi:10.1146/annurev.ns.13.120163.000245
Fermi, E. (1940). The Ionization Loss of Energy in Gases and in Condensed Materials. Phys. Rev. 57, 485–493. doi:10.1103/PhysRev.57.485
Fernández-Varea, J. M., Mayol, R., Liljequist, D., and Salvat, F. (1993). Inelastic scattering of electrons in solids from a generalized oscillator strength model using optical and photoelectric data. J. Phys. Condens. Matter 5, 3593–3610. doi:10.1088/0953-8984/5/22/011
Fitting, H. J. (1974). Transmission, energy distribution, and SE excitation of fast electrons in thin solid films. Phys. Status Solidi (a) 26, 525–535. doi:10.1002/pssa.2210260216
Flores-Mancera, M. A., Villarrubia, J. S., and Massillon-JL, G. (2020). Electron inelastic mean free paths for LiF, CaF2, Al2O3, and liquid water from 433 keV down to the energy gap. ACS Omega 5, 4139–4147. doi:10.1021/acsomega.9b03872
Friedland, E., and Kotze, C. P. (1981). Energy-loss straggling of protons, deuterons and α-particles in copper. Nucl. Instrum. Methods Phys. Res. 191, 490–494. doi:10.1016/0029-554x(81)91050-8
Garber, F. W., Nakai, M. Y., Harter, J. A., and Birkhoff, R. D. (1971). Low-energy electron beam studies in thin aluminum foils. J. Appl. Phys. 42, 1149–1158. doi:10.1063/1.1660159
Garcia-Molina, R., Abril, I., Heredia-Avalos, S., Kyriakou, I., and Emfietzoglou, D. (2011). A combined molecular dynamics and Monte Carlo simulation of the spatial distribution of energy deposition by proton beams in liquid water. Phys. Med. Biol. 56, 6475–6493. doi:10.1088/0031-9155/56/19/019
Garcia-Molina, R., Abril, I., Kyriakou, I., and Emfietzoglou, D. (2012). “Energy loss of swift protons in liquid water: Role of optical data input and extension algorithms,” in Radiation Damage to Biomolecular Systems. G. García Gómez-Tejedor, and M. C. Fuss (Editors). Dordrecht: Springer Science+Business Media B.V.
Gergely, G., Menyhard, M., Gurban, S., Toth, J., and Varga, D. (2004). Experimental measurements of the surface excitation parameters of Cu, Au, Ni, Ag, Ge and Pd based on Si and other reference standard materials. Surf. Interface Analysis 36, 1098–1101. doi:10.1002/sia.1849
Gibaru, Q., Inguimbert, C., Caron, P., Raine, M., Lambert, D., and Puech, J. (2021). Geant4 physics processes for microdosimetry and secondary electron emission simulation: extension of MicroElec to very low energies and 11 materials (C, Al, Si, Ti, Ni, Cu, Ge, Ag, W, Kapton and SiO2). Nucl. Instrum. Methods Phys. Res. B - Beam Interact. Mater. Atoms 487, 66–77. doi:10.1016/j.nimb.2020.11.016
Goldstein, J. I., Newbury, D. E., Michael, J. R., Ritchie, N. W. M., Scott, J. H. J., and Joy, D. C. (2018). Scanning electron microscopy and X-ray microanalysis. New York: Springer.
Grande, P. L., and Schiwietz, G. (2002). The unitary convolution approximation for heavy ions. Nucl. Instrum. Methods Phys. Res. B - Beam Interact. Mater. Atoms 195, 55–63. doi:10.1016/s0168-583x(01)01164-8
Harith, M., Osman, W., Gaafar, N., and El-Nadi, L. (1987). Stopping power measurements for megaelectronvolt 4He+ ions via thin films of metals and binary metal alloys. Thin Solid Films 149, 219–224. doi:10.1016/0040-6090(87)90298-7
Henke, B., Gullikson, E., and Davis, J. (1993). X-ray interactions: photoabsorption, scattering, transmission, and reflection at E = 50-30,000 eV, Z = 1-92. Atomic Data Nucl. Data Tables 54, 181–342. doi:10.1006/adnd.1993.1013
Heredia-Avalos, S., Abril, I., Denton, C. D., Moreno-Marín, J. C., and Garcia-Molina, R. (2007). Target inner-shells contributions to the stopping power and straggling for H and He ions in gold. J. Phys. Condens. Matter 19, 466205. doi:10.1088/0953-8984/19/46/466205
Heredia-Avalos, S., Garcia-Molina, R., Fernández-Varea, J. M., and Abril, I. (2005). Calculated energy loss of swift He, Li, B, and N ions in SiO2, Al2O3, and ZrO2. Phys. Rev. A - Atomic, Mol. Opt. Phys. 72, 052902. doi:10.1103/PhysRevA.72.052902
Heredia-Avalos, S., and Garcia-Molina, R. (2002). Projectile polarization effects in the energy loss of swift ions in solids. Nucl. Instrum. Methods Phys. Res. B - Beam Interact. Mater. Atoms 193, 15–19. doi:10.1016/s0168-583x(02)00720-6
Heredia-Avalos, S., and Garcia-Molina, R. (2007). Reduction of the energy loss of swift molecular ions in solids due to vicinage effects in the charge state. Phys. Rev. A - Atomic, Mol. Opt. Phys. 76, 032902. doi:10.1103/physreva.76.032902
Hoffman, G. E., and Powers, D. (1976). Energy straggling ofαparticles in solid materials. Phys. Rev. A - Atomic, Mol. Opt. Phys. 13, 2042–2048. doi:10.1103/physreva.13.2042
Hovington, P., Joy, D. C., Gauvin, R., and Evans, N. (1996). Scanning Microscopy. Unpublished data. For a summary see. Editors D. C. Joy, S. Luo, R. Gauvin, P. Hovington, and N. Evans 10, 653–666.
Hsu, J. Y., Yu, Y. C., Liang, J. H., Chen, K. M., and Niu, H. (2004). Energy loss of He, Li and B isotopes with MeV energies in Au. Nucl. Instrum. Methods Phys. Res. B - Beam Interact. Mater. Atoms 219-220, 251–255. doi:10.1016/j.nimb.2004.01.063
Hsu, J., Yu, Y., Liang, J., and Chen, K. (2005). Experimental stopping forces in aluminum and silver by 3He/4He, 6Li/7Li and 10B/11B ions. Nucl. Instrum. Methods Phys. Res. B - Beam Interact. Mater. Atoms 241, 155–159. doi:10.1016/j.nimb.2005.07.077
Huheey, J. E., Keiter, E. A., and Keiter, R. L. (1993). Inorganic chemistry: Principles of structure and reactivity. New York: Harper Collins College Publishers.
Huth, M., Porrati, F., and Dobrovolskiy, O. V. (2018). Focused electron beam induced deposition meets materials science. Microelectron. Eng. 185–186, 9–28. doi:10.1016/j.mee.2017.10.012
Iakoubovskii, K., Mitsuishi, K., Nakayama, Y., and Furuya, K. (2008). Mean free path of inelastic electron scattering in elemental solids and oxides using transmission electron microscopy: atomic number dependent oscillatory behavior. Phys. Rev. B - Condens. Matter Mater. Phys. 77, 104102. doi:10.1103/physrevb.77.104102
ICRU (1993). Report 49 - Stopping powers and ranges for protons and alpha particles. Bethesda, Maryland: International Commission on Radiation Units and Measurements.
Inokuti, M. (1971). Inelastic collisions of fast charged particles with atoms and molecules—the Bethe theory revisited. Rev. Mod. Phys. 43, 297–347. doi:10.1103/revmodphys.43.297
International Atomic Energy Agency Nuclear Data Services (2021). Electronic stopping power of matter for ions. Graphs, Data, Comments and Programs. Available at: https://www-nds.iaea.org/stopping.
Ishigure, N., Mori, C., and Watanabe, T. (1978). Electron stopping power in aluminum in the energy region from 2 to 10.9 keV. J. Phys. Soc. Jpn. 44, 973–978. doi:10.1143/jpsj.44.973
Izmailov, Sh. Z., Sirotinin, E. I., and Tulinov, A. F. (1980). Energy loss of protons in Si, Ge and Mo. Nucl. Instrum. Methods Phys. Res. B - Beam Interact. Mater. Atoms 168, 81–84. doi:10.1016/0029-554x(80)91235-5
Jablonski, A. (2016). Analytical theory of elastic electron backscattering from elements, alloys and compounds: comparison with experimental data. J. Electron Spectrosc. Relat. Phenom. 206, 24–45. doi:10.1016/j.elspec.2015.10.006
Janes, D. B., Batistuta, M., Datta, S., Melloch, M. R., Andres, R. P., Liu, J., et al. (2000). Interface and contact structures for nanoelectronic devices using assemblies of metallic nanoclusters, conjugated organic molecules and chemically stable semiconductor layers. Superlattices Microstruct. 27, 555–563. doi:10.1006/spmi.2000.0882
Jesse, S., Borisevich, A. Y., Fowlkes, J. D., Lupini, A. R., Rack, P. D., Unocic, R. R., et al. (2016). Directing matter: toward atomic-scale 3D nanofabrication. ACS Nano 10, 5600–5618. doi:10.1021/acsnano.6b02489
Jeynes, C., Barradas, N. P., and Szilágyi, E. (2012). Accurate determination of quantity of material in thin films by Rutherford backscattering spectrometry. Anal. Chem. 84, 6061–6069. doi:10.1021/ac300904c
Joy, D. C. (1995). A database on electron-solid interactions. Scanning 17, 270–275. doi:10.1002/sca.4950170501
Kanter, H. (1970a). Electron mean free path near 2 keV in aluminum. Phys. Rev. B - Condens. Matter Mater. Phys. 1 (5), 2357–2358. doi:10.1103/physrevb.1.2357
Kanter, H. (1970b). Slow-electron mean free paths in aluminum, silver, and gold. Phys. Rev. B - Condens. Matter Mater. Phys. 1 (2), 522–536. doi:10.1103/physrevb.1.522
Kawano, A., and Kido, Y. (1988). Effects of energy straggling on surface analysis with fast ion beams. J. Appl. Phys. 63, 75–79. doi:10.1063/1.340465
Kempson, I. (2021). Mechanisms of nanoparticle radiosensitization. Wiley Interdiscip. Rev. - Nanomedicine and Nanobiotechnology 13, e1656. doi:10.1002/wnan.1656
Khodyrev, V. A., Mizgulin, V. N., Sirotinin, E. I., and Tulinov, A. F. (1984). Stopping cross sections of 80- to 500-KeV protons in phosphorus compounds. Radiat. Eff. 83, 21–37. doi:10.1080/00337578408215788
Kido, Y. (1986). Energy and Z2 dependences of energy straggling for fast proton beams passing through solids. Phys. Rev. B - Condens. Matter Mater. Phys. 34, 73–77. doi:10.1103/physrevb.34.73
Kido, Y. (1987). Energy straggling for fast proton beams passing through solid materials. Nucl. Instrum. Methods Phys. Res. B - Beam Interact. Mater. Atoms 24-25, 347–352. doi:10.1016/0168-583x(87)90658-6
Kido, Y., and Hioki, T. (1983). Measurements of energy loss and straggling for fast H+ in metals and their compounds by means of a nuclear resonant reaction. Phys. Rev. B - Condens. Matter Mater. Phys. 27 (5), 2667–2673. doi:10.1103/physrevb.27.2667
Kido, Y., and Koshikawa, T. (1991). Energy straggling for medium-energy H+ beams penetrating Cu, Ag, and Pt. Phys. Rev. A - Atomic, Mol. Opt. Phys. 44, 1759–1767. doi:10.1103/physreva.44.1759
Knapp, J. A., Himpsel, F. J., and Eastman, D. E. (1979). Experimental energy band dispersions and lifetimes for valence and conduction bands of copper using angle-resolved photoemission. Phys. Rev. B - Condens. Matter Mater. Phys. 19, 4952–4964. doi:10.1103/physrevb.19.4952
Kuldeep, , and Jain, A. K. 1985 Stopping cross sections of He+ ions in bismuth, Nucl. Instrum. Methods Phys. Res. B - Beam Interact. Mater. Atoms 9, 259–262. doi:10.1016/0168-583x(85)90748-7
Kumar, S., and Diwan, K. P. (2018). Energy loss and range of α-particles in different metallic foils. Radiat. Eff. Defects Solids 173, 970–977. doi:10.1080/10420150.2018.1513002
Kuncic, Z., and Lacombe, S. (2018). Nanoparticle radio-enhancement: principles, progress and application to cancer treatment. Phys. Med. Biol. 63, 02TR01. doi:10.1088/1361-6560/aa99ce
Kwei, C., Chen, Y. F., Tung, C., and Wang, J. (1993). Electron inelastic mean free paths for plasmon excitations and interband transitions. Surf. Sci. 293, 202–210. doi:10.1016/0039-6028(93)90314-a
Leminen, E., and Fontell, A. (1974). Stopping power of Ti, Mo, Ag, Ta and W for 0.5-1.75 MeV 4He ions. Radiat. Eff. 22, 39–44. doi:10.1080/00337577408232143
Lesiak, B., Jablonski, A., Zommer, L., Kosinski, A. A. N. D., Gergely, G. K. A., Sulyok, A., et al. (1996). Proc. 6th Eur. Conf. Appl. Surf. Interface Analysis - ECASIA ’95 11, 619–622.
Lin, W. K., Olson, H. G., and Powers, D. (1973). Alpha-particle stopping cross section of solids from 0.3 to 2.0 MeV. Phys. Rev. B - Condens. Matter Mater. Phys. 8 (5), 1881–1888. doi:10.1103/physrevb.8.1881
Lindau, I., Pianetta, P., Yu, K. Y., and Spicer, W. E. (1976). Determination of the escape depth of photoemitted electrons in gold in the energy range 25-75 eV by use of synchrotron radiation. J. Electron Spectrosc. Relat. Phenom. 8, 487–491. doi:10.1016/0368-2048(76)80036-9
Lindhard, J. (1954). On the Properties of a Gas of Charged Particles. Danske Matematisk-fysiske Meddelelser 28 (8), 1–57.
Loeffler, J. S., and Durante, M. (2013). Charged particle therapy—Optimization, challenges and future directions. Clin. Oncol. 10, 411–424. doi:10.1038/nrclinonc.2013.79
Luo, S., Zhang, X., and Joy, D. C. (1991). Experimental determinations of electron stopping power at low energies. Radiat. Eff. Defects Solids 117, 235–242. doi:10.1080/10420159108220619
Manfrinato, V. R., Wen, J., Zhang, L., Yang, Y., Hobbs, R. G., Baker, B., et al. (2014). Determining the resolution limits of electron-beam lithography: direct measurement of the point-spread function. Nano Lett. 14, 4406–4412. doi:10.1021/nl5013773
Martínez-Tamayo, G., Eckardt, J. C., Lantschner, G. H., and Arista, N. R. (1996). Energy loss of H+ and He+ in Al, Zn, and Au in the very low-to intermediate-energy range. Phys. Rev. A - Atomic, Mol. Opt. Phys. 54 (4), 3131–3138. doi:10.1103/physreva.54.3131
Mathewson, A. G., and Myers, H. P. (1971). Absolute values of the optical constants of some pure metals. Phys. Scr. 4, 291–292. doi:10.1088/0031-8949/4/6/009
Mermin, N. D. (1970). Lindhard dielectric function in the relaxation-time approximation. Phys. Rev. B - Condens. Matter Mater. Phys. 1, 2362–2363. doi:10.1103/physrevb.1.2362
Moiseiwitsch, B. L., and Smith, S. J. (1968). Electron impact excitation of atoms. Rev. Mod. Phys. 40, 238–353. doi:10.1103/revmodphys.40.238
Møller, S. P., Csete, A., Ichioka, T., Knudsen, H., Kristiansen, H. P., Uggerhøj, U. I., et al. (2008). Antiproton and proton energy loss straggling at keV energies. Eur. Phys. J. D 46, 89–92. doi:10.1140/epjd/e2007-00314-3
Møller, S. P., Csete, A., Ichioka, T., Knudsen, H., Uggerhøj, U. I., and Andersen, H. H. (2002). Antiproton stopping at low energies: confirmation of velocity-proportional stopping power. Phys. Rev. Lett. 88 (19), 193201. doi:10.1103/physrevlett.88.193201
Montanari, C. C., Archubi, C. D., Mitnik, D. M., and Miraglia, J. E. (2009). Energy loss of protons in Au, Pb, and Bi using relativistic wave functions. Phys. Rev. A - Atomic, Mol. Opt. Phys. 79, 032903. doi:10.1103/physreva.79.032903
Montanari, C. C., and Miraglia, J. E. (2013). The energy loss straggling of low Z ions in solids and gases. AIP Conf. Proc. 1525, 259–269. doi:10.1063/1.4802331
Montanari, C. C., and Miraglia, J. E. (2017). Low- and intermediate-energy stopping power of protons and antiprotons in solid targets. Phys. Rev. A - Atomic, Mol. Opt. Phys. 96 (1), 012707. doi:10.1103/physreva.96.012707
Montanari, C. C., and Miraglia, J. E. (2019). Stopping power of protons in transition metals of the groups V and VI. Nucl. Instrum. Methods Phys. Res. B - Beam Interact. Mater. Atoms 460, 27–29. doi:10.1016/j.nimb.2018.10.046
Mookerjee, S., Beuve, M., Khan, S. A., Toulemonde, M., and Roy, A. (2008). Sensitivity of ion-induced sputtering to the radial distribution of energy transfers: A molecular dynamics study. Phys. Rev. B - Condens. Matter Mater. Phys. 78 (4), 045435. doi:10.1103/physrevb.78.045435
Moro, M. V., Bauer, P., and Primetzhofer, D. (2020). Experimental electronic stopping cross section of transition metals for light ions: systematics around the stopping maximum. Phys. Rev. A - Atomic, Mol. Opt. Phys. 102, 022808. doi:10.1103/physreva.102.022808
Moro, M. V., Silva, T. F., Mangiarotti, A., Guimarães Filho, Z. O., and Rizzutto, M. A. (2016). Traceable stopping cross sections of Al and Mo elemental targets for 0.9–3.6-MeV protons. Phys. Rev. A - Atomic, Mol. Opt. Phys. 93, 022704. doi:10.1103/physreva.93.022704
Mott, N. F. (1930). The collision between two electrons, Proceedings of the Royal Society A: Mathematical. Phys. Eng. Sci. 126, 259–267. doi:10.1098/rspa.1930.0006
Moussa, D., Damache, S., and Ouichaoui, S. (2015). Accurate stopping power measurements for (0.21–2.68)MeV/u 1H+ and 4He+ ions crossing thin Al foils; extraction of the (I, b) parameters. Nucl. Instrum. Methods Phys. Res. B - Beam Interact. Mater. Atoms 343, 44–47. doi:10.1016/j.nimb.2014.11.007
Nastasi, M., Mayer, J. W., and Hirvonen, J. K. (1996). Ion-solid interactions: Fundamentals and applications. Cambridge: Cambridge University Press.
Nguyen-Truong, H. T. (2013). Determination of the maximum energy loss for electron stopping power calculations and its effect on backscattering electron yield in Monte-Carlo simulations applying continuous slowing-down approximation. J. Appl. Phys. 114, 163513. doi:10.1063/1.4827843
Nguyen-Truong, H. T. (2017). Electron inelastic mean free path at energies below 100 eV. J. Phys. Condens. Matter 29, 215501. doi:10.1088/1361-648x/aa6b9d
Nikjoo, H., Uehara, S., and Emfietzoglou, D. (2012). Interaction of radiation with matter. Boca Raton, FL, USA: CRC Press.
Nomura, A., Matsubara, F., and Kiyono, S. (1976). Monte Carlo simulation on energy distribution of low energy protons passing through copper films. J. Appl. Phys. 15, 2495–2496. doi:10.1143/jjap.15.2495
Ochkur, V. I. (1965). Ionization of the hydrogen atom by electron impact with allowance for the exchange. Sov. Phys. - JETP 20, 1175–1178.
Ogawa, S., Nagano, H., and Petek, H. (1997). Hot-electron dynamics at Cu(100), Cu(110), and Cu(111) surfaces: Comparison of experiment with Fermi-liquid theory. Phys. Rev. B - Condens. Matter Mater. Phys. 55, 10869–10877. doi:10.1103/physrevb.55.10869
Oppenheimer, J. R. (1928). On the quantum theory of electronic impacts. Phys. Rev. 32 (3), 361–376. doi:10.1103/physrev.32.361
Palik, E. D., and Ghosh, G. (1999). The electronic handbook of optical constants of solids. San Diego: Academic Press.
Pappas, D. P., Kamper, K. P., Miller, B. P., Hopster, H., Fowler, D. E., Brundle, C. R., et al. (1991). Spin-dependent electron attenuation by transmission through thin ferromagnetic films. Phys. Rev. Lett. 66, 504–507. doi:10.1103/physrevlett.66.504
Pauly, N., Yubero, F., and Tougaard, S. (2020). Optical properties of molybdenum in the ultraviolet and extreme ultraviolet by reflection electron energy loss spectroscopy. Appl. Opt. 59, 4527–4532. doi:10.1364/ao.391014
Pedrielli, A., de Vera, P., Trevisanutto, P. E., Pugno, N. M., Garcia-Molina, R., Abril, I., et al. (2021). Electronic excitation spectra of cerium oxides: from ab initio dielectric response functions to Monte Carlo electron transport simulations. Phys. Chem. Chem. Phys. 23, 19173–19187. doi:10.1039/d1cp01810h
Penalba, M., Arnau, A., Echenique, P. M., Flores, F., and Rh, R. (1992). Stopping power for protons in aluminum. Europhys. Lett. 19, 45–50. doi:10.1209/0295-5075/19/1/008
Poignant, F., Ipatov, A., Chakchir, O., Lartaud, P. J., Testa, É., Gervais, B., et al. (2020). Theoretical derivation and benchmarking of cross sections for low-energy electron transport in gold. Eur. Phys. J. Plus 135, 358. doi:10.1140/epjp/s13360-020-00354-3
Powell, C. J., Stein, R. J., Needham, P. B., and Driscoll, T. J. (1977). Attenuation lengths of low-energy electrons in solids derived from the yield of proton-excited auger electrons: beryllium and aluminum. Phys. Rev. B - Condens. Matter Mater. Phys. 16 (4), 1370–1379. doi:10.1103/physrevb.16.1370
Prasad, S. S. (1965). Electron exchange in impact ionization of atomic hydrogen. Proc. Phys. Soc. 85, 57–59. doi:10.1088/0370-1328/85/1/308
Primetzhofer, D. (2012). Inelastic energy loss of medium energy H and He ions in Au and Pt: Deviations from velocity proportionality. Phys. Rev. B - Condens. Matter Mater. Phys. 86, 094102. doi:10.1103/PhysRevB.86.094102
Ritchie, R. H. (1959). Interaction of charged particles with a degenerate Fermi-Dirac electron gas. Phys. Rev. 114, 644–654. doi:10.1103/physrev.114.644
Ritchie, R. H. (1957). Plasma losses by fast electrons in thin films. Phys. Rev. 106, 874–881. doi:10.1103/physrev.106.874
Rudd, M. E., Kim, Y. K., Madison, D. H., and Gay, T. J. (1992). Electron production in proton collisions with atoms and molecules: energy distributions. Rev. Mod. Phys. 64, 441–490. doi:10.1103/revmodphys.64.441
Rudd, M., Kim, Y. K., Märk, T., Schou, J., Stolterfoht, N., and Toburen, L. (1996). ICRU Report 55 - Secondary electron spectra from charged particle interactions. Bethesda, Maryland: International Commission on Radiation Units and Measurements.
Rudge, M. R. H. (1965). The scattering of electrons by hydrogen atoms. Proc. Phys. Soc. 86, 763–772. doi:10.1088/0370-1328/86/4/311
Rudge, M. R. (1968). Theory of the ionization of atoms by electron impact. Rev. Mod. Phys. 40, 564–590. doi:10.1103/revmodphys.40.564
Schardt, D., Elsässer, T., and Schulz-Ertner, D. (2010). Heavy-ion tumor therapy: physical and radiobiological benefits. Rev. Mod. Phys. 82, 383–425. doi:10.1103/revmodphys.82.383
Schiwietz, G., and Grande, P. L. (2001). Improved charge-state formulas. Nucl. Instrum. Methods Phys. Res. B - Beam Interact. Mater. Atoms 175–177, 125–131. doi:10.1016/S0168-583X(00)00583-8
Schiwietz, G., and Grande, P. L. (2012). Stopping of protons – improved accuracy of the UCA model. Nucl. Instrum. Methods Phys. Res. B - Beam Interact. Mater. Atoms 273, 1–5. doi:10.1016/j.nimb.2011.07.023
Schleife, A., Kanai, Y., and Correa, A. A. (2015). Accurate atomistic first-principles calculations of electronic stopping. Phys. Rev. B - Condens. Matter Mater. Phys. 91 (1), 014306. doi:10.1103/physrevb.91.014306
Selau, F. F., Trombini, H., Marmitt, G. G., De Andrade, A. M., Morais, J., Grande, P. L., et al. (2020). Stopping and straggling of 60–250-keV backscattered protons on nanometric Pt films. Phys. Rev. A - Atomic, Mol. Opt. Phys. 102, 032812. doi:10.1103/physreva.102.032812
Semrad, D., Bauer, P., Aumayr, F., Huber, P., and Obermann, W. (1983). Search for an influence of the measuring method on stopping cross section data near the maximum. Nucl. Instrum. Methods Phys. Res. 218, 811–816. doi:10.1016/0167-5087(83)91088-8
Semrad, D., Eppacher, E., and Tober, R. (1990). The stopping power of Ag and Au, with regard to higher-order Z1-effects. Nucl. Instrum. Methods Phys. Res. B - Beam Interact. Mater. Atoms 48, 79–82. doi:10.1016/0168-583x(90)90078-9
Semrad, D., Mertens, P., and Bauer, P. (1986). Reference proton stopping cross sections for five elements around the maximum. Nucl. Instrum. Methods Phys. Res. B - Beam Interact. Mater. Atoms 15, 86–90. doi:10.1016/0168-583x(86)90259-4
Shiles, E., Sasaki, T., Inokuti, M., and Smith, D. Y. (1980). Self-consistency and sum-rule tests in the Kramers-Kronig analysis of optical data: applications to aluminum. Phys. Rev. B - Condens. Matter Mater. Phys. 22 (4), 1612–1628. doi:10.1103/physrevb.22.1612
Shiomi-Tsuda, N., Sakamoto, N., Ogawa, H., and Kitoba, U. (1999). Stopping powers of Al and Mo for protons from 0.3 to 3.0 MeV. Nucl. Instrum. Methods Phys. Res. B - Beam Interact. Mater. Atoms 159, 123–132. doi:10.1016/s0168-583x(99)00532-7
Sigmund, P. (2006). Particle penetration and radiation effects. General aspects and stopping of swift point charges. Berlin Heidelberg: Springer-Verlag.
Sigmund, P. (2013). “Elements of sputtering theory,” in Nanofabrication by Ion-Beam Sputtering: Fundamentals and applications. T. Som, and D. Kanjilal (Editors). Pan Stanford Publishing.
Sirotinin, E., Tulinov, A., Khodyrev, V., and Mizgulin, V. (1984). Proton energy loss in solids. Nucl. Instrum. Methods Phys. Res. B - Beam Interact. Mater. Atoms 4, 337–345. doi:10.1016/0168-583x(84)90577-9
Smith, D., Shiles, E., and Inokuti, M. (1983). “The optical properties and complex dielectric function of metallic aluminum from 0.04 to 104 eV,” Argonne National Laboratory Report ANL-83-24. Argonne, Illinois: Argonne National Laboratory Report.
Smith, D. Y. (1998). Dispersion theory, sum rules, and their application to the analysis of optical data. San Diego, CA: Academic Press.
Smith, D. Y., and Shiles, E. (1978). Finite-energy f-sum rules for valence electrons. Phys. Rev. B - Condens. Matter Mater. Phys. 17, 4689–4694. doi:10.1103/physrevb.17.4689
Solov’yov, A. V. (Editor) (2017). Nanoscale insights into ion-beam cancer therapy. Cham, Switzerland: Springer International Publishing AG.
Sze, S. M., Moll, J. L., and Sugano, T. (1963). Range-energy relation of hot electrons in Au. IEEE Trans. Electron Devices 10, 336. doi:10.1109/t-ed.1963.15234
Taioli, S., Trevisanutto, P. E., de Vera, P., Simonucci, S., Abril, I., Garcia-Molina, R., et al. (2021). Relative role of physical mechanisms on complex biodamage induced by carbon irradiation. J. Phys. Chem. Lett. 12, 487–493. doi:10.1021/acs.jpclett.0c03250
Taioli, S., Dapor, M., Dimiccoli, F., Fabi, M., Ferroni, V., Grimani, C., et al. (2023). The role of low-energy electrons in the charging process of LISA test masses, Class. Quantum Grav. 40, 075001. doi:10.1088/1361-6382/acbadd
Tanuma, S., Powell, C. J., and Penn, D. R. (2005). Calculations of stopping powers of 100 eV to 30 keV electrons in 10 elemental solids. Surf. Interface Analysis 37, 978–988. doi:10.1002/sia.2092
Tanuma, S., Powell, C. J., and Penn, D. R. (1993). Use of sum rules on the energy-loss function for the evaluation of experimental optical data. J. Electron Spectrosc. Relat. Phenom. 62, 95–109. doi:10.1016/0368-2048(93)80008-a
Tracy, J. C. (1974). Abstract: electron escape depths in aluminum. J. Vac. Sci. Technol. 11, 280. doi:10.1116/1.1318597
Trzaska, W. H., Lyapin, V., Alanko, T., Mutterer, M., Räisänen, J., Tjurin, G., et al. (2002). New approach to energy loss measurements. Nucl. Instrum. Methods Phys. Res. B - Beam Interact. Mater. Atoms 195, 147–165. doi:10.1016/s0168-583x(02)01255-7
Trzaska, W., Knyazheva, G., Perkowski, J., Andrzejewski, J., Khlebnikov, S., Kozulin, E., et al. (2018). New experimental stopping power data of 4He, 16O, 40Ar, 48Ca and 84Kr projectiles in different solid materials. Nucl. Instrum. Methods Phys. Res. B - Beam Interact. Mater. Atoms 418, 1–12. doi:10.1016/j.nimb.2017.12.025
Udalagama, C., Bettiol, A. A., and Watt, F. (2009). Stochastic spatial energy deposition profiles for MeV protons and keV electrons. Phys. Rev. B - Condens. Matter Mater. Phys. 80, 224107. doi:10.1103/physrevb.80.224107
Utke, I., Hoffmann, P., and Melngailis, J. (2008). Gas-assisted focused electron beam and ion beam processing and fabrication. J. Vac. Sci. Technol. B - Microelectron. Nanom. Struct. 26, 1276–1197. doi:10.1116/1.2955728
van Dijken, S., Jiang, X., and Parkin, S. S. P. (2002). Spin-dependent hot electron transport in Ni81Fe19 and Co84Fe16 films on GaAs(001). Phys. Rev. B - Condens. Matter Mater. Phys. 66, 094417. doi:10.1103/PhysRevB.66.094417
Verkhovtsev, A. V., Korol, A. V., and Solov’yov, A. V. (2015). Electron production by sensitizing gold nanoparticles irradiated by fast ions. J. Phys. Chem. C 119, 11000–11013. doi:10.1021/jp511419n
Vriens, L. (1966). Binary-encounter electron-atom collision theory. Phys. Rev. 141, 88–92. doi:10.1103/physrev.141.88
Weaver, J. H., Lynch, D. W., and Olson, C. G. (1974). Optical properties of V, Ta, and Mo from 0.1 to 35 eV. Phys. Rev. B - Condens. Matter Mater. Phys. 10, 501–516. doi:10.1103/physrevb.10.501
Werner, W. S., Glantschnig, K., and Ambrosch-Draxl, C. (2009). Optical constants and inelastic electron-scattering data for 17 elemental metals. J. Phys. Chem. Reference Data 38, 1013–1092. doi:10.1063/1.3243762
Windt, D. L., Cash, W. C., Scott, M., Arendt, P., Newnam, B., Fisher, R. F., et al. (1988). Optical constants for thin films of Ti, Zr, Nb, Mo, Ru, Rh, Pd, Ag, Hf, Ta, W, Re, Ir, Os, Pt, and Au from 24 Å to 1216 Å. Appl. Opt. 27, 246–278. doi:10.1364/ao.27.000246
Xu, H., Da, B., Tóth, J., Tokési, K., and Ding, Z. J. (2017). Absolute determination of optical constants by reflection electron energy loss spectroscopy. Phys. Rev. B - Condens. Matter Mater. Phys. 95, 195417. doi:10.1103/physrevb.95.195417
Yang, Q., O’Connor, D. J., and Wang, Z. (1991). Empirical formulae for energy loss straggling of ions in matter. Nucl. Instrum. Methods Phys. Res. B - Beam Interact. Mater. Atoms 61, 149–155. doi:10.1016/0168-583x(91)95454-l
Zdyb, R., Menteş, T. O., Locatelli, A., Niño, M. A., and Bauer, E. (2013). Inelastic mean free path from reflectivity of slow electrons. Phys. Rev. B - Condens. Matter Mater. Phys. 87, 075436. doi:10.1103/physrevb.87.075436
Zhang, Y., and Weber, W. J. (2009). Response of materials to single ion events. Nucl. Instrum. Methods Phys. Res. B - Beam Interact. Mater. Atoms 267, 1705–1712. doi:10.1016/j.nimb.2009.01.104
Zhang, Y., Weber, W. J., and Wang, C. M. (2004). Electronic stopping powers in silicon carbide. Phys. Rev. B - Condens. Matter Mater. Phys. 69, 205201. doi:10.1103/physrevb.69.205201
Zhang, Y., Weber, W. J., Razpet, A., and Possnert, O. (2005). Electronic stopping powers for He, Be and F ions in Au. Nucl. Instrum. Methods Phys. Res. B - Beam Interact. Mater. Atoms 227, 479–484. doi:10.1016/j.nimb.2004.10.082
Zhukov, V. P., Chulkov, E. V., and Echenique, P. M. (2006). Lifetimes and inelastic mean free path of low-energy excited electrons in Fe, Ni, Pt, and Au: Ab initio GW+T calculations. Phys. Rev. B - Condens. Matter Mater. Phys. 73, 125105. doi:10.1103/PhysRevB.73.125105
Ziegler, J. F. (2013). SRIM - The Stopping and Range of Ions in Matter. Available at: http://www.srim.org/.
Keywords: ion beams, electron beams, stopping power, energy-loss straggling, electronic cross section, metals, dielectric formalism, energy-loss function
Citation: de Vera P, Abril I and Garcia-Molina R (2023) Electronic cross section, stopping power and energy-loss straggling of metals for swift protons, alpha particles and electrons. Front. Mater. 10:1249517. doi: 10.3389/fmats.2023.1249517
Received: 28 June 2023; Accepted: 28 August 2023;
Published: 06 December 2023.
Edited by:
Shijun Zhao, City University of Hong Kong, Hong Kong SAR, ChinaReviewed by:
Karoly Tokesi, Institute for Nuclear Research (MTA), HungaryZine El Abidine Chaoui, University Ferhat Abbas of Setif, Algeria
Copyright © 2023 de Vera, Abril and Garcia-Molina. This is an open-access article distributed under the terms of the Creative Commons Attribution License (CC BY). The use, distribution or reproduction in other forums is permitted, provided the original author(s) and the copyright owner(s) are credited and that the original publication in this journal is cited, in accordance with accepted academic practice. No use, distribution or reproduction is permitted which does not comply with these terms.
*Correspondence: Pablo de Vera, cGFibG8udmVyYUB1bS5lcw==