 Kun Zhang
 Di Feng1*
- 1Department of Civil and Transportation Engineering, Hohai University, Nanjing, China
- 2China Railway Construction Underwater Shield Tunnel Engineering Laboratory, China Railway 14th Bureau Group Co., Ltd., Jinan, China
During flood season, embankments are often submerged in high water levels for extended periods, leading to deterioration in their soil mechanics performance and increasing the risk of slope instability and other hazards. In order to investigate the changes in mechanical properties of embankment slopes during long-term water immersion, direct shear tests were conducted. Scanning electron microscopy, chemical composition analysis, and laser particle size analysis were conducted on samples taken at different immersion periods. Clay samples were taken from the embankments at Jiangxinzhou in Nanjing, Jiangsu Province, China. Results showed the shear strength of the soil gradually decreases with the increase of immersion time, while the cohesive force and internal friction angle gradually decrease as well. This suggests that immersion has a softening effect on the shear strength of the soil. As the immersion time increases, the colloidal particles (soluble salt) rapidly dissolves, the microstructure of the soil is destroyed, and sticky particles increases, resulting in a change in the shear strength of the soil. The research results provide a basis for flood control and prevention of embankments immersed in high water levels for long periods during the flood season.
1 Introduction
In recent years, due to the frequent occurrence of extreme weather events during the flood season (Xie et al., 2023), the water levels of rivers, lakes, and seas have continued to rise under continuous heavy rainfall and have remained at high levels for a long time. The action of water leads to various forms of deterioration of the embankment soil, which can easily lead to dangerous situations such as landslides, collapses, and pipeline surges (Fujii et al., 2020; Lemmens et al., 2016; Zhou et al., 2023). On the early morning of 8 November 2017, around 5 o’clock, a river collapsed near Zhinan Village, Sanmao Street, Yangzhong City, Jiangsu Province, China. On the morning of 17 August 2020, at 7 o’clock, during an inspection, the government of Luoshui Town, Shifang City, Deyang City, Sichuan Province, China, discovered a dangerous situation in the Zhonghekou section of Shitingjiang, Luoshui Town. Due to the erosion of floodwaters, more than 250 m of the embankment collapsed, resulting in an economic loss of more than 4 million.
Existing literature has shown that soil strength is a critical parameter in assessing slope stability (Kimura et al., 2014; Lian et al., 2020; Namdar et al., 2020; Sassa et al., 2004; Wen and He, 2012) and that clay exhibits strong sensitivity to water (Philip, 1961). Changes in the water environment can cause changes in soil performance (Liang et al., 2018; Ma et al., 2023; Xu et al., 2012). For instance, Maihemuti et al. (2016) studied the influence of periodic changes in reservoir water level on landslide stability, while Ying et al. (2021) investigated the impact of long-term inundation on the chemical and mechanical properties of silty soil in the Three Gorges Reservoir area. After different immersion periods, Wen and Ji (2018) explored the residual strength changes of different slip zones in five large landslides. During flood season, embankments are often immersed in high water levels for extended periods, leading to the deterioration of soil characteristics due to the interaction between soil and water. It is generally recognized that water level fluctuations play a crucial role in the stability of embankment slopes. However, more attention must be paid to the strength variation and causes of disturbed clay in embankments immersed in high water levels for extended periods during flood season.
In addition, the particle size distribution of soil, soil bonding materials, and mechanical properties are closely related to the strength of the soil (Namdar et al., 2014; Nie et al., 2021; Song and Hong, 2020). The composition and properties of bonding materials determine the strength of the soil. Coarse mineral particles play a skeletal role in the soil structure, while finer particles often fill the gaps between the coarse particles. Bonding materials such as clay minerals and water-soluble salts also fill the gaps between coarse and fine particles, playing a bonding role. Fan et al. (2017) found that the volume and strength of loess samples decrease as the particle size decreases. Manmatharajan et al. (2023) studied how particle size distribution, acceptable powder content, and compressibility affect the strength after liquefaction in simple shear tests. Based on the above literature, laser particle size analyzers can obtain the particle size distribution under different immersion conditions and explore particle composition’s influence on the soil’s shear strength.
Using scanning electron microscopy, Lin and Cerato (2014) studied the applications of investigating the microstructure of shale weathering expansive soil during the expansion-contraction cycle, while Zhu et al. (2022) observed changes in the loess’s particle and pore size distribution. These studies demonstrate the potential of scanning electron microscopy for analyzing changes in soil structure and pore characteristics (Li et al., 2019; Sun et al., 2023; Tang et al., 2020). The impact of immersion time on disturbance-induced changes in clay structure in embankments remains unclear.
The embankment project refers to the water-retaining buildings built along rivers, lakes, canals, coasts, or flood zones. Flood zones, the edge of the part, are essential to China’s flood control engineering system. In recent years, the water level of rivers, lakes, and the sea has continued to increase due to the frequent occurrence of extreme weather during the flood season. The embankment has been in a submerged environment for a long time, resulting in an embankment deterioration phenomenon that can easily lead to landslides, subsidence, tube surge, and other dangerous situations. The research on the performance change of embankment body soil under long-term submergence conditions is still relatively small. This paper studies the deterioration mechanism of embankment flooding under long-term high-water level conditions during flood season.
Based on the above considerations, this research used direct shear tests, X-ray fluorescence spectrometry, laser particle size analyzers, and scanning electron microscopy techniques to explore the reasons for the change in the strength of disturbed clay in embankments with immersion time. The gray correlation entropy analysis algorithm was used to analyze the correlation between particle composition and soil strength indicators. The research results provide a basis for flood control and prevention of embankments immersed in high water levels for long periods during the flood season.
2 Materials and methods
2.1 Materials
Figure 1 presents a schematic diagram of the sampling positions. Per the soil mechanics testing standard (GB/T50123-2019) (2019), the specific gravity, liquid limit, maximum dry density, and optimum moisture content of the soil were determined through experimentation and shown in Table 1.
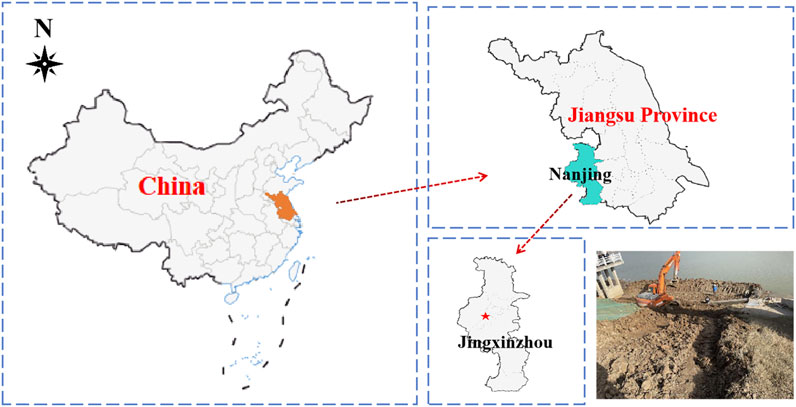
FIGURE 1. Sampling site in Nanjing, China.

TABLE 1. Basic physical characteristics.
The soil was placed in a drying box at 105°C to dry and then crushed. The dried soil sample was passed through a 2 mm sieve. It was then sprayed with distilled water until the water content reached 10%, stirred well, and sealed in a plastic bag for 48 h to allow the sample to be water-balanced.
2.2 Methods
Weigh according to the target dry density (1.5 g/cm3). Please place them in a mold with a diameter of 61.8 mm and a height of 20 mm, and samples are then made using the press sample method. After compaction, remove the molded samples. Eight groups of four samples each were prepared as remodeled soil samples with 10% water content and 1.5 g/cm3 density. After saturation by vacuum pumping method, one group was directly taken out and immersed in water for 1, 3, 5, 7, 10, 15, and 20 days.
Samples with different immersion times were placed in a shear box. The upper box was fixed, while the lower box could slide horizontally. Vertical pressures of 100, 200, 300, and 400 kPa were applied, respectively. Then, the horizontal shear force was gradually applied to the lower box of the shear box until the sample was sheared. The shear rate was set at v = 2 mm/min, the shear displacement was 6 mm, and the readings were recorded for every 0.2 mm shear displacement.
After drying and cooling the samples with different immersion times, they were ground into fine particles using a grinding rod. The prepared samples were stored in preservation bags. The samples were immersed in water for 0 and 20 days, respectively. The soil was tested using an X-ray fluorescence spectrometer.
The gradient of sample immersion time was 0, 1, 3, 5, 7, 10, 15, and 20 days. Appropriate quantities of samples were taken at each immersion time point for the tests. Perform particle size analysis on soil samples using a laser particle size analyzer. The impact of particle composition on soil shear strength was explored using the gray correlation entropy analysis algorithm.
The gradient of water immersion time was 0, 5, 10, and 20 days in order, and the samples were dried. A cubic rod of approximately 1 cm × 1 cm × 2 cm was cut from the middle of the ring knife sample after different immersion times and used as a scanning electron microscope sample. The specific operation steps of SEM testing were mentioned by Ni et al. (2020).
3 Results and analysis
3.1 Analysis of direct shear test results
The shear stress-shear displacement curves of samples at different immersion times were obtained through direct shear tests, as shown in Figure 2. It can be observed that both vertical stress and immersion time have significant influences on the shear stress-shear displacement curves of the soil.
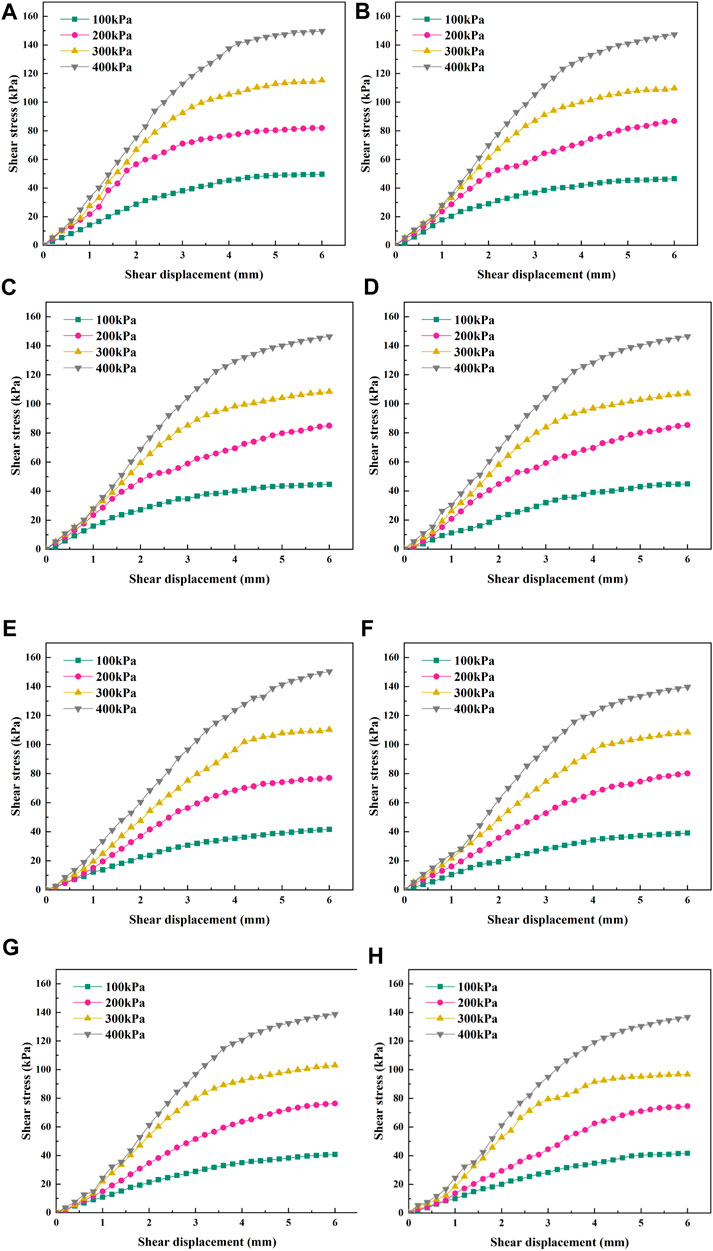
FIGURE 2. Straight shear test curve of samples under different immersion days. (A) 0 d; (B) 1 d; (C) 3 d; (D) 5 d; (E) 7 d; (F) 10 d; (G) 15 d; (H) 20 d.
Based on the experimental results, the failure strength curve of the sample under different immersion days and the shear strength curve of the test under different vertical pressures were drawn. As shown in Figure 3, the shear strength of the sample decreases with the increase of immersion days, indicating that immersion has a softening effect on the shear strength of the soil. At 400 kPa, with the increase of immersion days, the cumulative attenuation value of the failure and shear strengths is 18.4 kPa. When the vertical stress is low, the attenuation of shear strength is also low. When the axial pressure is 100 Pa, the cumulative attenuation value is 10.7 kPa.
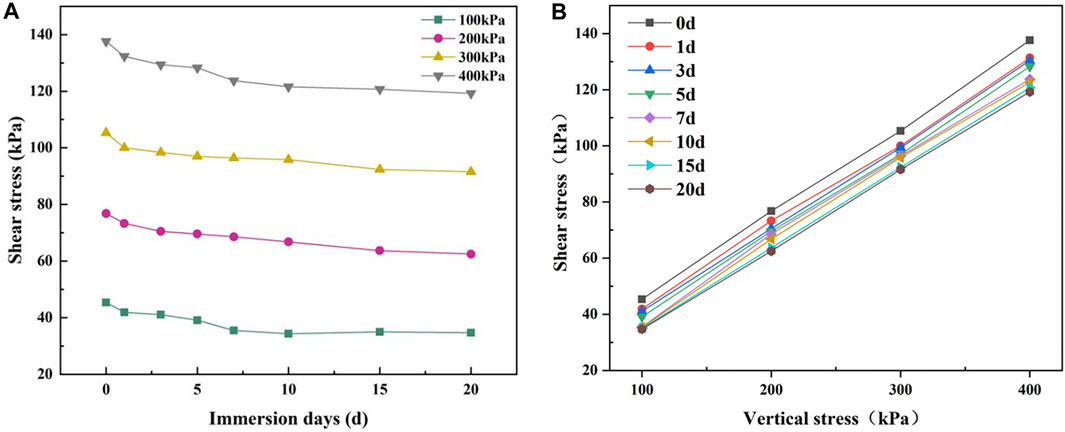
FIGURE 3. Failure strength curve and shear strength line of samples under different immersion days. (A) Relationship between sample shear stress and immersion time; (B) Relationship between sample shear strength and vertical stress.
The relationship curve between cohesive force, internal friction angle, and immersion time is shown in Figure 4. The cohesive force gradually decreases with the increase of immersion time, while the internal friction angle also gradually decreases. After immersion for 20 days, the cohesive force of the clay decreased by 57.6%, while the internal friction angle decreased by 8.43%, with a smaller decrease range.
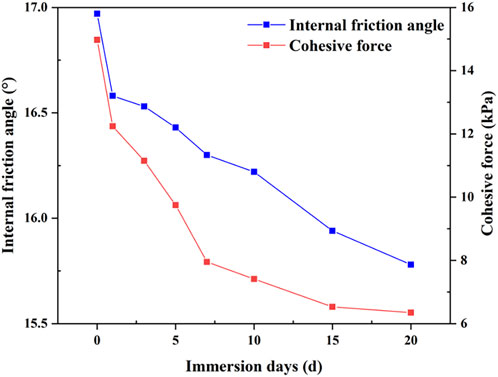
FIGURE 4. Relationship between sample strength index and immersion days.
3.2 Analysis of change in chemical composition
SiO2, AL2O3, and Fe2O3 are the soil’s primary chemical binding materials (Liu zhikui et al., 2017; Mou Chunmei and Wei Yux, 2019), with a total content of 88.01% of the soil’s chemical composition.
As shown in Figure 5, after immersion for 20 days, the SiO2 content increased by 1.69%, related to the hydrolysis equilibrium of SiO2 in the aqueous solution. AL2O3 and Fe2O3 content was lower than those of the unsoaked samples. The AL2O3 and Fe2O3 in the soil react with the aqueous solution, destroying the original binding structure of the soil and further crushing the original soil structure. The Na2O content decreased mainly due to the alternation adsorption of cations, which caused Na+ to leave the soil with the infiltrating liquid. CaO mainly exists in carbonate and sulfate minerals, and MgO and K2O mainly exist in calcite and orthoclase, respectively. The decrease in their content reflects the dissolution of corresponding mineral components. All these chemical reactions are beneficial to weaken the structural strength of the soil.

FIGURE 5. Changes in the main chemical composition of the sampless after different immersion days. (A) 0d; (B) 20 d.
3.3 Analysis of LPS test
Using a laser particle size analyzer, the experimental particle size distribution was tested, and the sand content (d > 0.075 mm), powder content (0.005 mm < d < 0.075 mm), and clay content (d < 0.005 mm) of the soil samples after different immersion times were statistically analyzed and plotted. As shown in Table 2, the particle size of the soil continuously became finer with the increase in immersion time. For example, after immersion for 20 days, the mass fraction of sand content (d > 0.075 mm) decreased by 9.47% due to its smaller base but significant decomposition, while the mass fraction of clay (d < 0.005 mm) increased by 5.83%, and the mass fraction of powder (0.005 mm < d < 0.075 mm) increased by 3.64%. Throughout the immersion process, the changes in soil particles mainly involved the transformation of medium and fine sand into powder, while powder gradually transformed into clay, and the mass fraction of sand gradually decreased. In contrast, the mass fraction of clay and powder gradually increased. Therefore, it can be concluded that once the soil is immersed in water, its structure is destroyed, the coarse particles disperse and decompose, and the content of medium and fine particles increases. With the increase of immersion days, the coarse particles further disperse and decompose, and the content of clay and powder gradually increases.
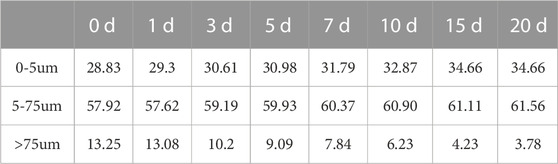
TABLE 2. Proportion of clay, silt and sand content (%).
After different immersion periods, statistical analysis was conducted on the usual particle size (including the characteristic particle size with cumulative particle distribution of 10%, 30%, 60%, and 99%). The specific data and changes are shown in Table 3. It can be observed from Table 3 that with the increase in immersion time, the characteristic particle size with cumulative particle distribution of 10%, 30%, 60%, and 99% of the soil particles continuously decreased. The change of the characteristic particle size with a cumulative particle distribution of 10% and 30% slowly decreased with the increase of immersion days. The decrease of the characteristic particle size with a cumulative particle distribution of 60% was divided into the pre-immersion period (0–10 days) and the pre-and post-immersion period (10–20 days). The usual particle size with a cumulative particle distribution of 99% decreased from 0 to 1 day.
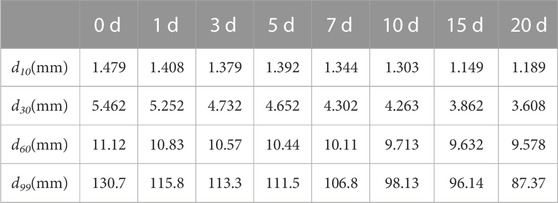
TABLE 3. Characteristic particle size.
The correlation between the content of clay particles, fine particles, sand particles, and soil strength indicators was calculated using gray correlation entropy analysis. The grey correlation analysis method was used to determine various factors’ varying degrees of influence on the dependent variable in complex systems (Deng et al., 2023; Zhang et al., 2019). Zhang Qishan et al. (1996) analyzed the two significant shortcomings of the existing gray correlation methods in 1996 and, based on Deng Julong’s gray correlation theory, introduced the concept of gray entropy and proposed the gray correlation analysis method, called the gray correlation entropy analysis method. The specific introduction of the gray correlation entropy analysis method is as follows (Wang et al., 2014).
If a gray correlation factor set denoted as
To normalize each sequence of
Using the comparative sequence as a reference, the gray correlation coefficient of each comparative sequence is calculated using the following formula:
According to the mapping relationship between the distribution of gray correlation coefficients between the reference sequence and the comparison sequence, the mapping value
By substituting
Finally, the grey entropy correlation degree of each comparative sequence was obtained through the following formulaic calculation:
Sequence
As shown in Figure 6, the results indicate the highest gray correlation degree between cohesion and sand content, followed by silt and clay particles. The gray correlation degree of the three is more significant than 0.95, all of which have vital statistical significance. The gray correlation degree between the internal friction angle and the silt content is the highest, followed by clay particles, and the sand content is the lowest. The gray correlation degree of the three is more significant than 0.95, all of which have vital statistical significance.
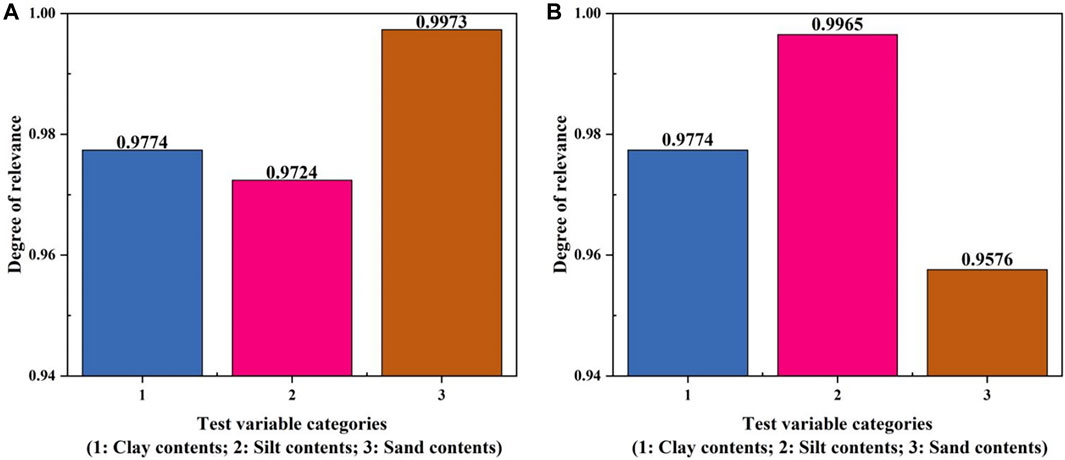
FIGURE 6. Grey entropy relevance between clay particles, powder particles, sand particles and a indicators of strength. (A) Grey entropy relevance between clay particles, powder particles, sand particles and cohesion; (B) Grey entropy relevance between clay particles, powder particles, sand particles and internal friction angle.
3.4 Analysis of SEM test
As depicted in Figure 7, SEM microstructure images of samples immersed for 0, 5, 10, and 20 days are presented, the magnification factor being ×2000. With the increase in immersion time, the soil particles were still composed of cohesive or aggregated flakes, forming a stacked structure. However, the original compactness of the soil weakened, and the orientation and arrangement could be more explicit. The particles within the field of view were severely fragmented, the area decreased, and the boundary between particles and pores blurred. The stacking of particles and pores increased, and there were more small voids at the edges of particle-to-particle or particle-to-edge contact, with some local inter-particle pores connected. Overall, the soil structure within the field of view became loose as the immersion time increased.
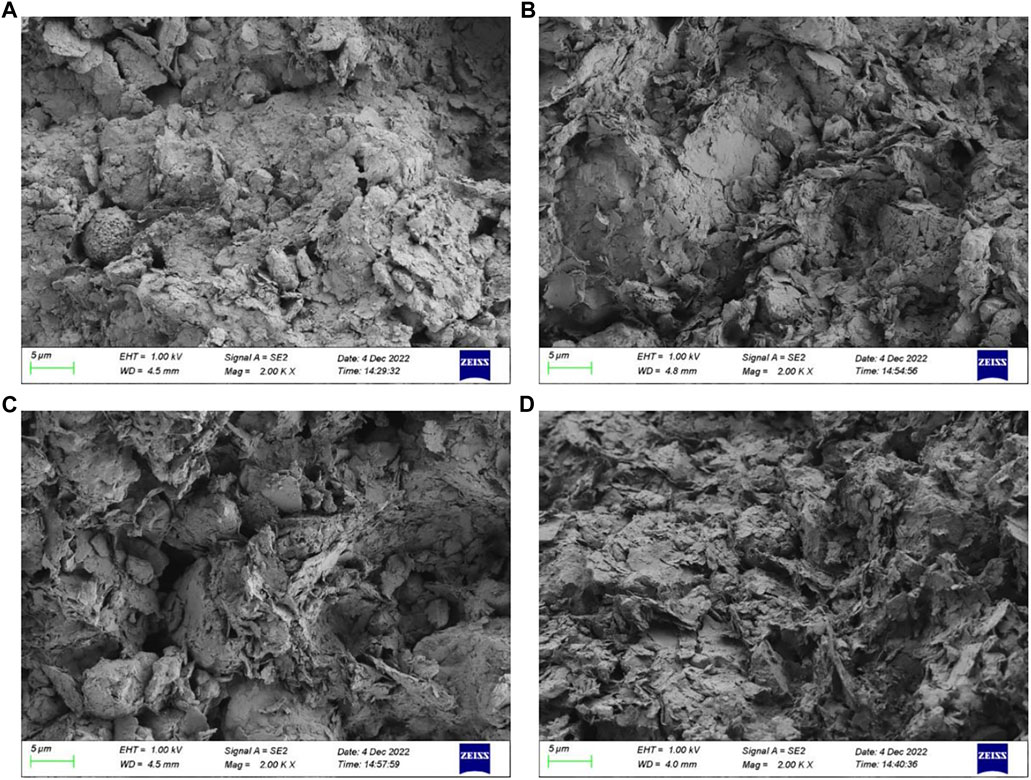
FIGURE 7. SEM images of samples under different immersion days. (A) 0 d; (B) 5 d; (C) 10 d; (D) 20 d.
There was a general decreasing trend in pore area and an increasing trend in pore number. This indicates that as the number of days of immersion increased, the colloidal particles (soluble salts) in the soil dissolved rapidly, large pores decreased, and tiny pores increased. The overall soil structure within the field of view becomes loose as the immersion days increased.
4 Discussions
Based on the study’s results, the process of soil property change under long-term immersion was sorted out, as shown in Figure 8. The dissolution of a small amount of colloidal particles in the soil after long-term immersion caused a decrease in the force between soil particles. The dispersion of soil particle aggregates led to particle size refinement, and the cohesive force was also reduced. The content of fines and cohesive particles in the soil increased after particle size refinement and the increase in the fines content led to a decrease in the angle of internal friction.
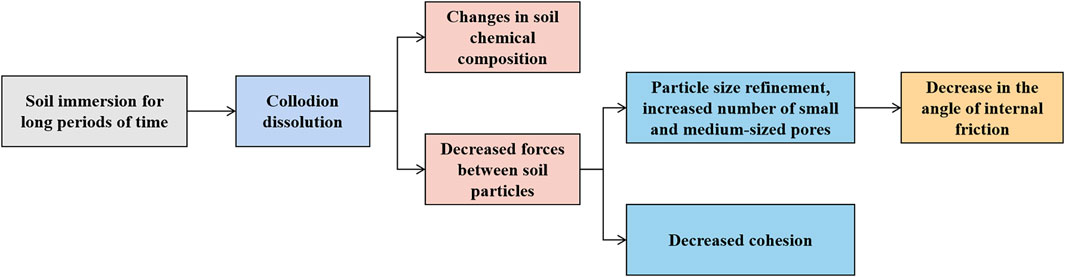
FIGURE 8. Schematic diagram of soil property changes under long-term immersion.
Under long-term immersion, a series of complex microphysical and chemical reactions occur, which cause changes in the particle size of the soil. With the increase of immersion time, and the number of fine particles increases rapidly. When the content of clay in the soil increases, although increasing the content of fine particles can help to produce more particles with a “bonding” effect, the soil skeleton is destroyed due to the sharp decrease of coarse particle content. The interaction between coarse and fine particles weakens, resulting in a decreasing trend of soil cohesion.
During the soil samples’ shear, the friction between irregular and coarse particles on the surface primarily provides the frictional resistance between soil particles. Fine particles exist between coarse particles in the soil sample, so the more fine particles present in the soil sample, the more these particles will soften under the surrounding moisture during shear failure and act as a “lubricant” on the surface of the coarse particles, reducing the frictional resistance between them. As a result, the internal friction angle of the soil sample decreases.
5 Conclusion
In the embankment remodeling soil study, the samplings were subjected to straight shear tests, chemical composition tests, laser particle size tests, and SEM tests at different immersion times. The following conclusions can be drawn based on the experimental results and the previous discussion:
1. Conducting direct shear tests on soil samples with different immersion times, it was discovered that the influence of immersion time on the shear strength of remolded clay is exceptionally significant. This was mainly manifested by a continuous weakening of the shear strength as the immersion time increased. The cohesion and the angle of internal friction decreased gradually with the increase of immersion time, but the change in the internal friction angle was insignificant.
2. The long-term physicochemical effects of water on soil are significant: laser particle size analyzer tests show that long-term immersion leads to the refinement of soil particle size, with a consequent increase in the number of fine particles. X-ray fluorescence spectrometry tests show changes in the chemical composition of the specimens after 20 days of immersion, and these chemical reactions favor the weakening of the structural strength of the soil and the promotion of pore development. The refinement of soil particles was also associated with changes in chemical composition. After processing the SEM images of the samples that had been soaked for different periods, it was observed that continuous immersion increased the number of pores in the samples, the number of large pores decreased, the number of tiny pores increased, and the structure of the soil in the field of view became looser.
3. Under long-term immersion, the soil undergoes a series of complex microphysical and chemical reactions, resulting in the macroscopic manifestation of strength weakening and water immersion aging. The mechanism analysis is as follows: in the early stage of immersion, the colloidal particles (easily soluble salt) dissolved rapidly, the soil microstructure was destroyed, and the cohesive force significantly decreased; with the increase of immersion time, the content of clay particles increased, and the fine particles and clay particles content of the soil increased after particle size refinement, which led to a decrease in the internal friction angle.
Data availability statement
The raw data supporting the conclusion of this article will be made available by the authors, without undue reservation.
Author contributions
KZ: Conceptualization, Data curation, Investigation, Methodology, Writing–original draft, Writing–review and editing. DF: Conceptualization, Funding acquisition, Investigation, Writing–review and editing. ZW: Formal Analysis, Writing–original draft, Writing–review and editing.
Funding
The author(s) declare financial support was received for the research, authorship, and/or publication of this article. The present authors are appreciated to the financial support from the National Natural Science Foundation of China Joint Fund Key Project (Grant No. U2240210).
Acknowledgments
The authors thank the National Natural Science Foundation of China Joint Fund Key Project (Grant No. U2240210).
Conflict of interest
Author ZW was employed by the company China Railway 14th Bureau Group Co., Ltd.
The remaining authors declare that the research was conducted in the absence of any commercial or financial relationships that could be construed as a potential conflict of interest.
Publisher’s note
All claims expressed in this article are solely those of the authors and do not necessarily represent those of their affiliated organizations, or those of the publisher, the editors and the reviewers. Any product that may be evaluated in this article, or claim that may be made by its manufacturer, is not guaranteed or endorsed by the publisher.
References
Deng, H., Wen, W., and Zhou, J. (2023). Competitiveness evaluation of express delivery enterprises based on the information entropy and gray correlation analysis. Sustainability 15 (16), 12469. doi:10.3390/su151612469
Fan, X., Xu, Q., Scaringi, G., Li, S., and Peng, D. (2017). A chemo-mechanical insight into the failure mechanism of frequently occurred landslides in the loess plateau, gansu province, China. Eng. Geol. 228, 337–345. doi:10.1016/j.enggeo.2017.09.003
Fujii, Y., Saito, S., Oshima, T., Kodama, J., Fukuda, D., Sakata, S., et al. (2020). Complete slaking collapse of dike sandstones by fresh water and prevention of the collapse by salt water. Int. J. Rock Mech. Min. Sci. 131, 104378. doi:10.1016/j.ijrmms.2020.104378
Kimura, S., Nakamura, S., Vithana, S. B., and Sakai, K. (2014). Shearing rate effect on residual strength of landslide soils in the slow rate range. Landslides 11 (6), 969–979. doi:10.1007/s10346-013-0457-6
Lemmens, DDMM, Bisschop, R., Visser, P. J., and Van Rhee, C. (2016). Retarding the breaching process of dikes. Proc. Institution Civ. Eng. - Marit. Eng. 169 (3), 99–114. doi:10.1680/jmaen.2015.20
Li, H., Tang, C., Cheng, Q., Li, S., Gong, X., and Shi, B. (2019). Tensile strength of clayey soil and the strain analysis based on image processing techniques. Eng. Geol. 253, 137–148. doi:10.1016/j.enggeo.2019.03.017
Lian, B., Peng, J., Wang, X., and Huang, Q. (2020). Moisture content effect on the ring shear characteristics of slip zone loess at high shearing rates. Bull. Eng. Geol. Environ. 79 (2), 999–1008. doi:10.1007/s10064-019-01597-w
Liang, C., Cao, C., and Wu, S. (2018). Hydraulic-mechanical properties of loess and its behavior when subjected to infiltration-induced wetting. Bull. Eng. Geol. Environ. 77 (1), 385–397. doi:10.1007/s10064-016-0943-x
Lin, B., and Cerato, A. B. (2014). Applications of sem and esem in microstructural investigation of shale-weathered expansive soils along swelling-shrinkage cycles. Eng. Geol. 177, 66–74. doi:10.1016/j.enggeo.2014.05.006
Liu, Z. K., Yu, J. X., Guo, T., Gu, Z. F., Li, Y. H., Xiao, X., et al. (2017). Soil and water action effects of Guilin red clay and its improvement. Beijing Geological Press. Beijing, China, (in Chinese).
Ma, S., Yao, Y., Bao, P., and Guo, C. (2023). Effects of moisture content on strength and compression properties of foundation soils of cultural relics in areas flooded by the yellow river. Front. Mater. 10. doi:10.3389/fmats.2023.1186750
Maihemuti, B., Wang, E. Z., Hudan, T., and Xu, Q. (2016). Numerical simulation analysis of reservoir bank fractured rock-slope deformation and failure processes. Int. J. Geomechanics 16 (2). doi:10.1061/(asce)gm.1943-5622.0000533
Manmatharajan, M. V., Ingabire, E., Sy, A., and Ghafghazi, M. (2023). Effect of particle size and particle size distribution on the post-liquefaction strength of granular soils. Soils Found. 63 (4), 101336. doi:10.1016/j.sandf.2023.101336
Mou, C., and Yuxi, W. (2019). Experimental study on the weakening of mechanical effect of acid and alkali contaminated red clay in Guilin area. J. Chongqing Univ. 42 (06), 109–118. (in Chinese). doi:10.11835/j.issn.1000-582X.2019.06.012
Namdar, A., and Dong, Y. (2020). The embankment-subsoil displacement mechanism. Material Des. Process. Commun. 2 (3). doi:10.1002/mdp2.155
Namdar, A., and Feng, X. (2014). Evaluation of safe bearing capacity of soil foundation by using numerical analysis method. Frat. Ed. Integrità Strutt. 8 (30), 138–144. doi:10.3221/IGF-ESIS.30.18
Ni, W., Yuan, K., Lü, X., and Yuan, Z. (2020). Comparison and quantitative analysis of microstructure parameters between original loess and remoulded loess under different wetting-drying cycles. Sci. Rep. 10 (1), 5547. doi:10.1038/s41598-020-62571-1
Nie, Y., Ni, W., Li, X., Wang, H., Yuan, K., Guo, Y., et al. (2021). The influence of drying-wetting cycles on the suction stress of compacted loess and the associated microscopic mechanism. Water 13 (13), 1809. doi:10.3390/w13131809
Philip, F. L. (1961). Physical chemistry of clay-water interaction. Adv. Agron. 13, 269–327. doi:10.1016/S0065-2113(08)60962-1
Sassa, K., Fukuoka, H., Wang, G., and Ishikawa, N. (2004). Undrained dynamic-loading ring-shear apparatus and its application to landslide dynamics. Landslides 1 (1), 7–19. doi:10.1007/s10346-003-0004-y
Song, Y., and Hong, S. (2020). Effect of clay minerals on the suction stress of unsaturated soils. Eng. Geol. 269, 105571. doi:10.1016/j.enggeo.2020.105571
Sun, X., Song, S., Niu, C., Wang, Z., Liu, J., Shu, H., et al. (2023). Evolution characteristics of microscopic pore structure of saline soil profile in qian’an country, northeastern China. Bull. Eng. Geol. Environ. 82 (5), 191. doi:10.1007/s10064-023-03217-0
Tang, C., Lin, L., Cheng, Q., Zhu, C., Wang, D., Lin, Z., et al. (2020). Quantification and characterizing of soil microstructure features by image processing technique. Comput. Geotechnics 128, 103817. doi:10.1016/j.compgeo.2020.103817
Wang, Z., Wang, Q., and Ai, T. (2014). Comparative study on effects of binders and curing ages on properties of cement emulsified asphalt mixture using gray correlation entropy analysis. Constr. Build. Mater. 54, 615–622. doi:10.1016/j.conbuildmat.2013.12.093
Wen, B., and He, L. (2012). Influence of lixiviation by irrigation water on residual shear strength of weathered red mudstone in northwest China: implication for its role in landslides' reactivation. Eng. Geol. 151, 56–63. doi:10.1016/j.enggeo.2012.08.005
Wen, B., and Ji, B. (2018). Variation in residual strength of the large-scale landslides’ slip zones in the three gorges reservoir of China. San Francisco, CA, USA: Springer.
Xie, J., Hsu, P., Hu, Y., Lin, Q., and Ye, M. (2023). Disastrous persistent extreme rainfall events of the 2022 pre-flood season in south China: causes and subseasonal predictions. J. Meteorol. Res. 37 (4), 469–485. doi:10.1007/s13351-023-3014-9
Xu, L., Dai, F. C., Gong, Q. M., Tham, L. G., and Min, H. (2012). Irrigation-induced loess flow failure in heifangtai platform, north-west China. Environ. Earth Sci. 66 (6), 1707–1713. doi:10.1007/s12665-011-0950-y
Ying, C., Hu, X., Zhou, C., Siddiqua, S., Makeen, G. M. H., Wang, Q., et al. (2021). Analysis of chemo-mechanical behavior of silty soil under long-term immersion in saline reservoir water. Bull. Eng. Geol. Environ. 80 (1), 627–640. doi:10.1007/s10064-020-01928-2
Zhang, J., Zhang, A., Li, J., Li, F., and Peng, J. (2019). Gray correlation analysis and prediction on permanent deformation of subgrade filled with construction and demolition materials. Materials 12 (18), 3035. doi:10.3390/ma12183035
Zhang, Q., Guo, X., and Deng, J. (1996). A grey correlation entropy analysis method. Syst. Eng. Theory Pract. (8), 8–12. (in Chinese).
Zhou, Z., Sun, Z., Zhou, Y., Zuo, Q., Wang, H., Chen, Y., et al. (2023). Laboratory study of the combined wave and surge overtopping-induced normal stress on dike. Front. Mar. Sci. 9. doi:10.3389/fmars.2022.1073345
Keywords: embankment soil, shear strength, long-term immersion, mechanical properties, slope instability
Citation: Zhang K, Feng D and Wang Z (2023) Study on the mechanical properties of embankment soil under long-term immersion conditions. Front. Mater. 10:1270082. doi: 10.3389/fmats.2023.1270082
Received: 31 July 2023; Accepted: 16 October 2023;
Published: 26 October 2023.
Edited by:
Yunchao Tang, Guangxi University, ChinaReviewed by:
Shu Fang, Guangzhou University, ChinaJue Li, Chongqing Jiaotong University, China
Abdoullah Namdar, Huaiyin Institute of Technology, China
Copyright © 2023 Zhang, Feng and Wang. This is an open-access article distributed under the terms of the Creative Commons Attribution License (CC BY). The use, distribution or reproduction in other forums is permitted, provided the original author(s) and the copyright owner(s) are credited and that the original publication in this journal is cited, in accordance with accepted academic practice. No use, distribution or reproduction is permitted which does not comply with these terms.
*Correspondence: Di Feng, ZmVuZ2RpQDEyNi5jb20=