 Benas Šilinskas1,2*
 Iveta Varnagirytė-Kabašinskienė
 Lina Beniušienė
- 1Agriculture Academy, Faculty of Forest Sciences and Ecology, Vytautas Magnus University, Kaunas, Lithuania
- 2Institute of Forestry, Lithuanian Research Centre for Agriculture and Forestry, Kaunas, Lithuania
The study investigated the wood mechanical properties of black alder [Alnus glutinosa (L.) Gaertn.], a widely distributed deciduous tree in Europe valued for its suitability in silviculture and wood industry applications. The aim was to compare these properties among selected half-sib families and assess the relationship between wood hardness and other characteristics. Experimental plantations of black alder progenies from Lithuanian populations were established in different forest regions in 1998. The study analyzed various parameters for different genetic families, including tree diameter, height, wood hardness, moisture content, wood density, and mechanical properties. The findings revealed significant variability in wood properties among half-sib families, highlighting a strong genetic influence. Although the static modulus of elasticity showed no notable difference across families, other properties showed significant variations. Furthermore, the analysis identified weak correlations between wood hardness and other mechanical properties like density, modulus of elasticity, and bending strength. This suggests that wood hardness may not reliably indicate wood quality for industrial applications. Consequently, the study recommends considering alternative non-destructive properties, such as the dynamic modulus of elasticity, in future genetic studies of black alder for more accurate assessments of wood quality.
1 Introduction
Black alder [Alnus glutinosa (L.) Gaertn.] is a rapidly growing deciduous tree commonly distributed throughout Europe. Recognized for its diverse silviculture and wood industry applications, it is significantly important as a forest species. Black alder is valued for its wood, which has various mechanical properties that make it suitable for diverse construction, furniture-making, and woodworking applications. Black alder stands with extended rotations have the potential to yield high-quality logs and wood suitable for the wood and furniture industries. Conversely, in short-rotation scenarios, specialized plantations may be better suited for biomass production (Krstinić, 1994).
Black alder is a fast-growing species and consists of 8% of the total forest area in Lithuania (State Forest Service, 2021). Together with gray alder (Alnus incana L. Moench), black alder comprises approximately 14% of the total forest area in Lithuania (State Forest Service, 2021). Understanding the genetic traits of black alder is essential for effective conservation, management, and breeding programs aimed at improving various characteristics such as growth rate, disease resistance, and adaptation to environmental stressors. Black alder exhibits ecological plasticity and can adapt to diverse environmental conditions. Genetic studies have indicated that black alder populations have adapted locally, with certain genotypes performing well in specific habitats (Savolainen et al., 2007; Lefèvre et al., 2014). Understanding the genetic basis of local adaptation is crucial for conservation efforts and forest management practices, particularly in the face of climate change. For example, Marron et al. (2018) conducted quantitative trait loci (QTL) analysis to identify genomic regions associated with traits such as wood density, fiber length, and tree height. These findings contribute in developing marker-assisted selection strategies for breeding programs to improve wood quality and productivity. Studies in Lithuania showed significant variations in the growth traits and bud flushing of progenies among localities with different environments reflected in substantial effects of the site conditions, indicating high phenotypic plasticity of black alder populations and families and high adaptation to climate change (Pliura and Kundrotas, 2002).
The main parameters used for measuring wood quality in the industry are wood density, modulus of elasticity (MOE), and bending strength (MOR) (Høibø et al., 2014; Ruso et al., 2019). Density is an essential indicator of wood quality and is closely related to its mechanical properties (Machado et al., 2014; Moreno-Fernández et al., 2018). Black alder wood typically has a density range of approximately 500–650 kg m−³ (Kollmann and Côté Jr, 1968). Specific gravity values for black alder wood fall within 400–600 kg m−³ (Esteves and Pereira, 2009; Ross, 2010). Wood hardness is crucial for assessing its resistance to indentation and wear. Black alder wood is classified as moderately hard, with Janka hardness values ranging from 2,500 to 3,000 N (Esteves and Pereira, 2009; Ross, 2010). The modulus of elasticity reflects the stiffness of wood and its ability to withstand deformation under load. Previous studies suggested that the modulus of elasticity of black alder wood falls within the range of 8–12 GPa (Esteves and Pereira, 2009; Eckelman and Hoadley, 2019). The mechanical properties of black alder wood can be significantly influenced by the moisture content (Maloney, 1996). As the moisture content increases, the wood’s strength and stiffness tend to decrease due to the reduction in intermolecular bonds. Therefore, proper drying and moisture control are essential for maintaining the desired mechanical properties of black alder wood.
Studies emphasized that more focus is needed to research mechanical properties, especially how they change in relation to the surrounding environment—in which different types of wood materials are preserved—and the methodological approach (Bartolucci et al., 2020). Recent studies have enhanced the understanding of the tree’s genetic basis of key traits such as disease resistance, wood quality, and growth characteristics. This knowledge can be used to strengthen breeding programs and conservation efforts for sustaining black alder populations and enhancing their resilience to environmental challenges. The hypothesis of this study is that different genetic families have significant differences in wood properties.
The aim of this study was to compare the wood mechanical properties between selected half-sib families of black alder and evaluate the relationship between wood hardness and other wood mechanical properties.
2 Materials and methods
For this study, experimental plantations of the progenies of Lithuanian populations (half-sib families) of black alder from different regions of origin were selected (Table 1).

Table 1. Description of the experimental plantations of the progenies of black alder populations in Lithuania.
Experimental plantations were established in different Lithuanian forest natural regions (falling in two different regions of origin of black alder) in the Kaunas and Šiauliai units of the State Forest Enterprise in 1998. To establish these plantations, seeds were collected from 17 black alder populations from 5 to 6 selected trees and other trees selected randomly from each population, with a total of 52 maternal trees. Seeds were sown in the greenhouse in 1 m2 plots in the spring of 1997. Each of the 17 populations in the experimental plantations was represented by 5–6 progeny families. The experiment design included four blocks, and trees of each family were planted in one row of 10 trees located randomly within the limits of the block. The seedlings were planted across the prepared soil in rows every 2–2.5 m, with seedlings planted in the rows every 1.5 m.
All trees in the experimental objects were measured with a Pilodyn 6J device to determine the wood hardness of standing trees. Wood hardness is a representative trait for wood quality in genetic plasticity studies. Phenotypic plasticity was evaluated by the Shukla (1972) method and by calculating the ecovalences of the families and their statistical significance.
The number of measured trees per family per test was calculated to determine the average number of trees per family. The adjusted sum of mean squares of a feature was calculated for each family using the SAS procedure MEANS. The total sum of mean squares was calculated as well. The Shukla ecovalence coefficient is calculated according to Equation 1:
Here,
For the differences in wood mechanical properties, four representative half-sib families were selected based on the wood hardness trait of standing trees. The genetic families with at least 30 remaining standing trees were selected. The variance analysis ANOVA Duncan multiple-range test was performed for all selected families to ensure the significant differences between the hardest and the softest families. The value of wood hardness measured with the Pilodyn 6J device for the black alder genetic half-sib families of standing trees is given in Table 2.
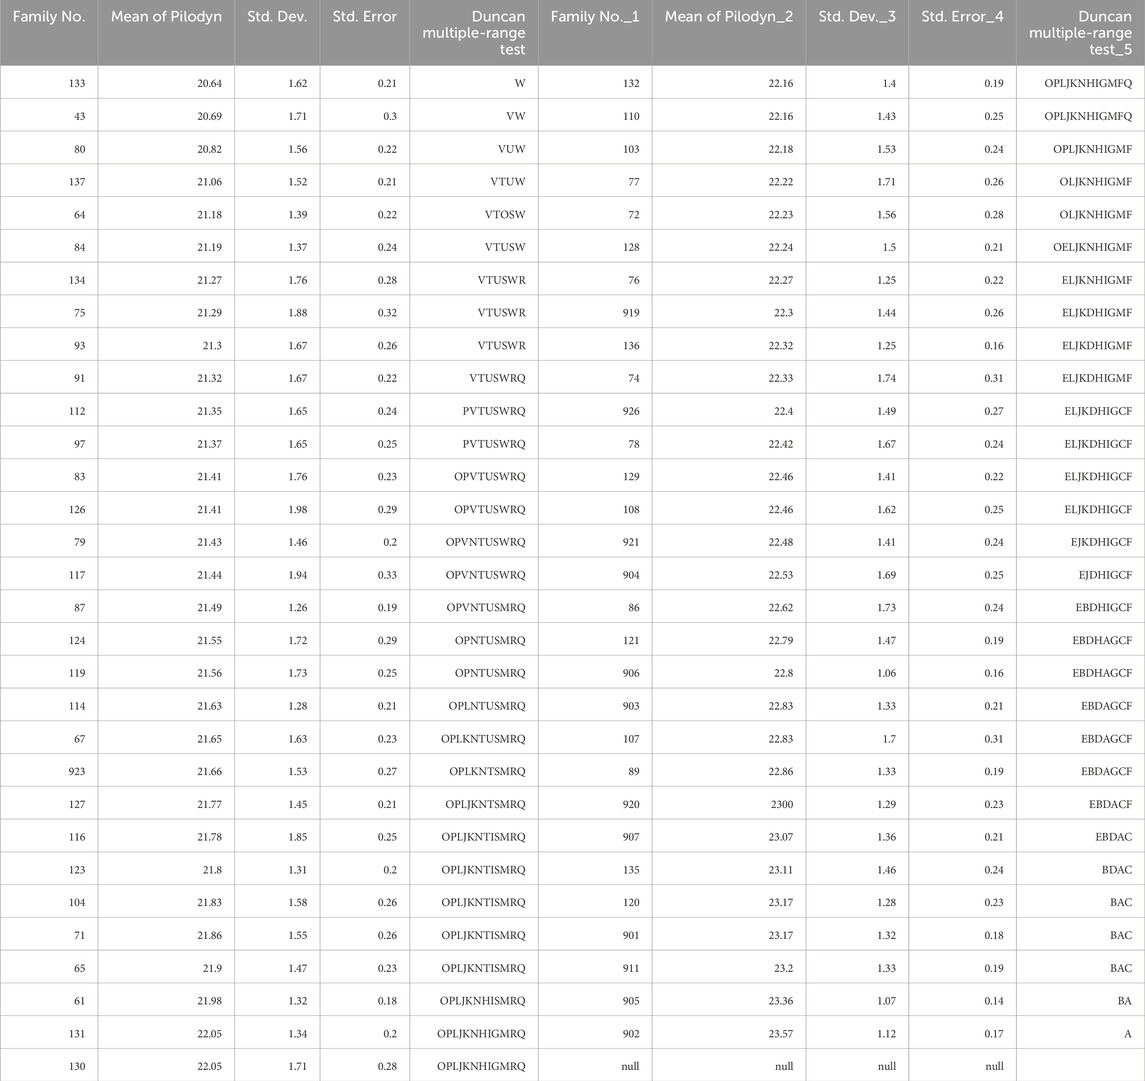
Table 2. Distribution of black alder genetic families by wood hardness. Different capital letters A–W mean the significant difference between the genetic families by ANOVA Duncan multiple-range tests at a significant level p < 0.05.
For this study, genetic families were selected according to the following scheme: the families with the lowest and highest average wood hardness were taken as representatives of the hardest and softest wood, and the families with the lowest and highest plasticity according to the Shukla ecovalence coefficient corresponded to non-plastic and plastic families.
The genetic families 902 and 133 were selected as the hardest and the softest wood representatives, respectively, and the genetic families 93 and 134 were selected as the representatives of the non-plastic and plastic families, respectively. From each of the selected genetic families, three model trees were chosen, cut, and transported to the Open Access Joint Research Centre of Agriculture and Forestry wood quality and processing technologies laboratory. Altogether, 24 trees were sampled, 12 in Kaunas and 12 in Šiauliai experimental areas. The stems of the model trees were divided into 3-m logs along the stem height. Three to four representative sections were taken from each model tree to determine wood mechanical properties. In the laboratory, 3-m logs were divided into 1-m sections, as shown in Figure 1.

Figure 1. Model trees sampling scheme.
For the 1-m sections, the wood hardness was measured with a Pilodyn 6J device at three points (Figure 2).

Figure 2. Wood hardness measurement scheme on log samples.
From all logs, 50 × 50 × 1,000-mm wood samples were prepared, for a total of 506 samples. The wood hardness (Figure 3A), dynamic modulus of elasticity (MOEdyn) (Figure 3B), static modulus of elasticity (MOE), and bending strength (MOR) were measured for the wood samples.
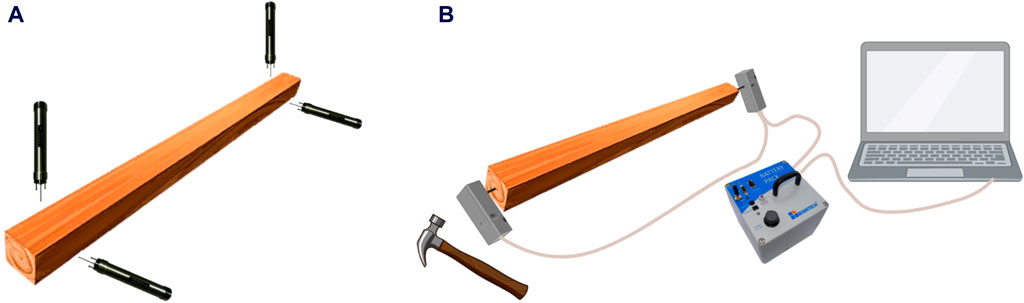
Figure 3. Scheme for the wood hardness test (A) and wood propagation speed measurement by ARBOTOM 3D (B).
The wood hardness measurement for wood samples was performed with a Pilodyn 6J device. The sound propagation speed was measured by ARBOTOM 3D acoustic tomography. The MOEdyn was measured by multiplying wood density and sound propagation speed according to Equation 2:
Here, MOEdyn is the dynamic modulus of elasticity (N mm−2), ρ is wood density (kg m−3), and V is the wave propagation speed (m s−1).
In the laboratory, all prepared samples were tested with a Bending Testing Machine 500 kN (FORM + TEST Seidner & Co. GmbH). The tests were conducted following the methodology given in Standard EN 408 (2006). The samples were tested in a four-point bending test. MOE and MOR were evaluated and calculated at 12% moisture content according to Standard EN 384 (2016). The MOE was calculated according to Equation 3:
Here, F1–F2 is an increment of load on the straight-line portion of the load deformation curve, 0.2 Fmax (F2) and 0.4 Fmax (F1), N; ω2–ω1 is the increment of deformation corresponding to F2–F1, mm; l is the span, mm; a is the distance between a loading position and the nearest support, mm; b is the width of the cross section, mm; and h is the depth of the cross section, mm.
A random wood sample was cut from each broken specimen to determine the wood density. The wood density was determined according to Equation 4:
Here,
To determine wood density, the samples were cut near the breakage point immediately after the bending test. The moisture content was determined by the oven-dry method according to Standard EN 13183-1 (2002). The wood density was calculated based on the mass/volume ratio. The values at 12% moisture content were calculated according to Standard EN 384 (2016).
The statistical analysis of the ANOVA Duncan multiple-range test was used to determine differences between genetic families and between different sections of the stem. Pearson correlations were performed between tree parameters and measured wood properties with the SAS 9.4. statistical program.
3 Results
The mean values of the tree diameter at breast height (DBH), tree height, log wood hardness, sample wood hardness, wood moisture, wood density, MOEdyn, MOE, and MOR of selected black alder trees of different genetic families are summarized in Table 3. The mean tree DBH of model trees varied in a range from 16.62 cm (family with soft wood) to 18.47 cm (family with hard wood). The mean tree height of model trees ranged from 14.64 m to 16.58 m; the highest tree was found in the hard wood genetic family (18.80 m), and the lowest tree was in the non-plastic genetic family (9.30 m). The mean log hardness slightly varied from 19.26 mm to 22.38 mm between the genetic families.
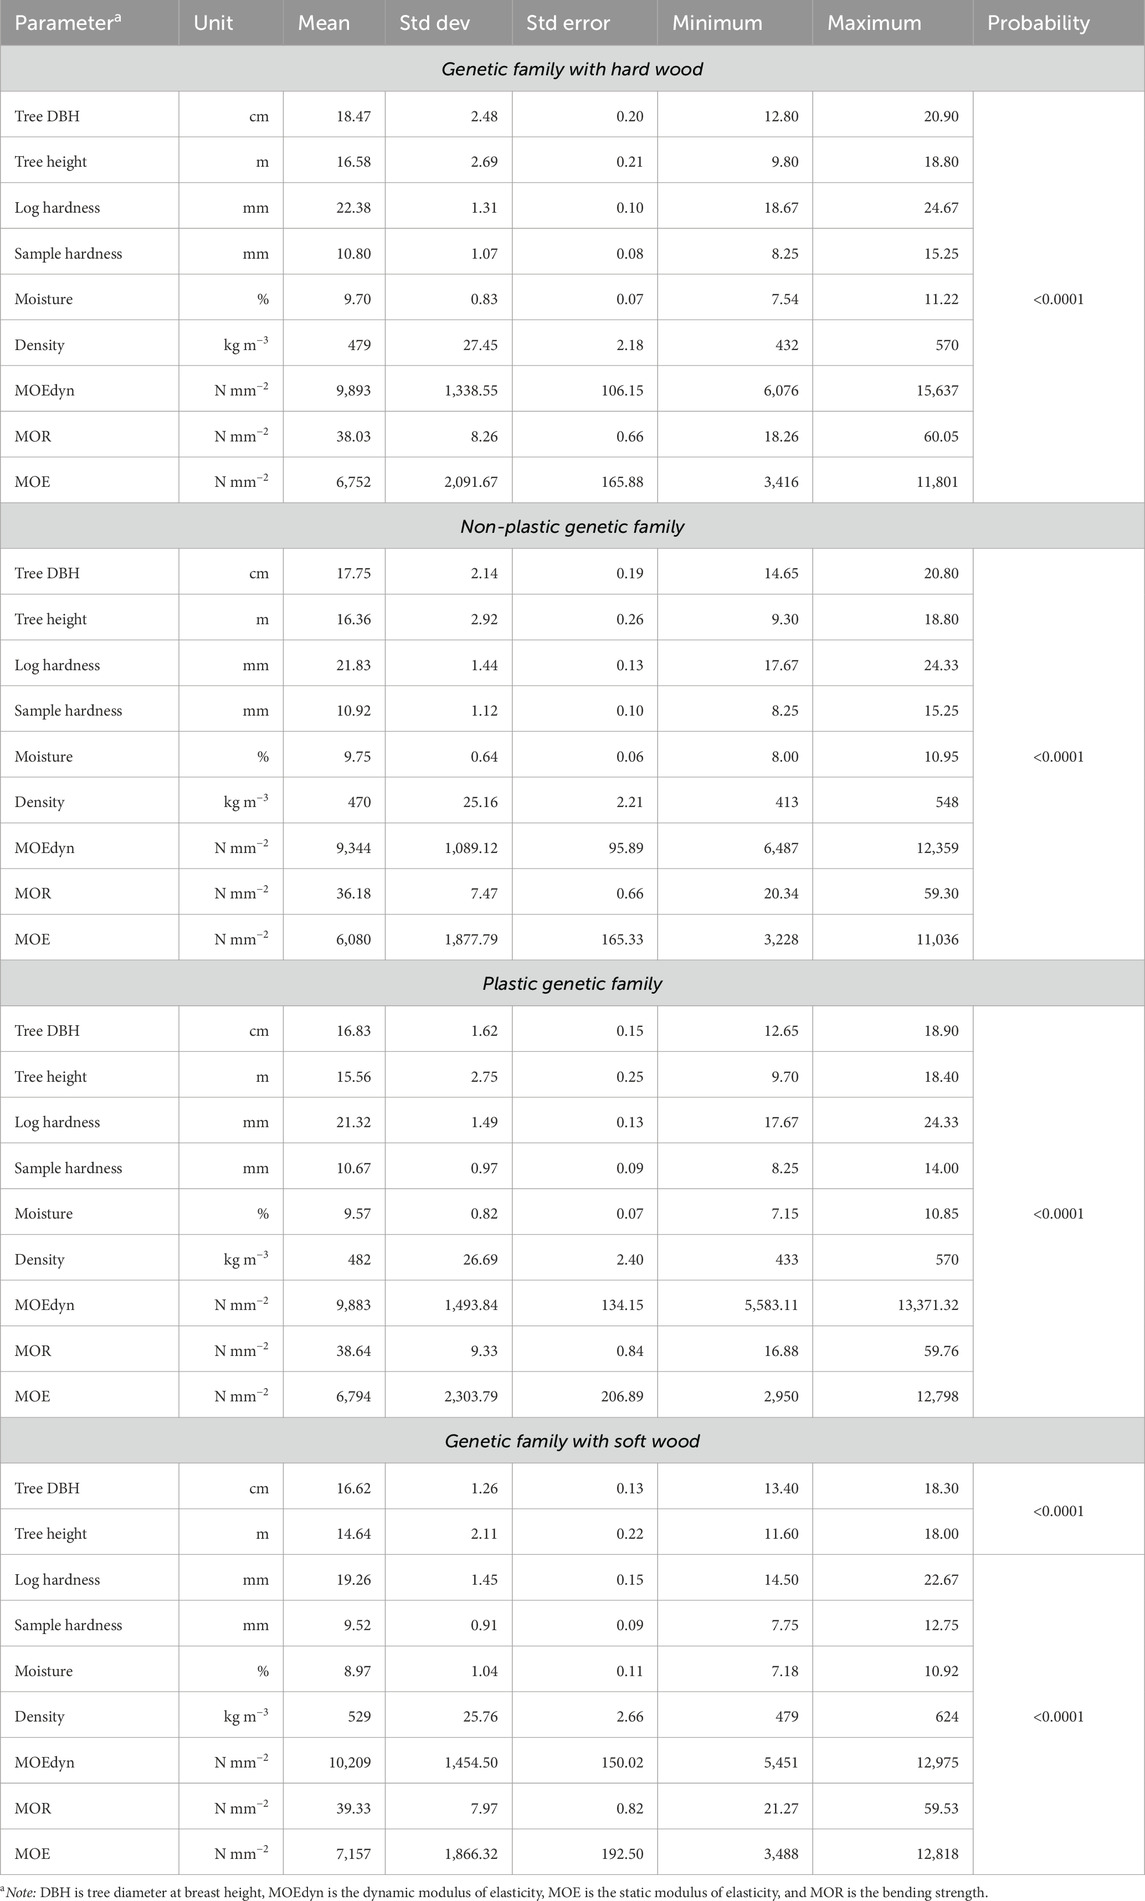
Table 3. Summary statistics for the main parameters in the selected genetic families of black alder.
The variation in the sample hardness, moisture content, wood density, MOEdyn, MOE, and MOR in the genetic families is given in Figure 3. The highest sample hardness was found in hard wood and non-plastic families (15.25 mm), while the lowest value was found in the genetic family with soft wood (7.75 mm). The mean values of sample hardness were comparable in all genetic families and varied from 9.52 mm to 10.92 mm. The samples’ mean wood moisture was 9.50%. The mean wood density ranged between 470 and 529 kg m−3. The differences in mean MOEdyn between the genetic families were small and varied from 9,344 N mm−2 (non-plastic) to 10,209 N mm−2 (soft). The highest mean MOR values were in the soft wood family, and the lowest mean values were in the non-plastic family, with an 8% difference between these genetic families. The mean MOR ranged from 10,916 N mm−2 to 11,386 N mm−2 between the genetic families. The ANOVA results for different wood parameters for black alder genetic families are shown in Figure 4.
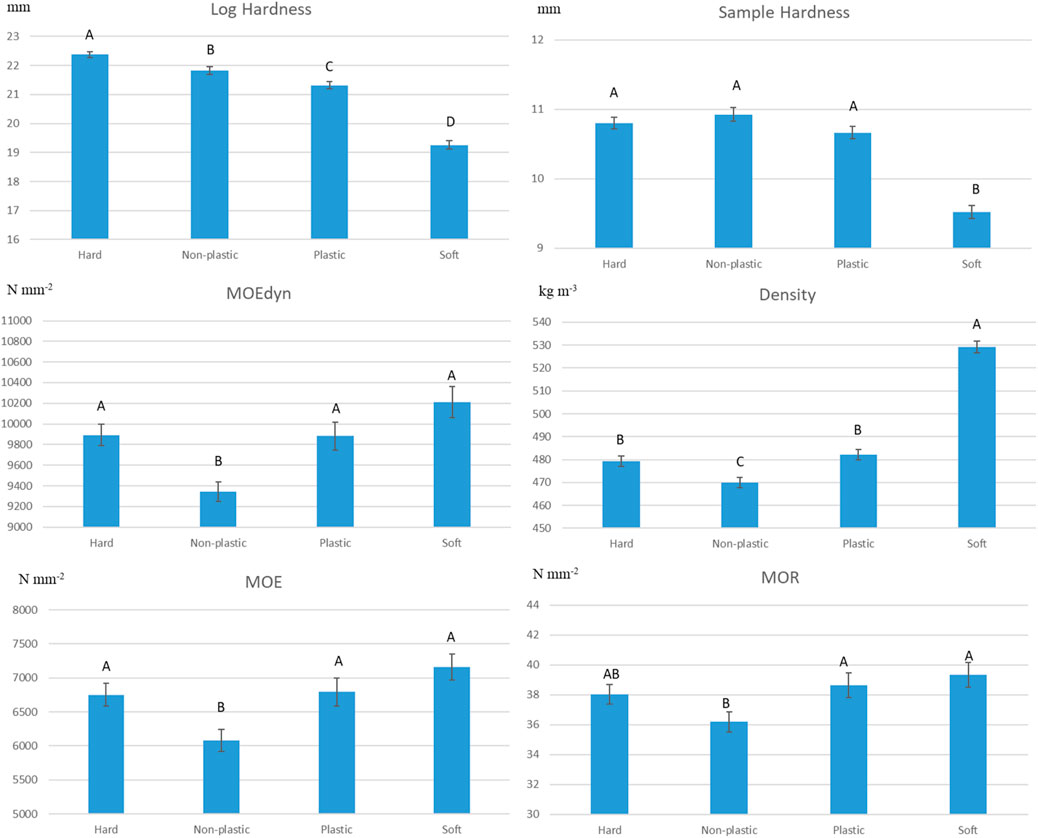
Figure 4. Differences in the main wood parameters between the selected genetic families (representatives of the hardest [hard] and softest [soft] wood and the lowest [non-plastic] and highest [plastic] plasticity families according to the Shukla ecovalence coefficient). Different capital letters A, B, C, and D show significant differences between the families by ANOVA Duncan multiple-range test at a significant level, p < 0.05. Note: MOEdyn is the dynamic modulus of elasticity, MOE is the static modulus of elasticity, and MOR is the bending strength.
The mean log hardness had a significant difference between all genetic families, and the difference between soft and hard wood families was 14% (Figure 4). For the sample hardness, ANOVA showed differences between the soft wood family and other families. The lowest MOEdyn was obtained in the non-plastic genetic family with significant differences from other families. However, the MOEdyn parameter did not significantly differ between the hard wood, soft wood, and plastic genetic families. The highest mean wood density was in the soft wood genetic family, and the lowest was in the non-plastic genetic family (Figure 4). Genetic families representing hardwood and plastic families had no significant difference in wood density. The difference between the highest and the lowest mean wood density was 11%.
The mean MOE was not significantly different between the hard wood, soft wood, and plastic genetic families (Figure 4). However, the non-plastic family for MOE significantly differed from the other genetic families. The MOR showed a significant difference between the non-plastic genetic family and the remaining families. We can exclude the soft genetic family with the hardest wood, the highest wood density, and the highest mean values of MOEdyn, MOE, and MOR from the different wood parameters.
Combining the data on the selected genetic families, the differences in wood parameters in stem parts I–IV were assessed (Figure 5). The mean log hardness showed a decreasing trend from the tree base (part I) to the tree top (part IV). The hardest wood was found in the top part of the stem. For the sample hardness, ANOVA showed no significant difference between the mean values in different stem parts. The MOEdyn in part I of the stem showed significantly lower values than the remaining parts. The highest mean wood density was found in the top part (IV) of the stem, and the lowest was in the bottom part (I). For the MOE and MOR, the lowest mean values were in part IV of the stem and significantly differed from that of other stem parts.
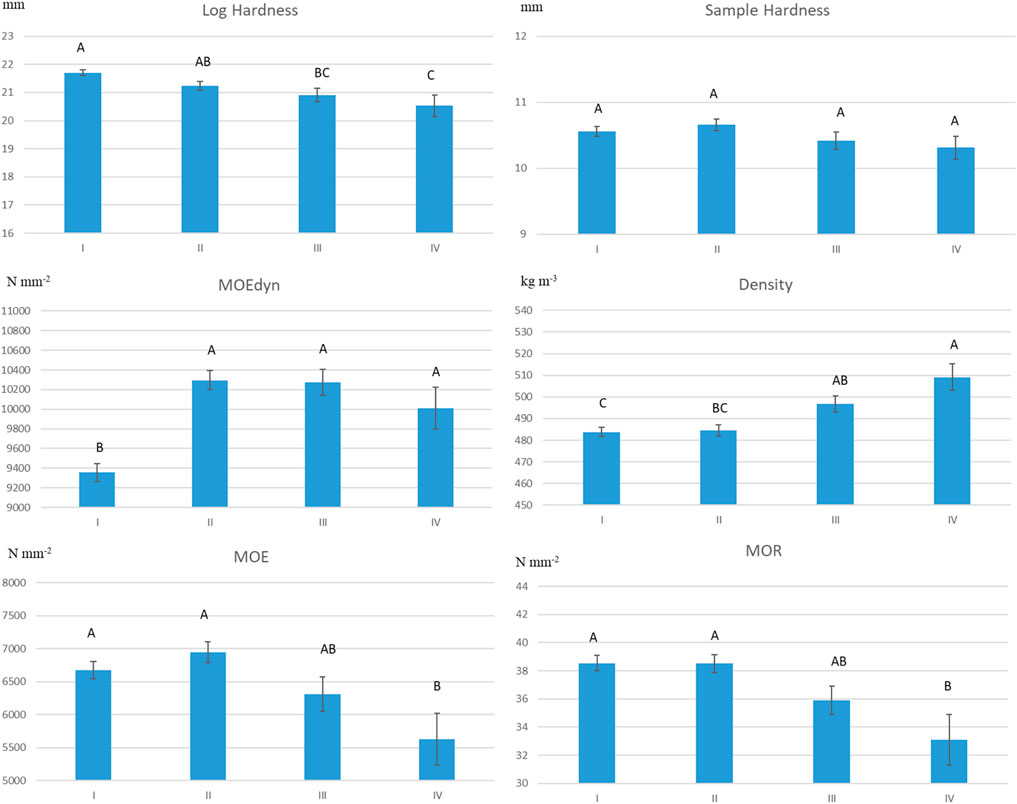
Figure 5. Differences in the main wood parameters at I–IV stem parts. Each part consists of 3-m-long logs (I: bottom log, IV: top log). Different capital letters A, B, C, and D show significant differences between the families by the ANOVA Duncan multiple-range test at a significant level, p < 0.05. Note: MOEdyn is the dynamic modulus of elasticity, MOE is the static modulus of elasticity, and MOR is the bending strength.
To compare the relations between tree and wood parameters, the Pearson correlations were calculated (Table 4).
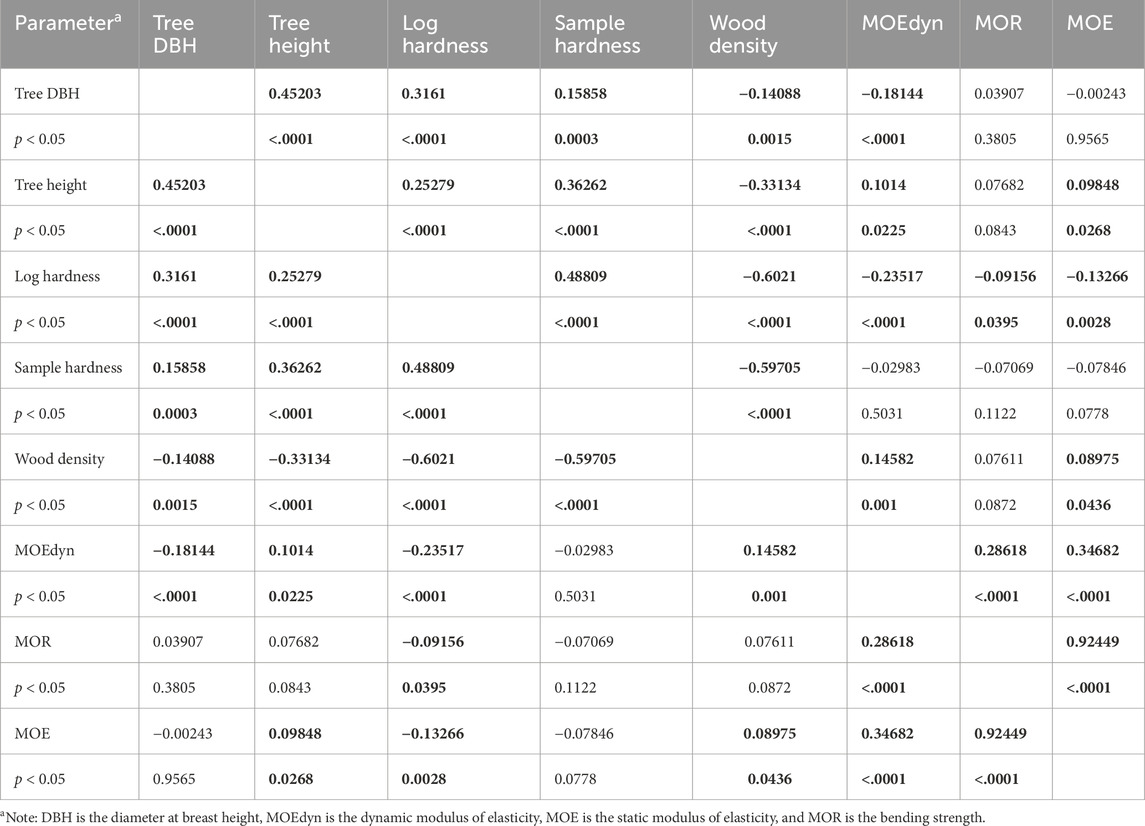
Table 4. Relationship between the main wood and tree parameters by Pearson correlations. Bold values mean reliable correlations at a significant level p < 0.05.
The strongest correlation was between the MOE and MOR (r = 0.92). The MOE and MOR moderately correlated with the MOEdyn and showed r = 0.35 and r = 0.29, respectively. The wood density strongly correlated with the sample hardness (r = −0.60) and log hardness (r = −0.60). The correlation between sample hardness and log hardness was r = 0.49. The tree height correlation with sample hardness (r = 0.36) was stronger than that with log hardness (r = 0.25). The tree DBH had opposite correlations between log hardness (r = 0.32) and sample hardness (r = 0.16) compared with tree height, despite a moderate correlation between tree DBH and tree height (r = 0.45).
4 Discussion
The results demonstrated tree genetic effect on black alder wood quality measurement of the main wood properties—wood density, sample and log hardness, dynamic and static modulus of elasticity, and bending strength. Different half-sib families caused various responses to the wood quality characteristics of black alder trees. Studies in Croatia and the Czech Republic showed different mean black alder wood densities in different stands: 549 kg m−3 in Croatia stands and 469 kg m−3 in Czech Republic stands (Milch et al., 2016). Another study carried out in Ireland showed that black alder logs had a mean wood density of 489 kg m−3 (Llana et al., 2020). The Latvian study compared wood density values between different tree parts and found that the wood density was highest in the branches and the lowest in the root system, while the mean stem wood density was 403 kg m−3 (Liepiņš et al., 2023). The mentioned study concluded that the highest wood density was found in the top of black alder trees. The results from our study were relatively comparable with those found in the Latvian study. Scientists from Austria found 510 kg m−3 mean wood density values for black alder (Reiterer et al., 2002). The study carried out in Turkey showed similar mean wood density values in different experimental areas, where the mean values varied from 509 kg m−3 to 531 kg m−3 (Usta et al., 2014). Another study, conducted in Turkey, showed specific gravity mean values of 497 kg m−3 for black alder (Malkoçoğlu and Özdemir, 2006). An Estonian study evaluated black alder wood density values at different stages of wood decay and found the mean density of 422 kg m−3 at the early stages of wood decay and 96 kg m−3 at the last stage of decay (Köster et al., 2015). The mean wood density was 488 kg m−3 when measured for the timber products from black alder as glue laminated timber (Kytka et al., 2022). All these studies showed variations in black alder wood density values between 400 kg m−3 and 550 kg m−3, which was similar to the findings obtained in our study.
In our study, the wood hardness of logs and samples was strongly correlated with wood density. Other studies demonstrated different wood hardness of hardwood species, measured with Brinell’s test, and showed strong correlations between wood density and wood hardness (r = 0.77–0.9) (Sydor et al., 2022).
The variation in the main wood mechanical properties, such as MOE and MOR, between the studied genetic families and different stem parts was approximately 10% in this study. The results of this study show that the mean black alder wood MOEdyn was 9,832 N mm−2, MOE was 6,696 N mm−2, and MOR was 38 N mm−2. Other studies showed different MOE and MOR values for black alder wood. For example, Llana et al. (2020) found a mean MOE of 6,738 N mm−2 and a mean MOR of 56.81 N mm−2 in Ireland; Milch et al. (2016) found MOE of 10,600 N mm−2 and MOR of 79.9 N mm−2 in Croatia, and MOE of 7,400 N mm−2 and MOR of 68.1 N mm−2 in Czech Republic. Kytka et al. (2022) revealed another mean value for black alder wood in Czech Republic, with MOE of 9,508 N mm−2 and MOR of 61.5 N mm−2.
The current study identified weak correlations between wood density and other wood mechanical properties. The strongest correlation was found between MOE and MOR. The wood density moderately correlated with MOE (r = 0.44–0.46) and MOR (r = 0.41–0.43) in the previous studies conducted in Croatia and the Czech Republic (Milch et al., 2016). Similarly, the relationship between wood density and MOE was r = 0.25–0.45, where MOR was r = 0.41–0.48 and with MOEdyn was r = 0.34–0.4 in Turkey (Usta et al., 2014). The studied combination of black alder with beech wood in glue-laminated timber showed a comparable correlation between wood density and the MOE (r = 0.45) and a higher correlation between wood density and the MOR (r = 0.65) (Kytka et al., 2022). Usta et al. (2014) found moderate correlation between MOEdyn and MOE. Similar moderate correlations between MOEdyn and MOE were found in the Llana et al. (2020) study.
Correlations could be improved by increasing the number of model trees and incorporating a more diverse range of sample ages. The variance in results observed in this study may be attributed to several limitations, one of which is the restricted selection of model trees due to their significance in future genetic studies. Therefore, only specific trees were permitted for use in this study, leading to the decision to evaluate all parts of the trees for wood parameters. These findings may be somewhat constrained by the higher proportion of juvenile wood, potentially affecting wood quality parameters. However, it should be noted that the same wood sample selection scheme was applied to evaluate all selected genetic families, allowing for comparison of results across families. This study represents the initial findings. Hence, it is rational to incorporate a larger number of sample trees and include more half-sib families in future studies, particularly when the next-generation genetic trials for black alder would be established in Lithuania.
5 Conclusion
The study findings revealed significant variability in wood properties among different half-sib families of black alder. Although the static modulus of elasticity showed no significant difference across the selected families, other wood properties showed significant variations, indicating a strong genetic influence on wood characteristics. The results revealed a consistent decrease in almost all measured wood properties from the bottom to the top of the model trees. This vertical variation indicated the importance of considering the location within the tree when assessing wood mechanical properties, which may have implications for wood quality and use.
The analysis highlighted weak correlations between wood hardness and other mechanical properties such as wood density, modulus of elasticity, and bending strength. Leading to the assumption that wood hardness may not be a reliable indicator of wood quality for industrial wood applications. Therefore, alternative non-destructive wood properties, such as dynamic modulus of elasticity, should be considered for inclusion in future genetic studies of black alder to provide more accurate assessments of wood quality.
Data availability statement
The raw data supporting the conclusions of this article will be made available upon direct request to the authors.
Author contributions
BŠ: writing–original draft, supervision, software, methodology, investigation, formal analysis, and conceptualization. IV-K: writing–original draft, formal analysis, and conceptualization. LB: methodology, investigation, and writing–review and editing. MA: writing–review and editing.
Funding
The author(s) declare that financial support was received for the research, authorship, and/or publication of this article. This research was funded through the Research Council of Lithuania Postdoctoral project ID: S-PD-22-35, Silver birch (Betula pendula Roth.) and black alder [A. glutinosa (L.) Gaertn] different plasticity half-sib families’ mechanical wood properties.
Conflict of interest
The authors declare that the research was conducted in the absence of any commercial or financial relationships that could be construed as a potential conflict of interest.
Publisher’s note
All claims expressed in this article are solely those of the authors and do not necessarily represent those of their affiliated organizations, or those of the publisher, the editors, and the reviewers. Any product that may be evaluated in this article, or claim that may be made by its manufacturer, is not guaranteed or endorsed by the publisher.
References
Bartolucci, B., De Rosa, A., Bertolin, C., Berto, F., Penta, F., and Siani, A. M. (2020). Mechanical properties of the most common European woods: a literature review. Frat. Integrita Strutt. 14, 249–274. doi:10.3221/IGF-ESIS.54.18
Eckelman, C. A., and Hoadley, R. B. (2019). “Mechanical properties of wood,” in Wood handbook: Wood as an engineering material. General technical report FPL-GTR-282; forest products laboratory (Madison, WI: U.S), 31–68.
EN 13183-1 (2002). Moisture content of a piece of sawn timber. Part 1: determination by oven dry method; European committee of standardization: Brussels, Belgium.
EN 384 (2016). Structural timber. Determination of characteristic values of mechanical properties and density. Brussels, Belgium: European Committee for Standardization.
EN 408 (2006). Timber structures. Structural timber and glued laminated timber—determination of some physical and mechanical properties. Brussels, Belgium: European Committee for Standardization.
Esteves, B. M., and Pereira, H. M. (2009). Wood modification by heat treatment: a review. BioRes 4, 370–404. doi:10.15376/biores.4.1.370-404
Høibø, O., Vestøl, G. I., Fischer, C., Fjeld, L., and Øvrum, A. (2014). Bending properties and strength grading of Norway spruce: variation within and between stands. Can. J. For. Res. 44, 128–135. doi:10.1139/cjfr-2013-0187
Kollmann, F. F. P., and Côté Jr, W. A. (1968). Principles of wood science and technology: I. Solid wood. Berlin, Heidelberg, Germany: Springer, 592. doi:10.1007/978-3-642-87928-9
Köster, K., Metslaid, M., Engelhart, J., and Köster, E. (2015). Dead wood basic density, and the concentration of carbon and nitrogen for main tree species in managed hemiboreal forests. For. Ecol. Manag. 354, 35–42. doi:10.1016/j.foreco.2015.06.039
Krstinić, A. (1994). Genetics of black alder (Alnus glutinosa (L.) Gaertn.). Anali za Šumarstvo 19, 33–72.
Kytka, T., Gašparík, M., Sahula, L., Karami, E., Teterin, D., Das, S., et al. (2022). Bending characteristics of glued laminated timber depending on the alternating effects of freezing and heating. Constr. Build. Mater. 350, 128916. doi:10.1016/j.conbuildmat.2022.128916
Lefèvre, F., Koskela, J., Hubert, J., Schueler, S., Kraigher, H., Longauer, R., et al. (2014). Dynamic conservation of forest genetic resources in 33 European countries. Conserv. Biol. 28, 373–384. doi:10.1111/j.1523-1739.2012.01961.x
Liepiņš, K., Liepiņš, J., Ivanovs, J., Bārdule, A., Jansone, L., and Jansons, Ā. (2023). Variation in the basic density of the tree components of gray alder and common alder. Forests 14, 135. doi:10.3390/f14010135
Llana, D. F., Short, I., and Harte, A. M. (2020). Use of non-destructive test methods on Irish hardwood standing trees and small-diameter round timber for prediction of mechanical properties. Ann. For. Sci. 77, 62–13. doi:10.1007/s13595-020-00957-x
Machado, J. S., Louzada, J. L., Santos, A. J. A., Nunes, L., Anjos, O., Rodrigues, J., et al. (2014). Variation of wood density and mechanical properties of blackwood (Acacia Melanoxylon R. Br.). Mater. Des. 56, 975–980. doi:10.1016/j.matdes.2013.12.016
Malkoçoğlu, A., and Özdemir, T. (2006). The machining properties of some hardwoods and softwoods naturally grown in Eastern Black Sea Region of Turkey. J. Mater. Process. Technol. 173, 315–320. doi:10.1016/j.jmatprotec.2005.09.031
Maloney, T. (1996). Modern particleboard and dry process fiberboard manufacturing. San Francisco: CA, USA: Miller Freeman Pub. Inc.
Marron, N., Villar, M., Dreyer, E., Delay, D., Boudouresque, É., Petit, J. M., et al. (2018). Diversity of leaf traits related to productivity in Populus nigra and their relationships with tree growth under field conditions. Tree Physiol., 451–466. doi:10.1093/treephys/25.4.425
Milch, J., Vavrcik, H., Tippner, J., and Brabec, M. (2016). The effect of growth conditions in specific areas of Croatia and the Czech Republic on the physical and mechanical properties of black alder wood (Alnus glutinosa Gaertn.). Turkish J. Agric. For. 40, 7–12. doi:10.3906/tar-1407-40
Ministry of Environment, State Forest Service (2021). in Lithuanian statistical yearbook of Forestry. Lutute: Kaunas, Lithuania. Editors R. Dagilius, M. Eigirdas, A. Kuliešis, and D. Vižlenskas, 184.
Moreno-Fernández, D., Hevia, A., Majada, J., and Cañellas, I. (2018). Do common silvicultural treatments affect wood density of mediterranean montane pines? Forests 9, 80. doi:10.3390/f9020080
Pliura, A., and Kundrotas, V. (2002). Genetic variation in adaptive traits and ecological sensitivity of black alder. Balt. For. 8, 8–21.
Reiterer, A., Sinn, G., and Stanzl-Tschegg, S. E. (2002). Fracture characteristics of different wood species under mode I loading perpendicular to the grain. Mater. Sci. Eng. 332, 29–36. doi:10.1016/S0921-5093(01)01721-X
Ross, R. (2010) “J. Forest products laboratory,” in Wood handbook: wood as an engineering material. General technical report FPL-GTR-190. Madison, WI, U.S.: U.S. Department of Agriculture, Forest Service, 508.
Ruso, D., Marziliano, P. A., Macri, G., Proto, A. R., Zimbalatti, G., and Lombardi, F. (2019). Does thinning intensity affect wood quality? An analysis of calabrian pine in southern Italy using a non-destructive acoustic method. Forests 10, 303. doi:10.3390/f10040303
Savolainen, O., Pyhäjärvi, T., and Knürr, T. (2007). Gene flow and local adaptation in trees. Annu. Rev. Ecol. Evol. Syst. 38, 595–619. doi:10.1146/annurev.ecolsys.38.091206.095646
Shukla, G. K. (1972). Some statistical aspects of partitioning genotype-environmental components of variability. Heredity 29, 237–245. doi:10.1038/hdy.1972.87
Sydor, M., Pinkowski, G., Kučerka, M., Kminiak, R., Antov, P., and Rogoziński, T. (2022). Indentation hardness and elastic recovery of some hardwood species. Appl. Sci. 12, 5049. doi:10.3390/app12105049
Keywords: bending strength, modulus of elasticity, wood density, genetic influence, vertical variation, wood hardness
Citation: Šilinskas B, Varnagirytė-Kabašinskienė I, Beniušienė L and Aleinikovas M (2024) Variations in mechanical wood properties of half-sibling genetic families of black alder [Alnus glutinosa (L.) Gaertn.]. Front. Mater. 11:1425107. doi: 10.3389/fmats.2024.1425107
Received: 29 April 2024; Accepted: 23 July 2024;
Published: 21 August 2024.
Edited by:
Wei Mao, The University of Tokyo, JapanReviewed by:
Byung-Dae Park, Kyungpook National University, Republic of KoreaJuarez Paes, Federal University of Espirito Santo, Brazil
Copyright © 2024 Šilinskas, Varnagirytė-Kabašinskienė, Beniušienė and Aleinikovas. This is an open-access article distributed under the terms of the Creative Commons Attribution License (CC BY). The use, distribution or reproduction in other forums is permitted, provided the original author(s) and the copyright owner(s) are credited and that the original publication in this journal is cited, in accordance with accepted academic practice. No use, distribution or reproduction is permitted which does not comply with these terms.
*Correspondence: Benas Šilinskas, YmVuYXMuc2lsaW5za2FzQGxhbW1jLmx0