- 1Faculty of Earth Sciences, Shahid Chamran University, Ahwaz, Iran
- 2Department of Mining Engineering, Birjand University of Technology, Birjand, Iran
- 3Department of Petroleum Engineering, Petroleum University of Technology (PUT), Abadan, Iran
- 4Young Researchers and Elite Club, Ahvaz Branch, Islamic Azad University, Ahvaz, Iran
- 5Department of Petroleum Geology and Sedimentary Basin, Earth Sciences Faculty, Shahid Chamran University of Ahvaz, Ahvaz, Iran
- 6Department of Petroleum Engineering, King Fahd University of Petroleum and Minerals, Dhahran, Saudi Arabia
The assessment of alterations in hydrocarbon components preserved in reservoirs is important for oil field management and drilling procedures. Drilling fluid analysis yields valuable insights into the reservoir fluid. This study focuses on identifying and quantifying shallow gas basins in the Azadegan oil field. Risk assessment of abnormal pressure zones with a focus on shallow gas pockets based on surface gas logging data and statistical relationships is also a key aspect of this research. Shifts in the C1 gas ratio to other gas components signify a notable peak in the Asmari Formation. Consistency among various wetness (Wh), balance (Bh), and character (Ch) indices suggests that the Aghajari and Gachsaran formations potentially harbor gas and contain some heavy or residual oil with limited production potential. However, the Asmari Formation shows the potential for natural gas production, while the Gurpi Formation has the potential for wet gas or condensate. Pixler parameters were computed and plotted to affirm the results of other parameters. The investigation of stratigraphic columns for component changes and lithology reveals that lithology plays a pivotal role in preserving valuable fluids. The upper section of the Aghajari Formation, primarily composed of shale-evaporite horizons, exhibits lower frequency compared to its lower part. The Gachsaran Formation displays an exceptional ability to preserve components in anhydrite sections. Although Asmari has a high accretion ratio, the Chilean calcareous sandstone horizons are more prominent in the upper part of the Gurpi Formation. The structural model includes humpback microstructures as controls for shallow gas pockets and component accumulation. Evaporite and shale layers significantly influence the movement of these components across different horizons. The 3D model illustrates migration from the Gurpi Formation to the Aghajari Formation, as both formations serve as sources due to the propagation paths leading to the Pabdeh and Gurpi Formations.
1 Introduction
Drilling in oil and gas wells has always been accompanied by numerous problems and risks, encompassing challenges related to drill pipes, wellbore stability, loss circulation, casing collapse, and the potential influx of drilling fluid into the well (Deville, 2022; Ashena et al., 2020; Karimi et al., 2011). ne specific issue pertinent to gas formations is the discovery, during the final stages of drilling, that they are associated with low formation pressure (Baouche et al., 2020; Peng et al., 2021). Dealing with shallow gas remains a persistent challenge in exploration and drilling operations globally. Shallow gases, found near the surface but not directly beneath the drilling bit, pose a significant risk when pressurized, as they can lead to explosions from even a small spark (Zhang et al., 2022). The use of heavy-weighted drilling fluids to manage formation pressure is often ineffective, resulting in mud losses and blowouts (Hassanpouryouzband et al., 2024). These events, such as kicks or advanced blowouts, can cause rapid dispersion of the mud column and wellbore issues, leading to financial losses. To prevent such incidents, a comprehensive geomechanical study prior to drilling and awareness of shallow gas indicators, combined with a strategic control plan, are essential (Holdaway and Irving, 2017). While the exact causes of these occurrences remain uncertain, factors like compaction, diagenesis, density differences, fluid migration, and tectonic activity are believed to play significant roles (Yan et al., 2020).
In general, numerous researchers in various fields have explored abnormal pressure (Hu et al., 2024), shallow gas reservoirs utilizing seismic data (Kim et al., 2020), and shallow gas reservoirs using parameters like wave velocity, acoustic impedance, Angle Of Offset Versus (AOV) amplitude, and velocity versus effective stress. The Earth Mechanical Modeling (MEM) technique has also been widely utilized by researchers, incorporating a variety of available data on rock mechanics, geological conditions, and regional stress distribution (Zaei et al., 2024).
Furthermore, certain studies encompass information on well modeling, considering weak surfaces and depleted reservoirs (Lang et al., 2011; Rashid et al., 2022), as well as addressing issues such as mud loss, eruption, and blowout from shallow gas reservoirs (Schout et al., 2018). Pore pressure estimation to enhance well drilling efficiency and predictions of well stability are also explored in some studies (Radwan, 2021; Ponomareva et al., 2022).
Leifer and MacDonald (2003), using three imaging techniques (side, front, and back illumination), aimed to analyze methane hydrate decomposition on continental margins by examining hydrocarbon bubbles rising from the sea floor. Back illumination yielded optimal imaging results, enabling calculations of bubble distribution, mass flux, and rise speeds. Findings highlighted significant oil contamination in larger methane bubbles (Leifer and MacDonald, 2003).
Cathles et al. (2010), using gas–piston–water-drive equations, investigate gas-driven pockmark formation on the seafloor. The study suggests that gas accumulates under a capillary seal until pressure breaches the seal, triggering a gas chimney. This quickens sediment, leading to pockmark formation. Conclusions highlight that gas chimney growth monitoring may predict seafloor instability risks (Cathles et al., 2010).
Landrø et al. (2019), using pre- and post-blowout geophysical data, examine subsurface gas flow behavior in weak Quaternary sediment sequences. Their study investigates flow patterns following a year-long North Sea gas blowout, revealing long-term gas migration through shallow sand layers and potential gas leakage along wellbores. The findings enhance understanding of CO₂ and gas movement in unconsolidated sediments (Landrø et al., 2019).
Girona et al. (2019), using seismic signal analysis, aim to link volcano-seismic tremors with subsurface volcanic processes to improve eruption forecasting. Their findings reveal that shallow volcanic tremors arise from periodic pressure oscillations in permeable magma caps, due to gas flow, gas pocket formation, and volatile supply. The study highlights tremor properties, aiding eruption prediction (Girona et al., 2019).
Cathles et al. (2010) used numerical simulations to explore an operation mode for pre-emptively releasing shallow gas from ultra-deepwater reservoirs using pilot holes. This approach aims to enhance drilling safety by controlling gas discharge in advance. Results indicate that larger pilot hole sizes improve release velocity and reduce collapse heights. The study provides valuable insights for ultra-deepwater shallow gas management strategies (Long et al., 2023).
While previous technologies have focused on various aspects of subsurface hazard assessment, none have yet integrated gas data specifically for estimating shallow gas hazards. This study pioneers the use of gas registration data in Iran to address this gap. Our primary aim is to develop an innovative methodology for assessing risks in oil and gas fields, leveraging geostatistical modeling to identify and mitigate areas with abnormal pressure zones, thereby minimizing shallow gas accumulations.
Although numerous studies, including those on geomechanics and borehole analysis, have explored similar fields, our approach offers a unique contribution through advanced gas analysis and differentiation during drilling operations. We demonstrate the efficacy of surface logging systems, incorporating features such as formation evaluation by gas ratios, as a key method that adheres to rigorous safety standards and enhances predictive accuracy in hazard prevention.
2 Study area
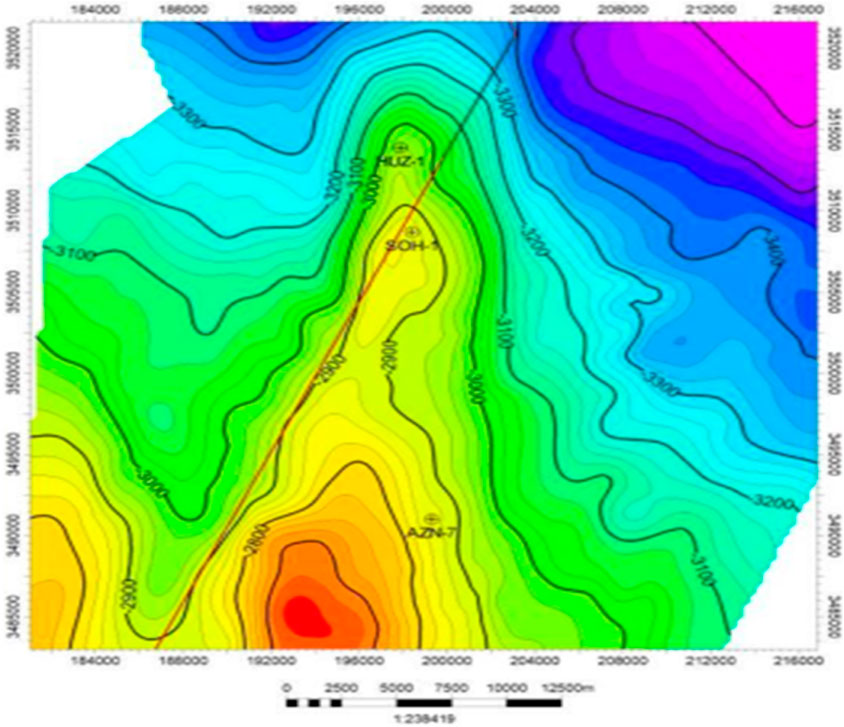
The Azadegan large oil field is situated in the Abadan plain, adjacent to and parallel to the Iraq-Iran border, approximately 30 km southwest of the Jofair Field and 80 km west of Ahwaz. Based on depth-dependent maps, the Azadegan anticline takes on the appearance of an asymmetrical oval with a north-south trend. The dip of the layers is more pronounced in the south compared to the north, but it remains consistent in the west and east (Figures 1, 2). The structure is narrower in the north and wider in the south. Notably, it includes three culminations at the Sarvak, Darian, and Fahliyan horizons, measuring 5 km × 22 km, 7 km × 26 km, and 4 km × 21 km, respectively. The vertical apexes at these horizons are recorded as 80 m, 110 m, and 90 m.
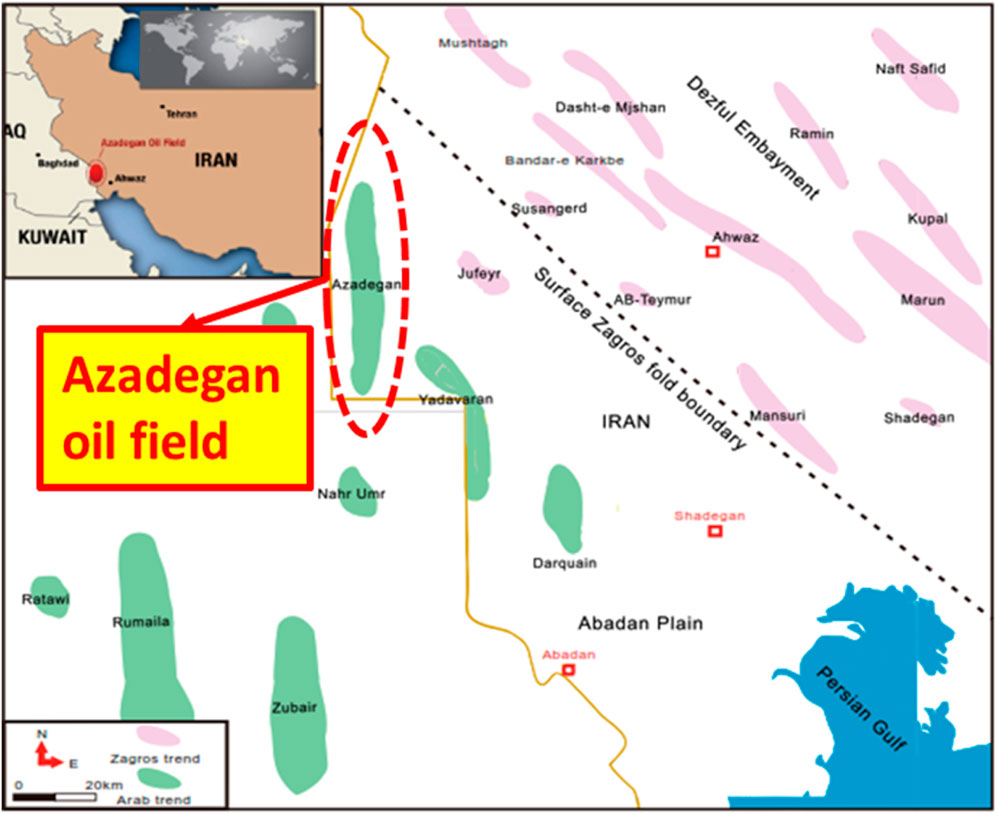
Figure 1. Illustrates the geographical location of the Azadegan anticline within the Zagros sediment basin (Du et al., 2016).
2.1 The reservoir of asmari
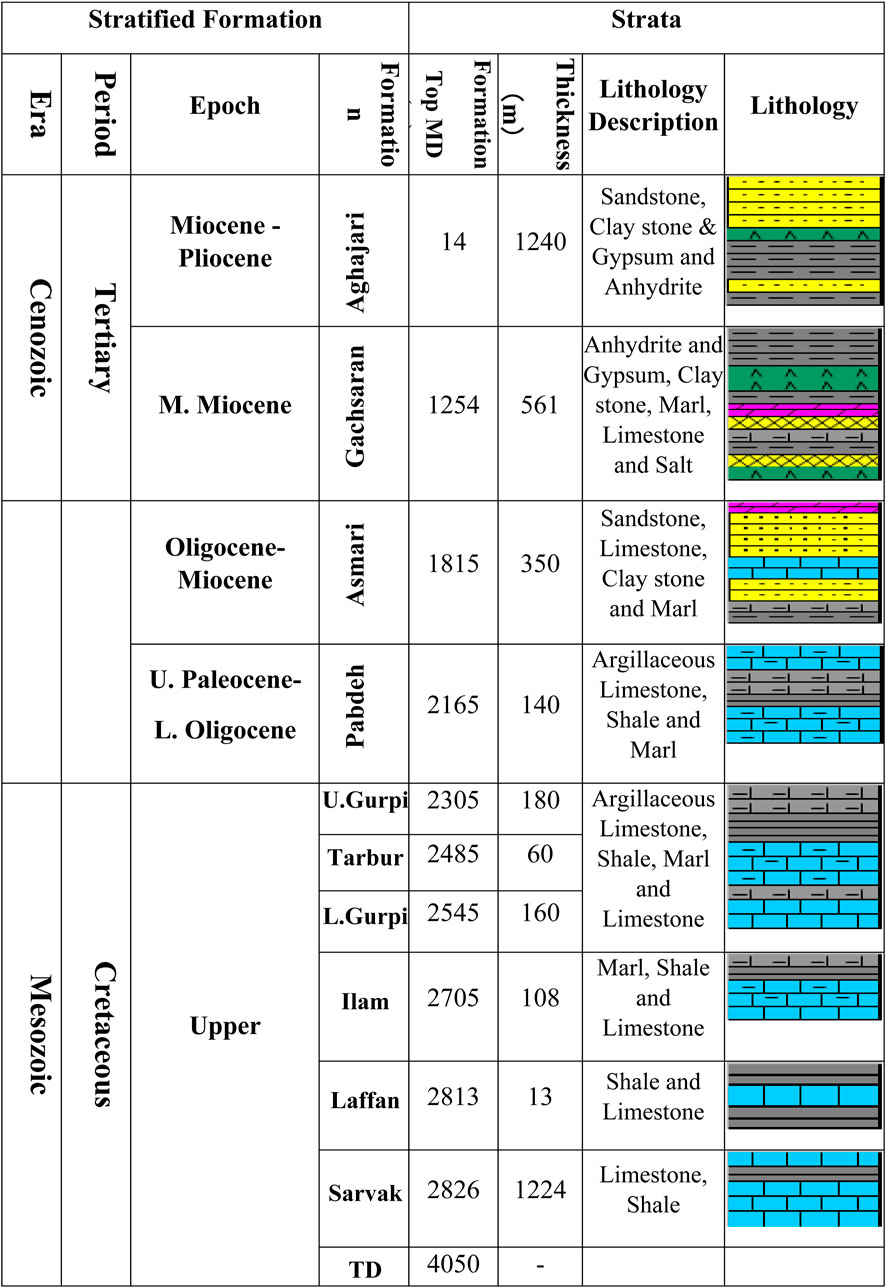
Oil and associated gas predominantly accumulate in two carbonate reservoirs: Sarvak, dating from the Cenomanian-Turonian period, and Asmari, from the Oligocene-Miocene era. Asmari is characterized by severely fractured continental facies with a low cement content (mainly sandstone), interspersed with layers of shale and marl, as well as evaporitic facies (anhydrite and gypsum). Positioned above the Pabdeh Formation (Eocene) and beneath the Gachsaran Formation (upper Miocene), Asmari exhibits extensive sandstone facies in the Dezful embayment and predominantly evaporitic facies (Kalhor member) in Lorestan (Figure 3).
In the Neogene orogeny of the Zagros region, oil and associated gas accumulate in large elongated anticlines, commonly referred to as whalebacks (Bordenave and Hegre, 2005). The sandstone member of Asmari is further divided into two sections based on its stratigraphic position: the upper segment (Aquitania-Burdigalian) and the lower section (Oligocene-Chattian). The Kalhor member, also identified as the Basal Anhydrite, constitutes the basal part of the Asmari formation, predominantly composed of Anhydrite-Gypsum facies with interlayers of marl and clay (Nikrouz et al., 2017).
Structural traps play a pivotal role in the field, surpassing the influence of other oil traps. Stratigraphical traps, influenced by facies variation over time and space, have been highlighted in the literature (Dolson et al., 2018). The impact of structural alterations on the time-space distribution of these formations aligns with prior research (Haidari et al., 2020). The research conducted by Haidari et al. establishes a robust foundation for future investigations into stratigraphical traps on a regional scale.
2.2 Aghajari formation (miocene-pliocene)
This formation, with a thickness of 1,263 m, consists mainly of claystone (red-grey), sandstone, and interlayers of anhydrite (or gypsum), claystone, and bulk sandstone in the lower section. The claystone is a reddish-brown, sticky, sand-like, loose, and washable residue, occasionally displaying an olive-green color. The sandstone is highly saturated, fine-grained, and rounded, composed of quartzite and exhibiting a pale yellow, smoky, semi-hard texture. Anhydrite crystals within the formation are greasy to the touch, clear, white, and semi-hard.
2.3 Gachsaran formation (middle miocene)
The formation includes grey claystone, gypsum/anhydrite, and claystone with marl, sandstone, calcareous, and salty grey claystone. The lower section consists of gypsum/anhydrite along with a succession of claystone, marl, calcareous limy claystone, salt, and thin layers of lime and Argilous lime. Its thickness measures approximately 608 m.
2.4 Asmari formation (oligocene-miocene)
It is approximately 300 m thick and is primarily composed of sandstone and red claystone. Interlayers of sand (Ahwaz member) are found in the middle, along with red claystone, lime (sometimes chalky), and a sequence of sandstone, marl (rarely shale), and Argilous lime.
2.5 Pabdeh formation (upper paleocene-lower oligocene)
This formation consists mostly of marl, Argilous lime, and shale, with a thickness of 235 m.
2.6 Gurpi formation (campanian-santonian)
It is divided into three sections: upper Gurpi, Tarbur, and lower Gurpi (Maastrichtian). The upper section is 89 m thick, the middle section is 36 m thick, and the lower section is 118 m thick. It is predominantly marl, with Argilous lime and thin shale layers.
2.7 Ilam formation (santonian)
It is primarily composed of lime, marl, and shale, with an approximate thickness of 95 m.
The Azadegan oil field is situated southwest of the Zagros overthrust fault zone, marking the transition zone between the Zagros foreland basin and the Arabian platform, as delineated by tectonics (Soleimani, 2013). Two distinct trap types with unique mechanisms of formation are identified here: one is known as the Zagros Trend, located in the foothill zone (Zagros folded zone) and striking northwest–southeast, exhibiting similar patterns of elongated anticlinal structures in the Zagros Mountain range. The Miocene Asmari Formation, primarily comprising limestone and sandstone, serves as the principal reservoir for the Zagros Trend oil resources (Zhang et al., 2012).
The other type, referred to as the Arabian Trend, involves uplift induced by basement fault “resurrection” and salt flow, prevalent in various oil fields in the southeast of Iraq, Kuwait, and northeast Saudi Arabia, with anticlinal structures oriented in a north-south direction. The reservoirs in this type of oil field primarily belong to Cretaceous formations, such as Ilam, Sarvak in Iran, and Mishrif, Rumaila in Iraq (Bordenave and Hegre, 2005).
The Azadegan field is a massive N-S trending anticline of the Arabian Trend with an extended long axis. According to Du et al. (2016), there are no large faults, and two domes are situated in the north and south, connected by the middle saddle area (Du et al., 2016). However, Fard et al. (2006) identified evidence of basement faults based on seismic profiles (Figure 4) (Fard et al., 2006). The southern dome is more elevated than the northern dome. The northern structure comprises a small anticline with steep rises, while the southern structure encompasses a larger oil field area that extends into Iraq.
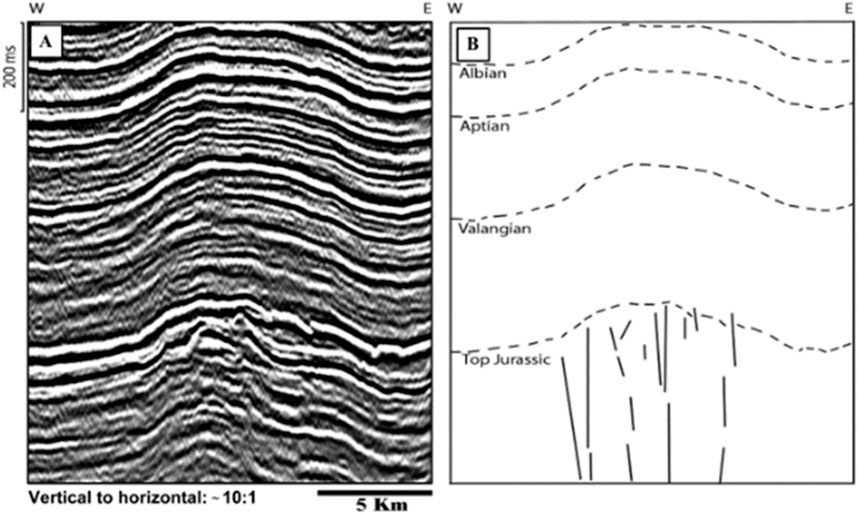
Figure 4. (A) - The vertical seismic profile of Azadegan field reveals the existence of a vertical fault system in lower Jurassic sedimentary rocks. The onlap condition, especially noticeable in the western limb, and thinning at the crest’s summit suggest that the Azadegan field was elevated during the upper Cretaceous period. (B) - Geological interpretation of Azadegan formation (Fard et al., 2006).
Except for a brief period of discernible regional instability in the upper Cretaceous Turonian Stage, the Azadegan oil field was in a sustained subsidence phase (Du et al., 2016). Since the Zagros orogeny, the Azadegan field’s trap deformation has accelerated, with a substantial reduction in trap size, and the limbs have become steeper (Figure 5). The fold transitioned from a broad and mild anticline to a long and narrow one until the late Miocene (6 Ma). Prior to approximately 3 Ma (the latest surface Zagros fold occurred at roughly 4 Ma), the plate nappe stress reached the Azadegan oil field, reactivating the deep basement fault (Du et al., 2016), resulting in significant secondary deformation of the trap. The northern paleo-trap has been continually compressed and evolved into the field’s current northern high. The southern paleo-low operates like a “teeterboard,” with a strongly elevated portion forming a secondary trap. The top surface of the Pliocene Aghajari Formation, formed before 2 Ma, is flattened, indicating significant constriction of the northern paleo-trap, and formation uplifting occurred in the south, where the elevation remained lower than in the north. Now that the structural amplitude in the south has exceeded that in the north, two structural highs have emerged, where the south exceeds the north (Du et al., 2016).
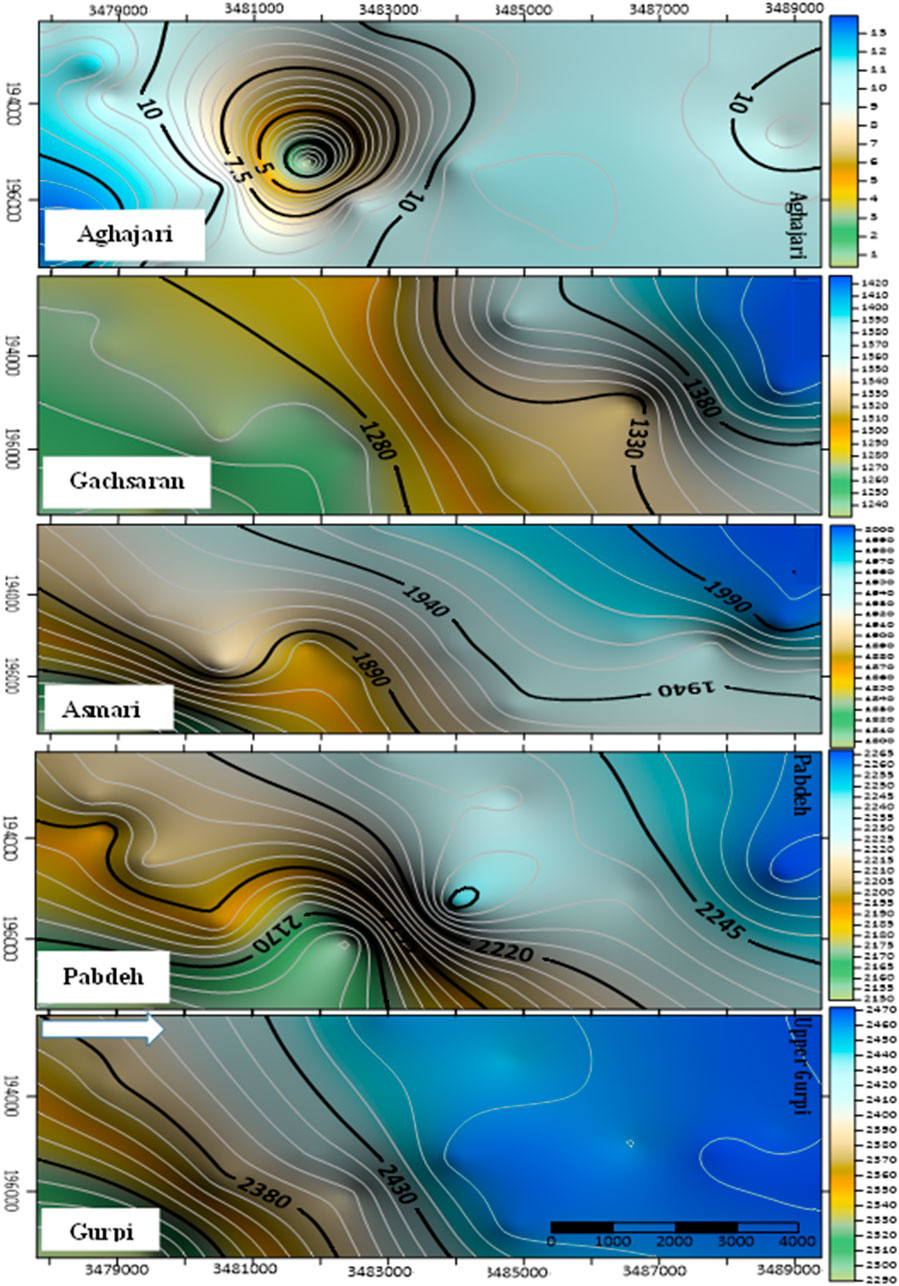
Figure 5. Illustration the layered thickness model of various studied formations, illustrating the role of microstructures in the Azadegan formation of gas pockets.
3 Methodology
3.1 Gas detectors
Hydrocarbon gas detection and analysis systems are essential components of surface gas logging equipment. During drilling operations, these systems, along with associated instruments, generate gas detection logs. The procedure involves the initial separation of gas from mud by a degasser, followed by the integration of hydrocarbon detectors and analyzers into surface logging units. The total gas detector provides an estimation of the overall amount of hydrocarbon gases present in the drilling fluid.
The operation of this apparatus is based on the absorption of infrared light. Various gases, including methane and other hydrocarbons, absorb energy when exposed to an infrared light source. Each gas has a specific wavelength at which it absorbs infrared light. The gas sample, extracted from the degasser, traverses the passage between the shaker and the surface logging units before entering this apparatus. Inside the apparatus, the sample is exposed to infrared light after passing through a chamber. An integrated detector, configured to read absorption peaks, assesses the intensity of the radiated infrared light at the measured and reference wavelengths. It then generates an output signal to estimate the gas concentration in the sample.
3.2 Statistical technique
Geostatistics is a collection of techniques with the objective of offering a comprehensive description and determining the temporal distribution of an assumed feature under examination, particularly when data is limited. In a broader sense, geostatistics encompasses all statistical and probabilistic methodologies used in the geosciences. To be more precise, as discussed throughout this post, it involves the analysis of random variables utilizing the concept of regionalized variables.
3.3 Modeling
Our research methodology, involving the utilization of Petrel software and the development of an appropriate model to specify the amount and percentage of gas volume and lithology in each zone within our study, is outlined as follows:
• Data Entry
• Modeling of Structural Elements
• Modeling the Many Facets
3.3.1 Quality control (QC) of the data
This stage is aimed at enhancing the data and ensuring its suitability for field estimates and petrophysical determination. It is a more experimental technique that heavily relies on the user’s accuracy. To ensure quality control, the following actions have been implemented:
• Upscale Well Logs
• Analyze Data
3.3.2 Data analysis
It is a process of data quality management and preparation that provides and prepares essential information for modeling the petrophysical features and facies. This procedure can be broken down into two stages:
• The Data Analysis Process: This step involves conducting a precise study of the facies ratio and thicknesses, translating the information to permanent features, and creating a unique variogram.
• Common data analysis tools include the histogram and functions for examining how the distribution of certain variables has patterned. Additionally, determining that those qualities are related to and consistent with one another.
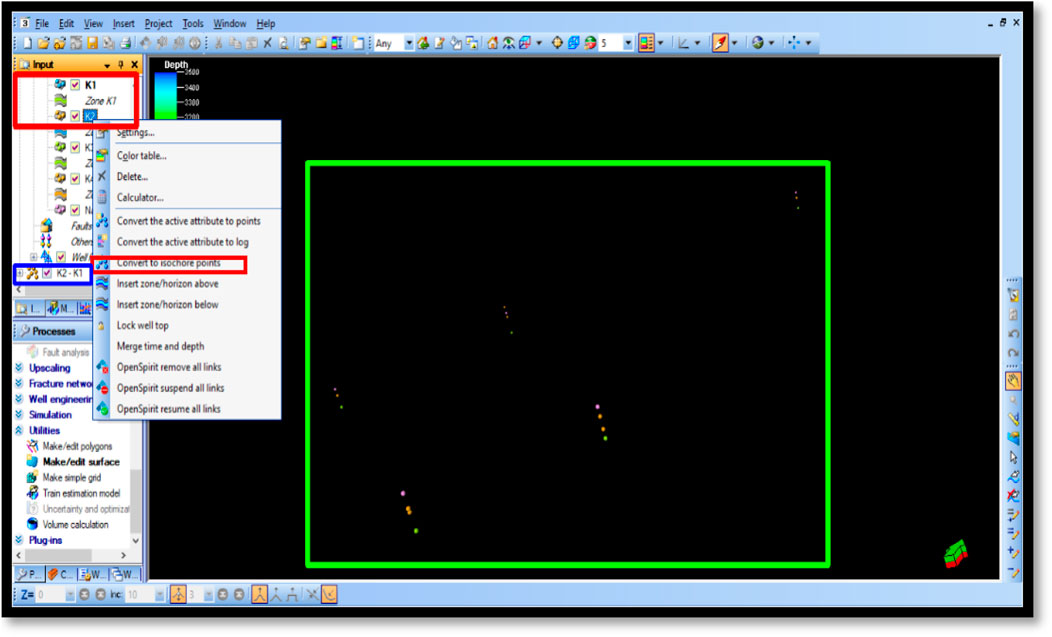
The data analysis process is accessible by modeling the features in the processes module (Figure 6), allowing the user to conduct a detailed analysis. Several techniques are available in the data analysis window, depending on whether the characteristic is continuous (facies) or discontinuous (gas volume or permeability) (Petrel 2009; User Guide).
The data analysis method is executed sequentially for each zone and facies. Clicking on the data analysis option in the process module activates the data analysis window. At the top and left of this window, the desired features, zones, and facies should be entered, respectively. Below this section is a lock that must be unlocked to access two options in the data analysis window (Transformation/Variogram). These two options are essential for completing data analysis and should be implemented and scrutinized for each zone and feature. If this is done, the features are prepared for modeling, determination, and estimation within the extent of our inspection field. Among the numerous methods available in the Petrel software, we utilized the kriging algorithm to predict the percentage of each lithology in the region of our reservoir. Additionally, we used the random procedure to compute the percentage of gas volume in each sector of the 3D statistical distribution cube (SGS).
4 Result and discussion
The light gas ratio serves as the starting point for gas analysis, while heavy gas ratios provide continuous information about components and occasional insights into fluids and reservoir conditions. The following light gas ratios serve as a starting point for describing fluids, fluid interactions, and abnormal situations:
• Howorth and Whittaker
• Pixler ratios (descriptive-indicative)
• Ratio C1 (descriptive)
• Ratios of biodegradation (evaluative/contamination indicators)
4.1 Haworth and whittaker
Whittaker and Haworth’s various indicative parameters are routinely utilized gas ratios based on depth; these include the Wh (Equation 1), the Bh (Equation 2) and Ch (Equation 3) indicators. These ratios are used to assess fluid interactions, determining whether it is a Gas-Oil Contact (GOC) or an Oil-Water Contact (OWC).
This ratio measures the number of heavy alkanes and discloses the density of their mixture in potential zones:
• If Wh < 0.5, the gas is dry and has little or no potential for production.
• If 0.5 < Wh < 17.5: possibility for gas.
• If 17.4 < Wh < 40, oil potential (oil gravity is proportional to the Wh increment).
• If Wh > 40, residual or heavy oil with or without potential for productivity.
This balance ratio quantifies the proportion of pure heavy alkanes to pure light alkanes (methane and ethane) and, in conjunction with the ratio (Wh), adds credibility to our view.
• If Wh < 0.5 and Bh > 100, dry gas with (or without) a low potential for production.
• If 0.5 < Wh < 17.5 and Wh < Bh < 100, gas productivity.
• If 17.5 < Wh < 40 and Wh > Bh, the possibility for condensates and very heavy oil production exists.
• If 17.5 Wh 40 and W > Bh, oil production is possible. The oil gravity increases when the curves diverge.
• If Wh 17.5 > 40 and Wh >> Bh: residual or heavy oil having a very low production potential (without the).
• If Wh is greater than 40, there is no production, an aqueous zone, or residual oil with very low gravity.
The descriptive ratio is denoted by the third equation. This ratio excludes light hydrocarbon components and compares only heavy hydrocarbon components. It enables us to establish the presence of heavy hydrocarbon fluids and can be used to differentiate extremely moist gas from oil with high gravity.
• If Ch < 0.5, the presence of the gas phase is confirmed, suggesting the presence of wet gas and gas condensates.
• If Ch > 0.5, the existence of a liquid phase is verified, and the observed gas is associated with oil according to equation one.
When only methane is present, the C1 ratio tends to be one; however, when heavier components are present, the C1 ratio decreases. When the distribution points are too many, it indicates the gas’s wetness, fluid mutation, and reservoir discontinuity. This suggests that there are insufficient hydrocarbons to analyze. Equation 4 is applicable to fluids.
• 0.95 < C1/(C1 + C2 + C3 + C4 + C5): dry gas produced by bacteria (methane)
• 0.85 < C1/(C1 + C2 + C3 + C4 + C5) < 0.95: most likely gas production
• 0.6 < C1/(C1 + C2 + C3 + C4 + C5) < 0.85: probable oil production
• C1/(C1 + C2 + C3 + C4 + C5) < 0.6: residual oil is probable
4.2 Pixler’s graph
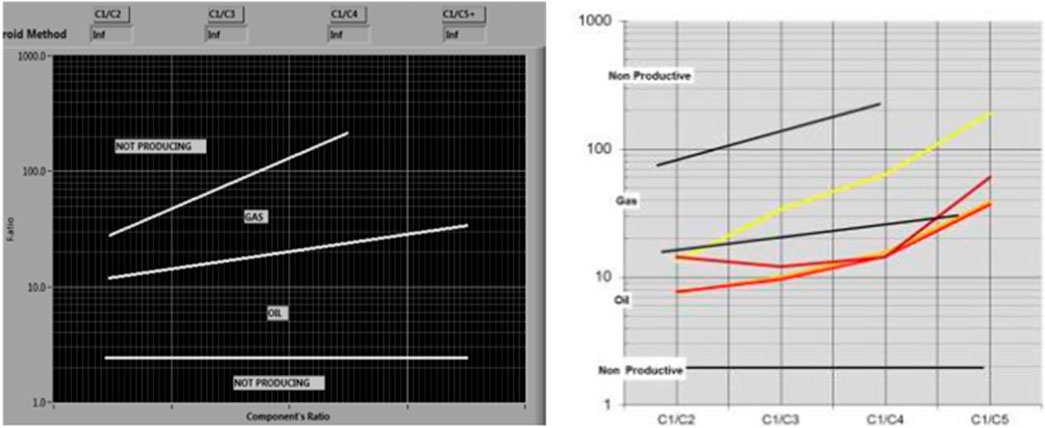
This is the primary distinction between this graph and the ratios explained: it was developed specifically for analyzing a gas component at a certain depth. Therefore, when utilizing this graph, it is critical to select the depth. After depth selection, it should measure C1 to C2 or any depth with heavier components. The closer the component is to the X-axis on this graph, the heavier the fluid is at that depth. On the other hand, if the curve dips or remains high in the graph, the components are dry gases. Segregation of fluid gravity would occur (Figure 7).
4.3 Ratio of biodegradation
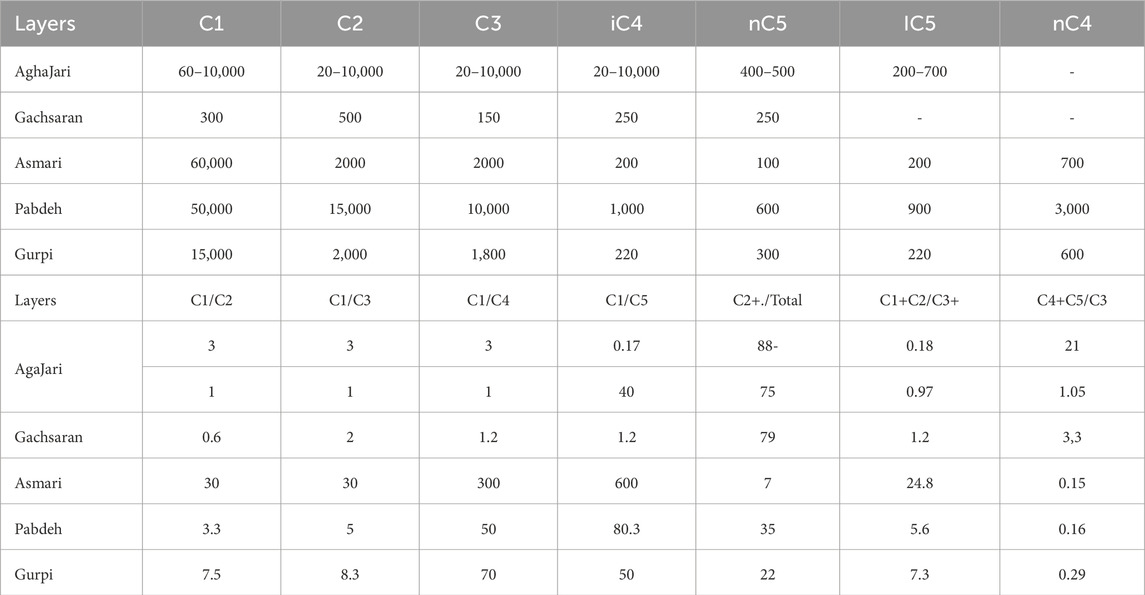
Because bacteria prefer to target alkane chains rather than their branches, if the ratio of iC4/nC4 or iC5/nC5 (Equation 5) is larger than 1, the formation fluid may be biodegraded.
With reference to Table 1, it is possible that the gases from the lower part of the Aghajari Formation are biodegraded (the ratio is more than 1). Concerning the iC4/nC4 ratio in the remaining formations, they either show no biodegradation effect or exhibit only a few alterations in the iC5/nC5 ratio. Figure 8 illustrates one of the stratigraphical columns, as well as the distribution pattern of the gas components C1 to C5. The data for each unit are shown in Table 1. Gas components are identified at lower concentrations in the Aghajari Formation’s top section, whereas they are abundant in the lower region, particularly in the shaly-evaporitic layers. The Asmari Formation contains a significant amount of gas, particularly C1. The amount is high in shaly limes, but it is more than the amount in the upper sandstone horizons. Additionally, there is an increase in the amount of gas components, which are abundant in the Gurpi Formation, particularly in the upper part. Their number, on the other hand, reduces as one descends into the deeper sections.
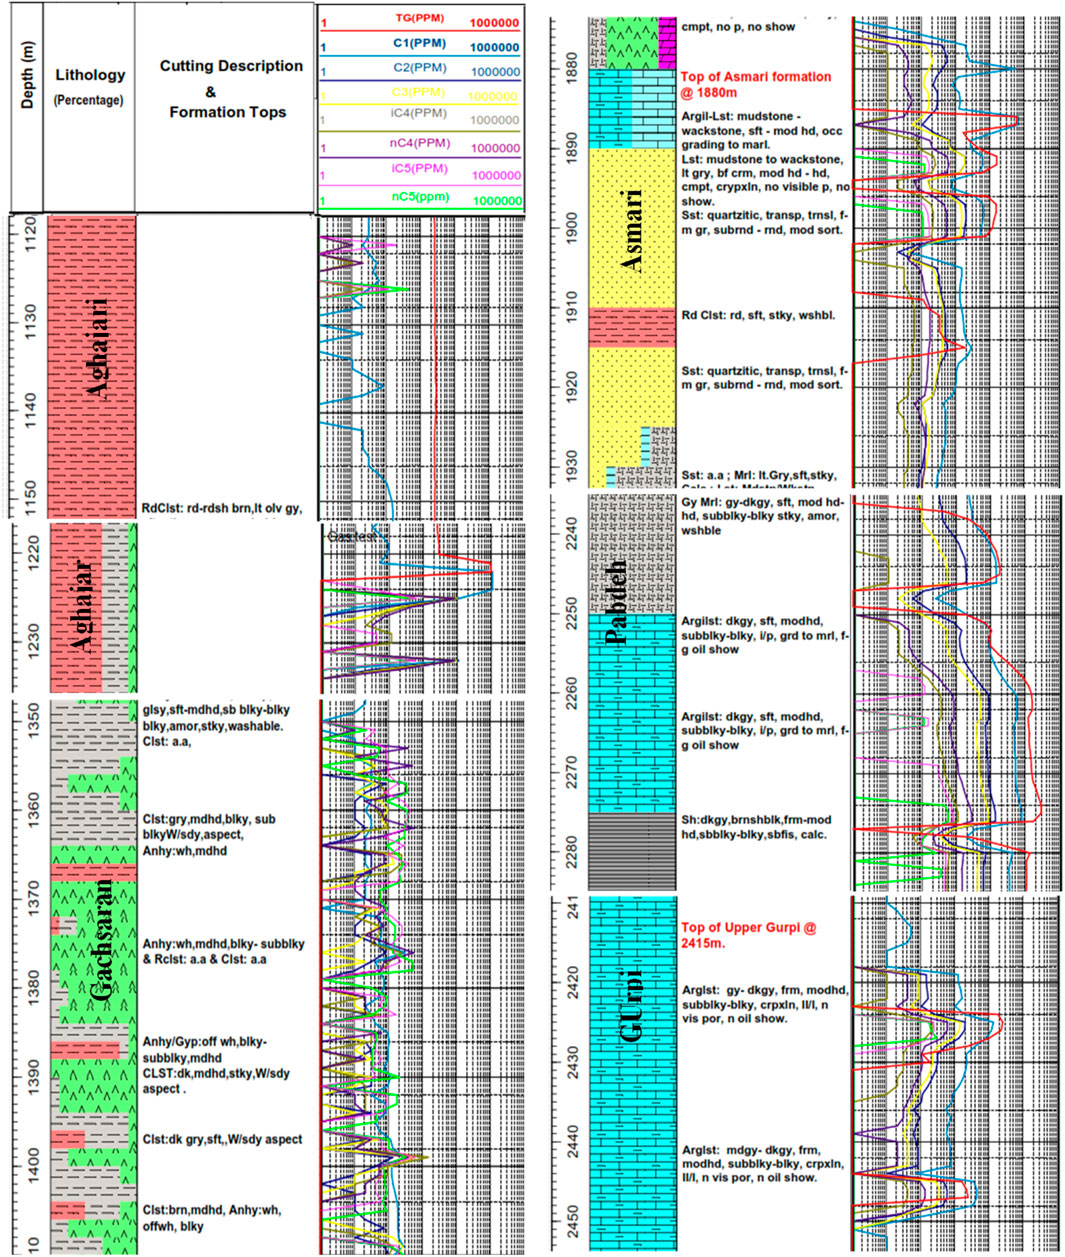
Figure 8. Illustrates selected sections of the stratigraphic column in one Azadegan’s well, which show the distribution pattern of gas components C1 to C5.
Figure 9 illustrates the variations in the C1 ratio to the other components. As may be seen from the graphic well log for the Asmari Formation, there is a climax. The following findings can be obtained by calculating the discussed gas component ratios:
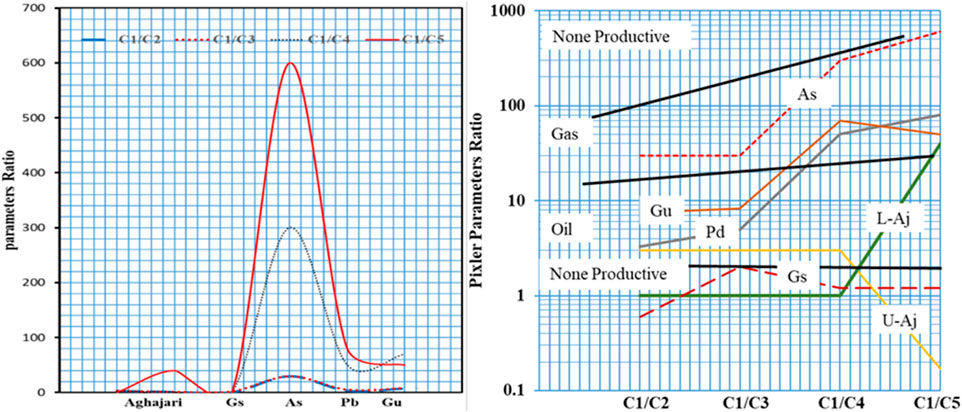
Figure 9. Distribution of the C1 ratio in relation to other components (above) and the Pixler ratios (below).
The Aghajari Formation’s Wh index (88 percent) indicates the presence of heavy oil or residual oil production with little or no potential. It is approximately 79 percent in Gachsaran. It is approximately 7% in Asmari, indicating the potential for gas productivity. It is approximately 35% in Pabdeh, which signifies oil production, and approximately 22% in Gurpi, which means oil production capability.
In the Aghajari Formation, the Bh index (18%) implies heavy oil or residual oil production with little or no future potential. It is around 1.2 in Gachsaran, and the result is similar to Aghajari. It is approximately 24.8 in Asmari, indicating the possibility for gas production. It is approximately 5.6 in Pabdeh, indicating oil production, and approximately 7.3 in Gurpi, indicating oil production capabilities.
Aghajari’s Ch index is approximately 21, indicating the presence of a liquid phase. It is approximately 3.3 in Gachsaran, which is similar to Aghajari. It is approximately 0.15 in Asmari, indicating the presence of gas in the form of wet or gas condensates. Pabdeh and Gurpi have values of 0.16 and 0.29, respectively, and produce similar outcomes as Asmari.
In comparison to other components, the Pixler characteristics (Figure 9) suggest that the Asmari Formation has the capacity to generate gas, although Aghajari and Gachsaran do not have this capability or only have a small amount of potential. Pabdeh and Gurpi are productive and have the potential to produce natural gas. Figure 9 illustrates the distribution of the C1 ratio in relation to other components and the Pixler ratios. The top graph showcases the C1 ratio plotted against various components like Aghajari, Gs, As, Pb, and Gu. The C1 ratio exhibits a distinct peak for Aghajari, indicating a higher concentration of C1 in this component. The ratio then gradually decreases for Gs and As, reaching a minimum at Pb, before increasing again for Gu. This pattern suggests a correlation between the C1 ratio and the specific components analyzed. The bottom graph depicts the Pixler ratios, which appear to be a measure of productivity or abundance. The y-axis is logarithmic, spanning from 0.1 to 1,000. Different components (As, Gas, Gu, Oil, Pd, L-Aj, Gs, and U-Aj) are represented by lines with varying slopes and intercepts. The C1/C2, C1/C3, C1/C4, and C1/C5 ratios are plotted on the x-axis. The “None Productive” line serves as a baseline, indicating areas with low productivity. The other lines intersect this baseline at different points, suggesting varying levels of productivity for each component. The Pixler ratios seem to increase with the C1/C ratio, implying a positive correlation between the two. However, the relationship is not linear, with the increase becoming more pronounced at higher C1/C ratios.
4.4 Modeling
To effectively identify, evaluate, and manage the risks associated with shallow gas pockets, we calculated the depth and thickness of various stratigraphical units. This data was sourced from 18 wells and analyzed using Petrel software (Figure 10). Our findings revealed that the presence of evaporative and shaly layers affects the shape and distribution of unique hunchback-shaped microstructures within the study area (Figure 11).
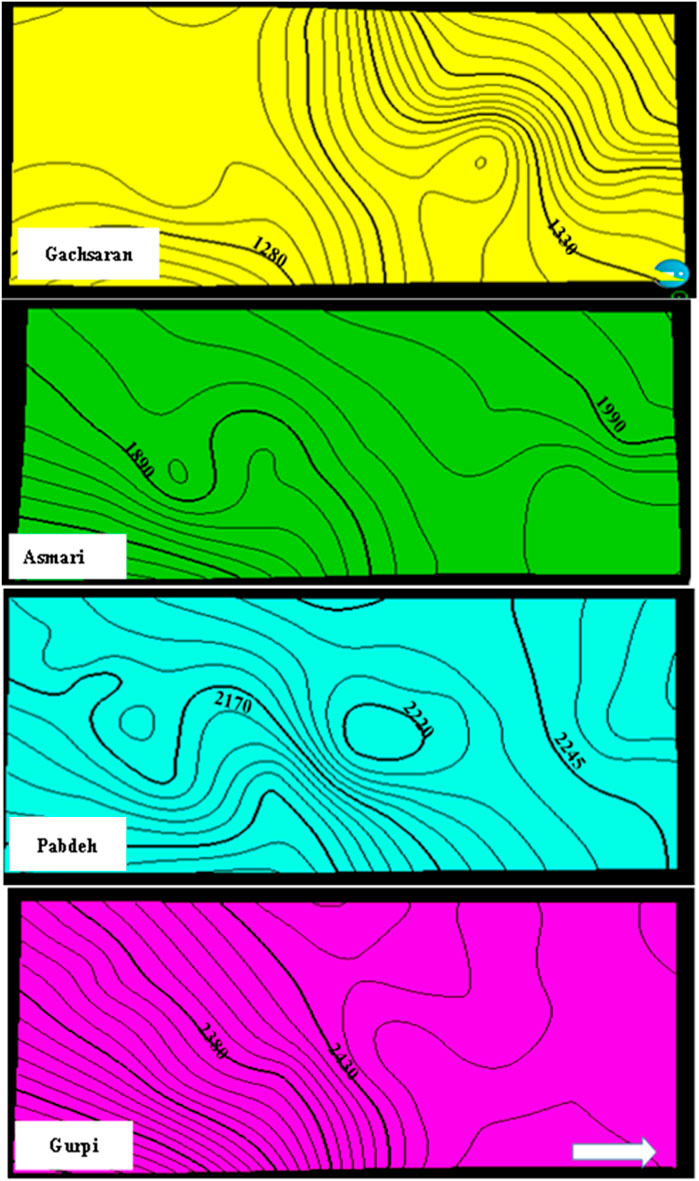
Figure 10. Two-dimensional structure of the Asmary reservoir and the stratigraphical units that surround it.
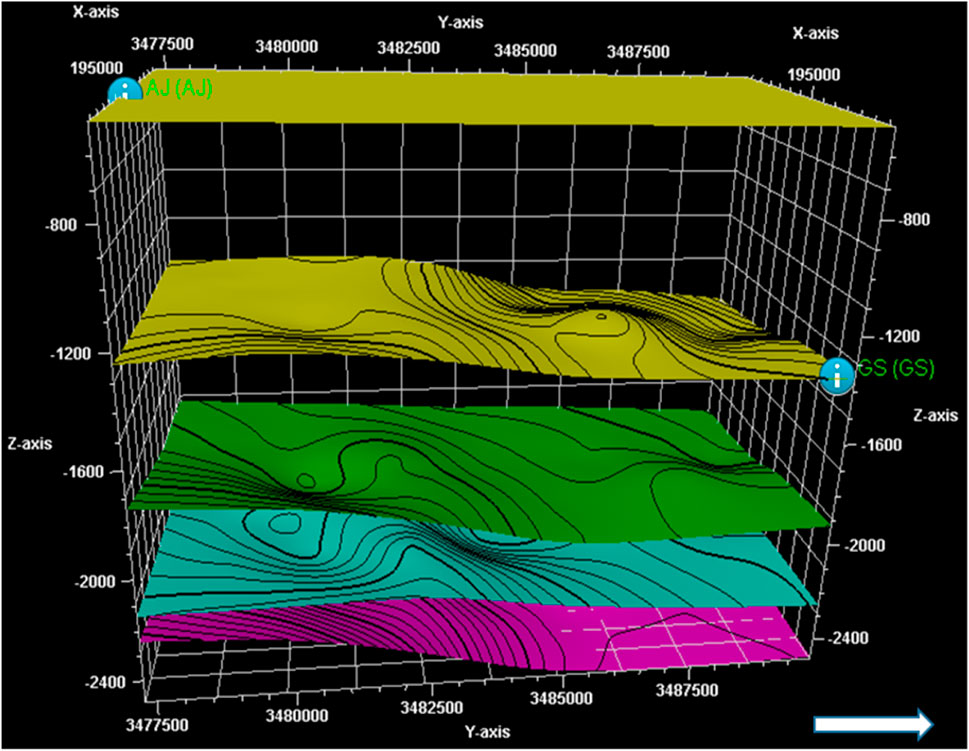
Figure 11. Three-dimensional structure of the Asmary reservoir and the stratigraphical units that surround it.
Next, we integrated data on gas components and created visual representations for each stratigraphical unit (Figure 12). We then modeled the migration and distribution of shallow gas pockets from the Gurpi Formation to the Aghajari in the Azadegan oil field. The modeling focused on gas component movement, particularly in the X-Z direction, highlighting how these components generate and migrate toward the surface. We also analyzed the gas flow in the Y-Z and X-Y directions (Figures 13, 14).
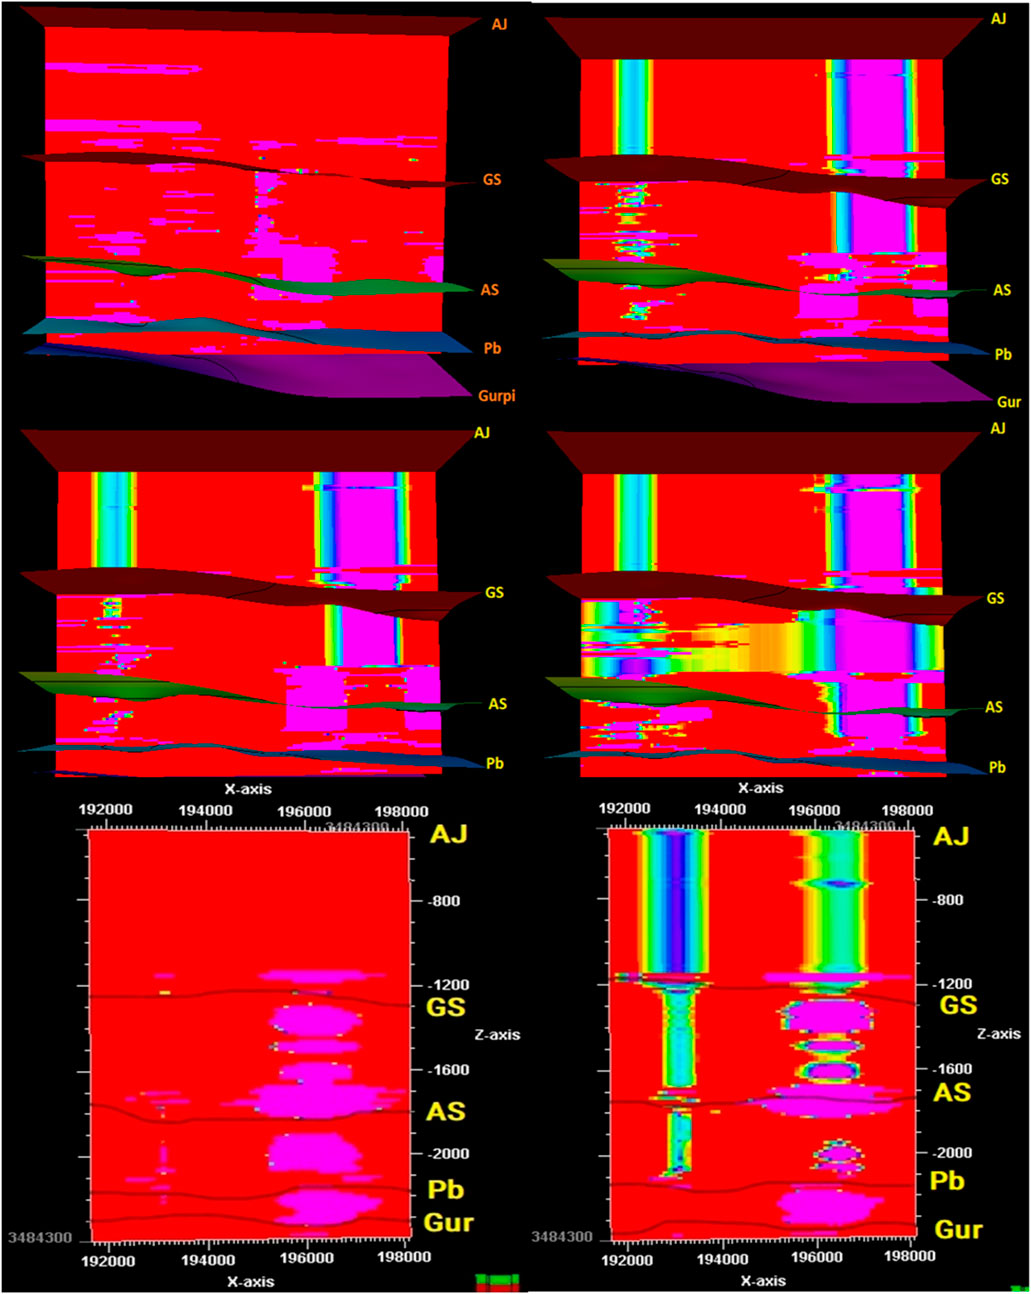
Figure 12. The vertical diffusion pattern of detected gases in the Y-Z direction indicates the production of gas from Pabde formation and its migration in the stratified column towards the surface.
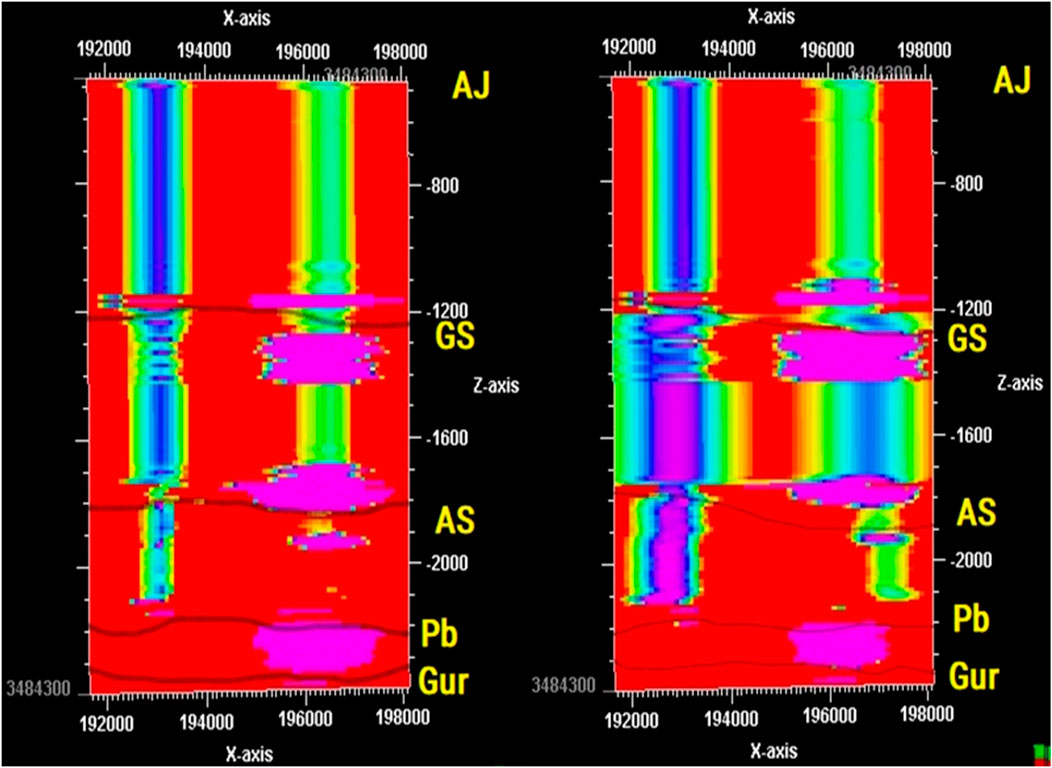
Figure 13. The vertical propagation pattern of identified gases in the X-Z direction. It denotes gas production and migration through the stratigraphic column from the Pabdeh formation to the surface.
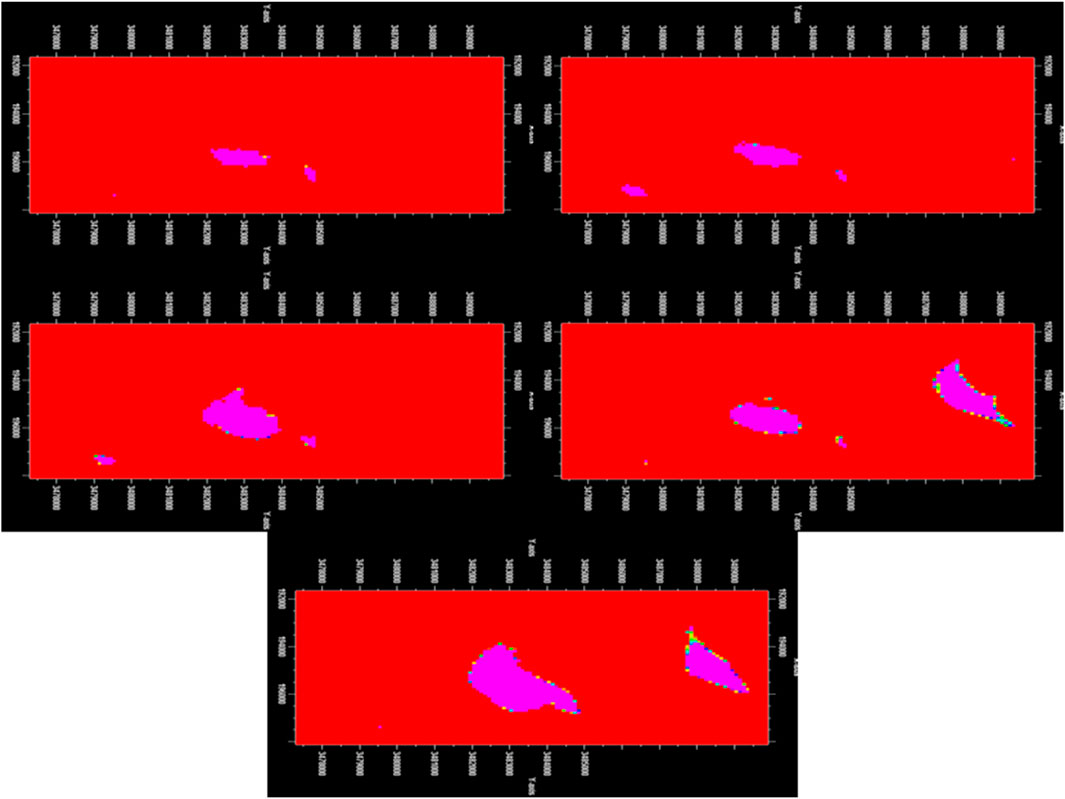
Figure 14. Vertical propagation pattern of identified gases containing C1 to C5 in the X-Y direction.
Figure 13 illustrate the vertical movement of gases (AJ, GS, AS, Pb, Gur) from the Pabdeh formation towards the surface. The X-axis represents the horizontal distance, while the Z-axis signifies the depth. The color intensity corresponds to the concentration of the respective gas. The figure shows that the gases have migrated upwards through the stratigraphic layers, with some gases (like AJ and GS) reaching closer to the surface than others (like Pb and Gur). This suggests that the Pabdeh formation is a source of these gases and that they have migrated through the overlying formations, possibly due to pressure and temperature gradients or geological structures.
Our analysis indicated that gas production primarily occurs in the Pabdeh Formation and, to some extent, in the upper section of the Gurpi Formation, with gas migrating upwards to the surface. Our model demonstrated that the Gurpi and Pabdeh Formations act as “kitchens” for gas generation, with all migration pathways converging in these formations. Notably, the concentration of gas pockets is higher in these stratigraphical microstructures, making them particularly conducive to gas conservation.
The Pabdeh Formation (Tertiary) and Kazhdumi Formation (Lower Cretaceous) in the Abadan Plain present intriguing insights into organic geochemistry. The Pabdeh Formation is characterized by an average Total Organic Carbon (TOC) of 1.25% and a Hydrogen Index (HI) of 145 gTOC/mgHC, categorizing it as average in terms of organic richness. Maturity assessments, indicated by parameters such as Tmax and Vitrinite Reflectance (VR), show that the Pabdeh Formation has a Tmax of approximately 430°C and a VR ranging between 0.4 and 0.5, with a peak VRo of 0.7% across the region. This suggests that the Pabdeh Formation is at least in the early stages of the oil window, indicating its potential to produce both gas and gas condensates, especially given the relevant data obtained from drilling fluids.
Further evaluation using the Pixler criteria suggests that the Asmari Formation holds promise for gas production; in contrast, the Aghajari and Gachsaran formations either lack this capacity or have minimal potential. Notably, both the Pabdeh and Gurpi formations exhibit the capability to produce liquid hydrocarbons in addition to gas.
Analysis of gas composition changes throughout the stratigraphic layers reveals that lithology significantly influences gas preservation. For instance, the upper section of the Aghajari Formation, particularly the shaly-evaporitic horizons, contains a much higher concentration of gas components compared to its lower section. The Gachsaran Formation, especially in its anhydrite layers, also shows increased gas concentrations. Although the Asmari Formation has a high overall gas component ratio, its distribution is uneven: shaly marl horizons exhibit lower gas concentrations compared to sandstone horizons, while the upper sandstone sections yield higher concentrations. Notably, the Pabdeh Formation and the upper part of the Gurpi Formation show significant increases in gas components. This indicates that as depth increases, the effect of depth diminishes on gas concentrations.
The model proposed indicates that microstructures, particularly hunchback forms, may serve as structural regulators for shallow gas pockets in the area of investigation. The influence of evaporitic and shaly layers may slightly alter the positioning of these gas pockets; however, their concentrations appear to align with the underlying microstructures, suggesting they are favorable locations for gas retention. The three-dimensional model further illustrates that gas migration is occurring from the Gurpi Formation to the Aghajari Formation. Vertical migration patterns indicate that both the Pabdeh and upper Gurpi formations contribute to gas production. In this context, the Gurpi Formation functions as a source kitchen in one section, while the Pabdeh Formation acts in two sections, with all migration pathways converging at these formations. Therefore, it is plausible that both the Pabdeh and Gurpi formations have a partial capability to generate gas and gas condensates.
5 Conclusion
This study emphasizes the critical role of effective reservoir management, particularly in the context of shallow gas exploration in the Azadegan oil field. Through comprehensive analysis, we have highlighted the variations in hydrocarbon compositions across different formations, showcasing the significance of light gas ratios and heavy gas indicators in understanding fluid dynamics. The investigation revealed a marked increase in gas production potential in the Asmari formation, supported by the C1 ratios, while the Wh, Bh, and Ch indices in the Aghajari and Gachsaran formations suggest the presence of heavy oil and residual oil with limited production potential. Moreover, the application of Pixler criteria underscores the Asmari formation’s substantial promise for gas production, with the Pabdeh and Gurpi formations demonstrating potential for both gas and liquid hydrocarbons. The findings also indicate that lithological variations play a pivotal role in the preservation of gas components, with stratigraphic analysis revealing concentration fluctuations that align with specific geological structures. Our structural model highlights the influence of microstructures, particularly hunchback formations, as key regulators for the localization of shallow gas pockets. The upward migration patterns from the Gurpi to the Aghajari formation further illustrate the dynamic processes at play in gas production, emphasizing the importance of geological mapping in optimizing drilling operations. These insights not only provide a foundation for risk mitigation strategies in shallow gas zones but also have broader implications for enhancing drilling efficiency and resource management, paving the way for more effective exploration practices in hydrocarbon-rich regions.
Data availability statement
The data analyzed in this study is subject to the following licenses/restrictions: After publishing the article, the corresponding author will share data with academic requests. Requests to access these datasets should be directed to Hamzeh Ghorbani; aGFtemVoZ2hvcmJhbmk2OEB5YWhvby5jb20=.
Author contributions
OH: Conceptualization, Formal Analysis, Methodology, Project administration, Resources, Software, Writing–original draft, Writing–review and editing, Funding acquisition. MR: Conceptualization, Formal Analysis, Methodology, Resources, Software, Writing–original draft, Writing–review and editing. SE: Conceptualization, Formal Analysis, Methodology, Resources, Software, Writing–original draft, Writing–review and editing, Project administration. HG: Conceptualization, Formal Analysis, Methodology, Project administration, Resources, Software, Writing–original draft, Writing–review and editing, Data curation, Investigation, Supervision, Visualization. BS: Conceptualization, Formal Analysis, Funding acquisition, Methodology, Project administration, Resources, Software, Writing–original draft, Writing–review and editing. RG: Conceptualization, Formal Analysis, Funding acquisition, Methodology, Project administration, Resources, Software, Writing–original draft, Writing–review and editing.
Funding
The author(s) declare that no financial support was received for the research, authorship, and/or publication of this article.
Conflict of interest
The authors declare that the research was conducted in the absence of any commercial or financial relationships that could be construed as a potential conflict of interest.
Publisher’s note
All claims expressed in this article are solely those of the authors and do not necessarily represent those of their affiliated organizations, or those of the publisher, the editors and the reviewers. Any product that may be evaluated in this article, or claim that may be made by its manufacturer, is not guaranteed or endorsed by the publisher.
Abbreviations
AOV, angle of offset versus; MEM, Earth Mechanical Modeling; UGC, Underground Contours; QC, Quality Control; GOC, Gas-Oil Contact; OWC, Oil-Water Contact.
References
Ashena, R., Elmgerbi, A., Rasouli, V., Ghalambor, A., Rabiei, M., and Bahrami, A. (2020). Severe wellbore instability in a complex lithology formation necessitating casing while drilling and continuous circulation system. J. Petroleum Explor. Prod. Technol. 10, 1511–1532. doi:10.1007/s13202-020-00834-3
Baouche, R., Sen, S., Sadaoui, M., Boutaleb, K., and Ganguli, S. S. (2020). Characterization of pore pressure, fracture pressure, shear failure and its implications for drilling, wellbore stability and completion design–a case study from the Takouazet field, Illizi Basin, Algeria. Mar. Petroleum Geol. 120, 104510. doi:10.1016/j.marpetgeo.2020.104510
Bordenave, M. L., and Hegre, J. A. (2005). The influence of tectonics on the entrapment of oil in the Dezful Embayment, Zagros Foldbelt, Iran. J. petroleum Geol. 28 (4), 339–368. doi:10.1111/j.1747-5457.2005.tb00087.x
Cathles, L. M., Su, Z., and Chen, D. (2010). The physics of gas chimney and pockmark formation, with implications for assessment of seafloor hazards and gas sequestration. Mar. petroleum Geol. 27 (1), 82–91. doi:10.1016/j.marpetgeo.2009.09.010
Deville, J. P. (2022). “Drilling fluids,” in Fluid chemistry, drilling and completion (Elsevier), 115–185.
Dolson, J., He, Z., and Horn, B. W. (2018). Advances and perspectives on stratigraphic trap exploration-making the subtle trap obvious. Search Discov., 60054.
Du, Y., Chen, J., Cui, Y., Xin, J., Wang, J., Li, Y. Z., et al. (2016). Genetic mechanism and development of the unsteady Sarvak play of the Azadegan oil field, southwest of Iran. Petroleum Sci. 13, 34–51. doi:10.1007/s12182-016-0077-6
Fard, I. A., Braathen, A., Mokhtari, M., and Alavi, S. A. (2006). Interaction of the Zagros fold–thrust belt and the arabian-type, deep-seated folds in the Abadan Plain and the dezful embayment, SW Iran. Pet. Geosci. 12 (4), 347–362. doi:10.1144/1354-079305-706
Girona, T., Caudron, C., and Huber, C. (2019). Origin of shallow volcanic tremor: the dynamics of gas pockets trapped beneath thin permeable media. J. Geophys. Res. Solid Earth 124 (5), 4831–4861. doi:10.1029/2019jb017482
Haidari, K., et al. (2020). Distribution pattern of Ahwaz sandstone and Kalhur evaporite members of Asmari Formation in Dezful Embayment and Abadan plain, a basis for stratigraphic traps studies. Geopersia 10 (1), 53–63.
Hassanpouryouzband, A., Wilkinson, M., and Haszeldine, R. S. (2024). Hydrogen energy futures–foraging or farming? Chem. Soc. Rev. 53, 2258–2263. doi:10.1039/d3cs00723e
Holdaway, K. R., and Irving, D. H. B. (2017). Enhance oil and gas exploration with data-driven geophysical and petrophysical models. Hoboken: John Wiley and Sons.
Hu, H., Li, Y., Yao, Q., Li, X., Huang, G., Li, K., et al. (2024). A prediction approach based on clustering reconstruction for abnormal mining pressure of longwall face under residual coal pillars. Processes 12 (2), 283. doi:10.3390/pr12020283
Karimi, M., et al. (2011). A review of casing drilling advantages to reduce lost circulation, improve wellbore stability, augment wellbore strengthening, and mitigate drilling-induced formation damage. SPE.
Kim, Y.-J., Cheong, S., Chun, J. H., Cukur, D., Kim, S. P., Kim, J. K., et al. (2020). Identification of shallow gas by seismic data and AVO processing: example from the southwestern continental shelf of the Ulleung Basin, East Sea, Korea. Mar. Petroleum Geol. 117, 104346. doi:10.1016/j.marpetgeo.2020.104346
Landrø, M., Wehner, D., Vedvik, N., Ringrose, P., Løhre, N. L., and Berteussen, K. (2019). Gas flow through shallow sediments—a case study using passive and active seismic field data. Int. J. Greenh. Gas Control 87, 121–133. doi:10.1016/j.ijggc.2019.05.001
Lang, J., Li, S., and Zhang, J. (2011). Wellbore stability modeling and real-time surveillance for deepwater drilling to weak bedding planes and depleted reservoirs. SPE.
Leifer, I., and MacDonald, I. (2003). Dynamics of the gas flux from shallow gas hydrate deposits: interaction between oily hydrate bubbles and the oceanic environment. Earth Planet. Sci. Lett. 210 (3-4), 411–424. doi:10.1016/s0012-821x(03)00173-0
Long, Y., Yang, J., Yin, Q., Fu, C., Zhao, Y., Xue, Q., et al. (2023). Numerical simulation study on the mechanism of releasing ultra-deep water shallow gas by drilling pilot holes. Geoenergy Sci. Eng. 221, 111294. doi:10.1016/j.petrol.2022.111294
Nikrouz, R., Siabeghodsi, A., and Hassanalizade, P., Detection of stratigraphic trap of sarvak formation using petrophysical logs and seismic attributes in one of the oil fields in the south west of Iran. 2017.
Peng, N., Chen, P., and Liu, Y. (2021). Pore pressure evaluation of formation testing while drilling under supercharged conditions. J. Petroleum Sci. Eng. 203, 108689. doi:10.1016/j.petrol.2021.108689
Ponomareva, I. N., Martyushev, D. A., and Govindarajan, S. K. (2022). A new approach to predict the formation pressure using multiple regression analysis: case study from Sukharev oil field reservoir–Russia. J. King Saud University-Engineering Sci.
Radwan, A. E. (2021). Modeling pore pressure and fracture pressure using integrated well logging, drilling based interpretations and reservoir data in the Giant El Morgan oil Field, Gulf of Suez, Egypt. J. Afr. Earth Sci. 178, 104165. doi:10.1016/j.jafrearsci.2021.104165
Rashid, M., Luo, M., Ashraf, U., Hussain, W., Ali, N., Rahman, N., et al. (2022). Reservoir quality prediction of gas-bearing carbonate sediments in the Qadirpur field: insights from advanced machine learning approaches of SOM and cluster analysis. Minerals 13 (1), 29. doi:10.3390/min13010029
Schout, G., Hartog, N., Hassanizadeh, S. M., and Griffioen, J. (2018). Impact of an historic underground gas well blowout on the current methane chemistry in a shallow groundwater system. Proc. Natl. Acad. Sci. 115 (2), 296–301. doi:10.1073/pnas.1711472115
Soleimani, M. (2013). Simulation of petroleum exploration based on a conceptual decision model: taking the Dezful Embayment in southwestern Iran as an example. Petroleum Explor. Dev. 40 (4), 476–480. doi:10.1016/s1876-3804(13)60060-9
Yan, C., Ren, X., Cheng, Y., Song, B., Li, Y., and Tian, W. (2020). Geomechanical issues in the exploitation of natural gas hydrate. Gondwana Res. 81, 403–422. doi:10.1016/j.gr.2019.11.014
Zaei, M. E., Rao, K. S., and Ansari, A. (2024). Reservoir basin characterization using one-dimensional (1D) mechanical earth modeling (MEM) for wellbore stability (WBS) analysis. Model. Earth Syst. Environ. 10 (2), 2593–2610. doi:10.1007/s40808-023-01923-y
Zhang, L., He, X., Li, X., Li, K., He, J., Zhang, Z., et al. (2022). Shale gas exploration and development in the Sichuan Basin: progress, challenge and countermeasures. Nat. Gas. Ind. B 9 (2), 176–186. doi:10.1016/j.ngib.2021.08.024
Keywords: hydrocarbon gas reservoirs, drilling fluid analysis, risk assessment, stratigraphic analysis, lithological influence, gas pockets
Citation: Hazbeh O, Rajabi M, Esmaeili Korani S, Ghorbani H, Soleimani B and Gajbhiye R (2024) Risk assessment of abnormal pressure zones with a focus on shallow gas pockets based on surface gas logging data and statistical relationships. Front. Mater. 11:1441357. doi: 10.3389/fmats.2024.1441357
Received: 30 May 2024; Accepted: 05 November 2024;
Published: 15 November 2024.
Edited by:
Deepanraj B, Prince Mohammad bin Fahd University, Saudi ArabiaCopyright © 2024 Hazbeh, Rajabi, Esmaeili Korani, Ghorbani, Soleimani and Gajbhiye. This is an open-access article distributed under the terms of the Creative Commons Attribution License (CC BY). The use, distribution or reproduction in other forums is permitted, provided the original author(s) and the copyright owner(s) are credited and that the original publication in this journal is cited, in accordance with accepted academic practice. No use, distribution or reproduction is permitted which does not comply with these terms.
*Correspondence: Hamzeh Ghorbani, aGFtemVoZ2hvcmJhbmk2OEB5YWhvby5jb20=
†ORCID: Hamzeh Ghorbani, orcid.org/0000-0003-4657-8249
 Omid Hazbeh
 Meysam Rajabi
 Sahar Esmaeili Korani3
 Hamzeh Ghorbani