 Anju Chandran
 Archa Santhosh
 Claudio Pistidda
 Paul Jerabek
 Roland C. Aydin
 Christian J. Cyron1,3
- 1Institute of Material Systems Modeling, Helmholtz-Zentrum Hereon, Geesthacht, Germany
- 2Institute of Hydrogen Technology, Helmholtz-Zentrum Hereon, Geesthacht, Germany
- 3Institute for Continuum and Material Mechanics, Hamburg University of Technology, Hamburg, Germany
Intermetallic titanium aluminides, leveraging the ordered
1 Introduction
Gamma titanium aluminide (
Generally, MD simulations offer profound insights into the behavior of atomic systems, ranging in scale from around 103–109 atoms. These simulations are instrumental in capturing a wide array of interactions, including thermal, mechanical, chemical, and microstructural dynamics. However, the accuracy of MD simulations is contingent upon the selection of appropriate interatomic potentials or force fields, as well as the boundary conditions implemented. In recent years, the integration of machine learning with MD simulations has emerged as a rapidly evolving field. This integration primarily focuses on the modeling of interatomic potential energy surfaces (PES) using reference data derived from ab initio simulations. Various ML methodologies have made significant contributions to the study of condensed matter systems and can be broadly categorized into linear regression [e.g., moment tensor potentials (Shapeev, 2016; Podryabinkin and Shapeev, 2017; Gubaev et al., 2019)], kernel methods [e.g., gaussian approximation potential (Bartók et al., 2013; Szlachta et al., 2014; Dragoni et al., 2018), spectral neighbor analysis (Thompson et al., 2015; Chen et al., 2017; Li et al., 2018; Deng et al., 2019)], and deep neural network-based techniques (Behler and Parrinello, 2007; Behler, 2011; Zhang et al., 2018a), respectively.
Recent comparative studies have evaluated the effectiveness of these diverse techniques, as seen in the works of Zuo et al. (2020); Deringer et al. (2019); Unke et al. (2020, 2021). Among these, deep neural network-based potentials, particularly the deep potential (DP) and neural network potential (NNP), stand out due to their successes in modeling both ordered and disordered systems. The flexibility of the descriptor proposed by Zhang et al. (2018a) for DP potentials is particularly noteworthy. The DP method has demonstrated its efficacy in various systems, such as LiF and FLiBe (Rodriguez et al., 2021), MgCl2-NaCl and MgCl2-KCl (Xu et al., 2023), AlN (Li et al., 2024), Cu (Du et al., 2022) and several others (Niu et al., 2020; Nguyen et al., 2022). In comparison, the moment tensor potential (MTP) is notable for its efficiency, derived from a polynomial basis of interatomic distances and angles. MTP not only outpaces the other methods in terms of speed but has also demonstrated equivalent accuracy in modeling various material systems, as shown in studies by Novikov et al. (2018); Podryabinkin et al. (2019); Novoselov et al. (2019). MTP has been recognized for its optimal balance between accuracy and computational efficiency, a comparison elucidated in Zuo et al. (2020) performance analysis. Tasnádi et al. (2021) developed an MTP potential for efficiently predicting the elastic properties of Ti0.5Al0.5N. Furthermore, the work by Lu et al. (2023) deserves attention, where the authors generated a DeePMD potential for TiAlNb. They assert that this potential successfully validates the bulk material properties of TiAl-based alloys and provides accurate evaluations of the stacking fault energy and tensile properties of
In this paper, we initially create essential datasets for training TiAlNb-based interatomic potentials using ab initio molecular dynamics (AIMD) simulations. These datasets (TiAlNb datasets) are intended to serve as a benchmark for evaluating TiAlNb-based interatomic potentials. Utilizing them, we train the TiAlNb interatomic potentials using both MTP and DP methods. Subsequently, we conduct a comparative evaluation of these potentials through error analysis and performance metrics, in addition to calculating material properties such as elastic constants, equilibrium volume, and lattice constants. We further compute finite temperature properties, including specific heat capacity and thermal expansion. Furthermore, we assess the mechanical properties by performing simulated uniaxial tension tests and calculations of generalized stacking fault energy.
2 Materials and methods
2.1 Dataset generation
We performed a large number of AIMD simulations with the Vienna ab initio simulation package (VASP) Kresse and Furthmüller (1996a); Kresse and Furthmüller (1996b). These simulations employed projector augmented wave (PAW) Blöchl, (1994) method to intricately model the interactions between electrons and ions. We incorporated the generalized gradient approximation (GGA) (Perdew et al., 1996, Perdew et al., 1997) for addressing exchange and correlation effects, specifically using the Perdew–Burke–Ernzerhof (PBE) functional. Our computational framework was rigorously set up with a significant cut-off energy of 510 eV, which was crucial for ensuring the accuracy and precision of our calculations. Furthermore, a
For the development of the interatomic potential, we curated a comprehensive dataset encompassing a wide spectrum of Nb concentrations in
Subsequent AIMD simulations were conducted with meticulous care across all these structures, using the NVT and NPT ensemble over a period of nearly 10 ps. To comprehensively analyze thermal behaviors, these simulations spanned a range of temperatures including 1 K, 300 K, 500 K, 700 K, and 900 K. In the NVT ensemble, particular attention was given to selecting frames post-equilibration for analysis. The snapshots derived from these AIMD simulations provided a rich and diverse data source for training both MTP and DeepMD potentials. The snapshots were partitioned in an 80:20 ratio between the training and test sets to optimize the learning process. More details of the training database are provided in the Supplementary Material, in Section 1.
The TiAlNb dataset developed for this research is now available for public access. It includes the initial structural files in VASP format, essential for generating AIMD frames, alongside the training and validation datasets for DeePMD, and the training and testing datasets for MTP. Additionally, input files necessary for model training are provided, ensuring that users can replicate the results. Access to the dataset is facilitated through the link: TiAlNb dataset offering comprehensive resources for further exploration and validation.
For training the DeePMD potential, we utilized the DeePMD kit (Wang et al., 2018) along with its corresponding library designed for integration with the LAMMPS package (Thompson et al., 2022) for executing MD simulations. Similarly, the training of the MTP potential was conducted using the MLIP package (Novikov et al., 2021), employing its library specifically developed for compatibility with the LAMMPS package (Thompson et al., 2022) to facilitate MD simulations.
2.2 MTP
MTP is a type of machine learning-developed interatomic potential, implemented using the MLIP package (Novikov et al., 2021). In MTP, the energy of each atomic configuration (denoted as
where each contribution
In the above equation, the set of parameters
where
where {
The basis functions
These coefficients have been found to be optimal for many datasets Gubaev et al. (2019). The basis functions
The MTP parameters
where the training set contains configurations
2.3 DeePMD
The DP method used in this study was developed using DeePMD kit (Wang et al., 2018). In DeePMD, the total energy of the system is represented as sum of energies of all the atoms. Suppose a system contains
Each atomic energy
where
where
where
where
2.4 Potential training
2.4.1 MTP
Our investigation commenced with an analysis of the convergence of the MTP towards density functional theory (DFT) energy and force metrics. A key aspect of this study involved conducting a grid search to optimize the MTP parameters. This search varied the potential levels from 6 to 24 and the rcut values from 5
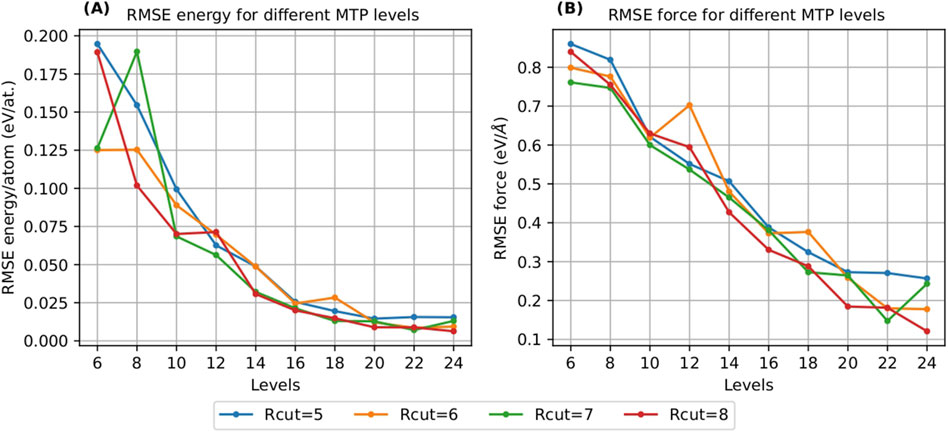
Figure 1. Convergence of MTP with respect to RMSE energy/atom (A) and RMSE force (B) with increasing MTP levels and cut-off radius (Rcut).
The convergence analysis revealed that the energy per atom began showing signs of convergence at level 16. This was a key observation, indicating that the MTP was effectively capturing the energy characteristics consistent with DFT calculations from this level. Similarly, the force values also demonstrated significantly low root mean square error (RMSE) commencing at the same level, further affirming the reliability of the potential from level 16 onwards.
Given these findings, and to ensure a conservative and robust approach, we ultimately selected level 18, for the final model. This level was deemed to provide an optimal balance between complexity and accuracy. Additionally, rcut was set to 7
For the MTP’s training objective function, weights were thoughtfully assigned as follows:
2.4.2 DeePMD
In our study, the DeePOT-SE model, as implemented in the DeePMD-kit package, was employed. The cut-off radius for the model was set to 6
The model’s architecture included radial and angular embedded-atom neural networks, each featuring three hidden layers. These layers were composed of 10, 20, and 40 nodes, respectively, providing a robust framework for capturing the complex interatomic interactions. Additionally, the fitting networks were designed with three hidden layers, each containing 100 nodes.
Regarding the training parameters, the initial learning rate was set at 0.001, gradually decreasing to a final rate of
It is noteworthy that virial data was not included in the training process. This decision was made to streamline the training and focus on the most critical aspects of the potential. The training was conducted over a substantial number of epochs, totaling 2,00,0000, to ensure comprehensive learning and optimization of the model parameters. The utilized dataset comprised 3,33,340 frames, divided into a training and validation set following an 80:20 ratio, facilitating effective model training and validation.
3 Results and discussion
3.1 Error analysis
The correlation between predictions from ML models and DFT calculations is pivotal in ascertaining the models’ accuracy, particularly in simulating potential energy surfaces and material dynamics. Our study methodically evaluates this correlation for Nb-alloyed

Figure 2. Parity plots of MTP predicted energy per atom (A), x-component of force (B), y-component of force (C) and z-component of force (D) against the corresponding DFT values.
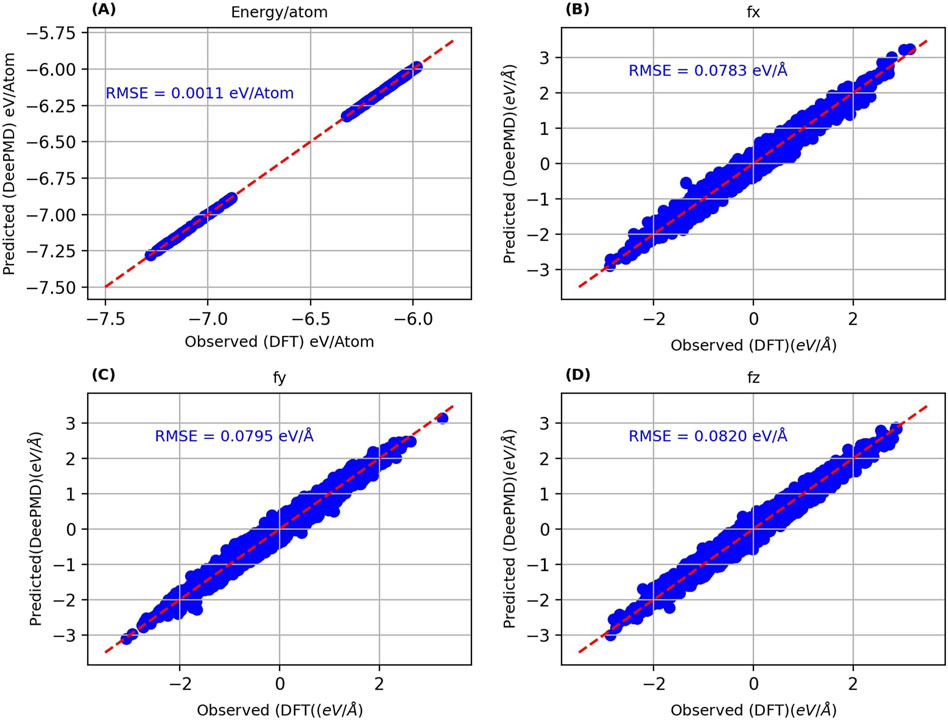
Figure 3. Parity plots of DeePMD predicted energy per atom (A), x-component of force (B), y-component of force (C) and z-component of force (D) against the corresponding DFT values.
The primary metrics for this comparison are energy per atom and the three components of force. For the MTP model, the recorded root mean square errors (RMSEs) are 0.0031 eV/atom for energy and 0.1285 eV/Å for the x-direction force (fx), 0.1329 eV/Å for the y-direction force (fy), and 0.1292 eV/Å for the z-direction force (fz). Conversely, the DP model exhibits RMSEs of 0.0011 eV/atom for energy, 0.0783 eV/Å for fx, 0.0795 eV/Å for fy, and 0.0820 eV/Å for fz. The DP model’s RMSEs are notably lower than those of the MTP model, suggesting a marginally superior precision. Nevertheless, the energy and force RMSEs for both models are within acceptable ranges, confirming their effectiveness in reflecting DFT outcomes. Additionally, the RMSEs for energy per atom, fy, fy, and fz were computed for the training datasets and are presented in Table 1.
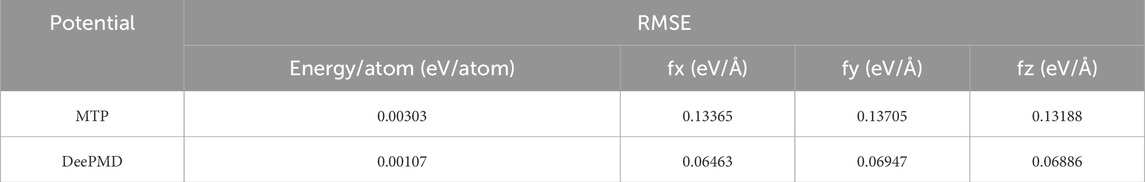
Table 1. Comparison of RMSE values of energy/atom, fx, fy, and fz for MTP and DeePMD using training data.
Both models’ predictions exhibit a close alignment with the y = x line, highlighting their capacity to accurately reproduce the test dataset energies and atomic forces. This congruence is a robust indicator of the models’ exceptional accuracy, which extends to untrained test data, suggesting their effectiveness in generalizing beyond the configurations they were trained on. The considered test data encompasses structures over a complete temperature range (1 K, 300 K, 500 K, 700 K and 900 K) and varying Nb concentrations (1–14 at.%). The lower RMSEs for both energy and force underscore the DP model’s superior ability to achieve DFT-level accuracy compared to the MTP model. This indicates the potential of the DP model as a more precise tool for simulating the behaviors of Nb-doped
3.2 MD simulations
3.2.1 Energy volume curve
To augment the validity of the DeePMD and MTP potentials, this study meticulously examines the energy-volume relationships obtained using the Murnaghan fit in Nb-alloyed
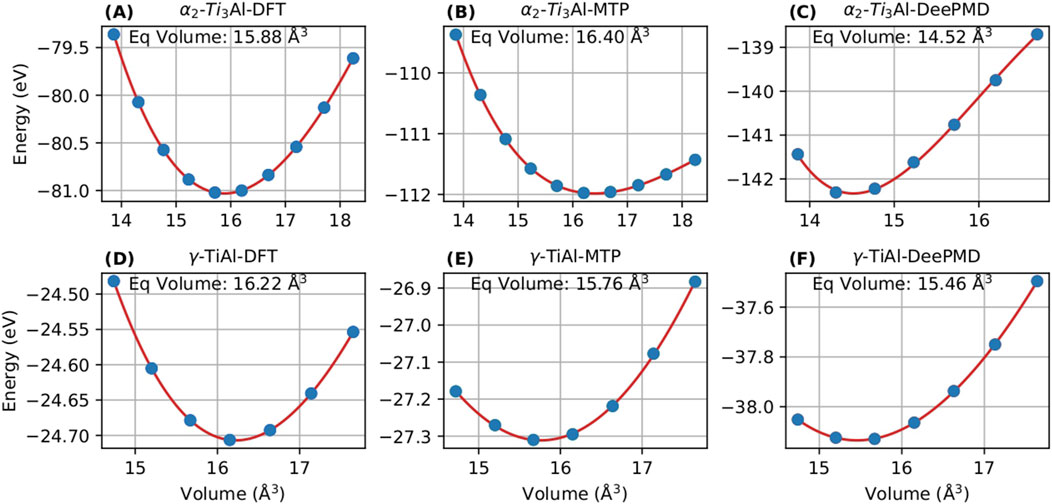
Figure 4. Energy-volume curve of
Table 2 shows the equilibrium volume predicted by DFT, MTP and DeePMD for
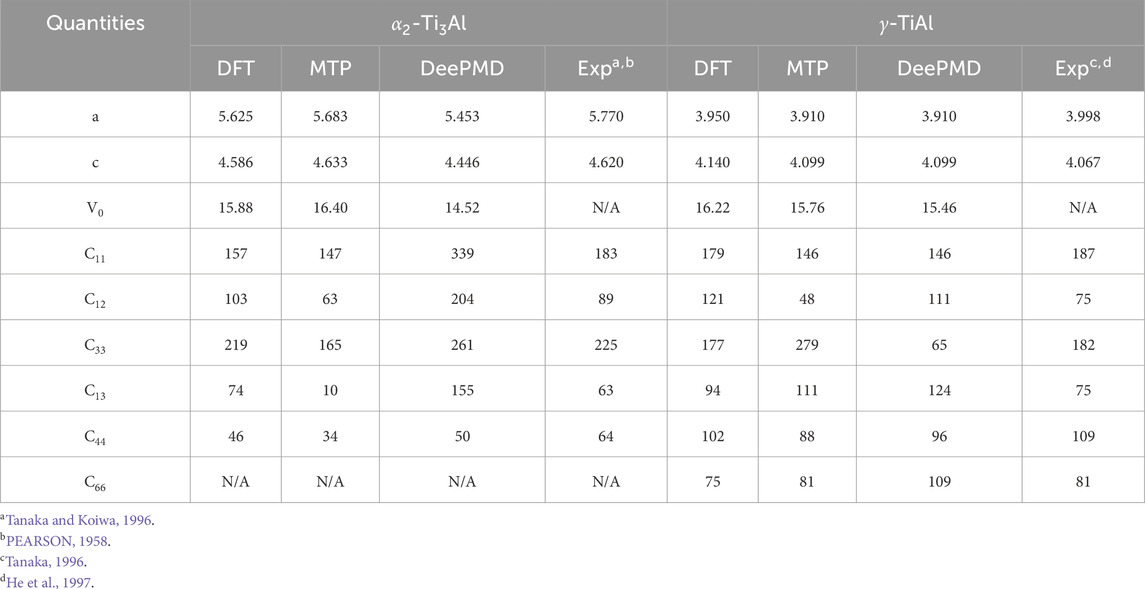
Table 2. Comparison of lattice constants (a, c), equilibrium volume (V0) and elastic constants for
The lattice constants predicted by DFT, MTP and DeePMD for
Accurate energy prediction in competitive phases is vital to avert unphysical phase segregation during MD simulations. Therefore, the integration of machine learning potentials like DeePMD and MTP notably enhances the structural analysis and prediction capabilities in Nb-alloyed
3.2.2 Elastic constants
Next we assessed the elastic constants of
For the
In the analysis of the
Table 3 presents a comparison of the elastic constants for
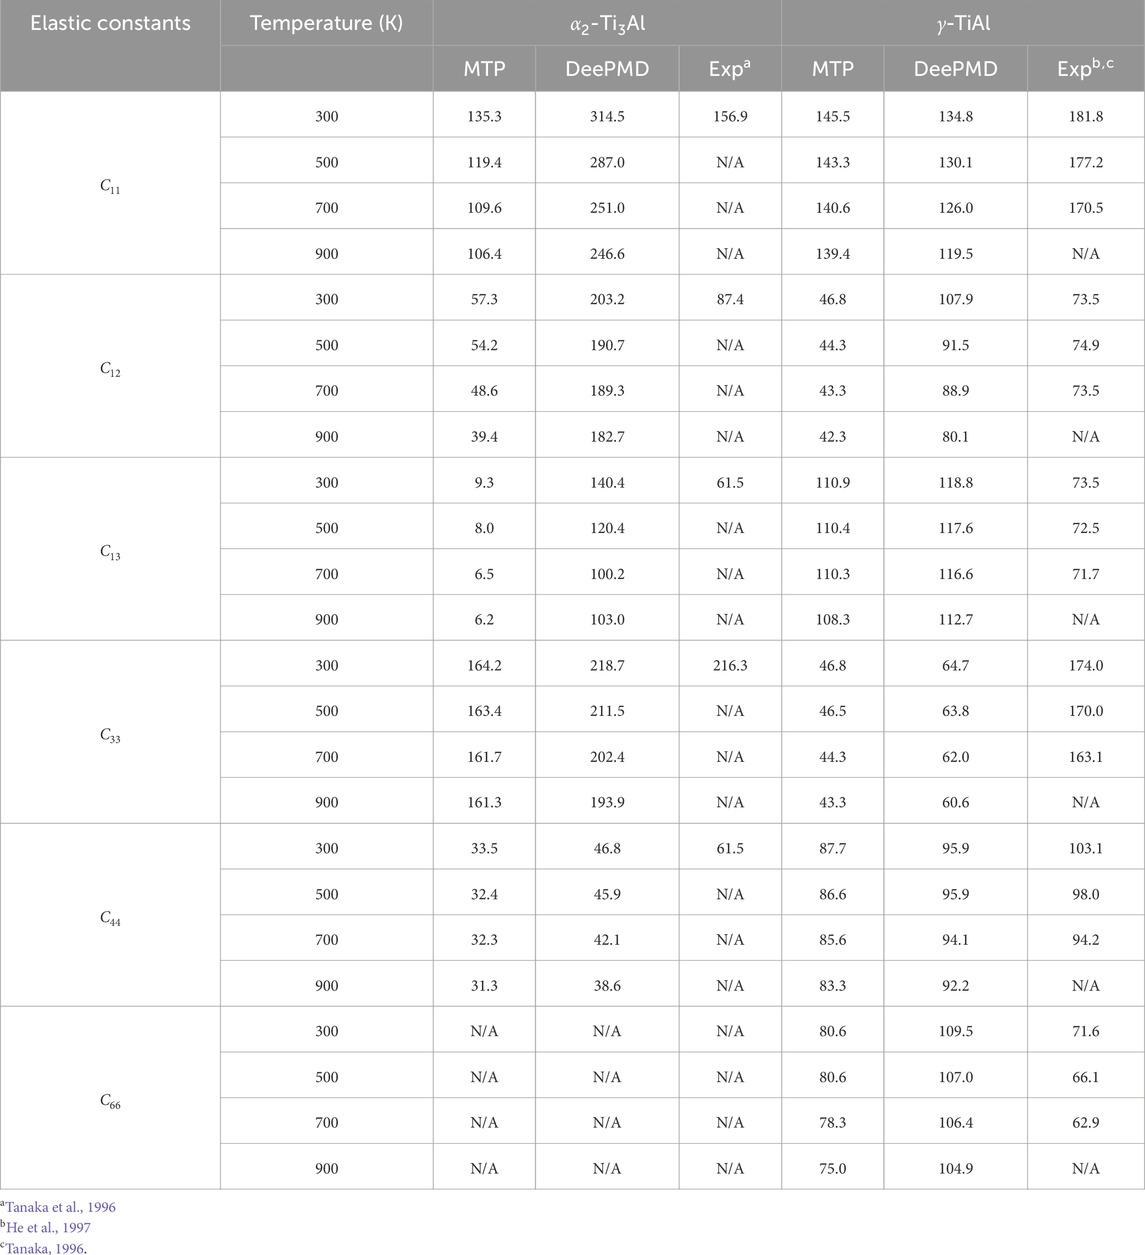
Table 3. Comparison of elastic constants of
The observed disparities in elastic constants among the DFT, MTP, and DeePMD methodologies, relative to experimental data (Tanaka and Koiwa, 1996; Tanaka, 1996), highlight the intricate challenges of accurately simulating material behaviors. These differences can be attributed to the unique features of each approach, including DFT’s detailed electron correlation handling, MTP’s potential function structure, and DeePMD’s reliance on extensive training datasets and neural network designs. Our analysis underscores the critical importance of selecting appropriate computational strategies tailored to specific material characteristics and the need for cautious interpretation of computational findings in materials science. This study reinforces the indispensable role of experimental validation in confirming the veracity of computational predictions.
3.2.3 Radial distribution function
The radial distribution function (RDF) serves as an instrumental tool for analyzing the structural properties of materials. In our study, illustrated in Figures 5, 6, we present a comparative analysis of RDFs predicted by MTP and DeePMD against those obtained from AIMD for Nb in
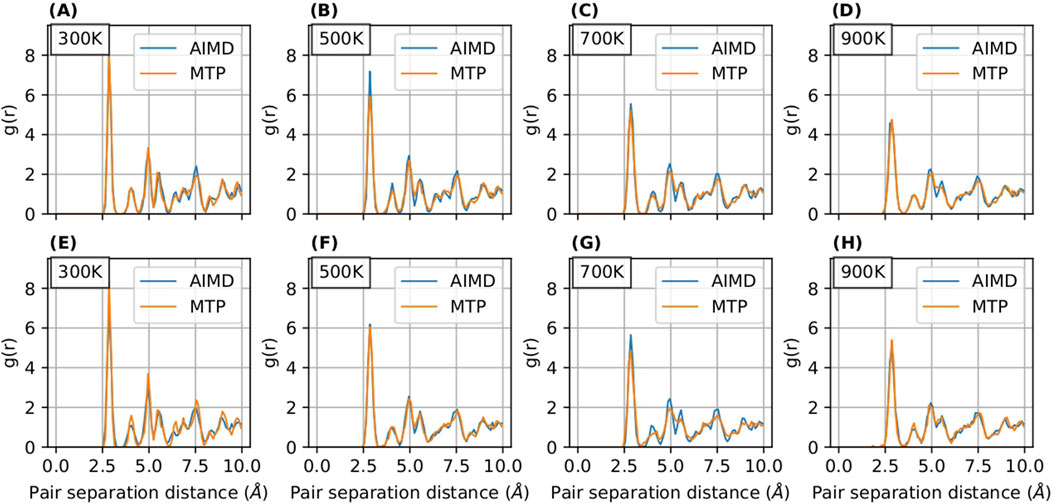
Figure 5. RDF curves for
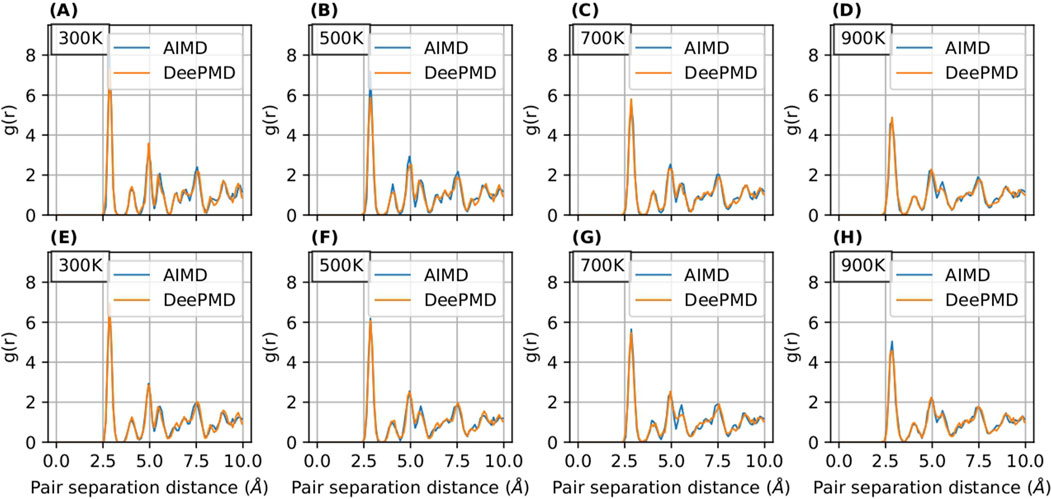
Figure 6. RDF curves for
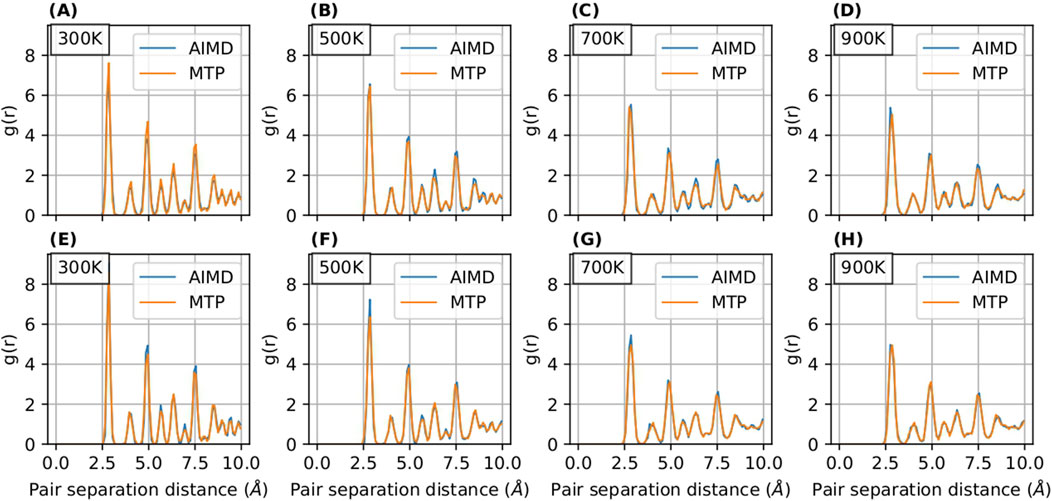
Figure 7. RDF curves for
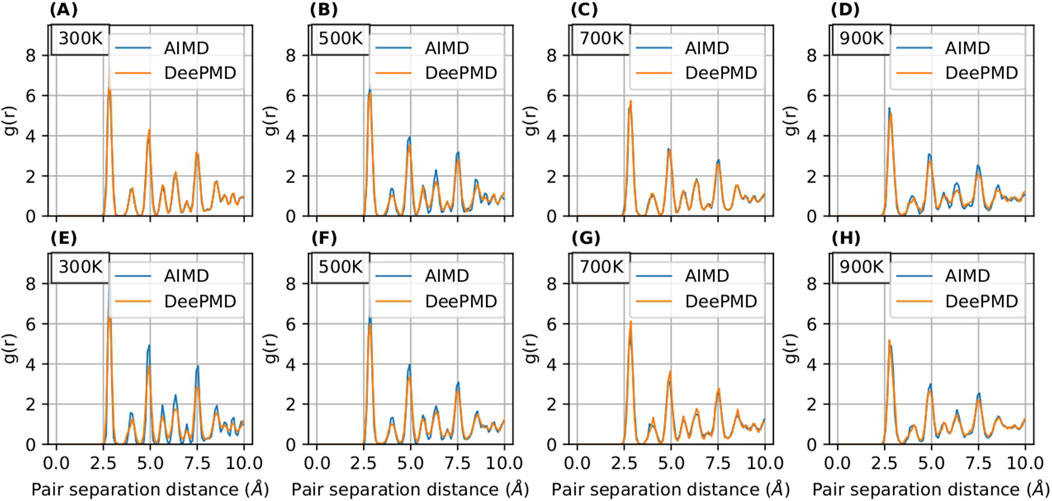
Figure 8. RDF curves for
Notably, the RDFs for
Additionally, we examined the scalability of the developed potentials with system sizes, as detailed in Supplementary Figures S1–S4 in the Supplementary Material in Section 2. For further insights, please refer to this section in the Supplementary Material. Our study also extended to comparing RDFs calculated by DFT, MTP, and DeePMD for a specific case of 14.8 at.% Nb concentration, which exceeds the training data’s Nb concentration range. These results are documented in the Supplementary Material in Section 3, providing valuable perspectives on the models’ performance beyond their initial training scope.
3.2.4 Specific heat capacity and thermal expansion
To assess the predictive capability of trained MTP and DeePMD potentials at finite temperatures, this section reports the computation of specific heat capacity
Figures 9A, B illustrate the comparisons of
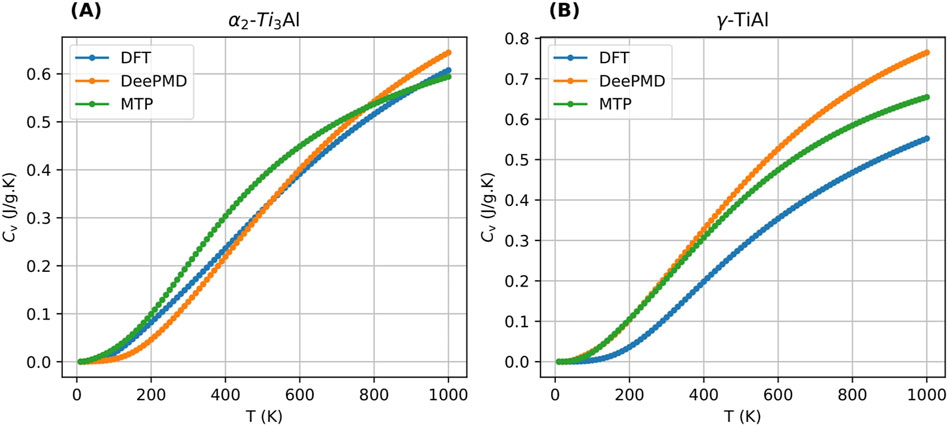
Figure 9. Comparison of specific heat capacity computed using MTP, DeePMD and MTP for 3.1 at.% Nb cases for
In terms of thermal expansion, we computed the coefficients
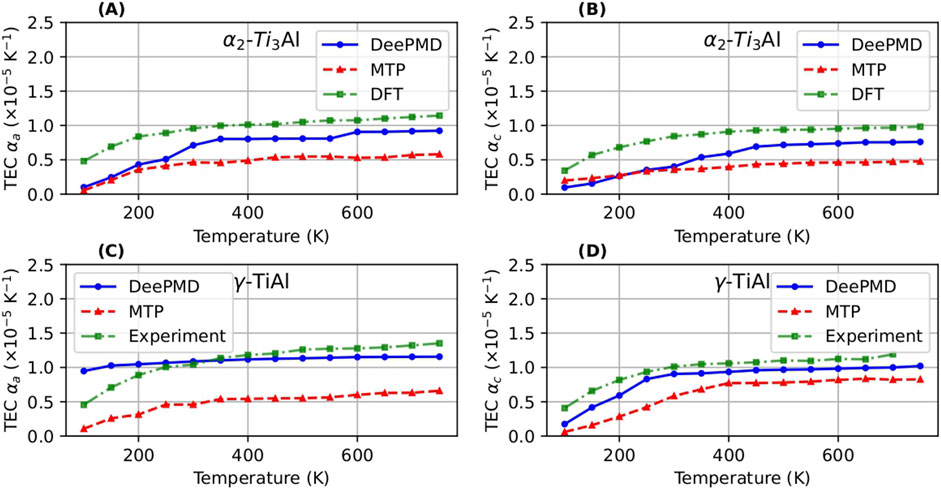
Figure 10. Thermal expansion coefficient (TEC) computed using DeePMD and MTP compared with the DFT values (Holec et al., 2019) and experimental values (He et al., 1997) for
3.2.5 Tension test
Here, we aimed to assess the capabilities of the MTP and DeePMD potentials in capturing the thermo-mechanical characteristics of specific materials. To achieve this, we simulated uniaxial tension tests on chosen samples, applying a strain rate of 109 s−1. The stress-strain curves obtained from these tension tests, utilizing both MTP and DeePMD potentials for the
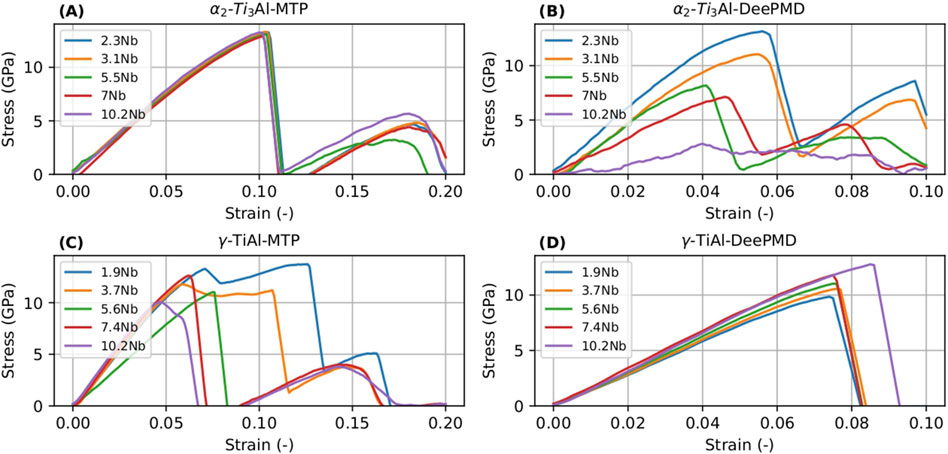
Figure 11. Stress-strain curves for
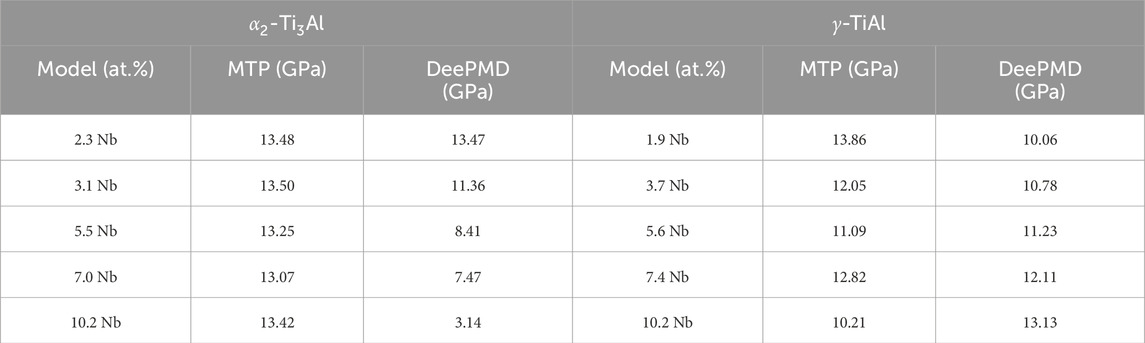
Table 4. Comparison of UTS values for
We focused on comparing the UTS of the intermetallic phases to gauge the accuracy of mechanical property predictions. For the
Further insights into the nanomechanical behavior during uniaxial tension tests in the
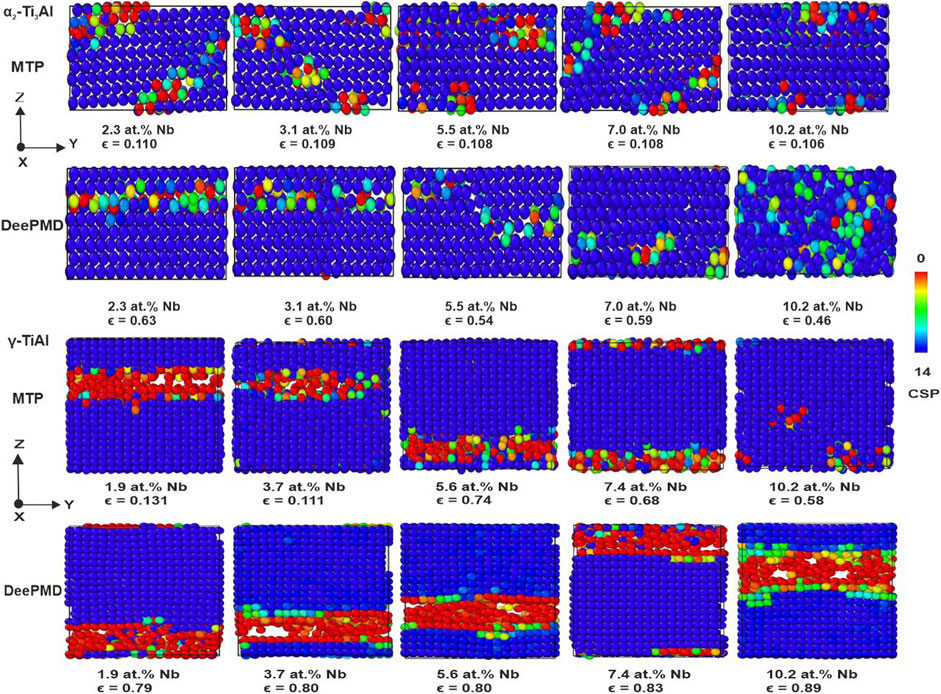
Figure 12.
3.2.6 Generalized stacking fault energy
This section evaluates the generalized stacking fault energy (GSFE) of
For
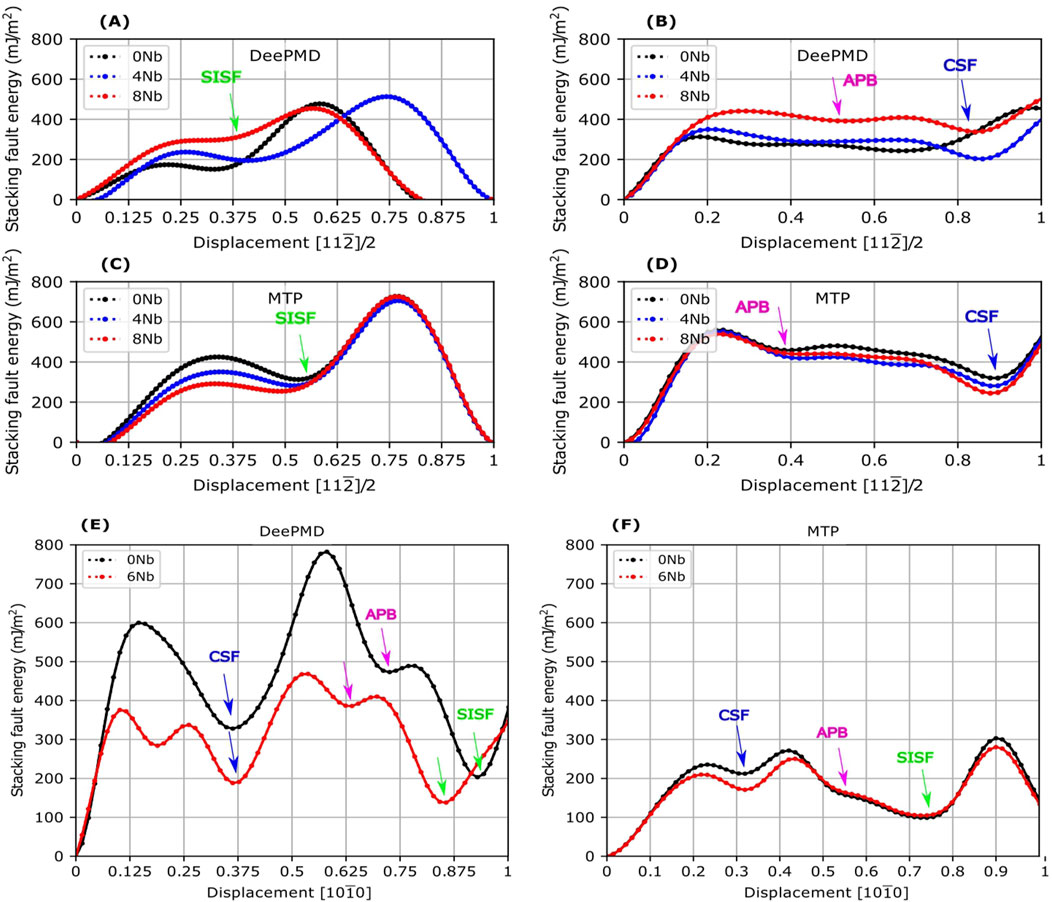
Figure 13. The generalized stacking fault energy (GSFE) on the {111} plane of
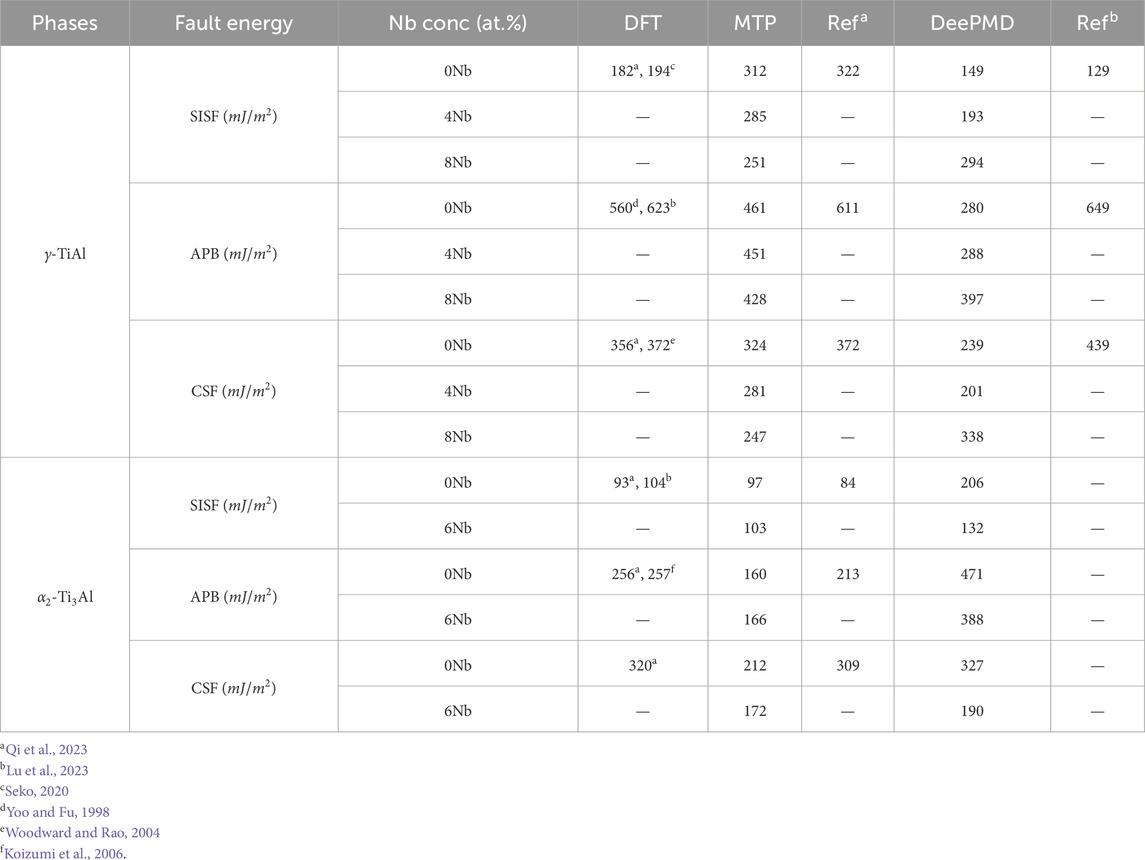
Table 5. Comparison of generalized stacking fault energies values for
Turning to the
We have observed that, except for DeePMD for
3.3 Comparison of performance of MTP and DeePMD
Here, we conducted a thorough assessment of the computational efficiency in MD simulations, focusing on DeePMD and MTP potentials. Figure 14 provides a graphical representation of simulation performance measured in hours per nanosecond (hours/ns) for varying numbers of atoms, specifically 4, 32, 108, 256, 864, 1,372, and 2048, in systems composed of
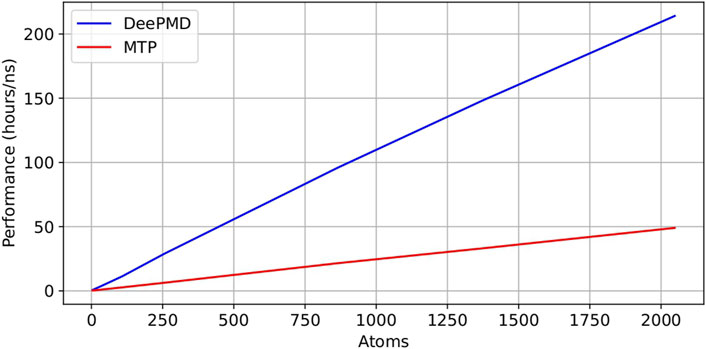
Figure 14. Comparison of performance (hours/ns) of DeePMD and MTP potentials in performing MD simulations.
Our results demonstrate a linear correlation between computational time and atom count for both MTP and DeePMD potentials, highlighting the scalability of each potential with increasing system size. This aspect is crucial for simulations that involve large numbers of atoms. The “hours/ns” performance metric offers crucial insights into the computational demands, quantifying the time needed to complete 1 nanosecond of MD simulation. A significant efficiency disparity is evident from Figure 14, with MTP potential-based simulations exhibiting markedly superior speed compared to those employing DeePMD potential.
For a granular quantitative comparison, Table 6 details the message passing interface (MPI) task timings in an NVT simulation with 108 atoms over a span of 4 picoseconds (ps) for both potentials. Notably, MD simulations (NVT ensemble at 300 K for 4 ps on a system of 108 atoms) with DeePMD potential required 14.978 h/ns, whereas those with MTP potential required only 3.356 h/ns. This finding indicates that the MTP potential is approximately 4.5 times more efficient than the DeePMD potential. Furthermore, Table 6 delineates the time distribution across different simulation processes such as force computation, interprocessor communication, output generation, modifications via fixes, and other related tasks. These tests were carried out on a high-performance computing (HPC) cluster utilizing a single node equipped with 48 processors. This detailed breakdown unequivocally shows that simulations with the DeePMD potential consume more computational time than those with the MTP potential for identical simulation conditions.

Table 6. Comparison of the timing breakdown for MPI tasks in MD simulations using DeePMD versus MTP potentials.
4 Conclusion
In our study, we conducted a comparative analysis of the interatomic potentials for TiAlNb alloys, developed through both MTP and deep learning approaches. We introduced a comprehensive dataset for TiAlNb alloys, aimed at serving as a benchmark for studying the Nb-alloyed phases of
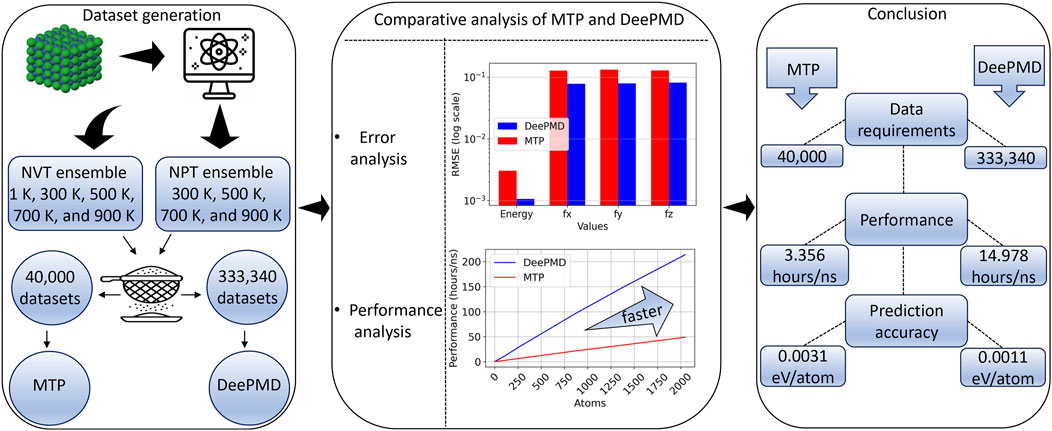
Figure 15. Comparison of MTP and DeePMD methods for interatomic potential generation for TiAlNb alloys.
Our study analyzed material parameters like equilibrium volume, lattice constants, and elastic constants, revealing MTP’s equilibrium volume predictions were closer to DFT results than DeePMD’s for both
During the model training phase, we encountered difficulties in accurately capturing the
Data availability statement
The datasets presented in this study can be found in online repositories. The names of the repository/repositories and accession number(s) can be found below: https://zenodo.org/uploads/10639914.
Author contributions
AC: Conceptualization, Data curation, Formal Analysis, Investigation, Methodology, Software, Visualization, Writing–original draft. AS: Validation, Writing–review and editing. CP: Validation, Writing–review and editing. PJ: Validation, Writing–review and editing. RA: Project administration, Supervision, Validation, Writing–review and editing. CC: Funding acquisition, Project administration, Supervision, Writing–review and editing, Validation.
Funding
The author(s) declare that financial support was received for the research, authorship, and/or publication of this article. The authors gratefully acknowledge funding by the
Acknowledgments
During the preparation of this work the author(s) used ChatGpt (ChatGpt 4o-mini) in order to improve the language and readability of the text. After using this tool/service, the author(s) reviewed and edited the content as needed and take(s) full responsibility for the content of the publication.
Conflict of interest
The authors declare that the research was conducted in the absence of any commercial or financial relationships that could be construed as a potential conflict of interest.
Publisher’s note
All claims expressed in this article are solely those of the authors and do not necessarily represent those of their affiliated organizations, or those of the publisher, the editors and the reviewers. Any product that may be evaluated in this article, or claim that may be made by its manufacturer, is not guaranteed or endorsed by the publisher.
Supplementary material
The Supplementary Material for this article can be found online at: https://www.frontiersin.org/articles/10.3389/fmats.2024.1466793/full#supplementary-material
References
Appel, F., Paul, J. D. H., and Oehring, M. (2011). Gamma titanium aluminide alloys: science and technology. John Wiley and Sons.
Bartók, A. P., Kondor, R., and Csányi, G. (2013). On representing chemical environments. Phys. Rev. B 87, 184115. doi:10.1103/physrevb.87.184115
Becker, C. A., Tavazza, F., Trautt, Z. T., and Buarque de Macedo, R. A. (2013). Considerations for choosing and using force fields and interatomic potentials in materials science and engineering. Curr. Opin. Solid State Mater. Sci. 17, 277–283. doi:10.1016/j.cossms.2013.10.001
Behler, J. (2011). Neural network potential-energy surfaces in chemistry: a tool for large-scale simulations. Phys. Chem. Chem. Phys. 13, 17930. doi:10.1039/c1cp21668f
Behler, J., and Parrinello, M. (2007). Generalized neural-network representation of high-dimensional potential-energy surfaces. Phys. Rev. Lett. 98, 146401. doi:10.1103/physrevlett.98.146401
Blöchl, P. E. (1994). Projector augmented-wave method. Phys. Rev. B 50, 17953–17979. doi:10.1103/physrevb.50.17953
Chandran, A., Ganesan, H., and Cyron, C. J. (2024). Studying the effects of nb on high-temperature deformation in tial alloys using atomistic simulations. Mater. and Des. 237, 112596. doi:10.1016/j.matdes.2023.112596
Chen, C., Deng, Z., Tran, R., Tang, H., Chu, I.-H., and Ong, S. P. (2017). Accurate force field for molybdenum by machine learning large materials data. Phys. Rev. Mater. 1, 043603. doi:10.1103/physrevmaterials.1.043603
Cheng, L., Li, J., Xue, X., Tang, B., Kou, H., and Bouzy, E. (2016). Superplastic deformation mechanisms of high Nb containing TiAl alloy with (α2 + γ) microstructure. Intermetallics 75, 62–71. doi:10.1016/j.intermet.2016.06.003
Clemens, H., and Mayer, S. (2012). Design, processing, microstructure, properties, and applications of advanced intermetallic tial alloys. Adv. Eng. Mater. 15, 191–215. doi:10.1002/adem.201200231
Deng, Z., Chen, C., Li, X.-G., and Ong, S. P. (2019). An electrostatic spectral neighbor analysis potential for lithium nitride. npj Comput. Mater. 5, 75. doi:10.1038/s41524-019-0212-1
Deringer, V. L., Caro, M. A., and Csányi, G. (2019). Machine learning interatomic potentials as emerging tools for materials science. Adv. Mater. 31, e1902765. doi:10.1002/adma.201902765
Dragoni, D., Daff, T. D., Csányi, G., and Marzari, N. (2018). Achieving dft accuracy with a machine-learning interatomic potential: thermomechanics and defects in bcc ferromagnetic iron. Phys. Rev. Mater. 2, 013808. doi:10.1103/physrevmaterials.2.013808
Du, Y., Meng, Z., Yan, Q., Wang, C., Tian, Y., Duan, W., et al. (2022). Deep potential for a face-centered cubic cu system at finite temperatures. Phys. Chem. Chem. Phys. 24, 18361–18369. doi:10.1039/d2cp02758e
Dumitraschkewitz, P., Clemens, H., Mayer, S., and Holec, D. (2017). Impact of alloying on stacking fault energies in γ-tial. Appl. Sci. 7, 1193. doi:10.3390/app7111193
Farkas, D., and Jones, C. (1996). Interatomic potentials for ternary Nb -Ti -Al alloys. Model. Simul. Mater. Sci. Eng. 4 (1), 23. doi:10.1088/0965-0393/4/1/004
Gubaev, K., Podryabinkin, E. V., Hart, G. L., and Shapeev, A. V. (2019). Accelerating high-throughput searches for new alloys with active learning of interatomic potentials. Comput. Mater. Sci. 156, 148–156. doi:10.1016/j.commatsci.2018.09.031
Hale, L. M., Trautt, Z. T., and Becker, C. A. (2018). Evaluating variability with atomistic simulations: the effect of potential and calculation methodology on the modeling of lattice and elastic constants. Model. Simul. Mater. Sci. Eng. 26, 055003. doi:10.1088/1361-651x/aabc05
He, Y., Schwarz, R., Darling, T., Hundley, M., Whang, S., and Wang, Z. (1997). Elastic constants and thermal expansion of single crystal γ-tial from 300 to 750 k. Mater. Sci. Eng. A 239–240, 157–163. doi:10.1016/s0921-5093(97)00575-3
Hirel, P. (2015). Atomsk: a tool for manipulating and converting atomic data files. Comput. Phys. Commun. 197, 212–219. doi:10.1016/j.cpc.2015.07.012
Holec, D., Abdoshahi, N., Mayer, S., and Clemens, H. (2019). Thermal expansion and other thermodynamic properties of α2-ti3al and γ-tial intermetallic phases from first principles methods. Materials 12, 1292. doi:10.3390/ma12081292
Holec, D., Reddy, R. K., Klein, T., and Clemens, H. (2016). Preferential site occupancy of alloying elements in tial-based phases. J. Appl. Phys. 119. doi:10.1063/1.4951009
Klein, T., Clemens, H., and Mayer, S. (2016). Advancement of compositional and microstructural design of intermetallic γ-tial based alloys determined by atom probe tomography. Materials 9, 755. doi:10.3390/ma9090755
Koizumi, Y., Ogata, S., Minamino, Y., and Tsuji, N. (2006). Energies of conservative and non-conservative antiphase boundaries in ti3al: a first principles study. Philos. Mag. 86, 1243–1259. doi:10.1080/14786430500380126
Kresse, G., and Furthmüller, J. (1996a). Efficiency of ab-initio total energy calculations for metals and semiconductors using a plane-wave basis set. Comput. Mater. Sci. 6, 15–50. doi:10.1016/0927-0256(96)00008-0
Kresse, G., and Furthmüller, J. (1996b). Efficient iterative schemes forab initiototal-energy calculations using a plane-wave basis set. Phys. Rev. B 54, 11169–11186. doi:10.1103/physrevb.54.11169
Li, J., Liu, Y., Liu, B., Wang, Y., Zhao, K., and He, Y. (2014). Effect of nb particles on the flow behavior of tial alloy. Intermetallics 46, 22–28. doi:10.1016/j.intermet.2013.10.004
Li, T., Hou, Q., Cui, J.-c., Yang, J.-h., Xu, B., Li, M., et al. (2024). Deep learning interatomic potential for thermal and defect behaviour of aluminum nitride with quantum accuracy. Comput. Mater. Sci. 232, 112656. doi:10.1016/j.commatsci.2023.112656
Li, X.-G., Hu, C., Chen, C., Deng, Z., Luo, J., and Ong, S. P. (2018). Quantum-accurate spectral neighbor analysis potential models for ni-mo binary alloys and fcc metals. Phys. Rev. B 98, 094104. doi:10.1103/physrevb.98.094104
Liu, P., Hou, B., Wang, A., Xie, J., and Wang, Z. (2022). Balancing the strength and ductility of ti2alc/tial composite with a bioinspired micro-nano laminated architecture. Mater. and Des. 220, 110851. doi:10.1016/j.matdes.2022.110851
Liu, Z., Lin, J., Li, S., and Chen, G. (2002). Effects of nb and al on the microstructures and mechanical properties of high nb containing tial base alloys. Intermetallics 10, 653–659. doi:10.1016/s0966-9795(02)00037-7
Lu, J., Wang, J., Wan, K., Chen, Y., Wang, H., and Shi, X. (2023). An accurate interatomic potential for the tialnb ternary alloy developed by deep neural network learning method. J. Chem. Phys. 158, 204702. doi:10.1063/5.0147720
Nguyen, N., Louis, S.-Y. V., Wei, L., Choudhary, K., Hu, M., and Hu, J. (2022). Predicting lattice vibrational frequencies using deep graph neural networks. ACS Omega 7, 26641–26649. doi:10.1021/acsomega.2c02765
Niu, H., Bonati, L., Piaggi, P. M., and Parrinello, M. (2020). Ab initio phase diagram and nucleation of gallium. Nat. Commun. 11, 2654. doi:10.1038/s41467-020-16372-9
Novikov, I. S., Gubaev, K., Podryabinkin, E. V., and Shapeev, A. V. (2021). The mlip package: moment tensor potentials with mpi and active learning. Mach. Learn. Sci. Technol. 2, 025002. doi:10.1088/2632-2153/abc9fe
Novikov, I. S., Suleimanov, Y. V., and Shapeev, A. V. (2018). Automated calculation of thermal rate coefficients using ring polymer molecular dynamics and machine-learning interatomic potentials with active learning. Phys. Chem. Chem. Phys. 20, 29503–29512. doi:10.1039/c8cp06037a
Novoselov, I., Yanilkin, A., Shapeev, A., and Podryabinkin, E. (2019). Moment tensor potentials as a promising tool to study diffusion processes. Comput. Mater. Sci. 164, 46–56. doi:10.1016/j.commatsci.2019.03.049
Ouadah, O., Merad, G., and Abdelkader, H. S. (2021). Atomistic modelling of the γ-tial/α2-ti3al interfacial properties affected by solutes. Mater. Chem. Phys. 257, 123434. doi:10.1016/j.matchemphys.2020.123434
Ouadah, O., Merad, G., Saidi, F., Mendi, S., and Dergal, M. (2020). Influence of alloying transition metals on structural, elastic, electronic and optical behaviors of γ-tial based alloys: a comparative dft study combined with data mining technique. Mater. Chem. Phys. 242, 122455. doi:10.1016/j.matchemphys.2019.122455
Pearson, W. (1958) “A handbook of lattice spacings and structures of metals and alloys,” in International series of monographs on metal Physics and physical metallurgy. Pergamon. doi:10.1016/B978-1-4832-1318-7.50003-6
Perdew, J. P., Burke, K., and Ernzerhof, M. (1996). Generalized gradient approximation made simple. Phys. Rev. Lett. 77, 3865–3868. doi:10.1103/physrevlett.77.3865
Perdew, J. P., Burke, K., and Ernzerhof, M. (1997). Generalized gradient approximation made simple. Phys. Rev. Lett. 78, 1396. doi:10.1103/physrevlett.78.1396
Podryabinkin, E. V., and Shapeev, A. V. (2017). Active learning of linearly parametrized interatomic potentials. Comput. Mater. Sci. 140, 171–180. doi:10.1016/j.commatsci.2017.08.031
Podryabinkin, E. V., Tikhonov, E. V., Shapeev, A. V., and Oganov, A. R. (2019). Accelerating crystal structure prediction by machine-learning interatomic potentials with active learning. Phys. Rev. B 99, 064114. doi:10.1103/physrevb.99.064114
Qi, J., Aitken, Z. H., Pei, Q., Tan, A. M. Z., Zuo, Y., Jhon, M. H., et al. (2023). Machine learning moment tensor potential for modeling dislocation and fracture in l10−TiAl and d019−ti3Al alloys. Phys. Rev. Mater. 7, 103602. doi:10.1103/physrevmaterials.7.103602
Rodriguez, A., Lam, S., and Hu, M. (2021). Thermodynamic and transport properties of lif and flibe molten salts with deep learning potentials. ACS Appl. Mater. and Interfaces 13, 55367–55379. doi:10.1021/acsami.1c17942
Seko, A. (2020). Machine learning potentials for multicomponent systems: the ti-al binary system. Phys. Rev. B 102, 174104. doi:10.1103/physrevb.102.174104
Shapeev, A. V. (2016). Moment tensor potentials: a class of systematically improvable interatomic potentials. Multiscale Model. and Simul. 14, 1153–1173. doi:10.1137/15m1054183
Song, L., Appel, F., Wang, L., Oehring, M., Hu, X., Stark, A., et al. (2020). New insights into high-temperature deformation and phase transformation mechanisms of lamellar structures in high nb-containing tial alloys. Acta Mater. 186, 575–586. doi:10.1016/j.actamat.2020.01.021
Song, Y., Yang, R., Li, D., Hu, Z., and Guo, Z. (2000). A first principles study of the influence of alloying elements on tial: site preference. Intermetallics 8, 563–568. doi:10.1016/s0966-9795(99)00164-8
Szlachta, W. J., Bartók, A. P., and Csányi, G. (2014). Accuracy and transferability of Gaussian approximation potential models for tungsten. Phys. Rev. B 90, 104108. doi:10.1103/physrevb.90.104108
Tanaka, K. (1996). Single-crystal elastic constants of gamma-tial. Philos. Mag. Lett. 73, 71–78. doi:10.1080/095008396181019
Tanaka, K., and Koiwa, M. (1996). Single-crystal elastic constants of intermetallic compounds. Intermetallics 4, S29–S39. doi:10.1016/0966-9795(96)00014-3
Tanaka, K., Okamoto, K., Inui, H., Minonishi, Y., Yamaguchi, M., and Koiwa, M. (1996). Elastic constants and their temperature dependence for the intermetallic compound ti3al. Philos. Mag. A 73, 1475–1488. doi:10.1080/01418619608245145
Tasnádi, F., Bock, F., Tidholm, J., Shapeev, A. V., and Abrikosov, I. A. (2021). Efficient prediction of elastic properties of ti0.5al0.5n at elevated temperature using machine learning interatomic potential. Thin Solid Films 737, 138927. doi:10.1016/j.tsf.2021.138927
Thompson, A., Swiler, L., Trott, C., Foiles, S., and Tucker, G. (2015). Spectral neighbor analysis method for automated generation of quantum-accurate interatomic potentials. J. Comput. Phys. 285, 316–330. doi:10.1016/j.jcp.2014.12.018
Thompson, A. P., Aktulga, H. M., Berger, R., Bolintineanu, D. S., Brown, W. M., Crozier, P. S., et al. (2022). LAMMPS - a flexible simulation tool for particle-based materials modeling at the atomic, meso, and continuum scales. Comput. Phys. Commun. 271, 108171. doi:10.1016/j.cpc.2021.108171
Togo, A. (2023). First-principles phonon calculations with phonopy and phono3py. J. Phys. Soc. Jpn. 92. doi:10.7566/jpsj.92.012001
Togo, A., Chaput, L., Tadano, T., and Tanaka, I. (2023). Implementation strategies in phonopy and phono3py. J. Phys. Condens. Matter 35, 353001. doi:10.1088/1361-648x/acd831
Unke, O. T., Chmiela, S., Sauceda, H. E., Gastegger, M., Poltavsky, I., Schütt, K. T., et al. (2021). Machine learning force fields. Chem. Rev. 121, 10142–10186. doi:10.1021/acs.chemrev.0c01111
Unke, O. T., Koner, D., Patra, S., Käser, S., and Meuwly, M. (2020). High-dimensional potential energy surfaces for molecular simulations: from empiricism to machine learning. Mach. Learn. Sci. Technol. 1, 013001. doi:10.1088/2632-2153/ab5922
Wang, H., Zhang, L., Han, J., and E, W. (2018). Deepmd-kit: a deep learning package for many-body potential energy representation and molecular dynamics. Comput. Phys. Commun. 228, 178–184. doi:10.1016/j.cpc.2018.03.016
Wei, Y., Zhang, Y., Lu, G.-H., and Xu, H. (2012). Effects of transition metals in a binary-phase tial–ti3al alloy: from site occupancy, interfacial energetics to mechanical properties. Intermetallics 31, 105–113. doi:10.1016/j.intermet.2012.06.012
Woodward, C., and Rao, S. I. (2004). Ab-initiosimulation of (a/2)⟨110 screw dislocations in γ-TiAl screw dislocations in γ-tial. Philos. Mag. 84, 401–413. doi:10.1080/14786430310001611626
Xu, T., Li, X., Wang, Y., and Tang, Z. (2023). Development of deep potentials of molten mgcl2–nacl and mgcl2–kcl salts driven by machine learning. ACS Appl. Mater. and Interfaces. doi:10.1021/acsami.2c19272
Yoo, M. H., and Fu, C. L. (1998). Physical constants, deformation twinning, and microcracking of titanium aluminides. Metallurgical Mater. Trans. A 29, 49–63. doi:10.1007/s11661-998-0158-2
Zhang, H., Lu, D., Pei, Y., Chen, T., Zou, T., Wang, T., et al. (2023). Tensile behavior, microstructural evolution, and deformation mechanisms of a high nb-tial alloy additively manufactured by electron beam melting. Mater. and Des. 225, 111503. doi:10.1016/j.matdes.2022.111503
Zhang, L., Han, J., Wang, H., Car, R., and E, W. (2018a). Deep potential molecular dynamics: a scalable model with the accuracy of quantum mechanics. Phys. Rev. Lett. 120, 143001. doi:10.1103/physrevlett.120.143001
Zhang, L., Han, J., Wang, H., Saidi, W. A., Car, R., and Weinan, E. (2018b). “End-to-end symmetry preserving inter-atomic potential energy model for finite and extended systems,” in Neural information processing systems.
Zhang, S., Zhang, C., Du, Z., Hou, Z., Lin, P., Kong, F., et al. (2016). Deformation behavior of high Nb containing TiAl based alloy in α + γ two phase field region. Mater. and Des. 90, 225–229. doi:10.1016/j.matdes.2015.10.080
Zhao, Z., Guo, W., and Zhang, Z. (2024). A general-purpose neural network potential for ti-al-nb alloys towards large-scale molecular dynamics with ab initio accuracy. doi:10.48550/ARXIV.2403.09529
Keywords: TiAlNb alloy, machine-learning interatomic potentials, deep learning, moment tensor, molecular dynamics, density functional theory
Citation: Chandran A, Santhosh A, Pistidda C, Jerabek P, Aydin RC and Cyron CJ (2024) Comparative analysis of ternary TiAlNb interatomic potentials: moment tensor vs. deep learning approaches. Front. Mater. 11:1466793. doi: 10.3389/fmats.2024.1466793
Received: 18 July 2024; Accepted: 20 September 2024;
Published: 03 October 2024.
Edited by:
Alireza Tabarraei, University of North Carolina at Charlotte, United StatesReviewed by:
Xingyu Gao, Institute of Applied Physics and Computational Mathematics (IAPCM), ChinaPrashant Singh, Iowa State University, United States
Copyright © 2024 Chandran, Santhosh, Pistidda, Jerabek, Aydin and Cyron. This is an open-access article distributed under the terms of the Creative Commons Attribution License (CC BY). The use, distribution or reproduction in other forums is permitted, provided the original author(s) and the copyright owner(s) are credited and that the original publication in this journal is cited, in accordance with accepted academic practice. No use, distribution or reproduction is permitted which does not comply with these terms.
*Correspondence: Anju Chandran, YW5qdS5jaGFuZHJhbkBoZXJlb24uZGU=