 Jinlong Guo
 Chao Li1,3
- 1College of Engineering, Fujian Jiangxia University, Fuzhou, China
- 2Institute of Infrastructural Protection in Fujian Jiangxia University, Fuzhou, China
- 3College of Transportation and Civil Engineering, Fujian Agriculture and Forestry University, Fuzhou, China
- 4College of Materials Science and Engineering, Fuzhou University, Fuzhou, China
To investigate the axial compression performances of precast concrete columns with a novel steel connection, axial compression tests were carried out on 14 specimens. The effects of four different forms of the steel connections on the failure modes and axial compression performance of the specimens were studied, respectively. Furthermore, the influences of the cross-sectional area and the anchorage length of the steel connections on the specimens were explored. The columns with both studs and anchor plates exhibit good axial compression stiffness, bearing capacity, and ductility. For specimens with neither studs nor anchor plates on the steel connection, the yield loads decrease by 1.8%–5.2%. Increasing the cross-sectional area of the steel connection can significantly improve the axial compression bearing capacity of the columns, but has a negligible effect on the initial axial compression stiffness. Within the range of cross-sectional dimensions discussed in this test, the yield load has increased by up to 31.5%. In addition, a verified numerical model of the column was established and further analysis was conducted. The studs and anchor plates can effectively ensure that the steel connections are well anchored in the concrete under axial compression. For the column with both studs and anchor plates, the exposed steel connection serves as the axial compression control section, and the failure of the column under axial compression is the compressive yield of the steel connection. Lastly, the axial compressive bearing capacity of the column was calculated by the equation.
1 Introduction
With the industrial upgrading in construction, the application of precast concrete structures is experiencing a continuous expansion. In this approach, concrete components are prefabricated in factories and then transported to the construction site for assembly. Precast concrete reduces the on-site concrete pouring work, significantly shortens the construction period and improves construction efficiency. Moreover, industrialized production reduces manual operation errors, so the building quality is more guaranteed compared with on-site casting structures. For the vertical connection between precast concrete columns, the currently relatively mature method is the sleeve grouting connection, as detailed in references (Bu et al., 2016; Yu et al., 2019; Wu et al., 2020; Li X. M. et al., 2021; Jia et al., 2022; Fan et al., 2024). However, this technology has some problems. It still requires a relatively large amount of on-site concrete pouring work, and it has high requirements for the installation accuracy of components. The upper and lower columns to be connected are butt jointed via reserved longitudinal rebars and holes. However, during construction, the longitudinal rebars often cannot be inserted into the reserved holes. Therefore, it is difficult to guarantee the quality of the grouting connection (Li Z. Q. et al., 2021; Qiu et al., 2022; Cao et al., 2023; Ma et al., 2023; Qu et al., 2023; Yu et al., 2023).
In response to these issues, researchers have proposed a series of connection forms for precast concrete columns. Some researchers have proposed the bolt-type column - column connection as follows. Zhang et al. (2021) proposed a connection form in which high strength bolts are pre-embedded in the lower component and penetrate through the upper precast steel plate. In addition, Cheng et al. (2021) proposed that, on the basis of sleeve grouting connection, high - strength bolts are used to connect steel plates to provide restraint to the concrete at the joints, so as to improve the bearing capacity of the column. The research results show that the axial compressive bearing capacity of the column increases significantly with the increase of the bolt pre-tightening force. Moreover, Zhang et al. (2022) proposed that the upper and lower columns are connected through a core tube, prestressed vertical cables and self-tapping bolts. The core tube was connected to the lower column by plug welding. During assembly, the upper column passes through the core tube. Pre-drilled holes are drilled at the corresponding positions on the upper column wall and the core tube, and self-tapping bolts are installed to ensure a tight connection between the upper column wall and the core tube.
Some other scholars have proposed the tenon-type column - column connection as follows. Liu et al. (2017) proposed a precast column form with a reserved tenon on the upper column segment and a reserved socket on the lower column segment. During the assembly construction, the upper and lower columns are spliced through the tenon and the socket. The steel cages of the upper and lower columns are butt using the threaded sleeve. Similar connection methods include the following. After the upper and lower column segments are spliced, steel backing plates are reserved at the ends of both the upper and lower columns, and the connection part is welded with a movable cover plate (Gao et al., 2019). The longitudinal rebars of the column body are passed through the reserved holes in the end plates and are fixed with bolts. The upper and lower end plates, webs and stiffening rib plates in the joint are welded to form a steel joint (Liu et al., 2021). Moreover, Wang et al. (2022) proposed to double-side weld the longitudinal rebars at the ends of the upper and lower precast columns to the inner wall of a steel tenon column connection made of rolled steel plates, in which no transverse rebars are arranged. Zhong et al. (2023) adopted a core steel tube connection based on the tendon mechanism, and combined it with a rebar sleeve connection for longitudinal reinforcement to achieve column - column assembly.
The bolt-type column - column connection requires high precision in site assembly. In contrast, the tenon-type column - column connection has a relatively complex form. Therefore, a precast concrete column with a novel steel connection is proposed in this research to achieve a simple form and convenient installation for column - column connection. As shown in Figure 1, the precast column consists of steel connection at the upper and lower ends and a concrete column body. The column is vertically symmetrical about the cross-section where the midpoint of the column height is located. Steel sections are embedded in the concrete cross-section of the connection sections, and the steel sections extend out of the concrete to form steel connections, while the concrete column body has no steel sections. During the precast stage of the column, the steel plates are first processed and welded to form a cross shape. After that, studs and anchor plates are arranged as shown in Figure 1. Then, the steel sections and the steel cage are positioned, and concrete is poured to form the column body. During the assembly construction, the vertical connection of the precast columns is achieved by welding the steel connections of the upper and lower columns. To facilitate welding, a steel butt plate is placed between the two steel connections and they are respectively fillet welded to it. The connection is located at the middle of the floor height.
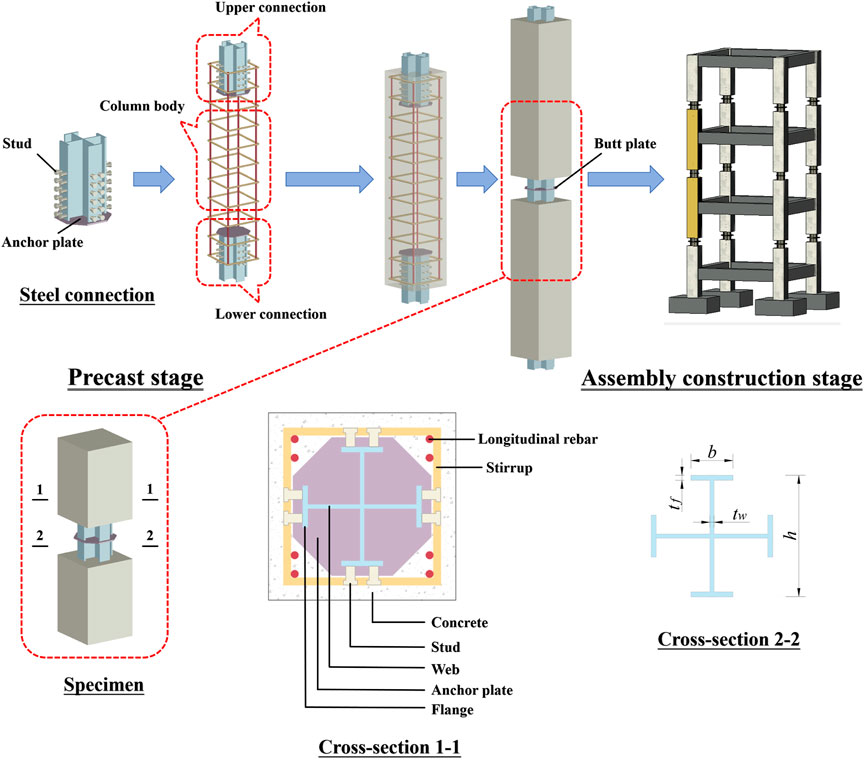
Figure 1. Schematic diagram of precast concrete column with a novel steel connection.
In this study, axial compression loading tests were carried out on 14 precast concrete columns with a novel steel connection. The effects of four different forms of the steel connections on the failure modes and axial compression performance of the specimens were studied, respectively. In addition, a numerical model of the column was established using finite element package ABAQUS. Based on this numerical model, further analysis was conducted to explore the axial compression mechanical properties of the column. Lastly, the axial compressive bearing capacity of the column was calculated by the equation.
2 Brief of test
2.1 Specimen design
In this test, a total of 14 specimens with a novel steel connection were designed. The height of each specimen is 750 mm. Each specimen consists of the lower part of the upper column, the upper part of the lower column, and the connection part between the two columns. The cross-sectional dimensions of the specimens are all 200 × 200 mm.
According to whether studs and anchor plates are arranged, the connection can be divided into four different forms as shown in Figure 2, namely, both studs and anchor plates, only anchor plates, only studs, and neither studs nor anchor plates. In addition, parameters such as the cross-sectional area of the steel section and the anchorage length of the steel part were also taken into account. The specific design parameters of the specimens are listed in Table 1. The anchorage length refers to the length of the steel part embedded in the concrete. The cross-shaped steel is welded from Q235 grade steel. The anchor plates and the butt steel plates between the two columns are also welded to the cross-shaped steel with the same grade steel, whose thickness is 5 mm.
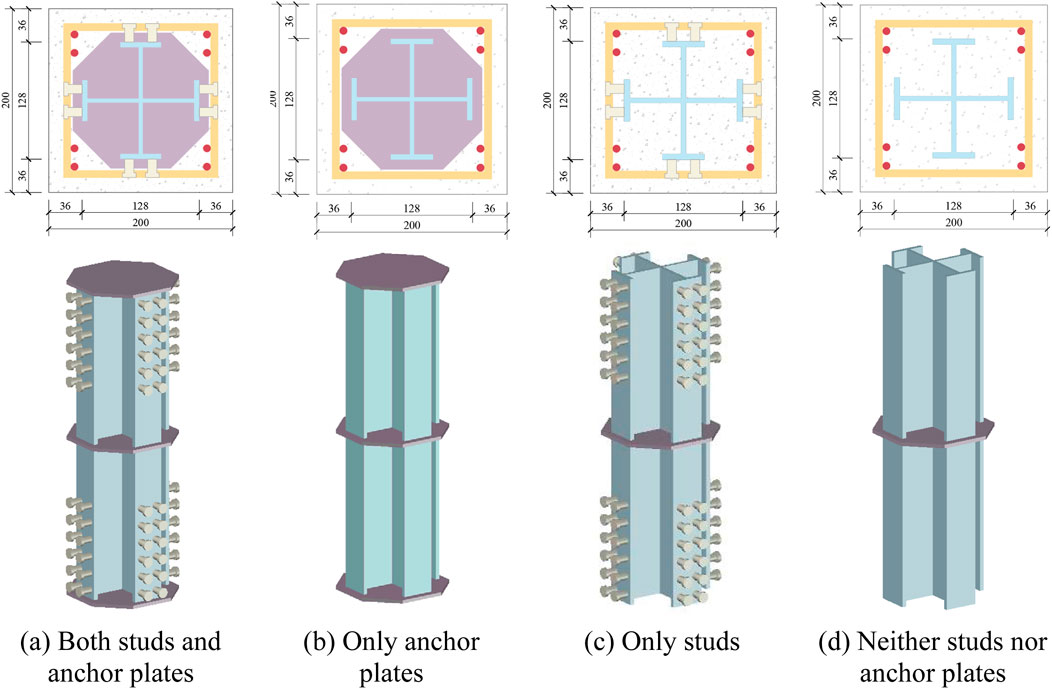
Figure 2. Schematic diagrams of the section of the precast concrete column with a novel steel connection. (a) Both studs and anchor plates. (b) Only anchor plates. (c) Only studs. (d) Neither studs nor anchor plates.
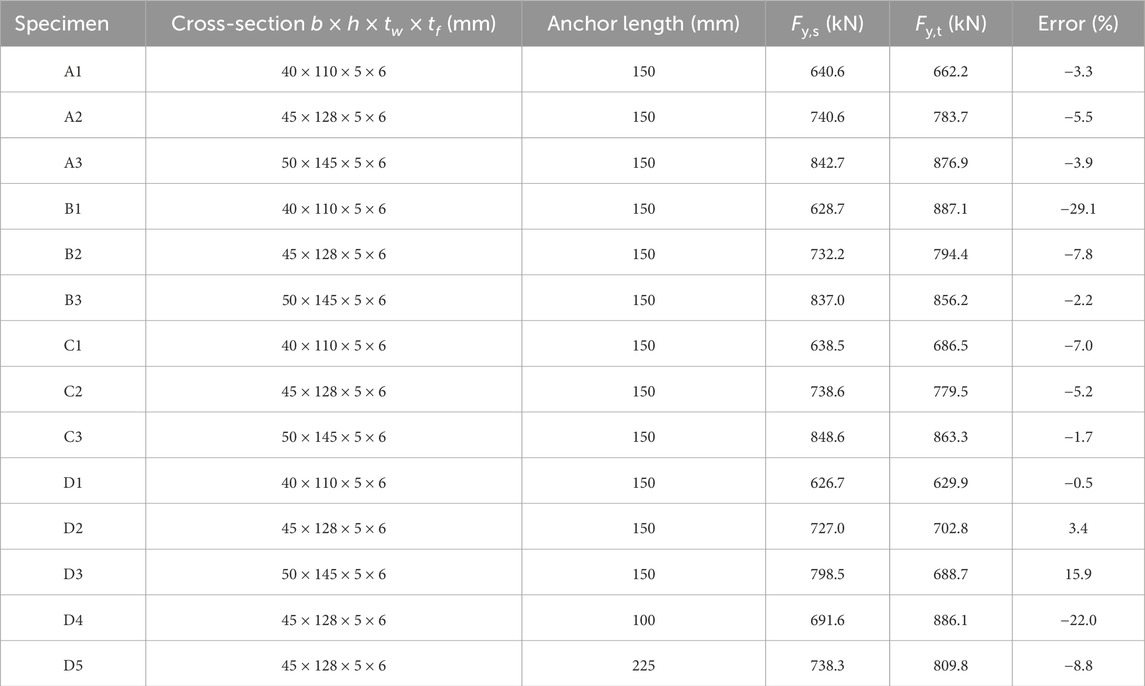
Table 1. List of specimens.
For specimens with studs, the diameter of the studs is 10 mm, the diameter of the stud heads is 15 mm, and the length of the studs is 20 mm. The studs are symmetrically arranged in two rows and welded on the outer surface of the flanges of the built-in steel section; the spacing between adjacent studs is 25 mm. As shown in Figure 2, on both sides of the specimen cross-section, 8 HRB400 grade steel bars with a diameter of 8 mm are symmetrically arranged as longitudinal rebars, and the reinforcement ratio of the longitudinal rebars in the cross-section is 1.0%. The stirrups are made of HPB300 grade steel bars with a diameter of 8 mm and a spacing of 100 mm.
The concrete used for the specimens is characterized by a cubic compressive strength of 32.2 MPa. These cube, used to measure the cubic compressive strength of the concrete, have a diameter of 150 × 150 × 150 mm. The mechanical properties of the steel materials used are shown in Table 2.
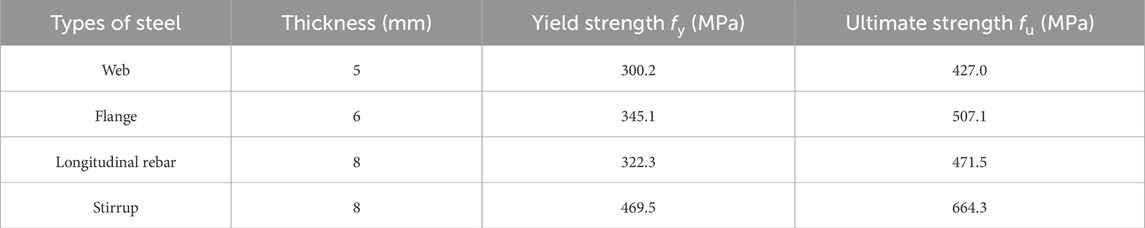
Table 2. Steel parameters.
2.2 Loading scheme
The scheme for test loading and measurement is shown in Figure 3a. An electro-hydraulic servo testing machine with a capacity of 5,000 kN is used for axial compression loading, and a sensor built into the testing machine directly reads the load value. The loading adopts force control and displacement control successively. Specifically, during force control loading, the loading rate is 1 kN/s. When the load reaches 90% of the estimated yield load of the specimen, the loading mode is changed to displacement control with a loading rate of 1 mm/min. The loading is terminated when the bearing capacity of the specimen drops to 85% of the peak bearing capacity or the vertical displacement is too large for the specimen to continue to bear the load. The specimen is placed at the center of the pressure plate. Displacement gauges are symmetrically arranged at the four corners of the bottom plate to measure the axial deformation of the specimen. By monitoring the displacement data of the four displacement gauges, the experimenters ensure that the specimen is in an axial compression state during the loading. Strain gauges are arranged on the steel connection and the steel bars as shown in Figure 3b.
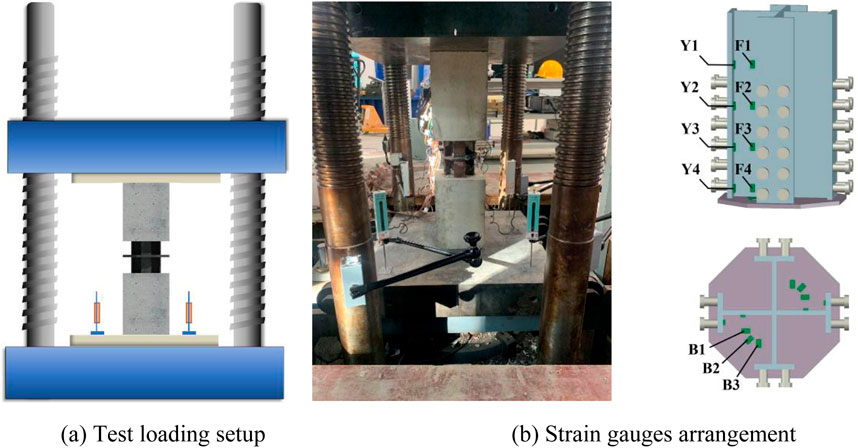
Figure 3. Test loading and measurement scheme. (a) Test loading setup. (b) Strain gauges arrangement.
3 Test results and analysis
3.1 Failure mode
Taking specimen A1 as an example, for columns with studs and anchor plates both arranged on the steel connection, the final failure mode is shown in Figures 4a, b, and the axial compression load - displacement curve is shown in Figure 5a. In the initial stage of the force control loading, the axial load borne by A1 was relatively low, and the axial deformation was also small. There were no obvious cracks on the outer surface concrete of the specimen, and there was no obvious deformation in the exposed steel connection. As the axial load continued to increase, cracks first appeared on the concrete surface near the connection; and the sound of concrete crushing could be occasionally heard from the column specimen. Subsequently, the loading was switched to displacement control. At this time, the surface rust on the flanges and webs of the exposed butt steel plates in the middle of the column specimen began to flake off. When the load reached 662.2 kN, the axial deformation started to increase sharply, while the load increase slowed down. A distinct turning point, namely, the yield load, appeared on the load - displacement curve. Then, when the load value reached 806.2 kN, several prominent vertical cracks formed in the concrete along the studs and extended towards the support. The cracks were wider near the connection and narrower at the support. In addition, a slight buckling occurred in the flange plate of the steel connection. As the displacement control loading continued, the buckling at the flanges became more obvious. When the displacement reached 3 mm, the webs began to yield. After that, when the displacement reached 22.4 mm, the load reached its peak and then started to decline. The concrete continued to crack, leading to collapse. Finally, when the displacement reached 33.0 mm, the specimen could no longer bear the load, and the test was stopped.
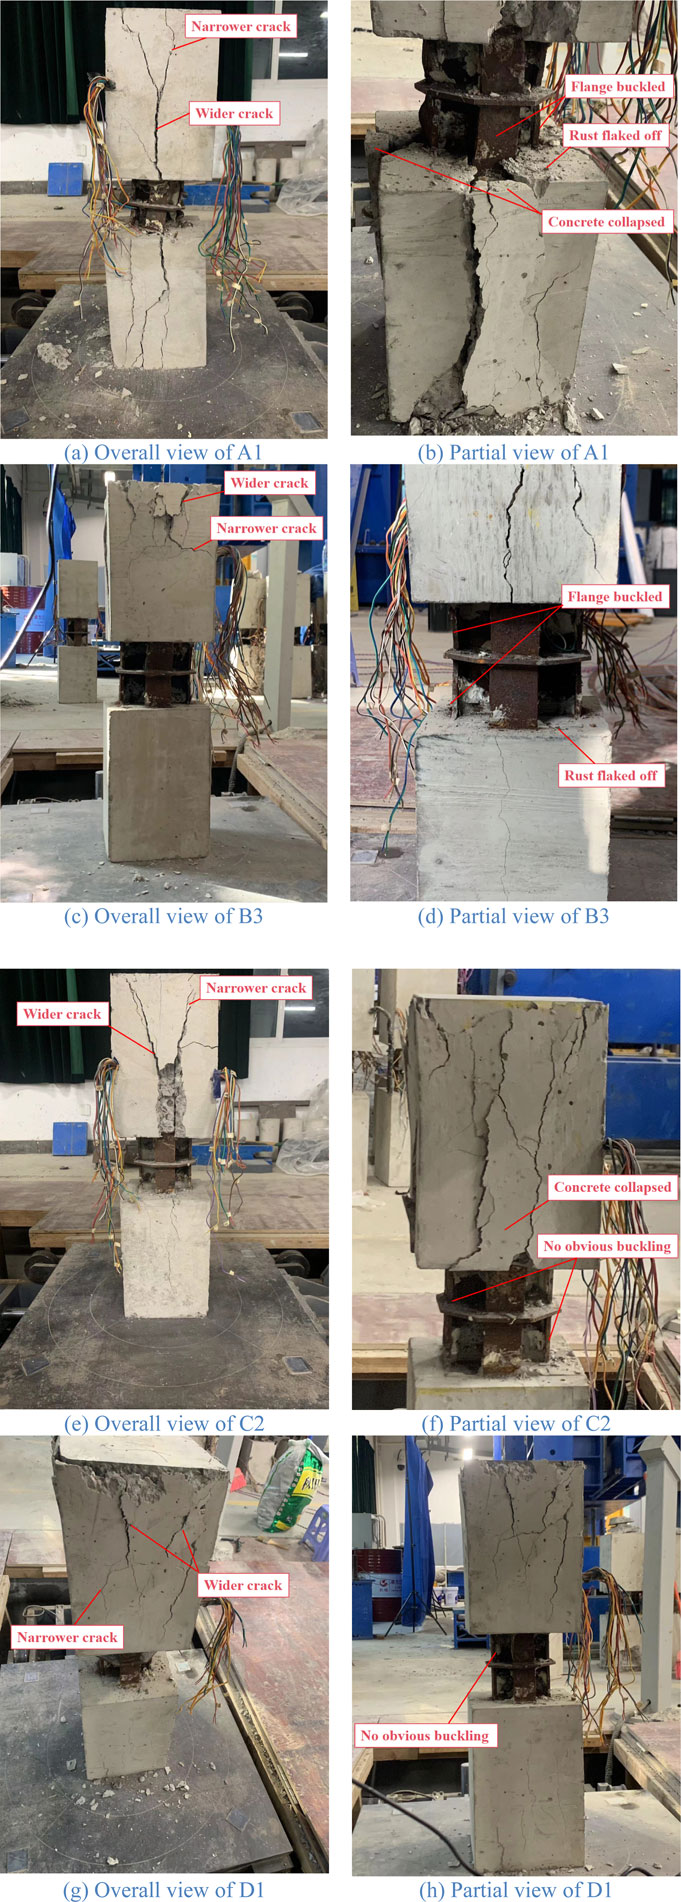
Figure 4. Test failure mode. (a) Overall view of A1. (b) Partial view of A1. (c) Overall view of B3. (d) Partial view of B3. (e) Overall view of C2. (f) Partial view of C2. (g) Overall view of D1. (h) Partial view of D1.
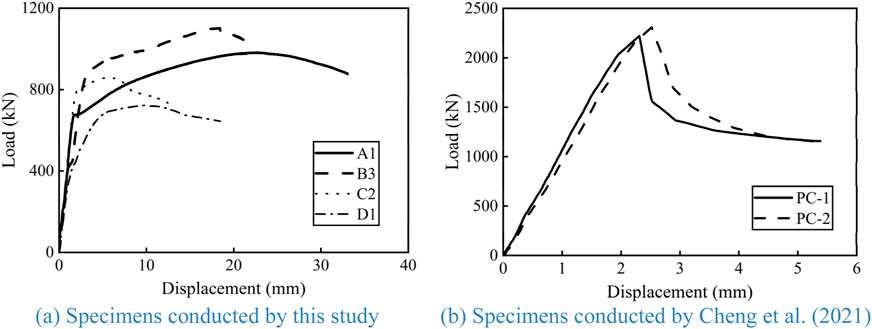
Figure 5. Axial compression load - displacement curve. (a) Specimens conducted by this study. (b) Specimens conducted by Cheng et al. (2021).
Taking specimen B3 as an example, for columns with only anchor plates arranged on the steel connection, the final failure mode is shown in Figures 4c, d, and the axial compression load - displacement curve is shown in Figure 5a. The failure development trend of B3 is similar to that of A1. When the specimen failed, buckling occurred in the flange of the steel connection. However, there were some differences. Cracks first appeared at the support of the concrete surface in B3. As the loading continued, the cracks extended towards the connection. The cracks were wider near the support and narrower near the connection. Regarding the load - displacement curve, after reaching the peak bearing capacity, the downward trend of B3 was quite obvious. When the displacement reached 21.1 mm, the specimen could no longer bear the load.
Taking specimen C2 as an example, for columns with only studs arranged on the steel connection, the final failure mode is shown in Figures 4e, f, and the axial compression load - displacement curve is shown in Figure 5a. Compared with specimen A1, the failure development trend of specimen C2 is similar. Several prominent vertical cracks formed near the connection along the studs and extended towards the support. The cracks were wider near the connection and narrower near the support, and the concrete also cracked leading to collapse. However, there was a difference. When specimen C2 failed, there was no obvious buckling in the flange of the steel connection. Regarding the load - displacement curve, after passing the yield load, C2 reached the peak bearing capacity more quickly than both A1 and B3, and then declined rapidly. The axial deformation of the specimen was significantly weaker.
Taking specimen D1 as an example, for columns with neither studs nor anchor plates arranged on the steel connection, the final failure mode is shown in Figures 4g, h, and the axial compression load - displacement curve is shown in Figure 5a. When the load reached 441.7 kN, the slope of the axial load - displacement curve showed a significant decline. As the loading continued, when the load reached 530.3 kN, the crushing sound of the specimen could be heard, and the surface rust at the butt steel connection began to flake off. When the load reached the yield value of 629.9 kN, multiple cracks appeared on the surface of the concrete. When the load reached 722.0 kN, the curve started to show a downward trend, and the cracks on the surface of the column specimen widened. When the specimen failed, the cracks on the concrete surface were wider near the support and narrower near the connection. Moreover, there was no obvious buckling in the flange of the steel connection.
Precast concrete column with both studs and anchor plates arranged on the steel connection have a mechanism of transferring vertical loads as shown in Figure 6 under axial compression load. The exposed connection section undergoes obvious compressive buckling under the action of the whole vertical load. The studs on the embedded section interact with the concrete. The studs transfer part of the vertical load through shear deformation. The concrete around the stud bolts develops vertical cracks due to the bearing pressure caused by the deformation of the stud bolts. In addition, the anchor plate transfers part of the vertical load through compressive deformation, and the anchor plate shows a relatively obvious yielding under stress.
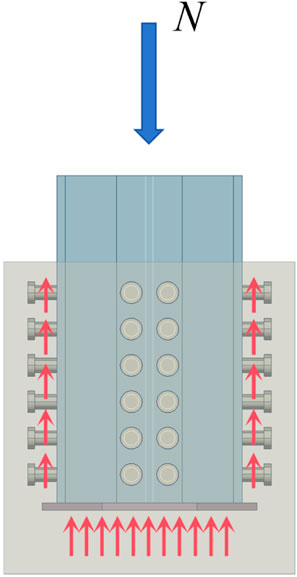
Figure 6. Mechanism of transferring vertical loads.
Figure 5a, b shows the comparison between the axial compression load - displacement curves of the above four specimens and the curves of the specimens conducted by Cheng et al. (2021). It can be observed that the displacement range of the four specimens conducted by this study when they reach the peak bearing capacity is from 5.6 to 22.2 mm, while for the specimens conducted by Cheng et al. (2021), the corresponding values are only 2.3 and 2.5 mm. Thus, the precast concrete columns proposed in this study have more excellent deformation capacity under axial compression. The curves of A1, B3, and C2 all show an elastic stage, a strengthening stage, and a descending stage as a whole. Among them, A1 has a large initial stiffness and exhibits good bearing capacity and ductility. B3 shows an indistinct descending stage, has a relatively high ultimate bearing capacity, but its ductility is inferior to A1’s. However, although C2 has a large initial stiffness, its strengthening stage is not obvious and its ductility is less than A1’s.
In contrast, the curve of D1 shows an elastic stage, an elastic - plastic stage, and a descending stage as a whole. The overall stiffness and the ultimate bearing capacity of D1 are lower than those of the other three specimens.
Based on the above test results, under axial compression loading, specimens with both studs and anchor plates arranged on the steel connection exhibit good axial compression stiffness, bearing capacity, and ductility. For specimens with only anchor plates on the steel connection, the axial compression stiffness and ductility of the specimens are both reduced. For specimens having only studs on the steel connection, they show reduced bearing capacity and ductility. As for specimens with neither studs nor anchor plates on the steel connection, their axial compression stiffness and bearing capacity are significantly reduced.
3.2 Influence of the area of steel connection
To analyze the influence of different cross-sectional area of the steel connection on the specimens’ axial compression performance, specimens with four forms of connected steel sections are analyzed. Their axial compression load - displacement curves are shown in Figure 7, respectively.
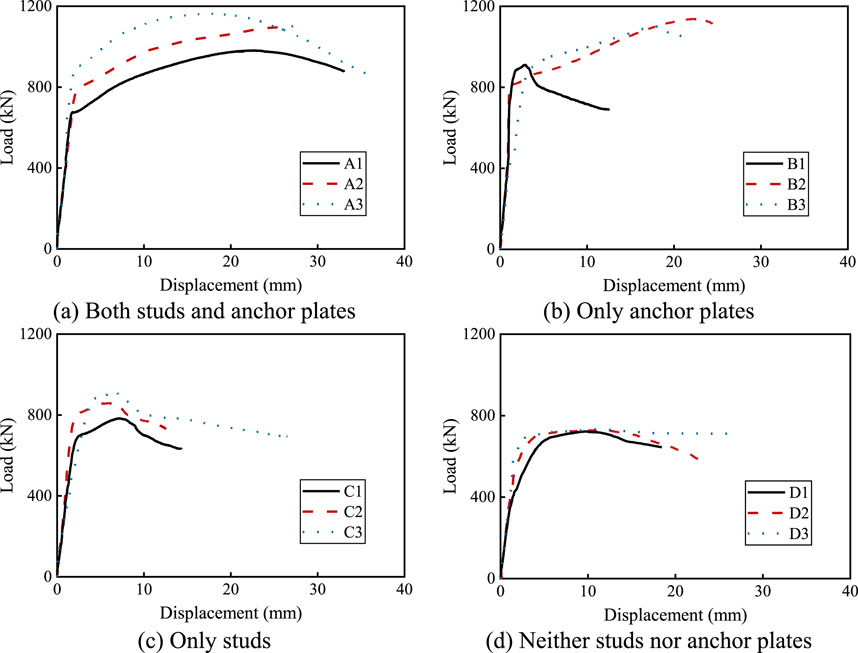
Figure 7. Influence of different cross-sectional area of steel connection. (a) Both studs and anchor plates. (b) Only anchor plates. (c) Only studs. (d) Neither studs nor anchor plates.
For specimens with both studs and anchor plates, as shown in Figure 7a, increasing the cross-sectional area of the steel connection can significantly improve the axial compression bearing capacity of the specimens, but it has a negligible effect on the initial axial compression stiffness. As a result, the yield displacement of the specimens increases to a certain extent. For specimens with only anchor plates, as shown in Figure 7b, when the cross-sectional area of the steel connection is small, corresponding to the specimen B1, the curve enters the descending stage after reaching the peak bearing capacity, and the column loses its bearing capacity relatively quickly. However, increasing the cross-sectional area of the steel section (B2/B3) can significantly improve the post-yield bearing capacity of the specimens. The curve shows an obvious strengthening stage, and the specimens have better continuous bearing capacity. When specimens with only studs, as shown in Figure 7c, the cross-sectional area of the steel connection increases, both the yield load and the peak load of the curve increase. Moreover, when the area is relatively large (C3), the specimen shows a gentler descending stage. For specimens with neither studs nor anchor plates, as shown in Figure 7d; the shapes of the three curves are similar, and the differences between the peak loads are insignificant. However, the rising stage of D3 is steeper than that of D2, and the rising stage of D2 is steeper than that of D1. It can be seen that increasing the cross-sectional area of the steel connection can improve the axial compression stiffness of the columns.
The influence of different cross-sectional area of steel connection on the yield load of the specimens was analyzed, and the results are shown in Figure 8. It can be seen that for the four series, the yield load of the specimens increases with the increase of the cross-sectional area of the steel connection. Especially for series A, there is almost a direct proportional growth relationship between the yield load and the cross-sectional area, which can be expressed as Fy,t = 0.311As. Compared with specimen A1, the yield load of A2 increases by 15.6%, and the yield load of A3 increases by 31.5%. As mentioned in Section 2.1, it has been explained that under axial compression, the exposed connection section of the column transmits all the vertical loads. Therefore, it can be inferred that the axial compression control section of the specimens with both studs and anchor plates is the exposed steel connection. However, compared with the specimens in series A that have the same cross-sectional area, due to the bond slip caused by the lack of studs and anchor plates, the yield loads of the specimens in series D decrease by 1.8%–5.2%.
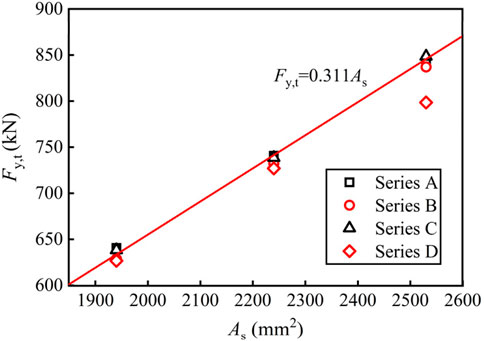
Figure 8. Influence on the yield load.
3.3 Influence of the anchorage length of steel connection
As we found in Section 2.1, for the specimens with neither studs nor anchor plates, when they are damaged, the concrete cracks while the steel connection does not show obvious buckling. Moreover, as shown in Figure 7, the bearing capacities of the specimens in series D are significantly lower than those of the specimens in the other three series. It can be speculated that under axial compression, the failure of the specimens with neither studs nor anchor plates is mainly controlled by the bond slip between the steel and the concrete. Therefore, we analyze the influence of the anchorage length of the steel connection on the specimens in series D.
As shown in Figure 9, the anchorage length has a certain influence on the bearing capacity and ductility of the specimens. For specimen D4, its relatively short anchorage length leads to insufficient bond strength between steel and concrete. As the load increases, premature bond slip occurs at the interface between steel and concrete, disrupting the stress transfer process. Consequently, the stress cannot be effectively redistributed within the composite structure. Once the specimen reaches its peak bearing capacity, the load bearing capacity drops sharply, indicating a brittle failure mode. In contrast, specimens D2 and D5 feature longer anchorage lengths. The enhanced bond slip behavior at the interface between steel and concrete allows for a more stable stress transfer mechanism. When the specimens approach their peak load, the load can be gradually redistributed among different components due to the sufficient anchorage length. This results in obvious plateaus in their bearing capacity curves, representing a more ductile failure mode. Such plateaus are more conducive to the sustained load bearing capacity of the column after yielding.
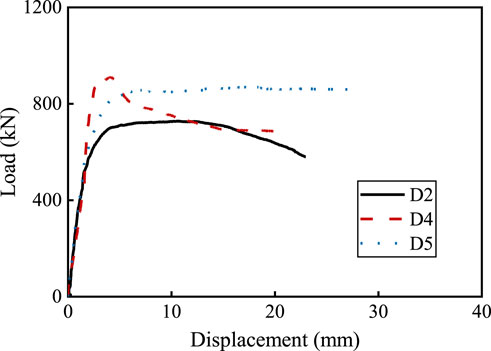
Figure 9. Influence of different anchorage length of steel connection.
4 Numerical model
4.1 Materials
The numerical model of the precast concrete column specimen was established with finite element software ABAQUS. The concrete material was simulated by using the plastic damage model, and the values of the basic parameters were set as follows: the density was 2,400 kg/m3, the elastic modulus was 3.0 × 10⁴ MPa, and the Poisson’s ratio was taken as 0.16. According to the suggestions in the literature (Dassault, 2021; Fang et al., 2007; Tao et al., 2011), the parameters dilation angle (φd), eccentricity (e), ratio of the compressive strength in the biaxial state to the uniaxial compressive strength (αf), K parameter (Kc) and viscosity (μ) in this simulation were assigned the values of 30°, 0.1, 1.16, 0.667 and 0.005, respectively. The relationship between stress and strain provided by the code (Ministry of Housing and Urban-Rural Development, 2015) was selected for concrete with the uniaxial compressive strength of 21.5 MPa and the uniaxial tensile strength of 2.3 MPa.
The steel material was simulated by using the bilinear elastic–plastic model with the yield strength and the ultimate strength as shown in Table 2. The elastic modulus of the plastic stage was taken as 1% of the one in the elastic stage. In addition, the elastic modulus, Poisson’s ratio, and density of the steel were taken as 2.06 × 10⁵ MPa, 0.3, and 7,850 kg/m3, respectively.
4.2 Element and boundary
The numerical model of the specimen is developed by the strategy similar to Celik et al. (2022), and is shown in Figure 10. The eight-node reduced integration solid element C3D8R with structured meshing was used to simulate the concrete and steel connection. Each element of the C3D8R is represented by eight nodes with three degrees of freedom at each node: the nodes express the translations in the x, y, and z directions. The two-node truss element T3D2 was used for the longitudinal rebars and the stirrups.
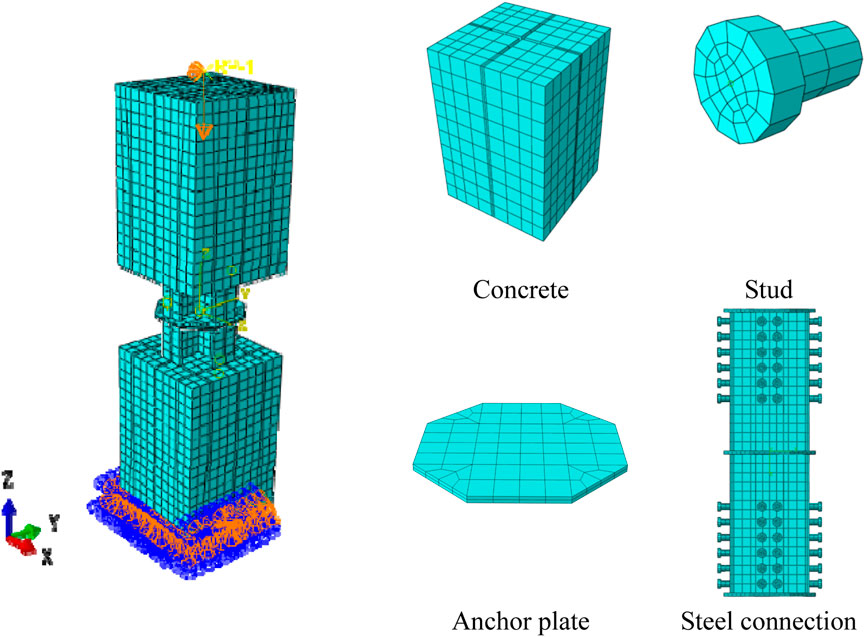
Figure 10. Numerical model.
The accuracy of the result is influenced by the mesh size of numerical model. In general, finer mesh size yields more accurate results but increases computational time. Mesh convergence test is carried out by reducing mesh size. Four element sizes of 40, 30, 20 and 15 mm are therefore used in the main region of concrete and steel connection. The mesh convergence test results for the specimen A1 are listed in Table 3. It can be found that the axial compression bearing capacity for element sizes of 20 and 15 mm are 640.6 and 641.1 kN, respectively, which are quite close. Further element refinement will not significantly improve the accuracy of the results but decrease computational efficiency. The concrete and steel connection body of the specimen is meshed with 20 mm and the longitudinal rebars and the stirrups with 30 mm. The numerical model consists of a total of 17,226 nodes and 9,774 elements.
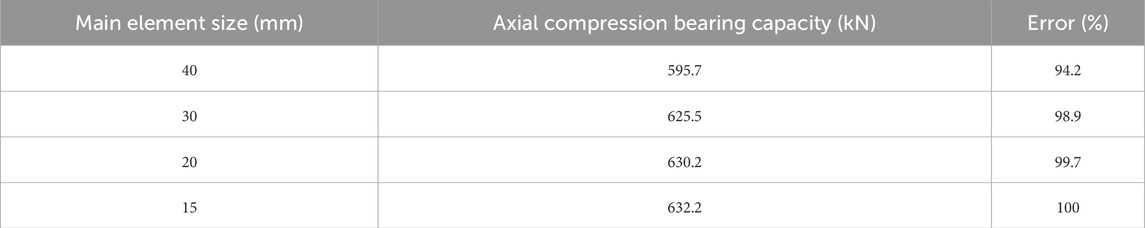
Table 3. Mesh convergence test results.
A reference point was established at the top of the column and coupled with the upper column surface. Then, the displacement load was applied on the coupling constraint point. Considering the support situation in the test, a fixed constraint was applied at the bottom of the column. Taking into account the bond strength existing at the interface between steel and concrete (Fu et al., 2023; Li et al., 2023), hard contact was employed to simulate the normal interaction between the steel connection (consisting of the anchor plate, flange and web) and the concrete, and tangential contact was modeled using coulomb friction with friction coefficients of 0.6 (Pan and Guo, 2024). Since the test results show that the studs are well anchored in the concrete body throughout the whole process, the interaction between the studs and the concrete was modeled as a coupling.
4.3 Verification and analysis
The column specimens were simulated by the numerical model developed above, and the numerical failure modes of the typical specimens are shown in Figure 11. The mechanical performances of the steel connection and concrete in numerical simulation are depicted by their respective Mises stress contours and plastic strain contours. By comparing the test and numerical failure modes, it can be seen that the model can simulate the axial compression failure modes of the specimens very well. For series A, when the specimens failed, the embedded parts were well anchored in the concrete, and the maximum stress on the steel connection occurred at the flange of the exposed section, with a maximum stress of 452.4 MPa, which far exceeded the yield stress 345.1 MPa, and the exposed steel connection obviously yielded. Compared with series A, in series B, due to the lack of studs to share the load, the anchor plate carried more load during the axial load transfer process, and showed a more relatively obvious yielding under stress. The maximum stress at the anchor plate of specimen B3 is 304.6 MPa, which is greater than that of specimen A2 with 303.5 MPa. For series C, the studs played a greater role in load transfer. Similar to the result obtained by Zhang et al. (2022), the vertical load was transferred from the steel connection to the concrete through the shearing action of the studs, and thus the studs caused the most obvious plastic strain on the concrete. In addition, the post-yield stress of the exposed steel connection in series C (391.0 MPa) was significantly lower than that in series A and B (452.4 and 461.1 MPa). The bearing capacity of series C was relatively weak at the ultimate state, as can also be verified from Figure 7. The post-yield stress of the exposed steel connection in series D (386.3 MPa) was the lowest as shown in Figure 11, which can also be verified from Figure 7. Analyzing the concrete strain of series A and C, it can be seen that due to the shearing action of the studs, obvious rib-shaped strain concentration areas appeared at the corresponding positions of the concrete. In contrast, series B and D have no studs, and the steel connection transfers the vertical load to the concrete through bond slip behavior. Therefore, the stress concentration areas on the concrete of series B and D are relatively more uniform.
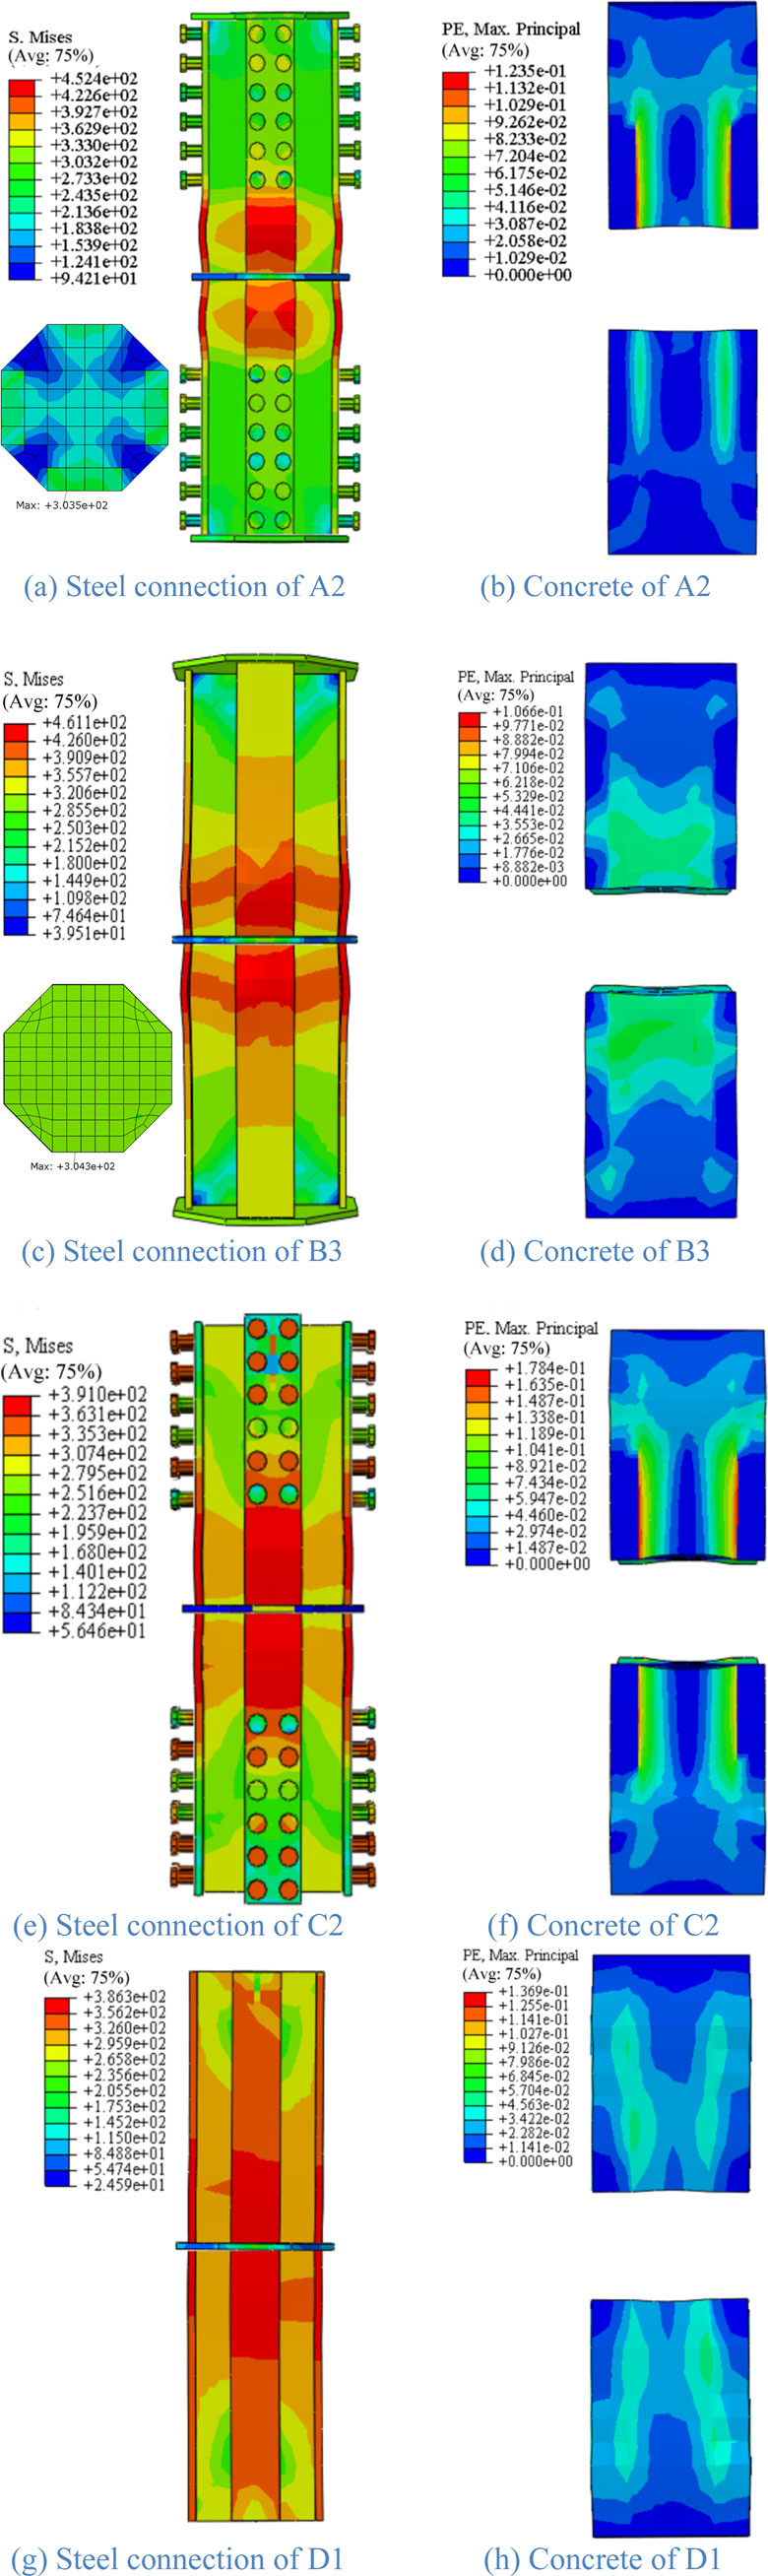
Figure 11. Numerical failure mode. (a) Steel connection of A2. (b) Concrete of A2. (c) Steel connection of B3. (d) Concrete of B3. (e) Steel connection of C2. (f) Concrete of C2. (g) Steel connection of D1. (h) Concrete of D1.
The axial compression load - displacement curves are shown in Figure 12. By comparing the results of the test and simulation, it can be seen that the simulated stiffness of all specimens is larger than the stiffness obtained from the test. This may be caused by the virtual displacement during the loading process. In addition, for specimens in series A, the numerical model can simulate the elastic and strengthening stages quite well. For specimens in series B and C, the numerical model can also simulate the overall trends of the curves well. However, for specimens in series D, there is a certain gap between the simulated and the test curves. The reason is likely that obvious slip failures occurred in the specimens in series D during the experimental loading, and this was not taken into account in the simulation. Especially for specimens in series A, it can be deduced that during axial compression loading, the steel connections are well anchored in the concrete, effectively transmitting the vertical load.
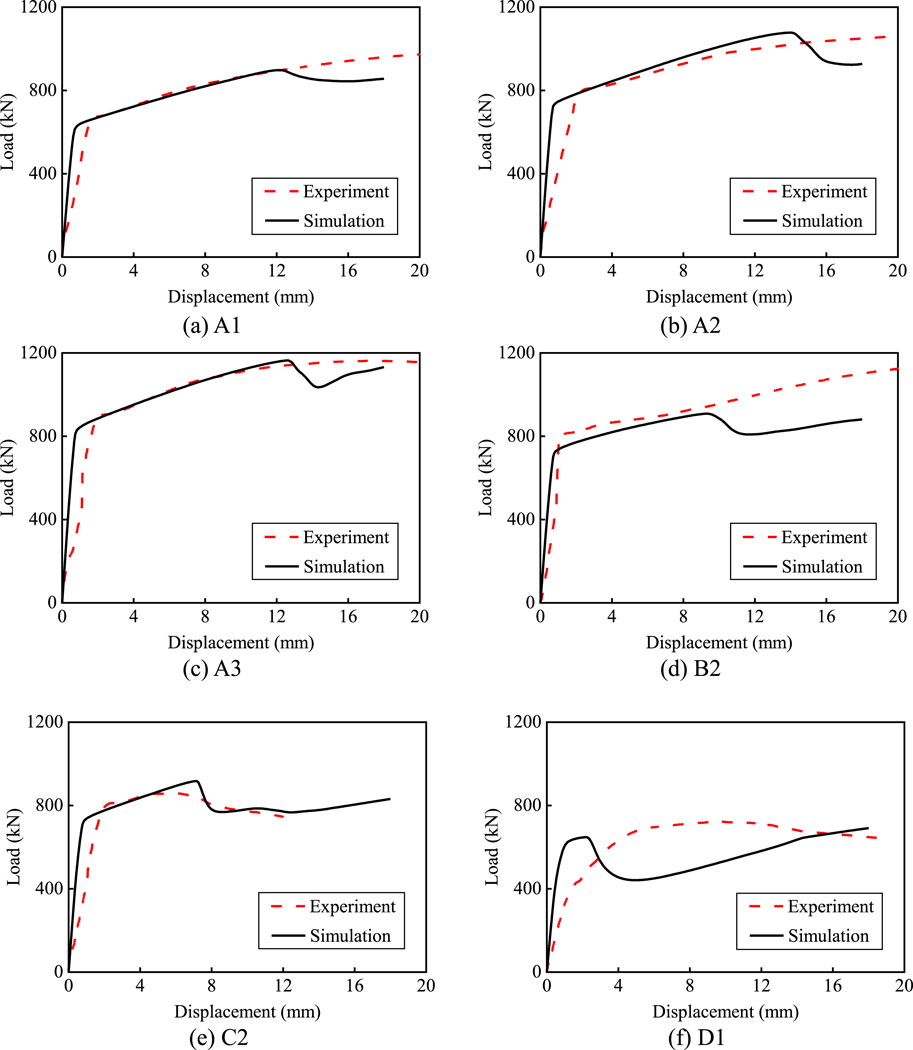
Figure 12. Comparison of axial compression load - displacement curves. (a) A1. (b) A2. (c) A3. (d) B2. (e) C2. (f) D1.
The yield loads of the specimens are listed in Table 1. The data indicates that for most specimens, especially those in series A, the errors between the simulated (Fy,s) and tested yield load (Fy,t) values are within 10%. For individual specimens with relatively large errors, the simulated values are all lower than the tested values, which leads to a conservative result. From this, it can be inferred that the numerical model can simulate the yield load of the specimens quite well.
Some typical load - strain curves from both the simulation and the test are shown in Figure 13. Overall, the strain obtained from the simulation can well match that from the test. For series A, when the axial compressive load exceeds the yield load value, the strain gauges F2 and F3 on the steel connection (taking A1 as an example) enter the yield state, approximately −2,000 με, successively. Due to the function of studs in transferring the axial load, there is a time difference for the sections at different depths on the steel section to enter the yield state. The strain gauges on the anchor plate (taking B3 as an example) remain in the elastic state, not exceeding about 1,500 με, during the loading process. This further indicates that the cross-section of the exposed part of the steel connection is the control section for the axial compressive yield of the specimen.
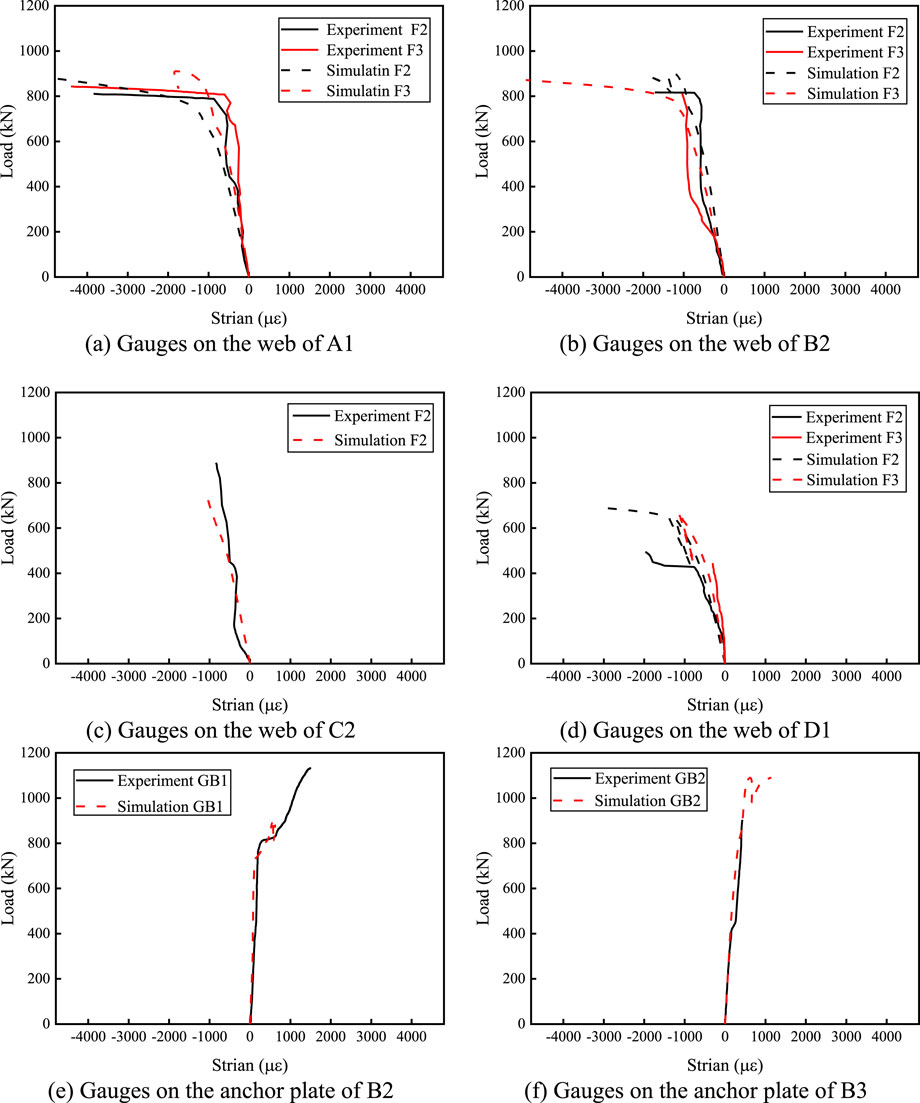
Figure 13. Comparison of axial compression load - strain curves. (a) Gauges on the web of A1. (b) Gauges on the web of B2. (c) Gauges on the web of C2. (d) Gauges on the web of D1. (e) Gauges on the anchor plate of B2. (f) Gauges on the anchor plate of B3.
5 Calculation of load bearing capacity
Considering the redundancy of the loading bearing capacity, the yield load value is taken as the axial compressive bearing capacity of the column. Based on the above test and simulation analysis, the axial compression control section of the specimens with both studs and anchor plates is the exposed steel connection. Therefore, the axial compression bearing capacity, Ny, of the precast concrete column with a novel steel connection equipped with both studs and anchor plates can be expressed as follows (Ministry of Housing and Urban-Rural Development, 2017).
In which, fy is the yield strength of the steel, and As is the cross-sectional area of the steel connection.
The studs and anchor plates can effectively prevent the anchorage failure between the connection and the concrete. As for the concrete column body, its axial compressive bearing capacity should still be higher than that of the steel connection. Therefore, Ny should also meet the following formula (Ministry of Housing and Urban-Rural Development, 2015).
In which, fc and fy’ are the strengths of the concrete and the longitudinal rebars, respectively; A and As’ are the cross-sectional areas of these two components.
To verify the applicability of Equations 1, 2 for the precast concrete columns with both studs and anchor plates, several additional columns with both studs and anchor plates on the steel connection were established by the numerical simulation. The specific cross-section design of the additional columns was listed in Table 4. Then, the yield loads of specimens in series A and the additional columns were calculated using Equations 1, 2 and compared with the simulation results. The comparison is shown in Figure 14. It shows that the errors are all lower than 5%, and Equations 1, 2 can be used to calculate the loading bearing capacity of the precast concrete columns.
Table 4. List of additional columns.
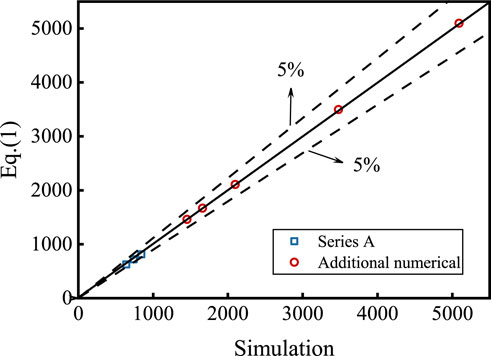
Figure 14. Applicability of Equations 1, 2.
6 Conclusion
In this research, experimental research and numerical simulation were carried out on the precast concrete columns with a novel steel connection. The following conclusions are summarized as follows:
(1) The precast concrete columns with both studs and anchor plates on the steel connection exhibit good axial compression stiffness, bearing capacity, and ductility. For specimens with neither studs nor anchor plates on the steel connection, the axial compression performance is reduced. Compared with the specimens with the same cross-sectional area, the yield loads of specimens with neither studs nor anchor plates on the steel connection decrease by 1.8%–5.2%.
(2) Increasing the cross-sectional area of the steel connection can significantly improve the axial compression bearing capacity of the columns with both studs and anchor plates on the steel connection. Within the range of cross-sectional dimensions discussed in this test, the yield load has increased by up to 31.5%. But the cross-sectional area has a negligible effect on the initial axial compression stiffness.
(3) The studs and anchor plates can effectively ensure that the steel connections are well anchored in the concrete under axial compression, and do not suffer from slip failure. Under the premise of reasonable design, for the column with both studs and anchor plates, the exposed steel connection serves as the axial compression control section. The failure of the column under axial compression is the compressive yield of the steel connection. Moreover, the column has good ductility and continuous loading bearing capacity after yielding.
Data availability statement
The raw data supporting the conclusion of this article will be made available by the authors, without undue reservation.
Author contributions
JG: Conceptualization, Formal Analysis, Funding acquisition, Methodology, Writing – original draft, Writing – review and editing, Supervision. CL: Data curation, Formal Analysis, Investigation, Software, Validation, Writing – original draft. MC: Data curation, Validation, Visualization, Writing – review and editing. YG: Visualization, Writing – review and editing. QF: Formal Analysis, Validation, Writing – review and editing. YL: Methodology, Resources, Writing – review and editing.
Funding
The author(s) declare that financial support was received for the research and/or publication of this article. Thanks to the financial support provided by Fujian Province Natural Sciences (Grant No. 2023J011103).
Acknowledgments
The authors would like to acknowledge Fujian Province Natural Sciences (2023J011103) for financial support to carry out this study.
Conflict of interest
The authors declare that the research was conducted in the absence of any commercial or financial relationships that could be construed as a potential conflict of interest.
Generative AI statement
The author(s) declare that no Generative AI was used in the creation of this manuscript.
Publisher’s note
All claims expressed in this article are solely those of the authors and do not necessarily represent those of their affiliated organizations, or those of the publisher, the editors and the reviewers. Any product that may be evaluated in this article, or claim that may be made by its manufacturer, is not guaranteed or endorsed by the publisher.
References
Bu, Z., Guo, J., Zheng, R., Song, J., and Lee, G. C. (2016). Cyclic performance and simplified pushover analyses of precast segmental concrete bridge columns with circular section. Earthq. Eng. Eng. Vib. 15 (2), 297–312. doi:10.1007/S11803-016-0323-3
Cao, D., Pan, Z. F., Zhang, Z., and Zeng, B. (2023). Experimental and numerical study on detection of sleeve grouting defect with impact-echo method. Structures 52, 632–650. doi:10.1016/j.istruc.2023.03.137
Celik, A. I., Ozbayrak, A., Sener, A., and Acar, M. C. (2022). Numerical analysis of flexural and shear behaviors of geopolymer concrete beams. J. Sustain. Constr. Mater. Technol. 7 (2), 70–80. doi:10.47481/jscmt.1116561
Cheng, D. H., Gao, P. G., and Ren, M. N. (2021). Experimental study and finite element analysis on joints of fabricated concrete columns. J. Shenyang Jianzhu Univ. Nat. Sci. 37 (4), 602–609. doi:10.11717/j.issn:2095-1922.2021.04.04
Fan, W., Su, H. X., Sun, W. B., Chen, L., and Wang, H. X. (2024). Dynamic shear strength of precast connection with UHPC-based and traditional grouted sleeves: test, simulation, and analytical formulas. Eng. Struct. 323, 119245. doi:10.1016/j.engstruct.2024.119245
Fang, Q., Huan, Y., Zhang, Y.-D., and Chen, L. (2007). Investigation into static properties of damaged plasticity model for concrete in ABAQUS. J. PLA Univ. Sci. Technol. Nat. Sci. Ed. (3), 254–260. doi:10.3969/j.issn.1009-3443.2007.03.011
Fu, C. Q., He, R., and Wang, K. J. (2023). Influences of corrosion degree and uniformity on bond strength and cracking pattern of cement mortar and PVA - ECC. J. Mater. Civ. Eng. 35 (6). doi:10.1061/jmcee7.mteng-14846
Gao, Z., Wu, B. H., and Pan, T. L. (2019). Seismic behavior of assembled single-tenon column-column joints. J. Wuhan Univ. Technol. 2019 (08), 48–53. doi:10.3963/j.issn.1671-4431.2019.08.009
Jia, L. G., Li, Q. R., Zhang, Y. G., Zhao, W. J., and Du, M. K. (2022). Experimental study of the hysteretic behavior of prefabricated frame-shear wall structures with grouting sleeve connections. J. Build. Eng. 57, 104704. doi:10.1016/j.jobe.2022.104704
Li, Q., Tian, Y., Fang, D. M., Zhao, K. L., Chen, H. D., Jin, X. Y., et al. (2023). The influence of longitudinal rebar type and stirrup ratio on the bond performance of reinforced concrete with corrosion. Constr. Build. Mater. 409, 133943. doi:10.1016/j.conbuildmat.2023.133943
Li, X. M., Xiao, S., Xu, Q. F., Wang, Z. L., and Zhang, F. W. (2021). Experimental research on the seismic performance of prefabricated concrete columns with defects in sleeve grouting rectification. China Civ. Eng. J. 54 (5), 15–26. doi:10.15951/j.tmgcxb.2021.05.002
Li, Z. Q., Li, D. S., and Chen, Y. C. (2021). Deep learning-based guided wave method for semi-grouting sleeve detection. J. Build. Eng. 46, 103739. doi:10.1016/j.jobe.2021.103739
Liu, L. P., Yin, Y. R., Yu, J., Wang, Z. J., Li, Y. M., and Li, R. F. (2021). Experimental study on seismic performance of prefabricated RC columns with steel flange-tenon connection. Prog. Steel Build. Struct. 23 (03), 42–53. doi:10.13969/j.cnki.cn31-1893.2021.03.005
Liu, Y., Guo, Z. X., Lv, Y. T., Huang, Q. X., and Wang, Z. Y. (2017). Experimental study on seismic performance of full-scale prefabricated reinforced concrete columns with improved longitudinal reinforcement connection. J. Build. Struct. 38 (11), 101–110. doi:10.14006/j.jzjgxb.2017.11.012
Ma, J. F., Bai, G. L., Liang, L. L., Wang, L., and Su, N. F. (2023). Mechanical behavior of semi-grouting sleeve and steel bar connection. Struct. Concr. 24 (4), 5299–5313. doi:10.1002/suco.202200529
Ministry of Housing and Urban-Rural Development (2015). Code for design of concrete structures: GB 50010-2010. 2015 Edn. Beijing: China Architecture and Building Press.
Ministry of Housing and Urban-Rural Development (2017). Code for design of steel structures: GB 50017-2017. Beijing: China Architecture and Building Press.
Pan, S., and Guo, J. L. (2024). Numerical study on dynamic responses and residual axial bearing capacity of square CFDST columns under lateral impact. J. Constr. Steel Res. 213 (2), 108427. doi:10.1016/j.jcsr.2023.108427
Qiu, M. H., Shao, X. D., Zhu, Y. P., Hussein, H. H., and Liu, Y. P. (2022). Tensile and flexural tests on ultrahigh performance concrete grouted sleeve connection. Struct. Concr. 24 (1), 703–720. doi:10.1002/suco.202200045
Qu, X. S., Xie, Y. N., Sun, Y. B., Sun, G. J., Deng, Y. X., and Qin, C. H. (2023). Study of mechanical properties of grouting defective sleeve. Structures 48, 1128–1140. doi:10.1016/j.istruc.2023.01.035
Tao, Z., Uy, B., Liao, F. Y., and Han, L. H. (2011). Nonlinear analysis of concrete-filled square stainless steel stub columns under axial compression. J. Constr. Steel Res. 67 (11), 1719–1732. doi:10.1016/j.jcsr.2011.04.012
Wang, Z. B., He, Y. Y., Yan, J., and Shao, H. J. (2022). Seismic performance analysis of welded steel mortise and tenon joint assembled concrete columns. J. Nanjing Tech Univ. Nat. Sci. Ed. 44 (02), 187–196. doi:10.3969/j.issn.1671-7627.2022.02.009
Wu, M., Liu, X., Liu, H. T., and Du, X. L. (2020). Seismic performance of precast short-leg shear wall using a grouting sleeve connection. Eng. Struct. 208, 110338. doi:10.1016/j.engstruct.2020.110338
Yu, A. P., Li, X. H., Fu, F., Chen, X. D., and Zhang, Y. (2023). Detection of sleeve grouting compactness based on acoustic emission technology. Materials 16 (4), 1455. doi:10.3390/ma16041455
Yu, Q., Kuang, X., and Fang, Y. Q. (2019). Experimental study on seismic behavior of precast frame column with vertical reinforcement spliced by grouted sleeve lapping connector. J. Tongji Univ. Nat. Sci. 47 (01), 18–28. doi:10.11908/j.issn.0253-374x.2019.01.003
Zhang, X. D., Li, L. S., Chen, W. P., and Yang, T. (2021). Experimental research on the seismic performance of a new type of prefabricated composite T-shaped column. J. Guangxi Univ. Nat. Sci. Ed. 46 (5), 1148–1156. doi:10.13624/j.cnki.issn.1001-7445.2021.1148
Zhang, Y. X., Huang, Z. W., Jin, B. W., and Cheng, M. Y. (2022). Seismic performance analysis of prefabricated vertical cable self-tapping bolt-core tube steel column joints. J. Beijing Univ. Civ. Eng. Archit. 38 (01), 65–73. doi:10.19740/j.2096-9872.2022.01.08
Keywords: precast concrete columns, steel connection, stud and anchor plate, axial compression performance, experimental and numerical research
Citation: Guo J, Li C, Chen M, Guo Y, Fu Q and Li Y (2025) Experimental and numerical research on axial compression performance of precast concrete columns with a novel steel connection. Front. Mater. 12:1579672. doi: 10.3389/fmats.2025.1579672
Received: 19 February 2025; Accepted: 08 May 2025;
Published: 21 May 2025.
Edited by:
Zhanyong Zhao, North University of China, ChinaReviewed by:
Chuanqing Fu, Zhejiang University of Technology, ChinaAli İhsan Çelik, Kayseri University, Türkiye
Copyright © 2025 Guo, Li, Chen, Guo, Fu and Li. This is an open-access article distributed under the terms of the Creative Commons Attribution License (CC BY). The use, distribution or reproduction in other forums is permitted, provided the original author(s) and the copyright owner(s) are credited and that the original publication in this journal is cited, in accordance with accepted academic practice. No use, distribution or reproduction is permitted which does not comply with these terms.
*Correspondence: Qiang Fu, ZnVxaWFuZ0Bmamp4dS5lZHUuY24=