 Shi He
 Jiaying Chen
 Kai Huang
 Jian Mao1
- 1College of Computer Engineering, Jimei University, Xiamen, Fujian, China
- 2China-Belarus “Belt and Road” Electromagnetic Environmental Effects Laboratory, China Electronics Technology Group Corporation 33rd Research Institute, Taiyuan, Shanxi, China
Introduction: Electromagnetic wave absorption materials reduce incoming wave energy, with machine learning focusing on data-driven design methods. Traditional multi-objective regression methods often fail to provide accurate component predictions, limiting their performance.
Method: We propose a multi-objective predictive model for absorbent compositions. Using single-variable predictions as cumulative features in a regression chain improves feature representation. Performance metrics identify the optimal predictor variables for material composition, aiding in the classification of carbon nanotubes based on required performance and predicted values.
Result and discussion: Experimental results indicate that the model achieves better
1 Introduction
Electromagnetic wave absorption (EWA) materials have become widely used in various applications Zeng et al. (2020); Lv et al. (2022); Lv et al. (2024). EWA materials capture electromagnetic waves, converting them into heat energy and reducing the negative effects of electromagnetic radiation Zeng et al. (2020). The absorbing material is made by combining a substrate with an absorbing agent, and a fixed thickness of a single layer of absorbing material will only provide effective absorption in certain frequency bands Li et al. (2023). Due to the low density and tunable conductivity of EWA materials, how to effectively predict the properties and compositions using data-driven methods is a key research focus in materials science and artificial intelligence Pollice et al. (2021).
Machine learning has progressed in material design. Wang et al. (2019) developed a machine learning system for discovering new copper alloys, utilizing error feedback to enable bidirectional design of properties and components to meet specific tensile strength and electrical conductivity requirements. Tayyebi et al. (2024) suggested using interpretable techniques for thin film preparation and SHAP analysis to identify units that influence water permeability positively and negatively. Machine learning has made strides in crystal graph networks and lens images, but it mainly depends on rich features. Predicting the property-composition of carbon-related EWA materials requires finite characteristic dimensions for designing associated variables. The traditional multi-objective regression method for predicting material composition and properties encounters the following challenges.
Feature Limitation. The prediction of EWA materials is constrained by limited features, typically thickness, mass fraction, and operating frequency. It is crucial to utilize data analysis or model prediction to expand the range of potential features to improve model predictions.
Chain Sequence. The order of the prediction chain impacts results. Two main methods for constructing prediction chains are the dependent correlation coefficient Melki et al. (2017) and exhaustive link averaging Masmoudi et al. (2020). Applying the prediction performance to obtain effective values during linking can improve composition design accuracy.
To solve the above two problems, a performance-based multi-object method (GBDT Performanced-guided Cumulative Chain, GPCC) was proposed to achieve numerical and categorical component prediction of EWA materials. To enhance the data features, we introduce the predicted value of a single feature within a multi-object framework, thereby reducing the impact of accumulated prediction errors. For the prediction chain of composition, we evaluated each variable in the training set and averaged the top
• A predictive accumulation strategy optimizes input features in a multi-objective framework. Due to limitations on available features in the data, results from a single model are used to improve the framework and reduce cumulative errors.
•The regression chain construction method for the numerical component of absorbent material has been implemented. The proposed method uses measured data to create a multi-objective regression framework, and identify optimal prediction indicators with the training data performance.
•A classification prediction method for carbon nanotube materials has been developed, using numerical predictions as input to validate the regression chain’s effectiveness.
This paper validates the proposed method through experiments on carbon EWA materials. The structure includes: Section 2 on intelligence material design and multi-objective prediction methods. Section 3 on the proposed method. Section 4 on the dataset and experimental setting. Section 5 on experimental results. Section 6 summarizes the conclusion.
2 Related Work
2.1 Intelligent material design
Intelligent material design technology has significantly improved the efficiency of new material research and development, from the microscopic to the production level. Noh et al. (2020) proposed reverse design to accelerate traditional material design by leveraging hidden knowledge in material data to predict properties, and developed an image-based generator framework named iMatGen Zeng et al. (2020). Han et al. (2023) created a generative model using a crystal diffusion variational auto-encoder to customize crystal structures based on desired compositions. The model employs a deep neural network to extract global features from the crystal’s physical properties and optimizes structures using density functional theory. Hu et al. (2022) added a formation energy predictor to improve the model’s potential space, ensuring that the generated structures are morphologically reasonable and energetically stable. These approaches highlight the potential of machine learning in designing and reverse engineering stable crystalline materials. The above methods highlight the potential of machine learning in designing stable new crystalline materials, especially for prediction and design.
Data-driven technology in absorber design improves performance prediction and the discovery of efficient absorbers. Nadell et al. (2019) used deep learning to predict transmittance spectra for all-dielectric surfaces based on ADM parameters. Hou et al. (2020) developed a deep neural network for on-demand meta-material design, calculating split ring resonator parameters from reflectivity. On et al. (2024) created an electromagnetic absorber using deep learning, integrating a variational auto-encoder with CMA-ES optimization for efficient meta-structure design in a specific frequency band.
2.2 Multi-objective regression
Multi-objective regression is a key area of machine learning that predicts multiple output variables from given input variables. The challenges of multi-objective regression can be addressed through algorithm-level and ensemble-level methods.
At the algorithmic level, single-objective regression methods are optimized for multi-objective scenarios. M-SVR Tuia et al. (2011) and MLS-SVR Xu et al. (2013) enhance support vector machine (SVM) techniques to optimize multiple outputs while considering their interrelationships and nonlinear correlations. Tran et al. (2024) found that SVM methods like ELS-SVR are ineffective for target component issues and suggested using artificial neural networks. They proposed a multi-output regression technique with gradient boosting and deep neural networks, training each layer on the residuals of the previous iteration’s squared loss function. Zheng et al. (2023) introduced a multi-objective prediction method using an adaptive dynamic genetic algorithm and adaptive moment estimation (ADGA-AM-ANN), which adds noise to the output and globally optimizes ANN.
At the ensemble level, regression chains sequentially concatenate multiple regression problems to predict target variables. Spyromitros-Xioufis et al. (2016) introduced the ensemble regression chain method, which incorporates previous target predictions as additional inputs. The maximum correlation chain model (SVRCC) Melki et al. (2017) builds on this concept, leveraging target correlations to enhance prediction performance and reduce computational complexity. Geiß et al. (2022) developed a regression chain ensemble method using repeated permutations to address insufficient multi-task objectives. This approach enhances the model’s ability to learn inter-task dependencies by propagating each target variable’s predicted values to subsequent models, thereby improving the accuracy of multi-variable predictions. The regression chain enhances prediction accuracy through multi-task concatenation and task relevance, and is widely used in energy materials estimation Yu et al. (2023), production process design Turetskyy et al. (2021), and material surface design Akhtar et al. (2024) in intelligent material design.
3 Methodology
3.1 Problem definition
We selected EWA materials from 1 GHz to 18 GHz working frequency and acquired the performance. By varying the components in carbon materials, we tested their dielectric constant and permeability. The sample preparation process is shown in Figure 1.
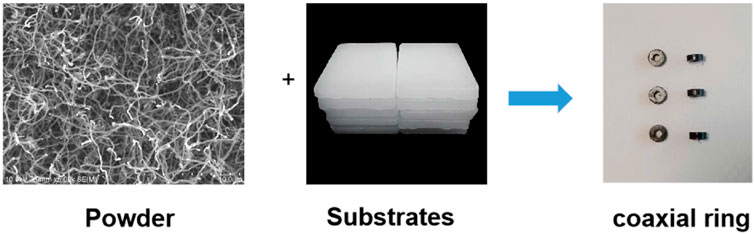
Figure 1. Prepare coaxial ring material using paraffin as the matrix material and carbon tube powder. Using mass fraction, thickness and operating frequency, the real part, imaginary part and tangent values of dielectric constant and permeability are obtained.
Permittivity and permeability as input
3.2 Base learner
There is a complex nonlinear relationship between properties and composition. Figure 2 shows the dielectric constant and permeability changes of
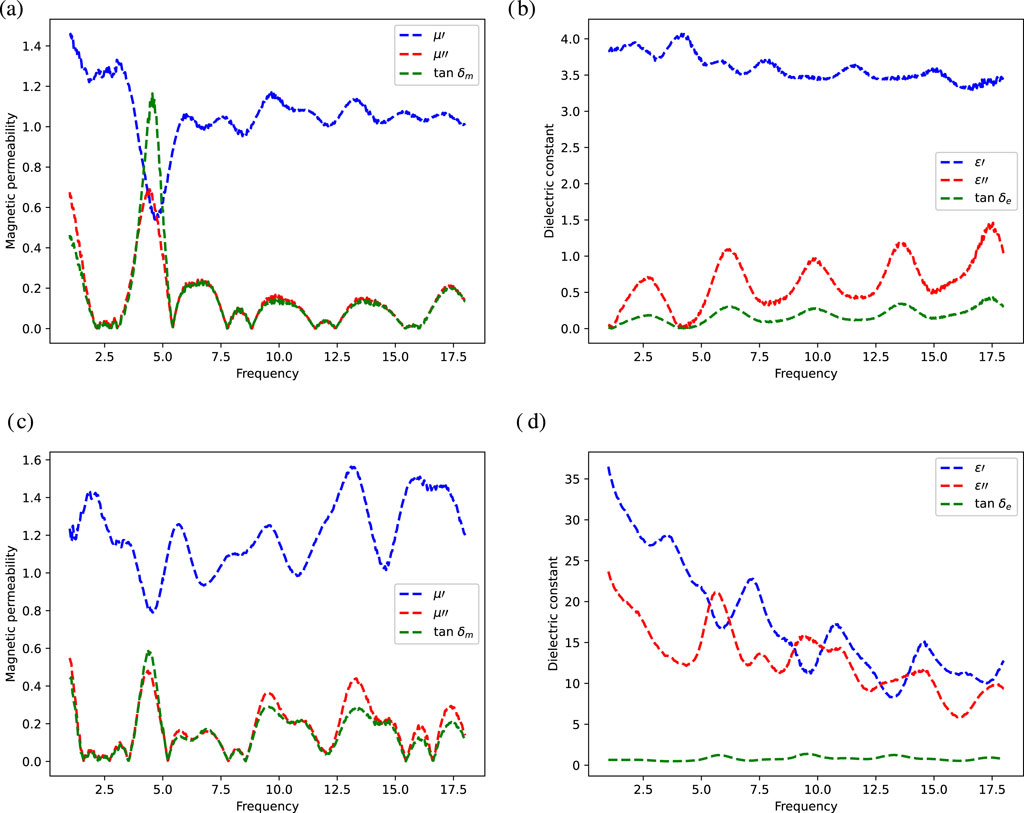
Figure 2. The variation trend of dielectric constant and permeability under different mass fraction, (a,c) describe the curves of magnetic permeanbility versus frequency, (b,d) describe the curves of dielectric constant versus frequency.
GBDT employs classification and regression trees as weak learners, where errors from each learner optimize subsequent predictions of EWA materials. Taking the composition of the EWA material as an example, the data composition is as follows:
where
The current decision tree
Obtain the expression for the strong learner
Among them,
3.3 Multi-target regression and value stacking
The cumulative strategy is a relearning procedure that increases data dimensions linearly with each iteration in the regression chain. According to Geiß et al. (2022), both non-cumulative and cumulative enhancements of the feature vector yield competitive predictions. Our accumulation strategy employs single variable prediction as the data dimension, with the
where
Various strategies exist for constructing regression chains. Geiß et al. (2022) expanded single-variable regression to multiple variables, creating chains that were alternately combined to find the optimal link. Wahid et al. (2023) utilized three different regression links for combined predictions, while Melki et al. (2017) based link ordering on the correlation coefficient between variables. However, correlation links may not align with regression performance, and accumulating errors can reduce the accuracy of subsequent predictors. For example, our tests showed that the predicted result for
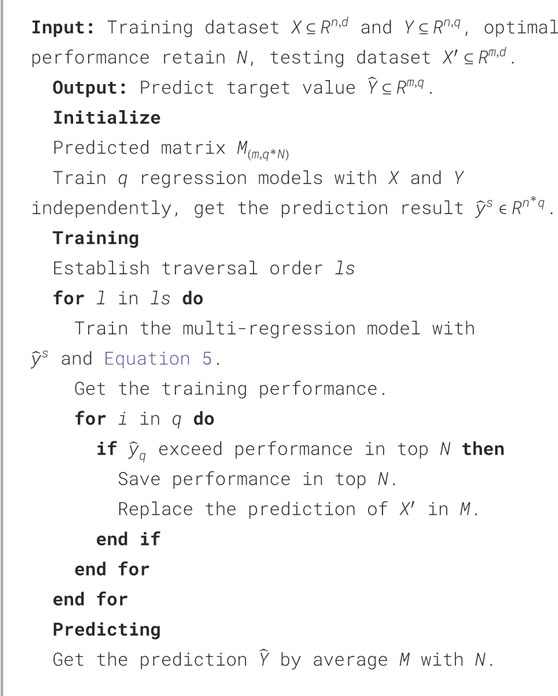
Algorithm 1.EWA Material Multi-object Regression.
3.4 EWA material classification
In material composition design, we analyze the training set’s performance and composition to derive numerical compositions and material types. We use observed material properties with
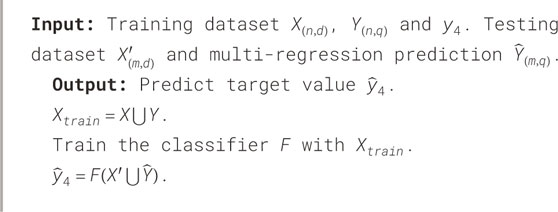
Algorithm 2.EWA material Classification.
The overall process flow is illustrated in Figure 3.
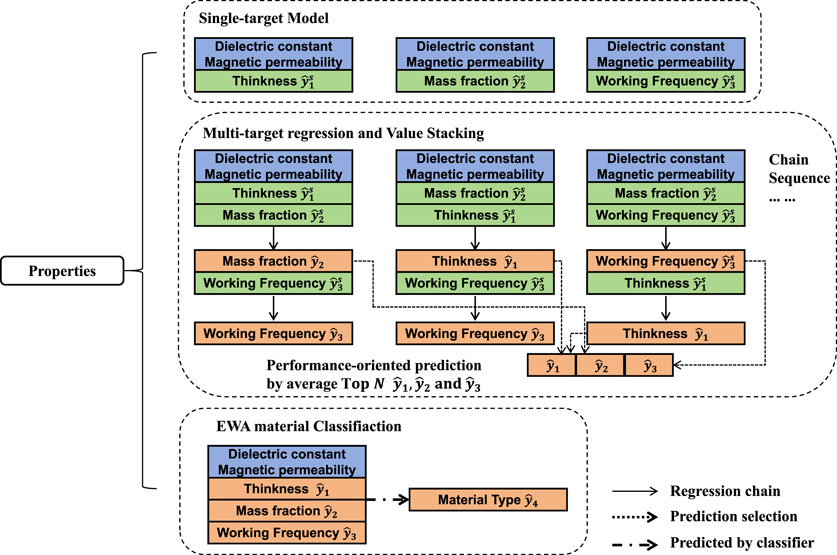
Figure 3. Material component prediction based on multi-target sequence and value stacking.
4 Experimental design
We analyzed two research questions through experiment.
Research question (RQ) 1: The effect of variable accumulation and result screening methods in Section 3.3 on material design.
RQ 2: The impact of GPCC on the prediction of material classification.
The experimental setup for the two problems is explained in Section 4, with analysis in Section 5.
4.1 Dataset description
Data for EWA material batches were collected: carbon nanotube
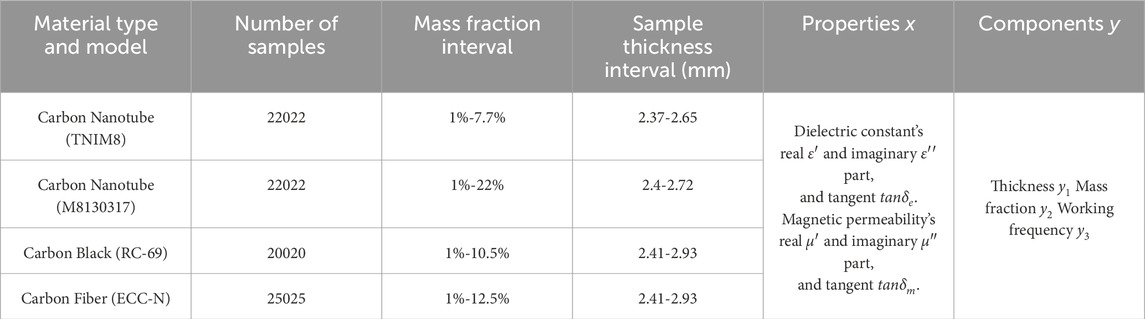
Table 1. Datail of Dataset.
Variations in feature dimensions and numerical ranges can affect their influence during model training, impacting performance and accuracy. Thus, data normalization for the experimental data, as shown in Equation 6.
In addition, the regression values
4.2 Comparison method and evaluation performance
The experiment aims to analyze the impact of chain sorting and compare it with other five GBDT-based or multi-regression methods.
• GPCC: Our proposed method, the parameters for the base leaner keep the same with GBDT.
•GBDT: Applying 300 trees with a maximum depth of 3. A minimum of 5 samples is required for splitting, with a learning rate of 0.05 and squared error as the loss function.
•
•GBNN Emami and Martínez-Muñoz (2023): Gradient boosted neural network is an additive model that approximates the objective function by sequential training and combining multiple sub-models into a multi-objective regression model. Using 300 neural networks, updating one at each step. It has a learning rate of 0.05 and employs the L-BFGS optimizer with a logistic activation function.
•GBDTMO Zhang and Jung (2020): GBDT for multiple outputs regression. Construct predictions for all variables or selected subsets at each leaf node by summing the target gains of all output variables. Sharing parameter settings with GBDT.
•SVRCC Melki et al. (2017): Finding the direction of maximum correlation among the targets and uses that order as the only chain.
We use
For RQ 2, we used GBDT as a classifier and used Accuracy (ACC) and Matthews Correlation Coefficient (MCC) to evaluate the test set. The calculation equations are shown in Equations 9, 10:
where TP indicates true positives, FN denotes false negatives, FP represents false positives, and TN signifies true negatives. ACC measures the proportion of correct predictions, while the MCC evaluates misclassifications, reducing the impact of sample imbalance on performance metrics.
5 Results and discussion
5.1 Performance of multi-regression
We use

Table 2.
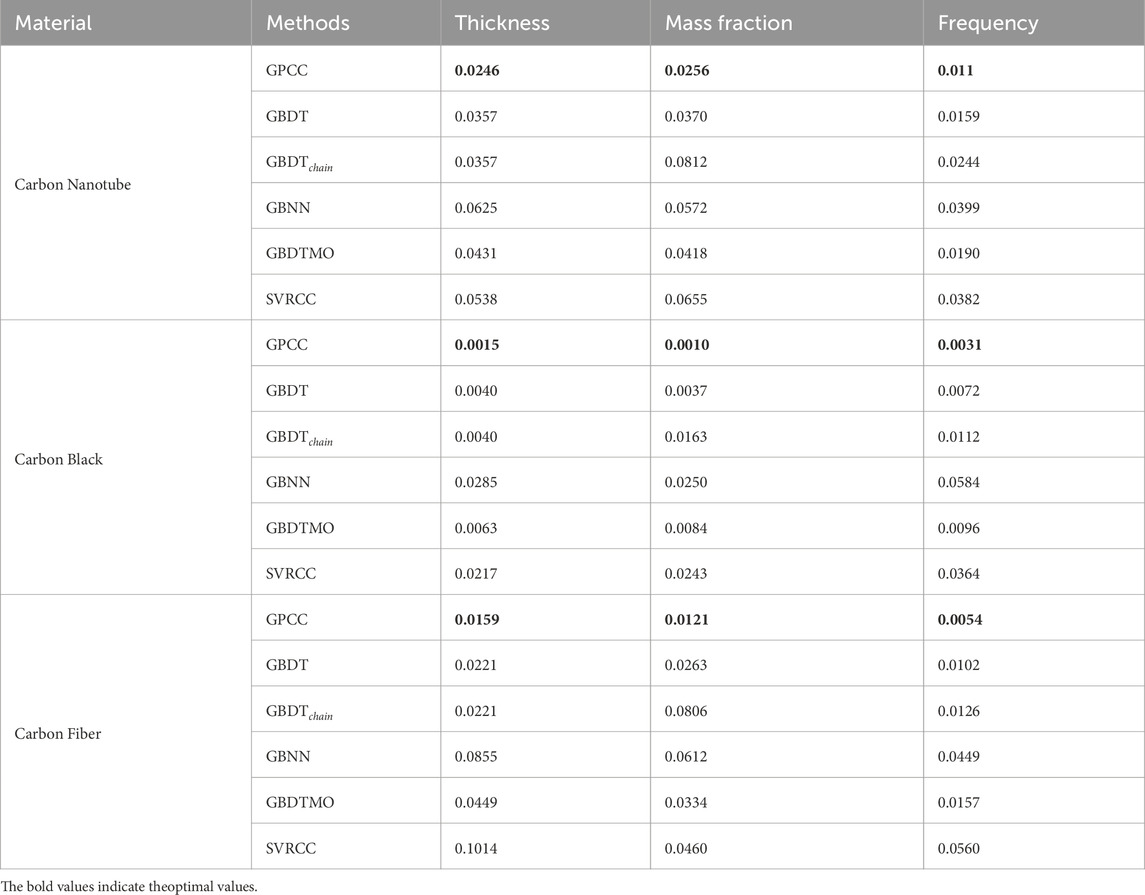
Table 3. MSE in compared methods.
The proposed GPCC demonstrates a significant improvement over alternative methodologies, achieving an average increase in
We examine the predictive capabilities of various methodologies for assessing the absorption characteristics of materials, specifically focusing on carbon black, carbon nanotubes, and carbon fibers. The performance of carbon black stabilizes at a mass fraction of
5.2 Performance of classification
Numerical predictions from five comparison algorithms were used to predict carbon nanotube types by combining material performance data. ACC and MCC evaluated their performance, with
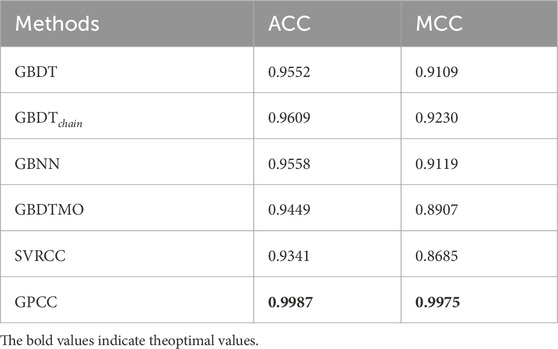
Table 4. ACC and MCC in compared methods, the best results are in bold.
Table 4 shows the ACC and MCC results from the five-fold cross-validation to improve the stability of the prediction. In the parameter search, we use actual properties and components as the training set and those predicted in Section 5.2 as the test set. We apply five-fold cross-validation to find optimal parameters and evaluate them with the test set. The parameter search candidates are: number of trees 10, 20, 30, learning rate 0.01, 0.1, 0.2, and maximum depth 3, 5, 7. Unlike other methods, GPCC does not have more misjudgments for positive classes. SVRCC is ineffective for regression but achieves about 0.93 accuracy in classification, emphasizing its performance importance. GPCC improved ACC and MCC by
In Figure 4, we list the importance of each feature when GBDT is used as a classifier. It can be seen that the features related to magnetic permeability are of relatively high importance for the classification of carbon nanotubes. The predicted values of
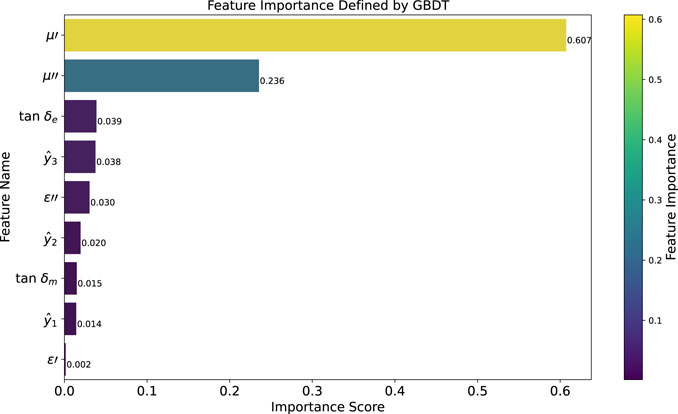
Figure 4. Feature importance in classification using GBDT.
5.3 Ablation experiment
To verify the influence of cumulative strategy on the prediction ability, we used
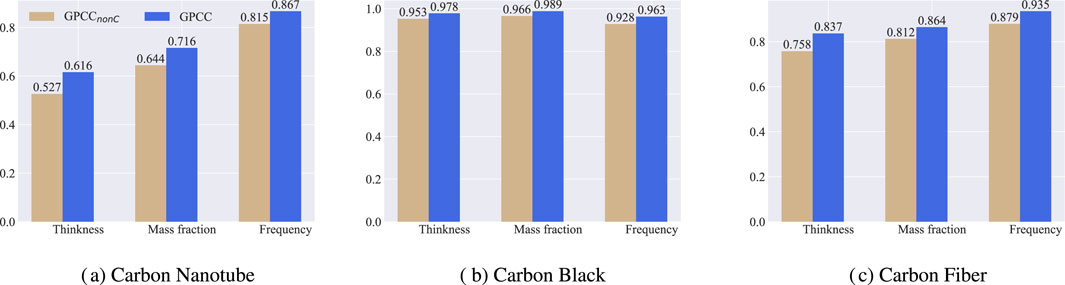
Figure 5. Effect of model complexity on
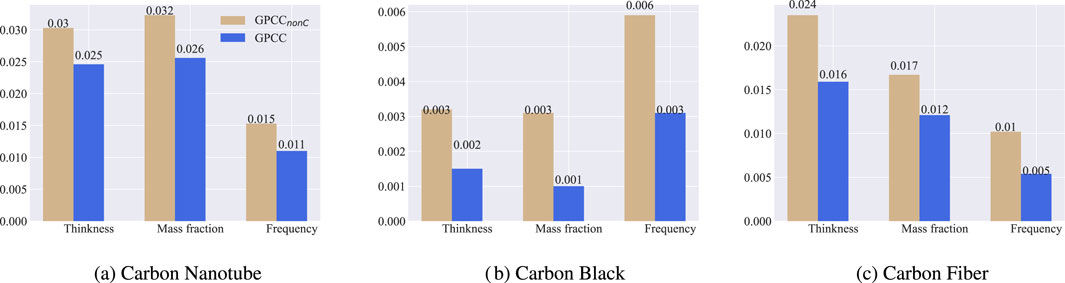
Figure 6. Effect of stacking prediction on MSE. (a–c) compare the prediction results of carbon nanotube,carbon black and carbon fiber for three component indexes.
The mean
To verify the influence of model parameters on the fitting effect, we used
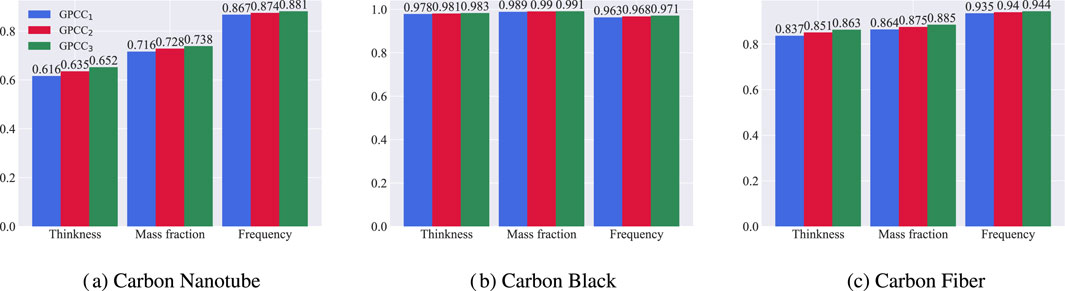
Figure 7. Effect of model complexity on
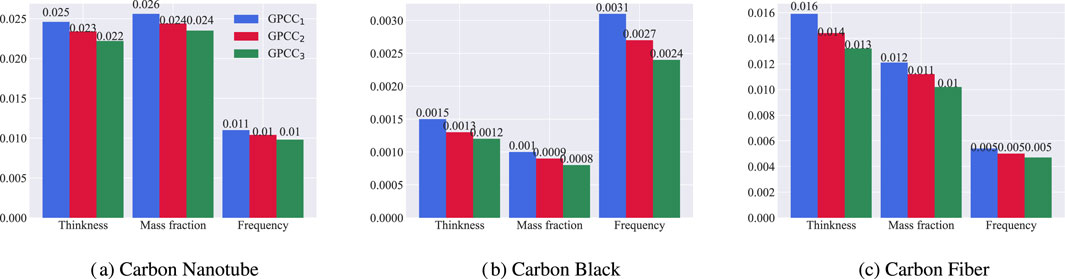
Figure 8. Effect of model complexity on MSE. (a–c) compare the prediction results of carbon nanotube,carbon black and carbon fiber for three component indexes.
6 Conclusion
We present a method for predicting the composition and category of absorbing materials using the GBDT model. A multi-objective regression framework enhances the accuracy of predictions regarding the composition and operational frequency of materials, such as carbon nanotubes. The amalgamation of regression outcomes with material properties enables a comprehensive analysis and prediction of material types.
To assess the efficacy of the proposed methodology, we performed experimental training on various datasets of absorbent materials. The regression model demonstrated a high level of precision in its predictions when compared to established algorithms. The GPCC model effectively captures intricate relationships among target variables and substantiates the feature-enhanced cumulative strategy for multi-objective regression. The prediction of material categories, derived from regression data, yielded elevated ACC and MCC scores, thereby improving material classification by eliminating irrelevant features. Future research may leverage semi-supervised data to advance the design of material compositions and facilitate the mixed predictions of multiple materials.
Data availability statement
The raw data supporting the conclusions of this article will be made available by the authors, without undue reservation.
Author contributions
SH: Methodology, Software, Writing – original draft. JC: Software, Validation, Writing – original draft. KH: Methodology, Validation, Writing – original draft. JM: Data curation, Resources, Writing – review and editing. KL: Data curation, Resources, Writing – review and editing. TL: Writing – review and editing.
Funding
The author(s) declare that financial support was received for the research and/or publication of this article. Kai Huang reports financial support was provided by Natural Science Foundation (2024J08197) of Fujian Province of China and the Startup Fund (ZQ2024001) of Jimei University. Kexun Li reports financial support from the National Key Laboratory on Electromagnetic Environment Effects (6142205230404) of China.
Acknowledgments
The authors would like to express our sincere gratitude and appreciation for the contributions throughout the course of this research paper.
Conflict of interest
Authors KL and TL were employed by China Electronics Technology Group Corporation 33th Research Institute.
The remaining authors declare that the research was conducted in the absence of any commercial or financial relationships that could be construed as a potential conflict of interest.
Generative AI statement
The author(s) declare that no Generative AI was used in the creation of this manuscript.
Publisher’s note
All claims expressed in this article are solely those of the authors and do not necessarily represent those of their affiliated organizations, or those of the publisher, the editors and the reviewers. Any product that may be evaluated in this article, or claim that may be made by its manufacturer, is not guaranteed or endorsed by the publisher.
References
Akhtar, S., Ali, R., and Ameen, S. M. (2024). “Predicting the surface elastic parameters of soft solids using multi-output decision tree regressor,” in AIP conference proceedings, 3168. Melville, NY: AIP Publishing, 020024. doi:10.1063/5.0219700AIP Conf. Proc.
Emami, S., and Martínez-Muñoz, G. (2023). Sequential training of neural networks with gradient boosting. IEEE Access 11, 42738–42750. doi:10.1109/access.2023.3271515
Geiß, C., Brzoska, E., Pelizari, P. A., Lautenbach, S., and Taubenböck, H. (2022). Multi-target regressor chains with repetitive permutation scheme for characterization of built environments with remote sensing. Int. J. Appl. Earth Observation Geoinformation 106, 102657. doi:10.1016/j.jag.2021.102657
Han, S., Lee, J., Han, S., Moosavi, S. M., Kim, J., and Park, C. (2023). Design of new inorganic crystals with the desired composition using deep learning. J. Chem. Inf. Model. 63, 5755–5763. doi:10.1021/acs.jcim.3c00935
Hou, Z., Tang, T., Shen, J., Li, C., and Li, F. (2020). Prediction network of metamaterial with split ring resonator based on deep learning. Nanoscale Res. Lett. 15, 83–88. doi:10.1186/s11671-020-03319-8
Hu, P., Ge, B., Liu, Y., and Huang, W. (2022). “Energy-constrained crystals wasserstein gan for the inverse design of crystal structures,” in Proceedings of the 8th international conference on computing and artificial intelligence, 24–31.
Li, H., Cao, Z., Xia, Y., Yao, G., Miao, L., and Jiang, J. (2023). Dispersion manipulation method for ultrahigh frequency band reconfigurable absorbers. IEEE Trans. Antennas Propag. 72, 1983–1988. doi:10.1109/tap.2023.3330635
Lv, H., Cui, J., Li, B., Yuan, M., Liu, J., and Che, R. (2024). Insights into civilian electromagnetic absorption materials: challenges and innovative solutions. Adv. Funct. Mater. 35, 2315722. doi:10.1002/adfm.202315722
Lv, H., Yang, Z., Pan, H., and Wu, R. (2022). Electromagnetic absorption materials: current progress and new frontiers. Prog. Mater. Sci. 127, 100946. doi:10.1016/j.pmatsci.2022.100946
Masmoudi, S., Elghazel, H., Taieb, D., Yazar, O., and Kallel, A. (2020). A machine-learning framework for predicting multiple air pollutants’ concentrations via multi-target regression and feature selection. Sci. Total Environ. 715, 136991. doi:10.1016/j.scitotenv.2020.136991
Melki, G., Cano, A., Kecman, V., and Ventura, S. (2017). Multi-target support vector regression via correlation regressor chains. Inf. Sci. 415, 53–69. doi:10.1016/j.ins.2017.06.017
Nadell, C. C., Huang, B., Malof, J. M., and Padilla, W. J. (2019). Deep learning for accelerated all-dielectric metasurface design. Opt. express 27, 27523–27535. doi:10.1364/oe.27.027523
Noh, J., Gu, G. H., Kim, S., and Jung, Y. (2020). Machine-enabled inverse design of inorganic solid materials: promises and challenges. Chem. Sci. 11, 4871–4881. doi:10.1039/d0sc00594k
On, H.-I., Jeong, L., Seo, T.-M., Jo, Y., Choi, W., Kang, D.-J., et al. (2024). Novel method of performance-optimized metastructure design for electromagnetic wave absorption in specific band using deep learning. Eng. Appl. Artif. Intell. 137, 109274. doi:10.1016/j.engappai.2024.109274
Pollice, R., dos Passos Gomes, G., Aldeghi, M., Hickman, R. J., Krenn, M., Lavigne, C., et al. (2021). Data-driven strategies for accelerated materials design. Accounts Chem. Res. 54, 849–860. doi:10.1021/acs.accounts.0c00785
Spyromitros-Xioufis, E., Tsoumakas, G., Groves, W., and Vlahavas, I. (2016). Multi-target regression via input space expansion: treating targets as inputs. Mach. Learn. 104, 55–98. doi:10.1007/s10994-016-5546-z
Tayyebi, A., Alshami, A. S., Tayyebi, E., Buelke, C., Talukder, M. J., Ismail, N., et al. (2024). Machine learning–driven surface grafting of thin-film composite reverse osmosis (tfc-ro) membrane. Desalination 579, 117502. doi:10.1016/j.desal.2024.117502
Tran, N. K., Kühle, L. C., and Klau, G. W. (2024). A critical review of multi-output support vector regression. Pattern Recognit. Lett. 178, 69–75. doi:10.1016/j.patrec.2023.12.007
Tuia, D., Verrelst, J., Alonso, L., Pérez-Cruz, F., and Camps-Valls, G. (2011). Multioutput support vector regression for remote sensing biophysical parameter estimation. IEEE Geoscience Remote Sens. Lett. 8, 804–808. doi:10.1109/lgrs.2011.2109934
Turetskyy, A., Wessel, J., Herrmann, C., and Thiede, S. (2021). Battery production design using multi-output machine learning models. Energy Storage Mater. 38, 93–112. doi:10.1016/j.ensm.2021.03.002
Wahid, M. F., Tafreshi, R., Khan, Z., and Retnanto, A. (2023). Multiphase flow rate prediction using chained multi-output regression models. Geoenergy Sci. Eng. 231, 212403. doi:10.1016/j.geoen.2023.212403
Wang, C., Fu, H., Jiang, L., Xue, D., and Xie, J. (2019). A property-oriented design strategy for high performance copper alloys via machine learning. npj Comput. Mater. 5, 87. doi:10.1038/s41524-019-0227-7
Xu, S., An, X., Qiao, X., Zhu, L., and Li, L. (2013). Multi-output least-squares support vector regression machines. Pattern Recognit. Lett. 34, 1078–1084. doi:10.1016/j.patrec.2013.01.015
Yu, H., Yang, K., Zhang, L., Wang, W., Ouyang, M., Ma, B., et al. (2023). Multi-output ensemble deep learning: a framework for simultaneous prediction of multiple electrode material properties. Chem. Eng. J. 475, 146280. doi:10.1016/j.cej.2023.146280
Zeng, X., Cheng, X., Yu, R., and Stucky, G. D. (2020). Electromagnetic microwave absorption theory and recent achievements in microwave absorbers. Carbon 168, 606–623. doi:10.1016/j.carbon.2020.07.028
Zhang, Z., and Jung, C. (2020). Gbdt-mo: gradient-boosted decision trees for multiple outputs. IEEE Trans. neural Netw. Learn. Syst. 32, 3156–3167. doi:10.1109/tnnls.2020.3009776
Keywords: electromagnetic wave absorption material, carbon nanotube, multi-object regression, material classification, GBDT
Citation: He S, Chen J, Huang K, Mao J, Li K and Liu T (2025) Absorbent material composition prediction based on multi-objective regression with value stacking and selection. Front. Mater. 12:1610601. doi: 10.3389/fmats.2025.1610601
Received: 12 April 2025; Accepted: 18 June 2025;
Published: 07 July 2025.
Edited by:
Habil. Maria Brzhezinskaya, Helmholtz Center Berlin for Materials and Energy, GermanyReviewed by:
Yenan Song, East China Normal University, ChinaJiashun Mao, Yonsei University, Republic of Korea
Copyright © 2025 He, Chen, Huang, Mao, Li and Liu. This is an open-access article distributed under the terms of the Creative Commons Attribution License (CC BY). The use, distribution or reproduction in other forums is permitted, provided the original author(s) and the copyright owner(s) are credited and that the original publication in this journal is cited, in accordance with accepted academic practice. No use, distribution or reproduction is permitted which does not comply with these terms.
*Correspondence: Kai Huang, a2FpaHVhbmdAam11LmVkdS5jbg==