 Qiang Wen†
 Zhuo Qian
 Guoyou Gan
- Faculty of Materials Science and Engineering, Kunming University of Science and Technology, Kunming, China
Introduction: Accurate prediction of flow stress during the hot deformation of 7075 aluminum alloy is essential yet challenging, as conventional constitutive models are often inaccurate and artificial neural network (ANN) approaches are computationally complex.
Methods: Hot compression experiments on as-rolled 7,075 aluminum alloy were carried out using a TA DIL805D thermal simulator over a temperature range of 573–733 K and strain rates between 0.001 and 1.0 s-1. The resulting experimental data were subsequently used to train four machine learning models—decision tree, random forest, support vector machine, and XGBoost—for predicting the flow stress of annealed 7,075 aluminum alloy. Model performance was evaluated through residual analysis and several statistical indicators, including mean absolute error (MAE), mean squared error (MSE), average absolute relative error (AARE), correlation coefficient (R), and coefficient of determination (R2).
Results: The results demonstrate that, compared with previously reported artificial neural network (ANN) models, these four machine learning approaches achieve comparable predictive accuracy (up to 99.9%).
Discussion: While offering a simpler and more efficient model construction process.
1 Introduction
7,075 aluminum alloy is renowned for its high specific strength, excellent fracture toughness, and good corrosion resistance, making it one of the most widely used alloys in the 7,000 series 00. These properties render it critical for manufacturing structural components in aerospace and automotive applications00. Hot deformation is essential for producing high-quality parts, with temperature, strain, and strain rate significantly influencing the process 00. Under various hot deformation conditions, micro structural mechanisms such as dynamic recovery, dynamic recrystallization, precipitation, and dissolution occur, which directly affect flow stress behavior00. Thus, understanding the hot deformation behavior of 7,075 aluminum alloy is crucial for optimizing processing parameters to achieve improved micro structure and mechanical properties.
Conventional constitutive models, such as the strain-compensated Arrhenius model (SCAM) (Chen et al., 2015), have been commonly used to predict flow stress, yet they often exhibit limited accuracy (with AARE between 4.5% and 8.5%). Artificial Neural Networks (ANN) have emerged as a powerful alternative, capturing complex nonlinear relationships and achieving errors below 1% AARE (Gupta et al., 2019; Shokry et al., 2019; Li et al., 2019; Luo et al., 2021). However, ANN models (Zhu et al., 2020; Zhao et al., 2014; Sabokpa et al., 2012) require extensive architectural tuning and computational resources, limiting their practicality.
Although the modified Arrhenius model improves flow stress prediction accuracy compared to strain-insensitive models, it still exhibits notable deviations due to errors introduced by multiple linear regression during parameter identification (Wang et al., 2021; Zhang et al., 2018). Artificial Neural Networks (ANN) have emerged as a promising alternative, capable of capturing complex nonlinear relationships without recurring regression, often achieving prediction errors within 1% AARE (Li et al., 2020; Ma et al., 2023). However, ANN models suffer from significant drawbacks: their construction requires meticulous design of hidden layers and neuron counts, which lacks theoretical guidance and typically relies on exhaustive experimental tuning. Moreover, ANN models generally exhibit slow convergence, often requiring hundreds or thousands of iterations even for simple problems.
Recent research has increasingly focused on hybrid and ensemble artificial intelligence (AI) models to overcome these limitations (Rezaei Ashtiani and Shahsavari, 2016; Rezaei Ashtiani and Shahsavari). For instance, Genetic Algorithm-optimized ANN (ANN-GA) and Grey Wolf Optimizer-enhanced Support Vector Regression (GWO-SVR) have demonstrated significant improvements in prediction accuracy and convergence speed (Guan et al., 2023; Chen et al., 2021; Guo et al., 2020). Ensemble methods such as Random Forest (RF) and Gradient Boosting Decision Tree (GBDT) enhance robustness and generalization through multi-learner integration (Dai et al., 2019; Zhang et al., 2021). Notably, hybrid approaches like GWO-RF and GWO-BPNN have shown superior performance in both interpolation and extrapolation contexts for high-temperature flow stress prediction (Yao and Bu, 2025). More recently, Physics-Informed Machine Learning (Liu et al., 2025) (PIML) has further advanced the field by embedding physical laws into learning processes, improving extrapolation capability and interpretability.
Despite these advancements, relatively few studies have explored ensemble learning methods, such as random forest, for constitutive modeling. This study employs four machine learning models—Decision Tree (DT), Random Forest (RF), Support Vector Regression (SVR), and XGBoost—to predict the flow stress of as-rolled 7,075 aluminum alloy. These models were selected as efficient alternatives to Artificial Neural Networks (ANN) due to their comparable predictive accuracy, simplified model construction, and reduced computational requirements. Compared to ANN models, which often entail complex architecture tuning and prolonged training, DT, RF, SVR, and XGBoost achieve similar performance (e.g., R2 ≈ 99.9%) while offering greater interpret ability, faster training, and minimal hyper parameter tuning. Model performance was evaluated using residual analysis, mean absolute error (MAE), mean absolute error (MSE), mean absolute relative error (AARE), correlation coefficient (R), and coefficient of determination (R2), confirming their suitability for modeling hot deformation behavior.
2 Materials
Table 1 lists the chemical composition of the annealed 7,075 aluminum alloy used in this study.
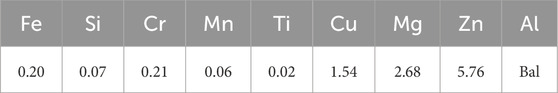
Table 1. Chemical composition (weight percentage) of annealed 7,075 aluminum alloy (Yang et al., 2021).
The diameter of the cylindrical samples was 10 mm and the height was 5.0 mm. The hot compression test is a material testing method used to evaluate the properties of materials at high temperatures and under different strain rates. The specific analysis is as follows:
1. Experimental Equipment and Conditions: The experiment was carried out on a TADIL805D, which is a high-precision dilatometer used to measure the length change of materials during the heating or cooling process.
2. Temperature and Strain Rate: The experiment involved five different temperatures (460, 420, 380, 340, and 300K) and four different strain rates (1.0, 0.1, 0.01, and 0.001s-1). These conditions covered the range from room temperature to relatively high temperatures as well as deformation rates from fast to slow.
3. Heating and Soaking Process: The samples were heated from room temperature to the target temperature at a rate of 5K, and then held at the target temperature for 5 min to ensure temperature uniformity.
4. Compression and Cooling: The compression was stopped when the true strain reached 0.8, and then the samples were immediately cooled to room temperature at a rate of 50K/s to fix their micro structure.
5. Data Collection and Processing: Stress and strain data were obtained through a high-precision measurement system to ensure the accuracy and reliability of the data.
6. Data Analysis and Model Building: A total of 300 data points were systematically extracted from hot compression tests conducted under the thermal-mechanical conditions illustrated in the figure. These tests encompassed five temperature levels (573 K, 613 K, 653 K, 693 K, and 733 K) with a heating rate of 5 K/s, a 5-min isothermal holding at each target temperature, three strain rates (0.001 s-1, 0.01 s-1, and 0.1 s-1) during deformation, and subsequent cooling to room temperature (RT) at 50 K/s. To ensure comprehensive coverage of deformation behavior, the data points were uniformly sampled across a strain range of 0–1.0 at 0.05 intervals, with 20 points allocated to each combination of temperature and strain rate (5 temperatures × 3 strain rates × 20 points = 300 total points). For model development, the dataset was partitioned using stratified sampling into a training set (70%, 210 points) and a test set (30%, 90 points). This stratification preserved the proportional distribution of each temperature-strain rate subgroup in both sets (e.g., 14 training points and 6 test points per subgroup), ensuring balanced representation of the entire parameter space. These data were utilized to build equations describing the material behavior.
7. Illustration of the Experimental Scheme: Figure 1 shows the detailed experimental scheme, including the steps of heating, soaking, compression, and cooling, as well as the selection and recording methods of data points.
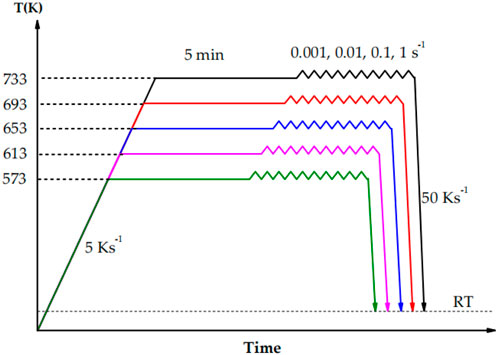
Figure 1. Schematic diagram of the compression experiment (Yang et al., 2021).
When analyzing the stress-strain curves, the flow stress increased rapidly in the initial stage of deformation, indicating a strong work hardening phenomenon. The strain rate was found to have a pronounced effect on the flow stress of the material. Specifically: 1. Behavior at low strain rates: Under low strain rate conditions (such as 0.001 and 0.01s-1), the flow stress did not have an obvious peak but remained in a relatively stable flow state. This indicates that at slower deformation rates, the work hardening and dynamic softening processes are balanced, enabling the material to maintain stable plastic deformation. 2. Behavior at high strain rates: Under high strain rate conditions (such as 0.1 and 1.0s-1), the flow stress showed an obvious peak and then gradually decreased and finally stabilized. The appearance of this peak indicates that in the early stage of rapid deformation, work hardening dominates. As the deformation continues, dynamic softening mechanisms (such as dynamic recovery and rearrangement of dislocations) start to play a role, resulting in a stress decrease.
Influence of temperature on flow stress: As the deformation temperature increases, the flow stress level decreases. This is because high temperature provides more thermal energy, which promotes the movement and rearrangement of dislocations, thereby reducing the strength of the material. High temperature also leads to a decrease in the critical shear stress of the alloy, making the slip systems easier to activate and further promoting the dislocation slip and dynamic softening processes. Influence of strain rate on flow stress: An increase in strain rate will lead to an increase in flow stress. This is because a high strain rate means a faster deformation speed, reducing the time for the material to respond, and making the work hardening effect more significant. Under high strain rates, softening mechanisms (such as the annihilation and rearrangement of dislocations) do not have enough time to operate, resulting in more dislocations accumulated inside the material and an increase in flow stress. Non-linear relationship: The relationship between flow stress and temperature as well as strain rate is not a simple linear one. This is because the behavior of the material is affected by multiple complex mechanisms working together, including dislocation dynamics, grain boundary slip, phase transformation, etc. Under different temperature and strain rate conditions, the relative importance of these mechanisms will change, resulting in the change in flow stress showing complex non-linear characteristics.
3 Machine learning methods
Decision Tree (DT) is a supervised learning method that recursively partitions data into subsets using decision rules based on feature values, forming a tree structure where internal nodes represent features, branches represent feature values, and leaf nodes provide final predictions. Key steps include feature selection (using criteria such as information gain or Gini impurity), splitting the dataset, recursively building subtrees, and generating leaf nodes when stopping conditions—such as uniform class labels or maximum depth—are met.
Random Forest (RF) operates by constructing multiple decision trees, which are inherently non-linear models. It excels at capturing the complex, segmented relationships between temperature, strain, and stress without requiring prior transformation of the input data. By measuring the mean decrease in impurity, RF can quantitatively rank input features. This directly reveals the significance of the strain-temperature interaction term and other processing parameters, providing valuable physical insight into the dominant factors controlling flow stress. RF performs well on small to medium-sized datasets (e.g., 100–10,000 points) due to its ensemble averaging, which reduces variance. However, its training time can become computationally expensive for very large datasets.
Support Vector Regression (SVR) is a regression technique derived from support vector machines, designed to model complex relationships by fitting a function while maintaining a margin of tolerance (ε-insensitive band). SVR’s primary strength is handling non-linear relationships through the kernel trick. By employing a non-linear kernel, SVR can map the original input features into a higher-dimensional space where a linear separator can effectively model the highly non-linear flow stress behavior. A well-tuned RBF kernel can effectively model the coupled effect of strain and temperature without the need for manual feature engineering. SVR is particularly powerful for small to medium-sized datasets where its ability to find a global optimum and maximize margin helps prevent overfitting. Its performance can degrade with very large datasets (>10,000 samples) as training time scales sharply.
XGBoost (Extreme Gradient Boosting) is a scalable and efficient machine learning library based on gradient boosting, designed for fast and accurate modeling across large-scale datasets. It extends the traditional Gradient Boosting Decision Tree (GBDT) framework by incorporating regularization terms to control model complexity and reduce overfitting. Key innovations include the use of second-order Taylor expansion to approximate the objective function, an approximate greedy algorithm for optimal splitting, and built-in support for handling missing values. As a boosted tree-based algorithm, XGBoost sequentially builds trees that correct the errors of previous ones. This makes it exceptionally powerful at learning complex non-linear patterns and subtle intricacies in the flow stress data that other models might miss, often leading to state-of-the-art prediction accuracy. Similar to RF.
For a Back Propagation Artificial Neural Network (BP–ANN) model used in (Yang et al., 2021), the selection of the number of network layers and the number of neurons is usually based on experience and practice, and there is no clear theoretical guidance. This is because the complexity and non - linear characteristics of neural networks make their behavior difficult to predict accurately. Generally speaking, the selection of the number of network layers depends on the complexity of the problem and the size of the data set. For simple problems and smaller data sets, fewer network layers are sufficient to achieve good performance. Compared with complex problems and large - scale data sets, deeper networks can provide better learning and representation capabilities. When choosing the number of neurons, it needs to be determined according to the complexity of the problem and the size of the data set. A smaller number of neurons may lead to under - fitting, and a larger number of neurons may lead to over - fitting. A common practice is to use methods such as cross - validation to select an appropriate number of neurons to achieve the best performance on the training and validation sets. Overall, the selection of the number of network layers and the number of neurons is a practical problem and needs to be adjusted and optimized in combination with the characteristics of the problem and experimental result. The architecture of the Back-Propagation Artificial Neural Network (BP-ANN) model used in this study, which consists of an input layer, two hidden layers, and an output layer, is illustrated in Figure 2 (Yang et al., 2021).
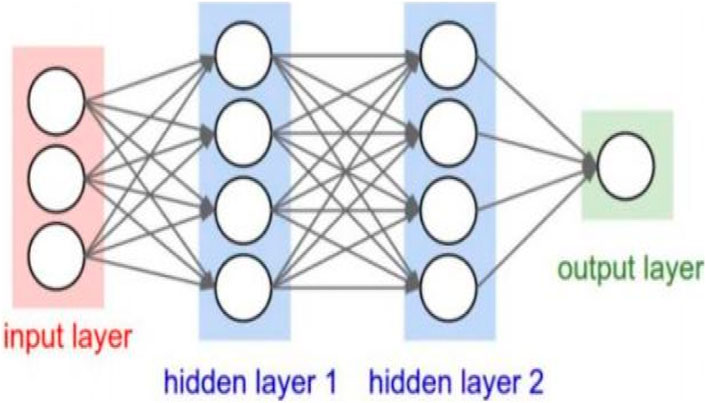
Figure 2. Structure of the BP-ANN model (Yang et al., 2021).
4 Analysis and discussion
To evaluate the quality of the established models, This study utilized five major statistical metrics to assess (MAE, MSE, R, AARE, R2). MAE (Mean Absolute Error), which measures the average of the absolute errors between the predicted values and the actual values, indicates better model performance when it is closer to 0. As an important indicator for evaluating the performance of regression models, MAE provides an intuitive way to understand the magnitude of prediction errors. The formula is as follows Equation 1:
MSE (Mean Squared Error) is the mean of the sum of the squares of the errors at the corresponding points of the predicted data and the experimental data. It is also used to measure the gap between the predicted values and the true values. MSE is sensitive to outliers (because when the difference between an outlier and a normal value is relatively large, the error will be greater than 1, and the value will be further increased after taking the square). However, it can reflect the distribution of prediction errors. The formula is as follows Equation 2:
The correlation coefficient R, which measures the linear relationship between experimental and predicted values, is calculated as shown in Equation 3:
AARE (Average Relative Error) is a widely used statistical indicator, which is the average value of all individual relative errors and is used to evaluate the relative error level between experimental results and true values. It reflects the accuracy and stability of measurement data. The formula is as follows (Li et al., 2019) Equation 4:
·
Here, n represents the number of samples;
All data were randomly shuffled and split into 80% training and 20% testing, following standard practice. Table 2 summarizes the performance results of the different models on the test dataset. As shown, all four models achieved prediction accuracy comparable to the BP-ANN reported in (Yang et al., 2021), despite being trained with relatively simple parameter settings rather than extensive hyperparameter tuning. Specifically, for DT, the maximum tree depth was set to 12; for RF, the number of estimators was set to 100 with a maximum depth of 9 for each tree; for SVR, we used the RBF kernel with kernel coefficient set to 20 and regularization parameter set to 10,000; and for XGBoost, we used 100 estimators with a maximum depth of 9. Among these, SVR achieved better performance than the other three tree-based models. This advantage can be attributed to the maximum-margin principle of SVR, which fits a function within an ε-insensitive tube while maximizing the margin around the regression hyperplane. Consequently, SVR produces smooth and continuous functions that generalize well when the underlying relationship is smooth rather than discontinuous. In contrast, tree-based models partition the feature space into discrete regions, yielding piecewise-constant predictions. This often introduces step-like artifacts and limits extrapolation beyond the training domain.
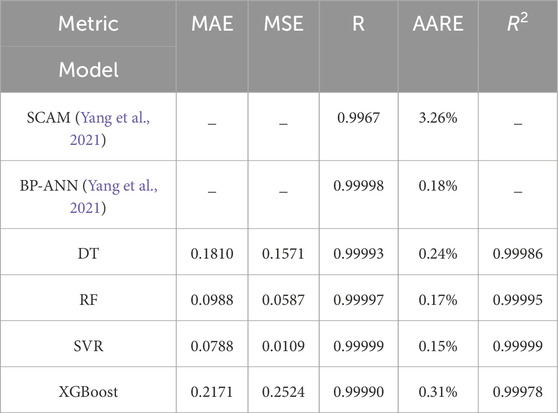
Table 2. Error and correlation analysis of different models.
It is noteworthy that XGBoost performed the worst among the four models in this study, despite the fact that it typically outperforms a single Decision Tree (DT) and often surpasses Random Forest (RF) in other applications. This discrepancy can be attributed to the lack of hyperparameter tuning in our experiments. In particular, parameters such as the learning rate, regularization strength, and subsampling ratios were not optimized. With the default learning rate (0.3) and relatively deep trees, boosting can easily overfit, especially when applied to small datasets. In contrast, RF is inherently more robust under default settings, as it reduces variance by averaging predictions across many uncorrelated trees. While XGBoost generally excels on large and complex datasets with strong nonlinear feature interactions, our dataset is relatively small (we employed the same dataset as that used in (Yang et al., 2021)). Under such conditions, RF or even a single DT may perform equally well, if not better. In small-sample regimes, the iterative corrections of boosting tend to chase noise rather than improve generalization.
The residual between the predicted and actual values is an important indicator for evaluating model accuracy. Figure 3 illustrates the residual distributions of the four different models. According to (Yang et al., 2021), the SCAM model exhibits residuals of approximately ±8 MPa, indicating a relatively large error between predictions and experimental values. In contrast, the BP-ANN model achieves residuals within ±1 MPa, reflecting much higher accuracy. In Figure 3, both the DT and RF models show residuals of about ±2 MPa, while the SVR model achieves residuals within ±1 MPa. The XGBoost model, however, yields residuals of approximately ±4 MPa. These results highlight the performance differences among the models. Overall, the BP-ANN and SVR models demonstrated the best predictive performance, with the smallest residuals and highest accuracy, whereas the remaining three models also achieved relatively close and acceptable results. This suggests that methods capable of producing smooth functional approximations, such as SVR and ANN, are particularly well suited for modeling the stress–strain relationship, which is inherently continuous and smooth in nature.
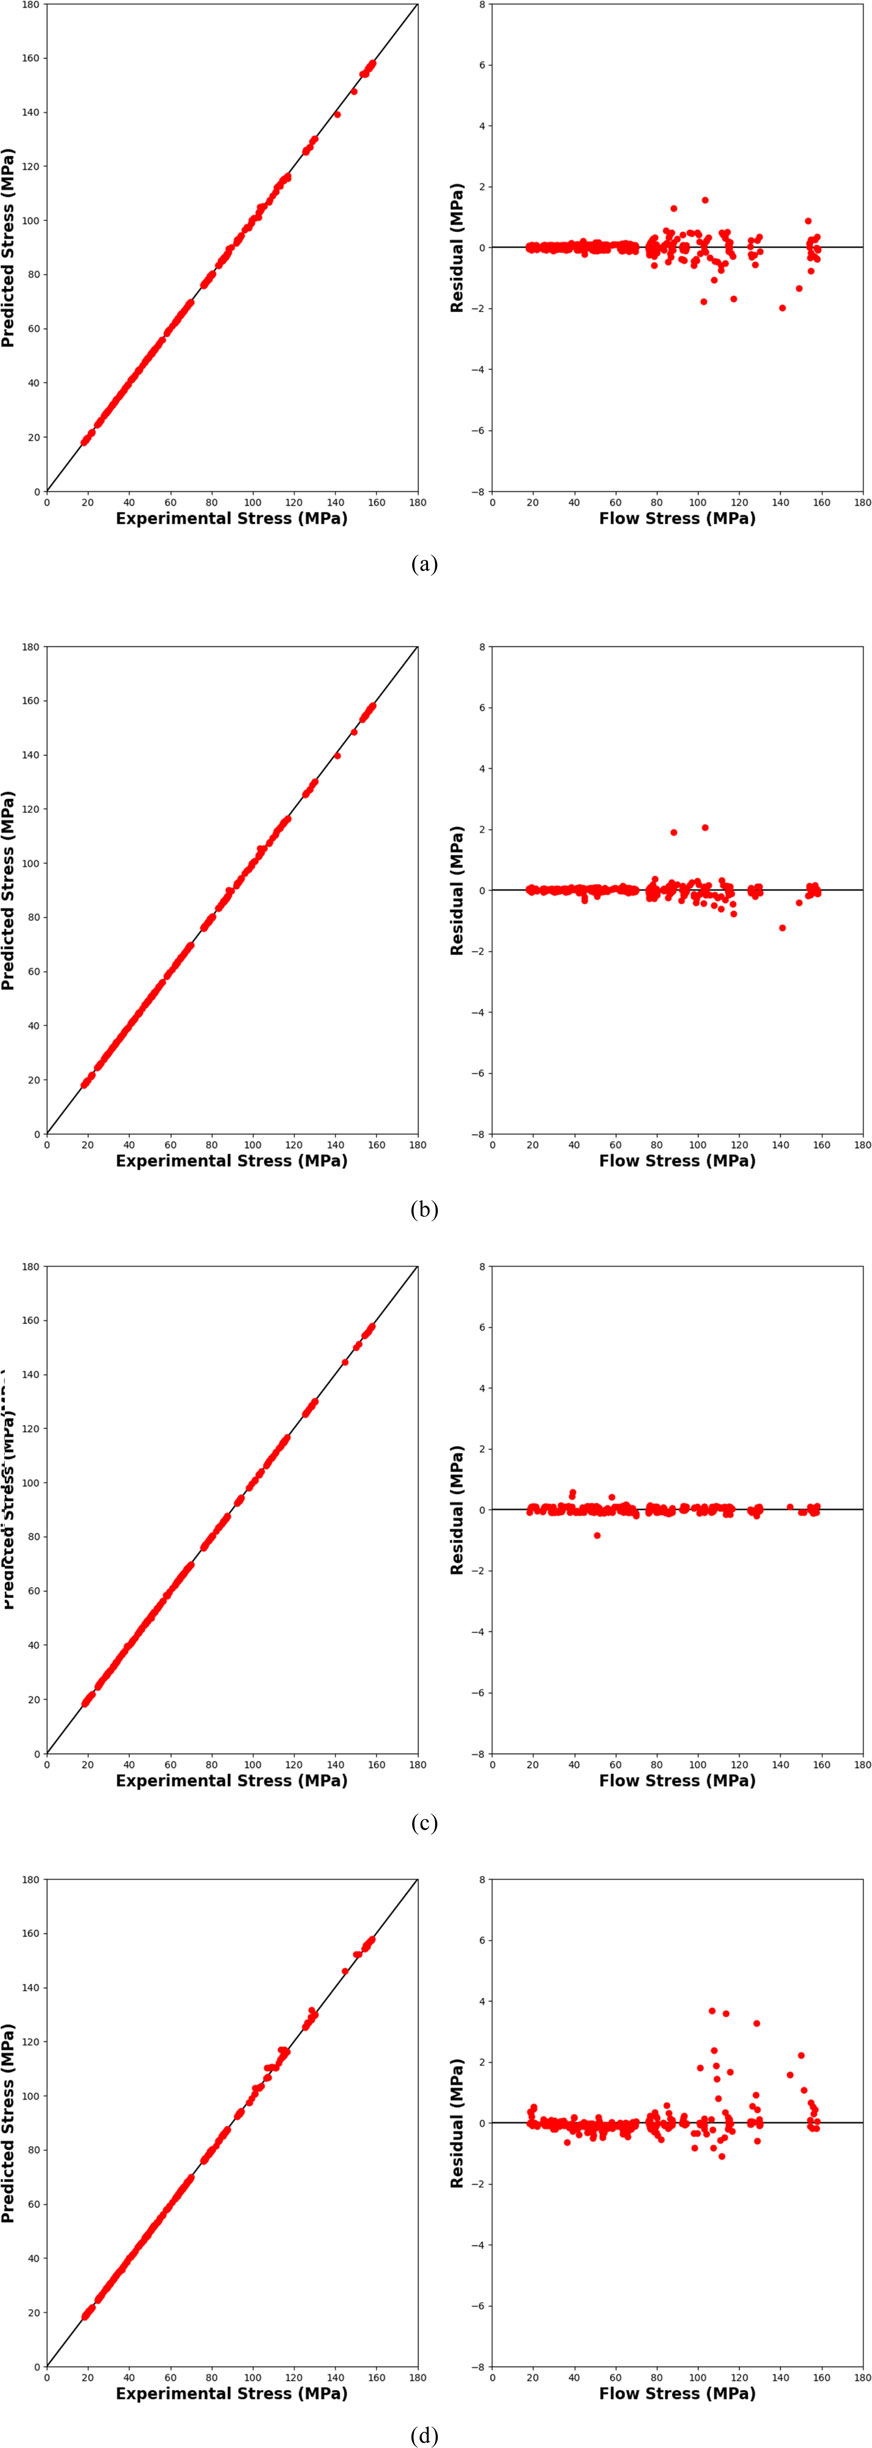
Figure 3. Residuals and Correlation (R value) Analysis of Different Models (a) Decision Tress (b) Random Forest (c) Supported Vector Regression (d) XGBoost.
5 Conclusion
In this study, four machine learning models—Decision Tree, Random Forest, Support Vector Machine, and XGBoost—were employed to predict the flow stress of annealed 7,075 aluminum alloy. The predictive performance of these models was evaluated using residual analysis, mean absolute error (MAE), mean squared error (MSE), mean absolute relative error (AARE), the correlation coefficient (R), and the coefficient of determination (R2). The results demonstrate that all four models achieve a prediction accuracy comparable to previously reported artificial neural network (ANN) models (≈99.9%). Importantly, their model construction process is markedly simpler and more efficient, highlighting the practical advantages of these approaches for flow stress prediction. On the other hand, These models primarily capture statistical correlations between input features (strain, strain rate, temperature) and flow stress, but do not explicitly incorporate underlying physical mechanisms. As a result, while predictions may be numerically accurate within the training domain, the models provide limited mechanistic insight, reducing their scientific interpretability compared to physics-based constitutive equations.
Data availability statement
The original contributions presented in the study are included in the article/supplementary material, further inquiries can be directed to the corresponding author.
Author contributions
QW: Formal Analysis, Visualization, Writing – review and editing, Writing – original draft. ZC: Writing – original draft. SY: Writing – review and editing. HT: Writing – review and editing. FZ: Writing – review and editing. JY: Writing – review and editing. TW: Writing – review and editing. ZQ: Writing – review and editing. GG: Writing – review and editing.
Funding
The author(s) declare that financial support was received for the research and/or publication of this article. This research was funded by National Natural Science Foundation of China (Grant No. 62462039); the Major Science and Technology project of Yunnan Province (Grant No.202402AB080005); the Science and Technology projects of Yunnan Precious Metals Laboratory (Grant No. YPML-2023050206 and YPML-20240502102)
Conflict of interest
The authors declare that the research was conducted in the absence of any commercial or financial relationships that could be construed as a potential conflict of interest.
Generative AI statement
The author(s) declare that no Generative AI was used in the creation of this manuscript.
Any alternative text (alt text) provided alongside figures in this article has been generated by Frontiers with the support of artificial intelligence and reasonable efforts have been made to ensure accuracy, including review by the authors wherever possible. If you identify any issues, please contact us.
Publisher’s note
All claims expressed in this article are solely those of the authors and do not necessarily represent those of their affiliated organizations, or those of the publisher, the editors and the reviewers. Any product that may be evaluated in this article, or claim that may be made by its manufacturer, is not guaranteed or endorsed by the publisher.
References
Chen, L., Zhao, G. Q., and Yu, J. Q. (2015). Hot deformation behavior and constitutive modeling of ho mogenized 6026 aluminum alloy. Mater. Des. 74, 25–35. doi:10.1016/j.matdes.2015.02.024
Chen, R. C., Zhang, S. Y., Liu, X. L., and Feng, F. (2021). A flow stress model of 300M steel for isothermal tension. Materials 14, 252. doi:10.3390/ma14020252
Dai, Q. S., Deng, Y. L., Tang, J. G., and Wang, Y. (2019). Deformation characteristics and strain-compensated constitutive equation for AA5083 aluminum alloy under hot compression. Trans. Nonf errous Met. Soc. China 29, 2252–2261. doi:10.1016/s1003-6326(19)65131-9
Guan, X. M., Yang, Q. S., and Wu, Y. (2023). A study on a wood dyeing color matching algorithm based on the optimization of support vector regression models using the gray wolf algorithm. For. Ind. 60 (07), 27–33. doi:10.19670/j.cnki.dlgydxxb.2023.0705
Guo, Y. H., Xuanyuan, Y. D., Ly, X. N., and Yang, S. (2020). Hot Deformation behaviors of the Mg-3Sn-2Al-1Zn alloy: investigation on its constitutive equation, processing map, and microstructure. Materials 13, 312. doi:10.3390/ma13020312
Gupta, R. K., Kumar, V. A., Sarath Krishnan, A., and Niteshraj, J. (2019). Hot deformation behavior of aluminum alloys AA7010 and AA7075. J. Mater. Eng. Perform. 28, 5021–5036. doi:10.1007/s11665-019-04058-3
Li, K., Pan, Q. L., Li, R. S., Liu, S. H., Huang, Z. Q., and He, X. (2019). Constitutive modeling of the hotdeformation behavior in 6082 aluminum alloy. J. Mater. Eng. Perform. 28, 981–994. doi:10.1007/s11665-019-3873-5
Li, H. Y., Wang, X. Z., and Duan, J. Y. (2020). A comparative study on phenomenological and artificial neural network models to predict the hot deformation behavior of IC10 alloy. Interm etallics 126, 106932. doi:10.1016/j.intermet.2020.106932
Liu, Z. Q., Chen, G., and Su, Z. C. (2025). Prediction of thermal-mechanical multi physical properties of fiber-reinforced composites based on micro-mechanics and machine learning[J/OL]. J. Compos. Sci. Technol., 1–17.
Luo, R., Cao, Y., Qiu, Y., Cui, S. G., Zhou, H. T., Zhou, Y. M., et al. (2021). Investigation of constitutive model of as-extruded spray-forming 7055 aluminum alloy based on BP artificial neural network. J. Aeronaut. Mater 41, 35–44. doi:10.11868/j.issn.1005-5053.2021.000004
Ma, B., Qiang, L., and Jia, Y. (2023). Prediction of high temperature flow stress of 7050 alloy based on BPNN, SVR and RF models. Trans. Mater. Heat Treat. 44 (03), 196–204. doi:10.11933/j.issn.1007-9289.20221101601
Rezaei Ashtiani, H. R., and Shahsavari, P. (2016). Strain-dependent constitutive equations to predict high temperature flow behavior of AA2030 aluminum alloy. Mech. Mater. 100, 209–218. doi:10.1016/j.mechmat.2016.06.018
Rezaei Ashtiani, H. R., and Shahsavari, P. (2016). A comparative study on the phenomenological and artificial neural network models to predict hot deformation behavior of Al Cu Mg Pb alloy. J. Alloys Compd. 4, 300.
Sabokpa, O., Zarei-Hanzaki, A., Abedi, H. R., and Haghdadi, N. (2012). Artificial neural network modeling to predict the high temperature flow behavior of an AZ81 magnesium alloy. Mater. Des. 39, 390–396. doi:10.1016/j.matdes.2012.03.002
Shokry, A., Gowid, S., Kharmanda, G., and Mahdi, E. (2019). Constitutive models for the prediction of the hotdeformation behavior of the 10%Cr steel alloy. Materials 12, 2873. doi:10.3390/ma12182873
Wang, Y. Z., Chan, G., and Zhang, Y. (2021). Study on static and dynamic mechanical properties of aerospace Al7050 alloy and construction of JC constitutive model. Mater. Sci. Technol. 35 (10), 10096–10102. doi:10.11973/jxgccl202110015
Yang, H., Bu, H., Li, M., and Lu, X. (2021). Prediction of flow stress of annealed 7075 Al alloy in hot deformation using strain-compensated Arrhenius and neural network models. Materials 14, 5986. doi:10.3390/ma14205986
Yao, W. Y., and Bu, H. Y. (2025). Micro structure evolution of rolled 7050 aluminum alloy double pass hot deformation. Mater. Sci. Technol. 39 (4), 23120032–23120038.
Zhang, X. S., Chen, Y. J., and Hu, J. L. (2018). Recent advances in the development of aerospace materials. Prog. Aerosp. Sci. 97, 22–34. doi:10.1016/j.paerosci.2018.01.001
Zhang, T., Zhang, S. H., Li, L., Lu, S. H., and Gong, H. (2019). Modified constitutive model and workability of 7055 aluminium alloy in hot plastic compression. J. Cent. South Univ. 26, 2930–2942. doi:10.1007/s11771-019-4225-1
Zhang, B., Zhao, F. F., Chen, H. F., Yang, Y., Ma, Y. H., and Qi, K. (2021). Hot compression deformation of cobalt-based superalloy GH5605. Chin. J. Nonferrous Met. 31, 879–889. doi:10.11817/j.ysxb.1004.0609.2021-42969
Zhao, J. W., Ding, H., Zhao, W. J., Huang, M. L., Wei, D. B., and Jiang, Z. Y. (2014). Modelling of the hot deformation behaviour of a titanium alloy using constitutive equations and artificial neural network. Comp. Mater. Sci. 92, 47–56. doi:10.1016/j.commatsci.2014.05.040
Keywords: 7075 aluminum alloy, decision tree, random forest, support vector machine, XG boost
Citation: Wen Q, Cao Z, Yang S, Tan H, Zhou F, Yin J, Wang T, Qian Z and Gan G (2025) Research on predicting flow stress of 7075 aluminum alloy using machine learning models. Front. Mater. 12:1671753. doi: 10.3389/fmats.2025.1671753
Received: 23 July 2025; Accepted: 02 September 2025;
Published: 23 September 2025.
Edited by:
Shahed Rezaei, Access e.V., GermanyReviewed by:
Sathickbasha K, B. S. Abdur Rahman Crescent Institute of Science and Technology, IndiaHariharasakthisudhan P, Dr. Mahalingam College of Engineering and Technology, India
Copyright © 2025 Wen, Cao, Yang, Tan, Zhou, Yin, Wang, Qian and Gan. This is an open-access article distributed under the terms of the Creative Commons Attribution License (CC BY). The use, distribution or reproduction in other forums is permitted, provided the original author(s) and the copyright owner(s) are credited and that the original publication in this journal is cited, in accordance with accepted academic practice. No use, distribution or reproduction is permitted which does not comply with these terms.
*Correspondence: Zhuo Qian, MjAyMTAwNjdAa3VzdC5lZHUuY24=
†These authors have contributed equally to this work and share first authorship