 M. Shini
1,2
M. Shini
1,2
 M. T. Ramesan
1*
M. T. Ramesan
1*- 1 Centre for Polymer Science and Technology, Department of Chemistry, University of Calicut, Tenhipalam, Kerala, India
- 2 Department of Chemistry, M.P.M.M.S.N. Trusts College, Palakkad, Kerala, India
Blend nanocomposites based on ethyl vinyl acetate (EVA) and chlorinated polyethylene (CPE), reinforced with different quantities of copper oxide (CuO) nanoparticles, were fabricated by a simple and eco-friendly two-roll mill mixing technique. Successful incorporation of nanoparticles into the blend matrix was confirmed by the characteristic peaks of CuO in FTIR and XRD. UV-Visible spectroscopy showed maximum absorption, a high refractive index and a low bandgap energy for the EVA/CPE/5 wt% CuO nanocomposite. Field emission scanning electron microscopy (FE-SEM) and high-resolution transmission electron microscopy (HR-TEM) investigations demonstrated uniform surface morphology and well-dispersed CuO nanoparticles at this concentration. Thermogravimetric analysis (TGA) indicated improved thermal stability of the blend with the incorporation of CuO. Impedance analysis revealed that 5 wt% CuO nanocomposites achieved the most significant enhancement in AC conductivity (from 2.8 × 10⁻⁷ S/cm to 1.17 × 10⁻⁶ S/cm at 1 MHz) and dielectric constant (43.39–156.87 at 100 Hz), accompanied by a reduction in activation energy. The electric modulus plots showed non-Debye relaxation behaviour, while the Nyquist plot showed the smallest semicircle, confirming its lowest impedance at this composition. Mechanical tests demonstrated that the 7 wt% CuO-loaded nanocomposites displayed the maximum tensile, tear, and impact strength, surpassing the pristine EVA/CPE blend by 60.8%, 113.5%, and 30.8%, respectively. These findings highlight the potential of EVA/CPE/CuO nanocomposites as next-generation electroactive materials for high-performance energy storage applications.
1 Introduction
The global demand for efficient energy storage has intensified interest in designing advanced materials with exceptional nanoscale characteristics. Although conventional dielectric polymers offer advantages such as flexibility and processability, their low energy density and significant dielectric losses substantially limit their applicability in modern energy storage devices (Zhu et al., 2020; Bo et al., 2023; Duan et al., 2019). To overcome these limitations, polymer nanocomposites containing high-permittivity nanoparticles have emerged as promising alternatives, offering a balanced combination of improved dielectric characteristics, tunable mechanical flexibility, and cost-effective fabrication.
Among various nanoparticles studied, copper oxide (CuO) nanoparticles have gained substantial interest due to their p-type semiconducting behavior, high dielectric constant, substantial surface area-to-volume ratio, thermal stability and remarkable chemical activity. These properties make them highly suitable for application in capacitors, supercapacitors, and battery systems (Ren et al., 2022; Yang et al., 2016). Previous studies on CuO-based nanocomposites have demonstrated increased dielectric, electrical, and thermal performances; however, most of these investigations have been confined to single polymer matrices (Alfaifi et al., 2025; Anju and Ramesan, 2024; Saron et al., 2024). The synergistic effects originating from the integration of CuO nanoparticles into polymer blends, especially polar-polar blends, remain relatively underexplored.
CPE, a thermoplastic produced from the chlorination of PE, exhibits remarkable flame retardancy, chemical resistance, weatherability, thermal stability, and commendable tensile strength (Marossy, 2023; Zhang et al., 2024). Its polar C–Cl linkages promote compatibility with other polar polymers, facilitating blend formation (Zhang et al., 2012). However, a comparatively low dielectric constant and high loss restrict its application in energy storage devices (Zhao et al., 2018; Mao et al., 2021; Mohamed and Abdel-Kader, 2019; Abdel-Kader and Mohamed, 2024). EVA, on the other hand, is prized for its flexibility, elongation at break, adhesive qualities, optical clarity, and weather resistance (Azizli et al., 2023; Lado-Touriño and Merodio-Perea, 2025). Its intrinsic polarity allows improved miscibility with CPE, decreasing phase separation and enhancing blend homogeneity (Ahmed, 2024). The specific limitations of EVA, such as its relatively low thermal stability and mechanical strength, can be effectively addressed through blending with CPE (Ramesan and Alex, 2001; Huan et al., 2016). Therefore, an optimized EVA/CPE blend provides a cost-effective and thermally stable polymeric platform with balanced mechanical and chemical properties, while its low intrinsic energy density continues to pose issues for energy storage (Airam et al., 2025).
To address this restriction, the addition of CuO nanoparticles to the EVA/CPE blend is a sensible strategy for developing multifunctional nanocomposites with enhanced dielectric, optical, thermal, and mechanical properties. Nevertheless, systematic studies on the combined effect of polymer blending and CuO nanoparticle integration remain limited. Previous studies have shown the impact of CuO nanoparticles on improving the performance of individual polymers (Kall et al., 2025). However, the combined influence of nanoparticle concentration, interfacial interactions, and blend microstructure in EVA/CPE/CuO nanocomposites has not been thoroughly studied.
In this context, the present study aims to develop EVA/CPE/CuO nanocomposites using an environmentally friendly, solvent-free, and cost-effective single-step two-roll mill mixing process. By systematically varying the CuO loading, we examine the effects of nanoparticle concentration, blend compatibility, and interfacial interactions on the overall dielectric, electrical, thermal, optical, and mechanical properties. This research offers new insights into designing high-performance, multifunctional polymer blend nanocomposites, making significant momentum toward next-generation flexible and sustainable energy storage technologies.
2 Experimental section
2.1 Materials
Chlorinated polyethylene (CPE) with an average molecular mass of 101,900 g/mol and 35% chlorine content was obtained from Alfa Aesar, India. EVA containing 18% vinyl acetate was sourced from Polyolefin Industries Ltd., Mumbai, India. Dicumyl peroxide (DCP), used as the cross-linking agent, was purchased from Merck, India. Copper oxide nanoparticles were synthesized using copper sulphate pentahydrate (CuSO4 .5H2O) and sodium hydroxide as precursors by the chemical co-precipitation method, as reported in the previous work (Kall et al., 2025).
2.2 Preparation of EVA/CPE/CuO nanocomposites
EVA/CPE blend and EVA/CPE/CuO nanocomposites were prepared using a laboratory-sized two-roll mill mixer with chrome-plated rolls maintained at 25 °C–70 °C by water circulation. The blend composition was maintained at a consistent 50:50 ratio of EVA to CPE, and CuO nanoparticles were injected at concentrations of 1, 3, 5, 7, and 10 wt%. Initially, 40 g of EVA pellets were masticated in the mill for about 4 min, followed by the addition of an equal amount of CPE. The front and rear rolls were operated at various speeds with a friction ratio of 1:1.2 to ensure adequate shear for proper mixing. The roll gap was adjusted to 0.5–1.0 mm to regulate shear intensity and sheet thickness during processing. The rolls were rotating at a speed of 50 rpm, and the mixing duration was kept at 10 min to guarantee uniform dispersion without degrading the polymer, resulting in a homogeneous EVA/CPE film. The reinforcement process was carried out by gradually incorporating CuO nanoparticles, with particular attention to ensure their uniform dispersion, in accordance with ASTM D-15–627 standards (Ramesan, 2014). To facilitate cross-linking, 6 wt% DCP was incorporated into the blend nanocomposite mixtures, followed by an additional 10 min of mixing. The samples were cured and compression-moulded into 2 mm thick sheets using a hydraulic press at 160 °C under 10 MPa for a dwell time of 7 min, followed by cooling to room temperature under pressure.
2.3 Characterization techniques
The structural characterisation of EVA/CPE blend and EVA/CPE/CuO nanocomposites was carried out using a JASCO 4100 FTIR spectrometer. The XRD patterns of the films were obtained by the X’Pert3 diffractometer with Cu-Kα radiation at 2θ ranging from 10° to 90°, at a scanning rate of 2°/min. A JASCO V-770 spectrophotometer was used to analyze the optical properties of the fabricated films. The influence of CuO nanoparticles on the surface morphology of the samples was investigated using a Carl Zeiss FE-SEM, VP500. HR-TEM was used to determine the atomic-level distribution of CuO in the EVA/CPE matrix using the JEOL JEM 2100. The evaluation of thermal stability was conducted using a Hitachi STA7200 TGA at a scanning rate of 10 °C/min under N2 atmosphere. The AC conductivity, electric modulus, impedance, and dielectric constant were measured using a HIOKI 3570 impedance tester. Tensile strength and elongation at break were measured following ASTM D412, and tear strength was evaluated in accordance with ASTM D624, using a Zwick universal testing machine. The Izod impact strength analysis of the nanocomposites was conducted using a Zwick 5102 impact tester (ASTM D256). The Shore A durometer was used to assess the hardness of the nanocomposites following the ASTM D2240 standard.
3 Results and discussion
3.1 FTIR analysis
The FTIR spectra of CuO nanoparticles, EVA/CPE blend and EVA/CPE/CuO nanocomposites are shown in Figure 1. The broad absorption band observed for the FTIR of CuO nanoparticles at 3464 cm−1 is indexed to the O-H stretching vibration. EVA/CPE blend shows peaks at 2917 cm−1 and 2852 cm−1 represent the C-H stretching vibration of methylene groups present in both the polymers. The bands at 1460 cm−1 and 724 cm−1 are associated with C-H scissoring and rocking vibrations. Other major peaks centered at 1735 cm−1, 1021 cm−1 and 667 cm−1 are associated with C=O stretching vibration of the ester group in EVA, C-C stretching of the backbone and the one corresponding to C-Cl stretching vibration, respectively (Ramesan, 2014; Ramesan and Alex, 1998; Abdelghany et al., 2019). The successful incorporation of CuO nanoparticles in the blend matrix is indicated by the presence of characteristic peaks in the FTIR of blend composites, which retain all polymer peaks and show additional CuO absorption bands. Cu-O stretching vibration peaks are shifted to higher wavenumbers in polymer blend composites. For EVA/CPE/5 wt% CuO the peaks are found at 606 cm−1 and 520 cm−1. While for 10 wt% composite, the peaks appear at still higher wavenumbers of 606 cm−1 and 526 cm−1. This may be due to intermolecular interaction between the polar groups in the blend (the acetate group and the C-Cl bond) and the polar CuO nanoparticle. Furthermore, the shift in absorption position to lower wavenumbers for the peaks of polymers further confirms the successful formation of EVA/CPE/CuO nanocomposites. For instance, there is a shift in C-H stretching vibration peaks of EVA/CPE/10 wt% CuO to 2912 cm−1 and 2843 cm−1, accompanied by the shift of C=O stretching vibration to 1729 cm−1. The observed spectral changes indicate strong interactions between the blend components and CuO nanoparticles, which are critical for modulating the structural and functional properties of the nanocomposites.
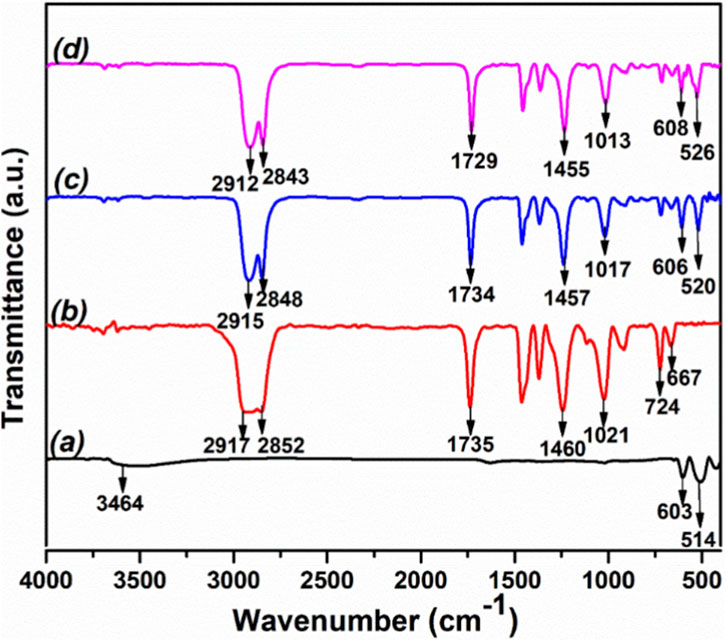
Figure 1. FTIR spectra of (a) CuO, (b) EVA/CPE blend, (c) EVA/CPE/5 wt% CuO and (d) EVA/CPE/10 wt% CuO.
3.2 X-ray diffraction analysis
The impact of CuO nanoparticle incorporation on the crystalline properties of the EVA/CPE blend, as analysed by XRD, is depicted in Figure 2. The appearance of a broad peak centered at 21.57° along with a minor shoulder at 23.77° indicates the semicrystalline nature of the blend (Stoeva, 2004). The XRD of the synthesized CuO nanoparticles shows its characteristic peaks at 2θ values 32.86°, 36.1°, 39.02°, 48.98°, 54.043°, 58.69°, 61.81°, 66.47°, 68.82°, 73.08°, and 75.40° corresponding to the lattice planes (110), (−111), (111), (−202), (020), (202), (−113), (−311), (220), (311), and (310) respectively. This confirms the establishment of the monoclinic phase of CuO, aligning to JCPDS card No: 48–1548 (Kall et al., 2025). The XRD pattern of EVA/CPE/CuO composites reveal that the films exhibit the characteristic peaks of CuO nanoparticles, as well as those of the blend. The inclusion of CuO nanoparticles results in a displacement of the XRD peaks of the blend to higher 2θ values, accompanied by reduced peak intensity and a slight broadening. For EVA/CPE/10 wt% CuO, the peak at 21.51° for the blend is shifted to 21.8°, and the peak at 23.77° is displaced to 23.9°. It is further observed that the diffraction peak intensity of CuO nanoparticles in the composite samples increases progressively with rising CuO nanoparticle concentration. These observations unequivocally demonstrate the synergistic influence of the nanoparticles on the blend, thereby confirming the successful development of the composite and its improved crystallinity (Suvarna and Furhan, 2023).
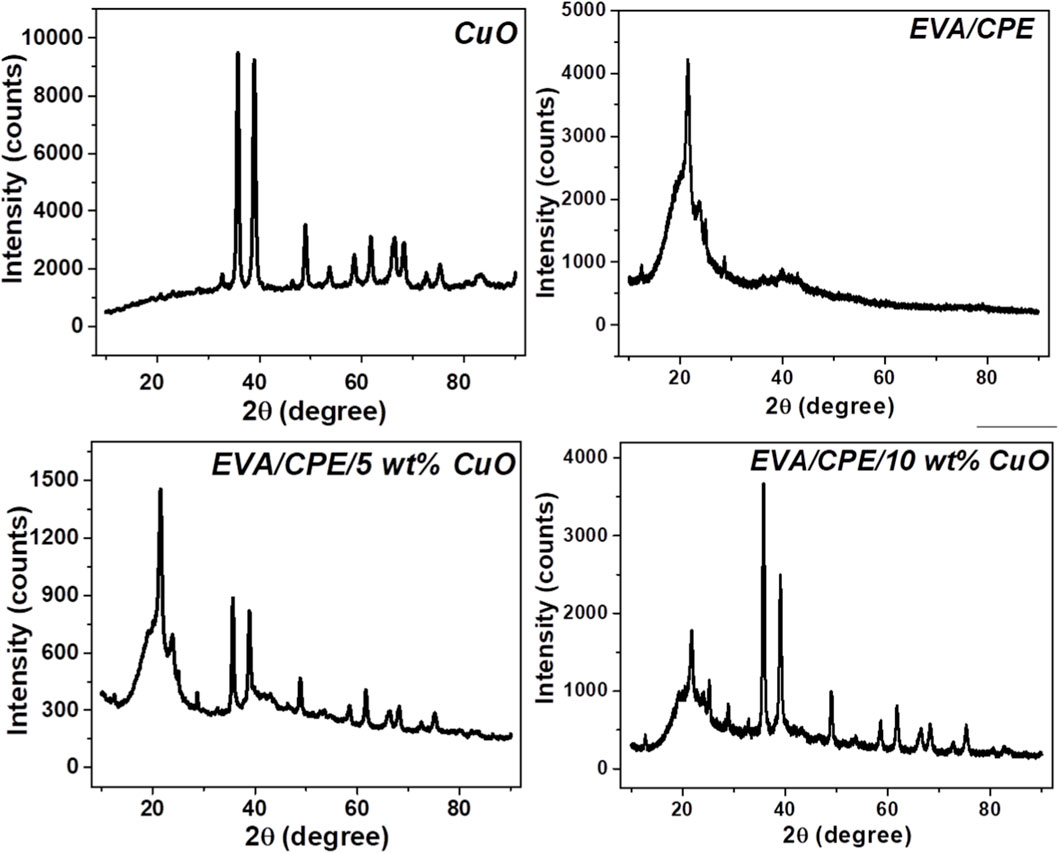
Figure 2. XRD patterns of CuO, EVA/CPE blend and its nanocomposites with CuO nanoparticles.
Scherrer formula given in Equation 1, is used to estimate the average crystallite size:
Where D represents the mean crystallite size, β is the full width at half maximum of XRD peaks, θ is the Bragg’s angle, k is the shape factor and λ is the wavelength of the X-ray. The average crystallite size of CuO nanoparticles is calculated to be 13.3 nm, whereas for EVA/CPE/5 wt% CuO and EVA/CPE/10 wt% CuO nanocomposites, it increases to 14.23 nm and 14.79 nm, respectively.
3.3 UV-visible spectroscopy
Figure 3 illustrates the absorption spectra of EVA/CPE polymer blend and EVA/CPE/CuO nanocomposites in the 200–800 nm wavelength range. The spectrum of pristine blend displays a broad band around 280 nm, linked to n-π* electronic transitions of the lone pair electrons in Cl and carbonyl group in the polymer backbone (Suhailath et al., 2017). All the nanocomposites display increased absorbance peak intensity and a shift in absorption edges to longer wavelengths relative to the pristine blend, reflecting its enhanced light absorption. This arises from the strong interfacial interactions between the polymer and nanoparticles, which alter the electronic band structure and lower the energy gap associated with the electronic transitions. The red shift is particularly evident in the EVA/CPE composite with 5 wt% CuO, which can be ascribed to the enhanced contact area and the robust interaction between the components resulting from the consistent distribution of nanoparticles throughout the matrix. However, beyond this loading, a gradual decrease is observed as a result of the clustering of nanoparticles, which restricts smooth electronic transitions within the polymer structure.
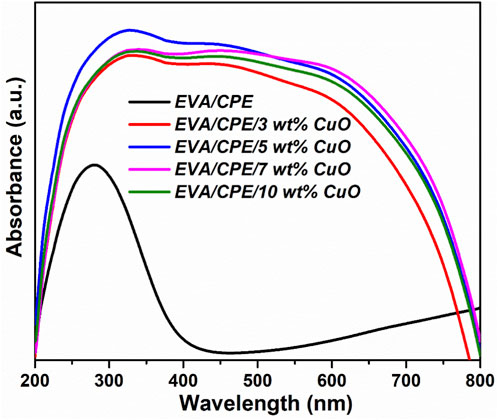
Figure 3. UV-Visible spectra of EVA/CPE blend and its nanocomposites.
3.3.1 Optical bandgap energy
The optical bandgap energy (Eg) represents the energy difference between the lowest unoccupied molecular orbital (LUMO) and the highest occupied molecular orbital (HOMO) of a material (Ramesan et al., 2016; Hassan et al., 2023). The Tauc’s model was applied to calculate, Eg of the EVA/CPE blend and EVA/CPE/CuO nanocomposites. Tauc’s formula given in Equation 2 incorporates direct and indirect electronic transitions within the material and correlates, Eg with linear absorption coefficient (α) and photo energy (hυ) as given below:
Where the constant β represents the transition probability and the parameter ‘m’ is typically set to 1/2 and 2 for direct bandgap and indirect bandgap respectively (Ahmad et al., 2024). (αhc/λ)2 vs. hυ plots for EVA/CPE blend and its nanocomposites with 3 wt%, 5 wt% and 7 wt% CuO nanocomposites are depicted in Figure 4a; extrapolating its linear portion to intersect with the x-axis gives the direct bandgap energy. The observed, Eg of the pristine EVA/CPE blend was quantified at 2.560 eV. Notably, this value diminishes as the concentration of CuO increases and reaches the lowest (1.548 eV) for EVA/CPE/5 wt% CuO. The high surface-to-volume ratio of CuO nanoparticles induces structural imperfections, resulting in the formation of localized energy states, which changes the electronic band structure. The entrapment of charge carriers in the intermediate states diminishes the overall bandgap of the composite (Mohamed and Abdel-Kader, 2020; Elkalashy et al., 2024; Ramesan, 2013). At 5 wt% loading, the continuous nanoparticle network enhances polymer–nanoparticle interfacial interactions, establishing a continuum of energy levels, which leads to the highest density of localized states and subsequently narrows the effective bandgap.
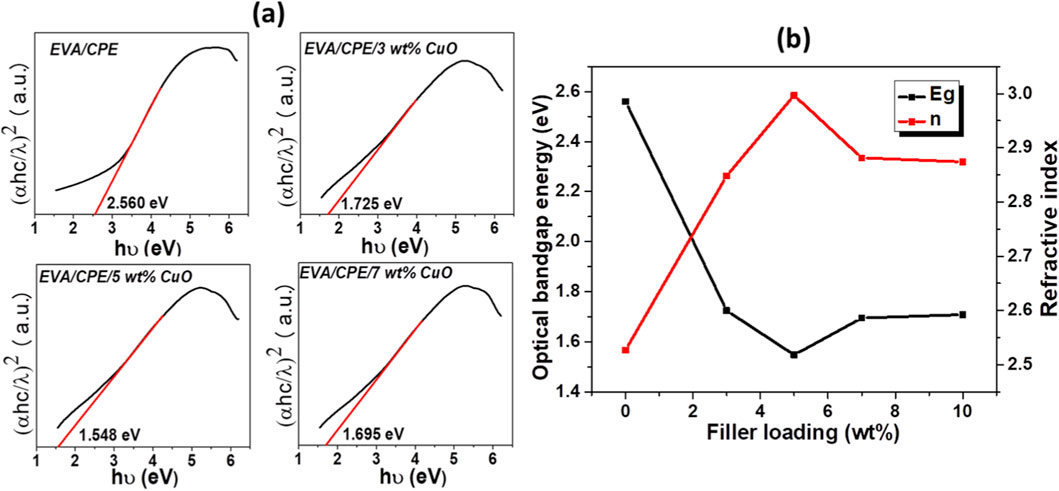
Figure 4. (a) Tauc’s plots and (b) refractive index and bandgap of EVA/CPE/CuO nanocomposites.
3.3.2 Refractive index
The refractive index (n), which governs light-matter interactions, is a crucial optical parameter for the design of optoelectronic devices. The n values of EVA/CPE blend and EVA/CPE/CuO nanocomposites are calculated using the Dimitrov–Sakka equation as given in Equation 3 (Yassin et al., 2019)
Figure 4b illustrates an increase in refractive index of EVA/CPE blend from 2.527 to 2.9967 as the percentage of nanoparticles rises from 0 to 5 wt%, accompanied by a gradual decline in n values beyond it. The electronic polarizability of nano-CuO accounts for the substantial enhancement of the n values of the nanocomposites. As the concentration of nanoparticles in the blend increases, the packing density rises; concurrently leading to an increase in disorder and resulting in an elevation in refractive index (Almarashi and Abdel-Kader, 2020). When CuO loadings exceed 5 wt%, the agglomeration of nanoparticles enhances light scattering and results in a decrease in the n value. The tunability to adjust the refractive index by varying the concentration of CuO renders these nanocomposite films a promising material for display technologies, optical communications, image sensors and waveguides (El-Naggar et al., 2024).
3.4 FE-SEM
FE-SEM images of EVA/CPE blend and its CuO nanoparticles-reinforced composites are depicted in Figure 5. The EVA/CPE blend displays a smooth and consistent surface structure, suggesting compatibility between the component polymers and formation of a homogeneous matrix. With the addition of CuO nanoparticles, notable changes in surface morphology are observed. The 5 wt% CuO-loaded blend exhibits uniformly distributed short, rounded tear lines, signifying effective CuO-matrix interaction and retention of structural regularity. Such morphology indicates that the nanoparticles are uniformly distributed throughout the matrix and are significantly interacting with the polymer chains, thereby enhancing efficient stress transfer and reinforcing the continuity of the intermolecular network. These characteristics align with previously reported findings that underscore the significance of well-dispersed nanoparticles for establishing continuous structural linkages within the blend matrix (Ahmad et al., 2024). At elevated loading levels, especially at 10 wt%, the structural integrity is significantly compromised, resulting in the emergence of a rough surface characterized by white clusters of varying dimensions. This non-homogeneous morphology is attributed to the agglomeration of nanoparticles, which occurs when the nanoparticle-nanoparticle interactions dominate over nanoparticle-polymer interactions (El-Naggar et al., 2024). This heterogeneous structure interrupts the continuous polymer network and diminishes intermolecular cohesion, resulting in a significant reduction in the structural integrity of the composite.
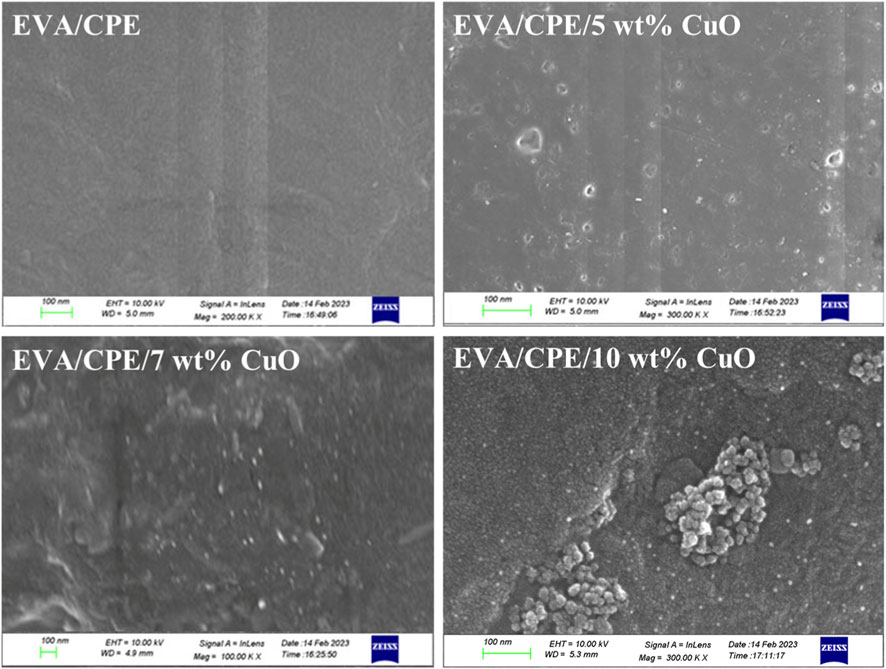
Figure 5. FE-SEM images of EVA/CPE blend and its nanocomposites.
3.5 HR-TEM
HR-TEM analysis serves as an advanced characterisation method that enables visualisation of materials at the atomic scale, which provides a detailed representation of the size and shape of nanoparticles and their distribution within the blend matrix. TEM images (Figure 6) reveal high structural regularity for EVA/CPE/5 wt% CuO nanocomposite with well-ordered dispersion of spherical and elliptical-shaped nanoparticles in the blend matrix. The uniform dispersion implies the interaction of CuO nanoparticles with the polar groups (carbonyl and Cl) in the EVA/CPE blend. However, the nanocomposite demonstrates an uneven structure at a high CuO loading of 10 wt%, as a result of the clustering of nanoparticles, which is consistent with the FE-SEM studies.
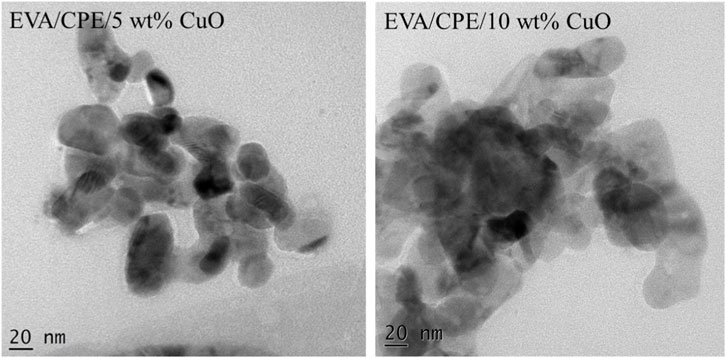
Figure 6. HR-TEM images of EVA/CPE/5 wt% CuO and EVA/CPE/10 wt% CuO nanoparticles.
3.6 Thermogravimetric analysis
Figure 7 illustrates the TGA profiles of EVA/CPE blend and EVA/CPE/CuO nanocomposites. Both the blend and the nanocomposites exhibit a three-step thermal degradation. The onset temperature marking the first weight loss across all the samples is observed at 280 °C, which corresponds to two sequential events occurring within the blend: the release of acetic acid from the vinyl acetate groups in EVA and the dehydrochlorination of CPE (Ramesan and Alex, 1998; Ramesan, 2005). The first weight loss for 5 and 10 wt% CuO incorporated blend occurs at 303 °C and 319 °C, respectively. This is attributed to the breakdown of the carbonaceous backbone through random chain scission, accompanied by the release of volatile compounds and low-molecular-weight hydrocarbons. The second phase of thermal decomposition for the EVA/CPE blend, EVA/CPE/5 wt% CuO, and EVA/CPE/10 wt% CuO occurs at ⁓438 °C, ⁓467 °C, and ⁓483 °C, respectively. The increased degradation temperature and reduced weight loss in the nanocomposites indicate its enhanced thermal stability. The strong interfacial interaction of CuO nanoparticles with the blend matrix, along with their barrier effect and heat-shielding capacity, contributes to this improvement (Ge et al., 2025). This is supported by the increase in char residue obtained after the complete degradation of the samples at 750 °C. The residual mass percentages for EVA/CPE blend with 0 wt%, 5 wt% and 10 wt% CuO are 1.53%, 5.01% and 10.12%, respectively. The char residue on the surface of the composite serves to protect it from further disintegration by functioning as a barrier against the diffusion of heat and oxygen (Li et al., 2023).
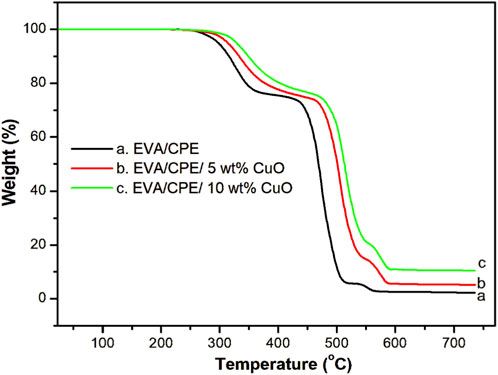
Figure 7. TGA of EVA/CPE blend and its nanocomposites.
3.7 Dielectric constant
The dielectric constant (ε′) representing the real component of the complex permittivity and the energy storage capacity, is influenced by various types of polarization such as atomic, electronic, orientation and interfacial. These effects can be examined through the frequency-dependent ε′ of EVA/CPE blend and EVA/CPE/CuO nanocomposites measured at room temperature, as depicted in Figure 8. The dielectric constant is calculated using Equation 4 as given below:
where Cp represents the observed capacitance, ɛ0 denotes the permittivity of free space, d is the film thickness and A denotes the electrode cross-sectional area (Kausar et al., 2024). The elevated value of ε′ at low frequencies is attributed to space charge polarization as a result of the alignment of dipoles in the blend when subjected to an electric field. However, as frequency increases, the dipoles in the nanocomposite cannot keep pace with the electric field because of shorter alignment time, resulting in lower polarization and frequency-independent dielectric constant. The ε′ value of the blend is comparatively low, especially at low frequencies (44.52 at 102 Hz), but the incorporation of polar CuO nanoparticles into EVA/CPE matrix results in a significant rise in ε′ (158.9 at 102 Hz for EVA/CPE/5 wt% CuO). Thus, at 102 Hz, an approximately 3.5-fold increase is achieved at the optimum nanoparticle loading of 5 wt%. The dielectric constant achieved in the present study surpasses the values reported in our earlier work on Cu-Al2O3/CPE/PVC blend nanocomposites, highlighting the enhanced polarizability and improved dielectric performance in the present system (Suvarna et al., 2022). This pertains to the fact that, when solid materials like polymers, reinforcing agents, blends and nanocomposites are subjected to forced electrical oscillations, their innate microstructure plays a major role in influencing their dielectric polarization capabilities. The EVA/CPE/CuO system is made up of three distinct phases and thus exhibits a complex interface. This structure provides a more interfacial area for charge accumulation, which promotes interfacial polarization, specifically, Maxwell-Wagner-Sillers polarization (Meera and Ramesan, 2024). The intrinsically high permittivity of CuO further enhances polarization through dipole–dipole interactions among adjacent nanoparticles. Dielectric analysis reveals that EVA/CPE with 5 wt% CuO exhibits the highest ε′, while further loading results in a decrease in its value. This indicates that the composite reaches its percolation threshold at 5 wt% CuO nanoparticle loading, beyond which nanoparticle agglomeration occurs, restricting effective polarization.
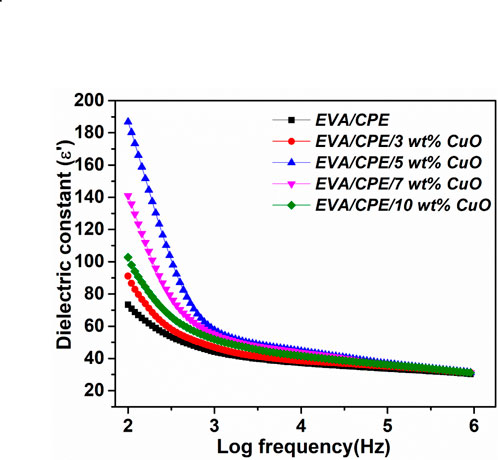
Figure 8. Room temperature dielectric constant of EVA/CPE blend and EVA/CPE/CuO nanocomposites.
3.7.1 Dielectric constant at different temperatures
The dependence of dielectric constant on temperature for EVA/CPE blend and its composites with CuO nanoparticles is depicted in Figure 9. In all the samples, the dielectric constant increases monotonously with temperature. The rise in dielectric permittivity with temperature in a blend of two polar polymers is due to the increased segmental mobility and decreased viscosity of the polymers at higher temperatures. This enhances charge carrier mobility and improves their alignment with the electric field. CuO nanoparticles incorporated in EVA/CuO hybrid films exhibit significant ionic polarization and a markedly elevated static permittivity, which further enhances as the temperature increases (Suhailath and Ramesan, 2019). High temperatures also produce more mobile charge carriers, which enhances space charge polarization and Maxwell-Wagner-Sillars polarization. The EVA/CPE/5 wt% CuO nanocomposite exhibits the most significant temperature-dependent enhancement in permittivity, as demonstrated by an increase in its dielectric constant from 128 to 375 at 90 °C and 100 Hz. As the concentration reaches 5 wt% CuO, the uniform distribution of nanoparticles, as revealed by SEM examination, leads to a better orientation of dipoles at the interfaces and the permittivity increases.
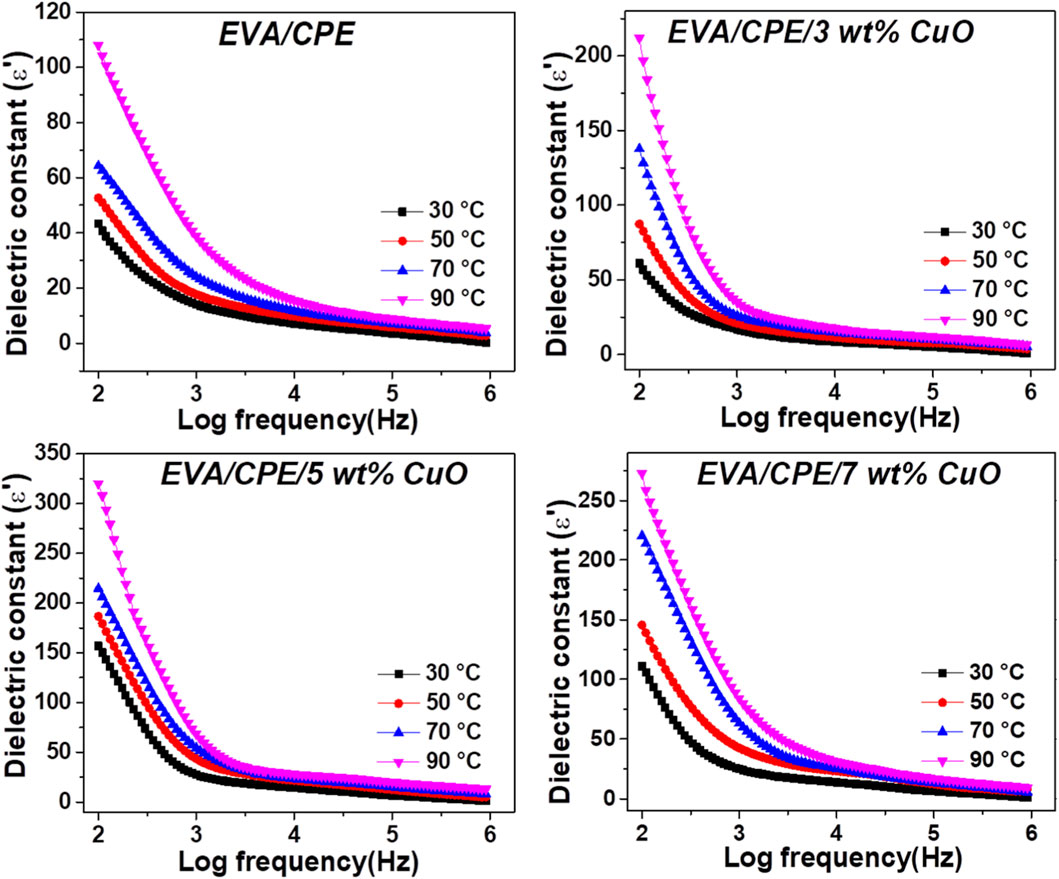
Figure 9. Temperature-dependent dielectric constant of EVA/CPE blend and its nanocomposites.
3.8 Electric modulus analysis
Dielectric modulus analysis gives a comprehensive idea of charge transport processes, including relaxation processes and ionic conductivity, by repressing electrode polarization effects (Abdelrazek et al., 2019). The complex dielectric modulus (M) can be expressed according to Equation 5:
Where, M′ and M″ represent the real and imaginary parts of M*, which are related to the dielectric parameters ε′ and ε′′ by Equations 6, 7 given below:
Anwar et al. (2022). The variation in M′ and M″ values with frequency measured at temperatures between 30 °C and 90 °C for EVA/CPE blend and EVA/CPE/5 wt% CuO is depicted in Figure 10. The real part of the electric modulus provides an assessment regarding the charge storage capacity. The minimal values of M′ at low frequencies indicate the lack of a substantial restoring force, which enables the charge carriers to respond readily to the applied field. This trend suggests that the impact of electrode polarization is negligible and thus ignored. The high-frequency region displays an elevation in M′ values relative to frequency due to relaxation processes (Aziz and Abidin, 2015). A more precise understanding of the dielectric relaxation phenomenon can be attained by the imaginary component of the electric modulus, which quantifies dielectric loss. The M″ versus log frequency graph of the data reveals the presence of asymmetric loss peaks. At low frequencies, M″ remains negligible due to less energy dissipation. As frequency increases, M″ rises, reaching a peak at the frequency where the hopping rate of charge carriers or relaxation process resonates with the applied electric field. This peak signifies substantial relaxation, negligible electrode effects, and optimal energy dissipation. After this peak, M″ declines with increasing frequency due to the inability of dipolar and ionic relaxation processes to synchronize with the rapidly fluctuating electric field. The broad and asymmetric peaks imply non-Debye type relaxation, indicating a distribution of relaxation times, which arises due to interfacial polarization and structural disorder in the composite (Zhao et al., 2022). The average relaxation time (τ) is related to the characteristic frequency (fc) or relaxation frequency, according to the relation; τ
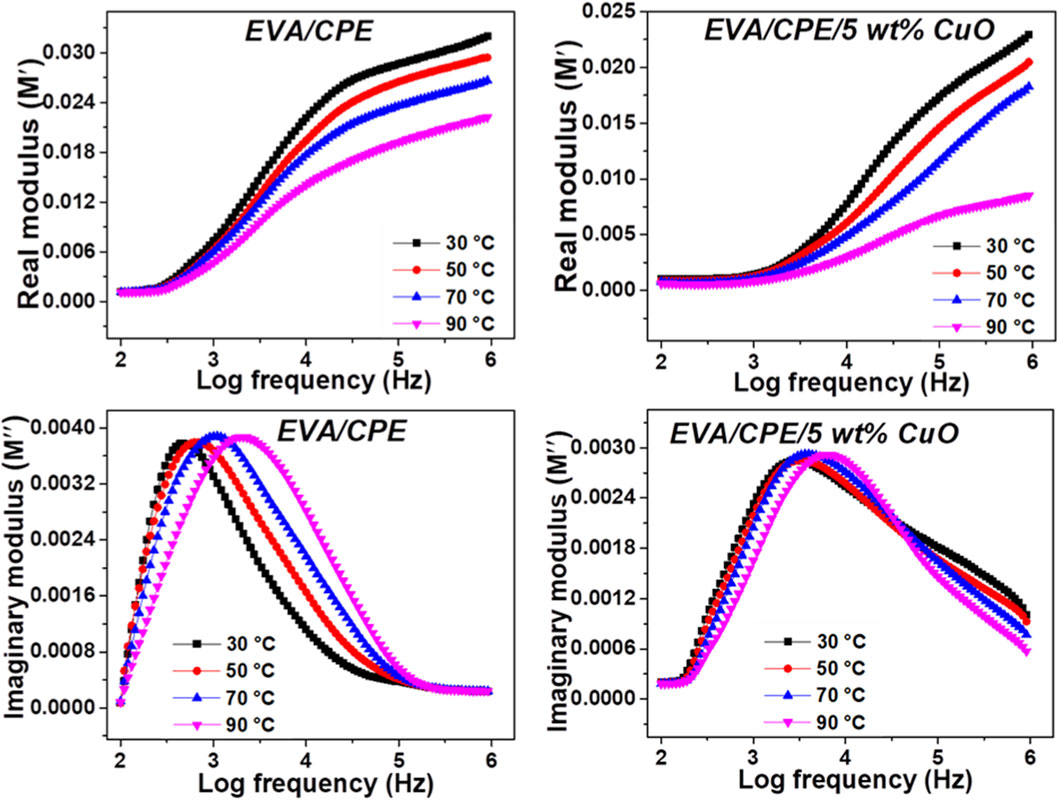
Figure 10. Frequency and temperature-dependent variation in M′ and M″ values for CPE and CPE/5 wt% CuO.
3.9 AC conductivity
The dependence of dielectric parameters on AC conductivity can be expressed using Equation 8 given below:
Where ω represents angular frequency, ε′ denotes dielectric constant, ε0 is the permittivity of free space and tan δ, the loss tangent (Abdelghany et al., 2023). Figure 11 shows the frequency-dependent changes in AC conductivity for EVA/CPE blend and its nanocomposites with CuO nanoparticles at room temperature. The graphs illustrate that, EVA/CPE blend has lower conductivity (2.82 × 10⁻⁷ S/cm at 106 Hz) than nanocomposites, as the intrinsically low conductivity of the polymers and their non-conductive interfaces create only a limited number of conductive paths inside the blend. The addition of nanoparticles is found to enhance σac values. The nanoparticles promote the formation of interatomic networks inside the composite, resulting in the emergence of novel electronic states which facilitate hopping of charge carriers along these pathways. The most elevated value of σac (1.16 × 10⁻⁶ S/cm) was achieved for EVA/CPE/5 wt% CuO at the maximum studied frequency of 106 Hz, which is ⁓ 4.1 times that of the pristine blend. The uniform distribution of nanoparticles at this threshold level filling leads to optimal interfacial interactions and promotes the creation of interconnected conductive networks of CuO nanoparticles within the matrix (Rajeswari et al., 2014). The reduction in AC conductivity above 5 wt% CuO nanocomposites can be ascribed to the reduction of localized sites and restricted mobility of charge carriers resulting from the aggregation of nanoparticles. For all the fabricated films, conductivity exhibits a linear increase with increasing frequency. This behaviour is due to the rising contributions of interfacial polarization and polymer-chain relaxations at elevated frequencies, and the dominance of a hopping-type conductivity mechanism in the blend composite (Rajeswari et al., 2014).
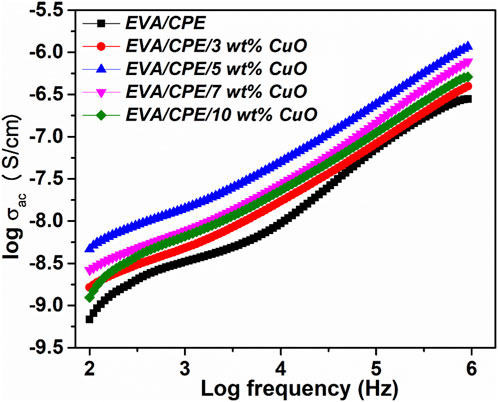
Figure 11. Room temperature AC conductivity of EVA/CPE/CuO nanocomposites.
3.9.1 Temperature-dependent conductivity analysis
Figure 12 represents the temperature-dependent AC conductivity exhibited by EVA/CPE blend and its nanocomposites with 3–7 wt% CuO nanoparticles. It can be directly inferred from the graphs that, at any frequency, the AC conductivity of all samples increases with temperature. For example, at 106 Hz, the σac of EVA/CPE/5 wt% CuO increases from 1.16 × 10⁻⁶ S/cm to 2.884 × 10⁻⁶ S/cm as the temperature rises from 30 °C to 90 °C. The observed trend in conductivity is due to thermal excitation, which increases the segmental motion of polymer chains and enhances charge carrier mobility within the matrix. Moreover, thermal excitation enhances the number of charge carriers, resulting in an increased frequency of hopping events, which in turn contribute to conductivity (Abdelrazek et al., 2019).
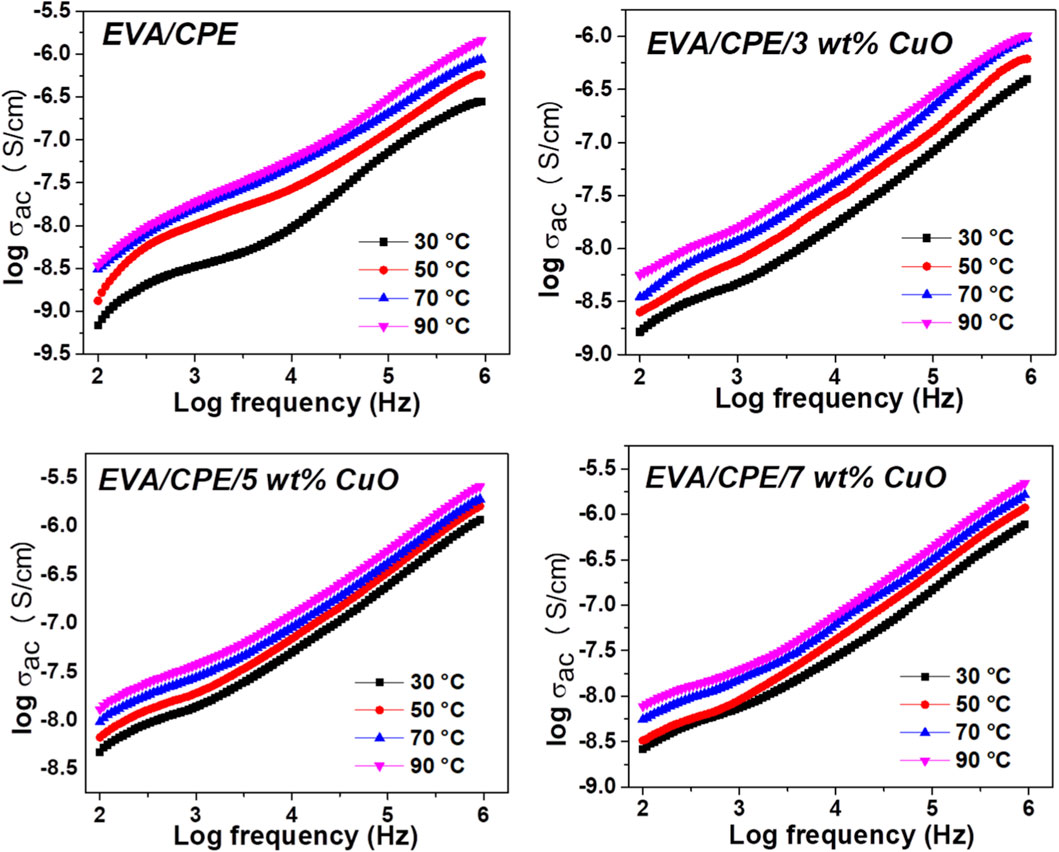
Figure 12. AC conductivity plots of EVA/CPE blend and its nanocomposites from 30 °C to 90 °C.
Jonscher’s universal power law, generally used to describe the frequency-dependent conductivity in dielectric analysis, as given by Equation 9,
where σdc represents the DC conductivity, ω (= 2πƒ) denotes the angular frequency, A is a constant dependent on temperature and “s” is a dimensionless quantity referred to as the frequency exponent, with values between 0 and 1 (Ramesan and Jayakrishnan, 2017). The value of ‘s’ gives insight into the dominant conduction mechanism prevalent in the material and quantifies the degree of interaction between charge carriers and their local environment. For all the studied samples, a regular linear increase in conductivity with frequency is observed, which is consistent with the universal power law. The ‘s’ values obtained from the slope of log σac versus log frequency plots are listed in Table 1. It is observed that ‘s’ decreases with temperature and is always less than one, which predicts the prevalence of the Correlated Barrier Hopping model of conductivity for the fabricated nanocomposites (Kaliyaperumal et al., 2023).
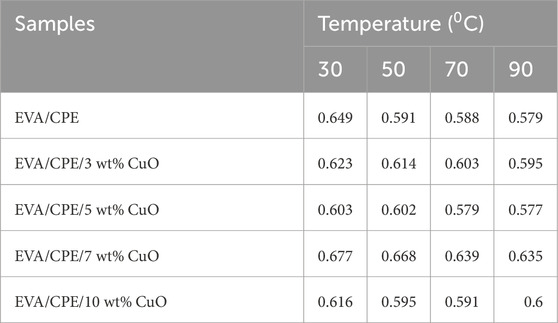
Table 1. “s” values of EVA/CPE/CuO nanocomposites from 30 °C to 90 °C.
3.9.2 Activation energy
The activation energy denotes the minimum energy necessary for a charge carrier to facilitate conduction. The dependence of conductivity on activation energy (Ea) and temperature (T) is described by the Arrhenius exponential law of conductivity, expressed according to the following Equation 10:
Where σ0 is the pre-exponential factor and K is the Boltzmann constant (Morsi et al., 2024). Log σac versus 1000/T plots for EVA/CPE blend and EVA/CPE/CuO nanocomposites are illustrated in Figure 13. The linear regression graphs confirm that the samples adhere to Arrhenius law. Activation energy, calculated from the slope of the plots at frequencies ranging from 102 Hz to 106 Hz is tabulated in Table 2. The data demonstrate that the activation energy diminishes as the nanoparticle content increases, attaining its minimum at the 5 wt% sample. The decreased activation energy indicates increased electrical conductivity. The homogeneous distribution of nanoparticles at this concentration enhances the effective hopping of charge carriers between localized states, thus promoting superior charge transport inside the composite (El, 2020). At CuO loadings above 5 wt%, nanoparticle agglomeration impede electron hopping, leading to higher sactivation energy.
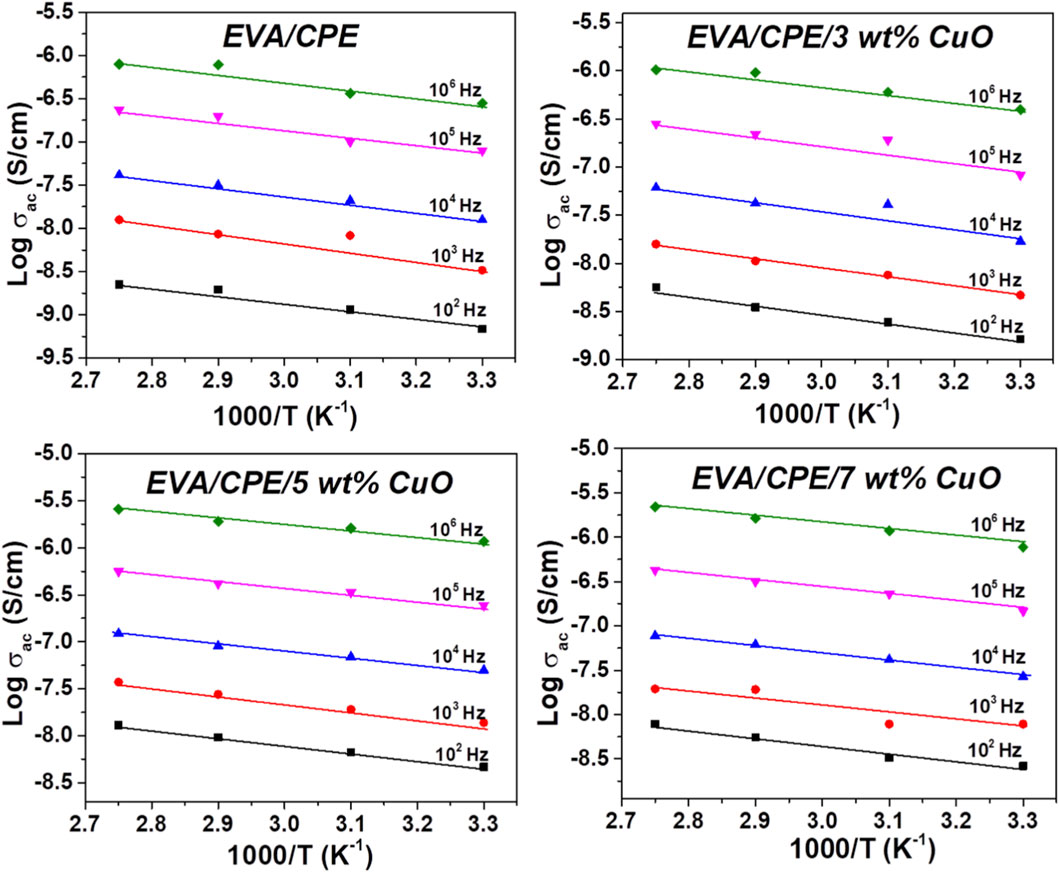
Figure 13. Arrhenius plots of EVA/CPE blend and its nanocomposites.
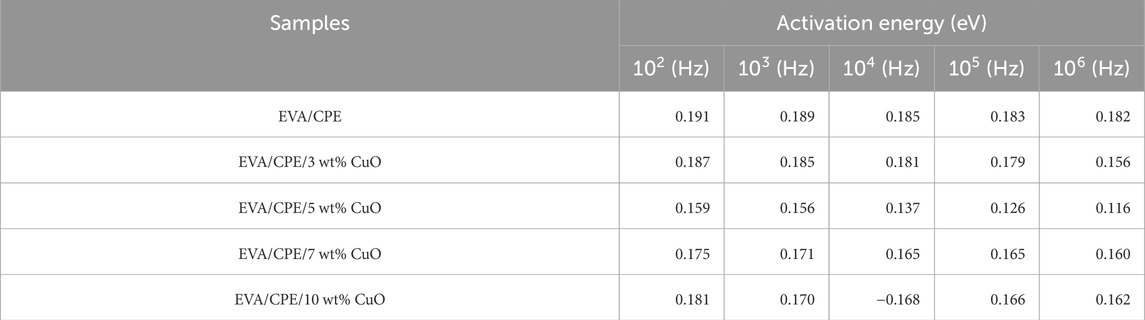
Table 2. Activation energy of EVA/CPE/CuO nanocomposites.
3.10 AC impedance analysis and nyquist plots
Impedance is a measure of opposition to electrical current flow in an AC circuit. The complex impedance (Z*) is given by Equation 11:
Where, the real part,
Figure 14 illustrates the room temperature Nyquist plot (Z′ versus Z″) for the EVA/CPE blend and the EVA/CPE/CuO nanocomposites. In dielectric materials, this graph typically manifests as one or more semicircular arcs, which signify the bulk effects, grain boundary effects and interfacial effects. The Nyquist plots of all studied samples display a singular incomplete semicircle, indicate that the electrical response is dominated by the bulk properties of the material. This reflects a simple equivalent circuit model featuring a resistor and a capacitor arranged in a parallel configuration. Semicircles emanating from a singular point on the Nyquist plot provide further evidence of single-phase electrical behaviour, primarily governed by bulk conduction. The bulk resistance is determined from the point where the semicircles meet the Z′ axis of the low-frequency domain. The diameter of the semicircle is found to decrease with an increase in the concentration of CuO nanoparticles, indicating a reduction in bulk resistance (Sandhya Ra et al., 2022). With an increase in the concentration of CuO nanoparticles, there is a corresponding decrease in the diameter of the semicircle, with the minimum radius observed in the EVA/CPE/5 wt% CuO nanocomposite. This indicates the lowest bulk resistance, which contributes to the improved electrical conductivity facilitated by the conductive CuO networks present in the nanocomposite.
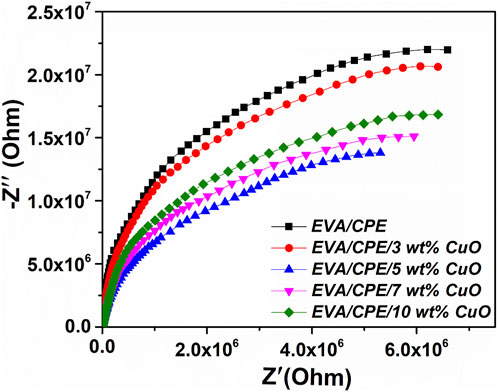
Figure 14. Nyquist plots of EVA/CPE blends and its nanocomposites with CuO nanoparticles.
The temperature-dependent Nyquist plot is presented in Figure 15. The graph illustrates an inverse correlation between temperature and resistance, the typical behaviour of a semiconductor material. The compressed semi-circular arc with a diminishing radius indicates a reduction in bulk resistance and a concomitant rise in conductivity, as evidenced by the conductivity experiments.
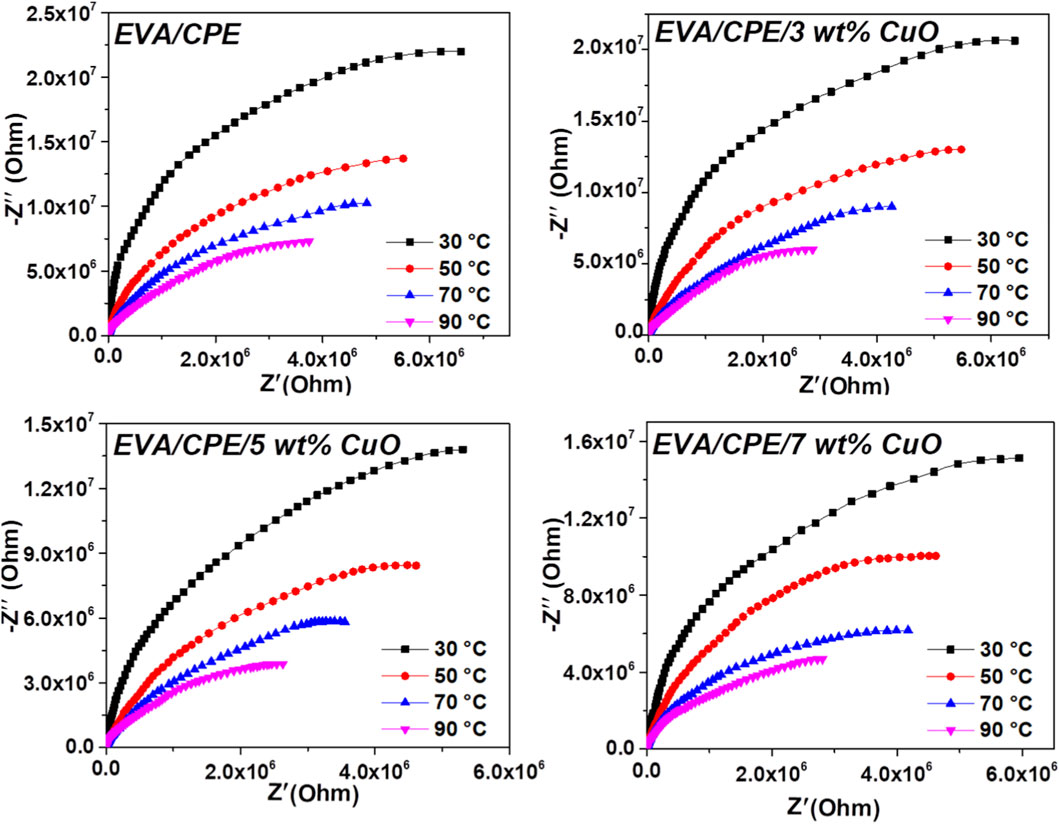
Figure 15. Nyquist plots of EVA/CPE blends and EVA/CPE/CuO nanocomposites at 30 °C, 50 °C, 70 °C and 90 °C.
3.11 Mechanical properties
Tensile strength, elongation at break, tear strength, impact strength and hardness are measured to assess the mechanical characteristics of the fabricated blend nanocomposite films. The findings are shown in Table 3. The data make it evident that the tensile strength of EVA/CPE blend increases with the addition of CuO nanoparticles, with a 60.8% enhancement noted for EVA/CPE/7 wt% CuO nanocomposite. The augmentation in tensile strength is due to the greater interfacial contact between the nanoparticle and the matrix at this concentration, which enables the composite to endure a greater spectrum of external forces without failure. Likewise, the powerful intermolecular interactions between the polar CuO and the polar functional groups in the polymer blend improve compatibility and facilitate more efficient stress transfer from the polymer matrix to the nanoparticle (Vishvanathperumal and Kannan, 2025). The decline in tensile strength at high loading is attributed to the development of nanoparticle aggregates within the rubber matrix. The marginal reduction in tensile strength at elevated concentrations of the nanocomposite is attributed to the development of nanoparticle agglomerates, which act as stress concentration sites, as indicated by SEM analysis. The results of the elongation at break analysis reveal a decline from 291% to 269% with an increase in nanoparticle concentration from 0 to 10 wt%. This finding suggests a reduction in ductility for the nanocomposites. The robust interfacial interactions in the nanocomposites facilitate the development of a cross-linked network structure, which imposes constraints on the mobility of polymer chains, thereby restricting their capacity to elongate when subjected to applied strain. Consequently, the material becomes more resistant to deformation, leading to lower elongation at break (Meera and Ramesan, 2024). The EVA/CPE/CuO nanocomposite demonstrates a notable increase in tear strength of 113.5% with a nanoparticle loading of 7 wt%, signifying a considerable improvement in its resistance to crack propagation. CuO nanoparticles promote efficient stress dissipation and impede the propagation of microcracks. They function as barriers that absorb and redistribute applied mechanical forces, therefore retarding failure (Kall et al., 2025). While in elevated nanoparticle loadings, a reduction in tear strength occurs due to the agglomeration of nanoparticles. These clusters act as channels for crack propagation. The impact strength assessment of the samples highlights the enhanced capacity of the fabricated nanocomposites to resist plastic deformation under abrupt loading conditions. The impact strength increases with CuO loading, reaching a maximum of 26.09 kJ/m2, which represents a 30.8% enhancement for the EVA/CPE/7 wt% CuO composite when compared to the pristine blend. The optimal concentration facilitates a large interfacial area, enabling the composite to effectively dissipate energy via matrix-nanoparticle interactions and the stretching of polymer chains. The data clearly indicate that the hardness of the nanocomposites, enhanced by the integration of rigid nanoparticles and EVA/CPE/10 wt% CuO, demonstrates an improvement of 13.5% compared to the blend. As the amount of nanoparticle content rises, the packing density also increases, resulting in a more compact and cross-linked network that exhibits enhanced resistance to indentation (Meera and Ramesan, 2024).
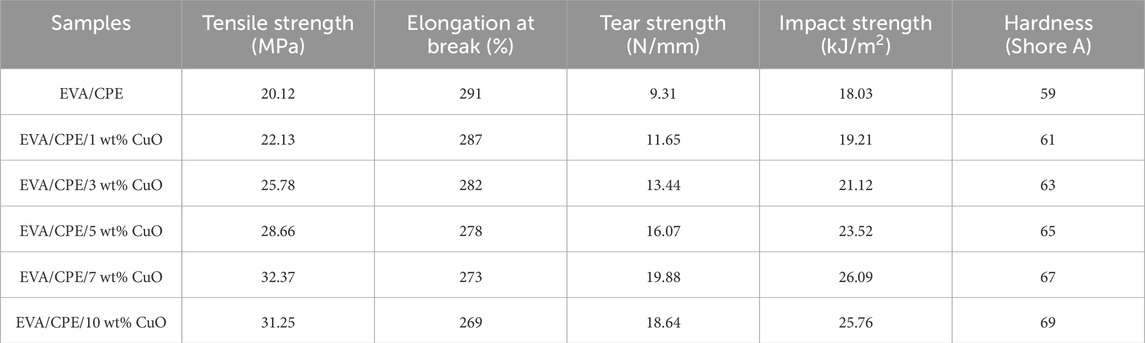
Table 3. Mechanical properties of EVA/CPE blend with different contents of CuO.
4 Conclusion
A series of EVA/CPE/CuO nanocomposites were effectively synthesized using a sustainable, one-step two-roll mill technique. The addition of CuO nanoparticles significantly improved the structural, optical, thermal, dielectric, electrical, and mechanical properties of the blend. Among the compositions, the 5 wt% CuO nanocomposites displayed the optimal combination of high dielectric constant, increased AC conductivity, reduced bandgap energy, thermal stability, and uniform nanoparticle dispersion, showing the efficient synergy between the polymer blend and nanoparticles. Mechanical characteristics were significantly increased with 7 wt% CuO loading, exhibiting higher tensile strength, tear strength, impact resistance, and hardness with minimum sacrifice in elongation. These results show that the carefully adjusted EVA/CPE/CuO nanocomposites are attractive candidates for optoelectronic devices, energy storage systems, and other advanced nanoelectronic applications, where multifunctional performance and reliable processing are necessary.
Data availability statement
The raw data supporting the conclusions of this article will be made available by the authors, without undue reservation.
Author contributions
MS: Data curation, Formal Analysis, Investigation, Methodology, Validation, Visualization, Writing – original draft. MR: Data curation, Funding acquisition, Project administration, Resources, Supervision, Validation, Writing – review and editing.
Funding
The authors declare that no financial support was received for the research and/or publication of this article.
Acknowledgements
The authors are grateful to Rubber Research Institute of India, Kottayam and sophisticated test and instrumentation centre (STIC), CUSAT for providing characterization facilities.
Conflict of interest
The authors declare that the research was conducted in the absence of any commercial or financial relationships that could be construed as a potential conflict of interest.
Generative AI statement
The authors declare that no Generative AI was used in the creation of this manuscript.
Any alternative text (alt text) provided alongside figures in this article has been generated by Frontiers with the support of artificial intelligence and reasonable efforts have been made to ensure accuracy, including review by the authors wherever possible. If you identify any issues, please contact us.
Publisher’s note
All claims expressed in this article are solely those of the authors and do not necessarily represent those of their affiliated organizations, or those of the publisher, the editors and the reviewers. Any product that may be evaluated in this article, or claim that may be made by its manufacturer, is not guaranteed or endorsed by the publisher.
References
Abdel-Kader, M. H., and Mohamed, M. B. (2024). Characterizing of PVA/CMC/MWCNTs nanocomposite films doped Zn0.9Ni0.1S nanoparticles for comprehensive γ-ray radiation shielding performance. Radiat. Phys. Chem. 224, 112027. doi:10.1016/j.radphyschem.2024.112027
Abdelghany, A. M., Meikhail, M. S., and Asker, N. (2019). Synthesis and structural-biological correlation of PVC\PVAc polymer blends. J. Mater. Res. Technol. 8 (5), 3908–3916. doi:10.1016/j.jmrt.2019.06.053
Abdelghany, A. M., Elashmawi, I. S., Al-Shamari, A. A., and Alnattar, H. (2023). Dielectric behavior and AC conductivity of PEO/CMC polymer blend incorporated with gold nanoparticles produced by laser ablation. J. Mater. Sci. Mater. Electron. 34 (5), 388. doi:10.1007/s10854-022-09797-z
Abdelrazek, E. M., Abdelghany, A. M., Tarabiah, A. E., and Zidan, H. M. (2019). AC conductivity and dielectric characteristics of PVA/PVP nanocomposite filled with MWCNTs. J. Mater. Sci. Mater. Electron. 30 (16), 15521–15533. doi:10.1007/s10854-019-01929-2
Ahmad, S., Tyagi, S., Joshi, M., and Ali, S. W. (2024). Effect of synthesized copper oxide nanorods on electrical and thermal properties of compatibilized high-density polyethylene/carbon nanofiber nanocomposite films. Polym. Compos. 45 (15), 14036–14051. doi:10.1002/pc.28752
Ahmed, J. (2024). Enhanced physico-mechanical properties of EVA/PA blends via electron beam irradiation and vinyl acetate content. Macromol. Res. 32 (3), 207–216. doi:10.1007/s13233-023-00223-9
Airam, M., Kargaran, F., Sabbagh, A., Ahmadi, S., Dawi, E. A., and Khonakdar, H. A. (2025). A review on poly (vinylidene fluoride)/thermoplastic polyurethane blends and their nanocomposites: a conceptual on smart behavior in energy-harvesting and storage applications. J. Mater. Sci. 60 (1), 63–97. doi:10.1007/s10853-024-10526-6
Alfaifi, A. H., Alkhattaby, L. A., El-Qahtani, Z. M., Al-Ghamdi, W., Althobaiti, H. A., Al-Balawi, S. A., et al. (2025). An insight into the influence of CuO NPs on the structural, dielectric, optical, and conductivity properties of PEO/PVA-CuO nanocomposite for energy storage nanoelectronic devices. Emergent Mater. 8 (1), 263–277. doi:10.1007/s42247-024-00974-w
Almarashi, J. Q. M., and Abdel-Kader, M. H. (2020). Exploring nano-sulfide enhancements on the optical, structural and thermal properties of polymeric nanocomposites. J. Inorg. Organomet. Polym. 30 (8), 3230–3240. doi:10.1007/s10904-020-01482-0
Anju, R., and Ramesan, M. T. (2024). Synergistic enhancement of properties in copper oxide-reinforced polystyrene nanocomposites via in situ polymerization. J. Therm. Analysis Calorim. 149 (17), 9285–9296. doi:10.1007/s10973-024-13493-x
Anwar, N., Shakoor, A., Niaz, N. A., Ali, G., Qasim, M., Irfan, M., et al. (2022). Investigation of dielectric relaxation behavior, electric modulus and ac conductivity of low doped polyaniline cadmium oxide (PANI-CdO) nanocomposites. Polym. Bull. 79 (8), 6581–6600. doi:10.1007/s00289-021-03766-y
Aziz, S. B., and Abidin, Z. H. (2015). Ion-transport study in nanocomposite solid polymer electrolytes based on chitosan: electrical and dielectric analysis. J. Appl. Polym. Sci. 132 (15), 41774. doi:10.1002/app.41774
Azizli, M. J., Vafa, E., Rezaeeparto, K., Honarkar, H., Parham, S., Azizli, F., et al. (2023). Impact on summation of reduced graphene oxide and compatibilization efficacy of LLDPE-g-MA on mechanical, thermal, morphological, and rheological properties of LLDPE/EVA nanocomposites. J. Polym. Res. 30 (11), 420. doi:10.1007/s10965-023-03800-9
Bo, R., Wang, C., Wang, Y., He, P., and Han, Z. (2023). Co-modulated interface binding energy and electric field distribution of layer-structured PVDF-LDPE dielectric composites with BaTiO3: experiment and multiscale simulations. Front. Mater. Sci. 17 (3), 230657. doi:10.1007/s11706-023-0657-5
Duan, G., Wang, Y., Yu, J., Zhu, J., and Hu, Z. (2019). Improved thermal conductivity and dielectric properties of flexible PMIA composites with modified micro-and nano-sized hexagonal boron nitride. Front. Mater. Sci. 13 (1), 64–76. doi:10.1007/s11706-019-0446-3
El, S. A. M. (2020). Synthesis, optical, thermal, electric properties and impedance spectroscopy studies on P (VC-MMA) of optimized thickness and reinforced with MWCNTs. Results Phys. 17, 103025. doi:10.1016/j.rinp.2020.103025
El-Naggar, A. M., Alhaqbani, N., Mohamed, M. B., Kamal, A., Albassam, A., and Lakshminarayana, G. (2024). Structural, optical, dielectric and electrical characteristics of flexible blended polymers based on PMMA/PVAc/TBAI and milled PANI for energy storage applications and optoelectronic devices. J. Mol. Liq. 414, 126131. doi:10.1016/j.molliq.2024.126131
Elkalashy, S. I., Khater, S. I., and Zaki, M. F. (2024). Boosting of structural, thermal, linear, and nonlinear optical properties of PVA/PVP blend using titanium dioxide filler. Polym. Eng. Sci. 64 (9), 4321–4331. doi:10.1002/pen.26850
Ge, F. F., Du, J. H., Yao, W. H., Suntamit, B., Wu, C., Potiyaraj, P., et al. (2025). Enhanced mechanical, thermal, barrier, and antibacterial properties of polypropylene nanocomposites reinforced with nano-silver carbon black. Polym. Eng. Sci. 65 (3), 1549–1566. doi:10.1002/pen.27110
Hassan, A. U., Sumrra, S. H., Nazar, M. F., and Güleryüz, C. (2023). A DFT study on new photovoltaic dyes to investigate their NLO tuning at near infrared region (NIR) as pull–push effect by end capped acceptors. J. Fluoresc. 33 (1), 239–253. doi:10.1007/s10895-022-03075-1
Huan, T. D., Boggs, S., Teyssedre, G., Laurent, C., Cakmak, M., Kumar, S., et al. (2016). Advanced polymeric dielectrics for high energy density applications. Prog. Mater. Sci. 83, 236–269. doi:10.1016/j.pmatsci.2016.05.001
Kaliyaperumal, C., Marndi, S. K., Sankarakumar, A., and Paramasivam, T. (2023). Physical insights into the grain size effect on the electrical properties of nanocrystalline La2Zr2O7 pyrochlores. Ceram. Int. 49 (7), 10663–10672. doi:10.1016/j.ceramint.2022.11.254
Kalladi, A. J., Jayalakshmi, K., and Ramesan, M. T. (2025). One-step polymerization of polyvinyl alcohol/cashew gum/polypyrrole/copper oxide nanocomposites for high-performance flexible films in optoelectronics. J. Vinyl Addit. Technol. 31 (2), 413–426. doi:10.1002/vnl.22179
Kausar, R., Khan, M. A., Rasool, R. T., Arshad, M., and Ashraf, G. A. (2024). Structural, morphological, spectral, XPS, and dielectric properties of Ba4Co2NdxFe36-xO60 nanocrystalline materials. Chem. Pap. 78 (9), 5349–5366. doi:10.1007/s11696-024-03473-8
Lado-Touriño, I., and Merodio-Perea, R. G. (2025). Molecular dynamics simulations of sustainable green binders for metal injection molding. Sustainability 17 (5), 2263. doi:10.3390/su17052263
Li, Z., Liu, Q., Tang, S., Feng, D., Zhao, W., Li, B., et al. (2023). Dual modification of EVA by long chain phosphaphenanthrene grafted MXene and black phosphorene nanosheets for simultaneously enhanced thermal stability and flame retardancy. Colloids Surfaces A Physicochem. Eng. Aspects 664, 131198. doi:10.1016/j.colsurfa.2023.131198
Mao, Z., Sun, H., and Zhang, J. (2021). Selective distribution of SrTiO3 in co-continuous composites: an effective method to improve the dielectric and mechanical properties. Compos. Part A Appl. Sci. Manuf. 143, 106312. doi:10.1016/j.compositesa.2021.106312
Marossy, K. (2023). Thermally stimulated discharge (TSD) study of low-temperature transitions in chlorine-containing polymers. J. Therm. Analysis Calorim. 148 (5), 1899–1903. doi:10.1007/s10973-022-11803-9
Meera, K., and Ramesan, M. T. (2024). Eco-friendly polyethylene oxide/aluminum oxyhydroxide nanocomposites for flexible energy storage devices. Energy Technol. 12 (12), 2401416. doi:10.1002/ente.202401416
Mohamed, M. B., and Abdel-Kader, M. H. (2019). Effect of excess oxygen content within different nano-oxide additives on the structural and optical properties of PVA/PEG blend. Appl. Phys. A 125 (3), 209. doi:10.1007/s00339-019-2492-1
Mohamed, M. B., and Abdel-Kader, M. H. (2020). Effect of annealed ZnS nanoparticles on the structural and optical properties of PVA polymer nanocomposite. Mater. Chem. Phys. 241, 122285. doi:10.1016/j.matchemphys.2019.122285
Morsi, M. A., Al-Sulami, A. I., Al Sulami, F. M., Farea, M., Alqarni, M. A., Alhazime, A. A., et al. (2024). Preparation, structural characterization, optical, photoluminescence, AC electrical conductivity and broadband dielectric properties of WO3 reinforced PEG/CS blend for futuristic optoelectronic and energy storage devices. Results Phys. 59, 107582. doi:10.1016/j.rinp.2024.107582
Rajeswari, N., Selvasekarapandian, S., Sanjeeviraja, C., Kawamura, J., and Asath Bahadur, S. (2014). A study on polymer blend electrolyte based on PVA/PVP with proton salt. Polym. Bull. 71 (5), 1061–1080. doi:10.1007/s00289-014-1111-8
Ramesan, M. T. (2005). The effects of filler content on cure and mechanical properties of dichlorocarbene modified styrene butadiene rubber/carbon black composites. J. Polym. Res. 11 (4), 333–340. doi:10.1007/s10965-005-6571-y
Ramesan, M. T. (2013). Preparation and properties of Fe3O4/Polypyrrole/poly(pyrrole-co-acrylamide) nanocomposites. Int. J. Polym. Mater. 62 (5), 277–283. doi:10.1080/00914037.2012.664207
Ramesan, M. T. (2014). Effect of fly ash on thermal stability, flammability, oil resistance and transport properties of chlorinated styrene butadiene rubber composites. J. Elastomers Plastics 46 (4), 303–324. doi:10.1177/0095244312468440
Ramesan, M. T., and Alex, R. (1998). Dichlorocarbene modification of styrene–butadiene rubber. J. Appl. Polym. Sci. 68 (1), 153–160. doi:10.1002/(SICI)1097-4628(19980404)68:1<153::AID-APP17>3.0.CO;2-1
Ramesan, M. T., and Alex, R. (2001). Compatibilization of SBR/NBR blends using chemically modified styrene-co-butadiene rubber Part 2. Effect of compatibilizer loading. Polym. Int. 50 (12), 1298–1308. doi:10.1002/pi.775
Ramesan, M. T., and Jayakrishnan, P. (2017). Role of nickel oxide nanoparticles on magnetic, thermal and temperature dependent electrical conductivity of novel poly (vinyl cinnamate) based nanocomposites: applicability of different conductivity models. J. Inorg. Organomet. Polym. 27 (1), 143–153. doi:10.1007/s10904-016-0456-x
Ramesan, M. T., George, A., Jayakrishnan, P., and Kalaprasad, G. (2016). Role of pumice particles in the thermal, electrical and mechanical properties of poly (vinyl alcohol)/poly (vinyl pyrrolidone) composites. J. Therm. Analysis Calorim. 126 (2), 511–519. doi:10.1007/s10973-016-5507-6
Ren, H., Weng, H., Zhao, P., Zuo, R., Lu, X., and Huang, J. (2022). Preparation of porous sea-urchin-like CuO/ZnO composite nanostructure consisting of numerous nanowires with improved gas-sensing performance. Front. Mater. Sci. 16 (1), 220583. doi:10.1007/s11706-022-0583-y
Sandhya Rani, N., Swapna, H. D., Karthik, R., and Manasa, C. (2022). Morphological, electrical, dielectric, and complex electrical modulus studies of copper ion conducting HPMC/PVA hosted nanocomposite electrolyte films. Ionics 28 (4), 1851–1862. doi:10.1007/s11581-021-04400-7
Saron, K. M., Ghalab, S., Ibrahim, M., Asnag, G. M., Qahtan, T. F., and Hanash, F. E. (2024). Controlling the dielectric and optical properties of polyvinyl alcohol/polyethylene glycol blends by adding copper oxide nanoparticles for application in energy storage devices. J. Sol-Gel Sci. Technol. 109 (3), 757–772. doi:10.1007/s10971-024-06320-0
Stoeva, S. (2004). Structural and conformational changes in solid-phase chlorinated polyethylene. J. Appl. Polym. Sci. 94 (1), 189–196. doi:10.1002/app.20854
Suhailath, K., and Ramesan, M. T. (2019). Effect of neodymium-doped titanium dioxide nanoparticles on the structural, mechanical, and electrical properties of poly(butyl methacrylate) nanocomposites. J. Vinyl Addit. Technol. 25 (1), 9–18. doi:10.1002/vnl.21673
Suhailath, K., Ramesan, M. T., Naufal, B., Periyat, P., Jasna, V. C., and Jayakrishnan, P. (2017). Synthesis, characterisation and flame, thermal and electrical properties of poly (n-butyl methacrylate)/titanium dioxide nanocomposites. Polym. Bullettin 74 (3), 671–688. doi:10.1007/s00289-016-1737-9
Suvarna, S., and Furhan, R. M. T. (2023). Structural, conductivity, mechanical and wettability properties of copper alumina reinforced chlorinated polyethylene/polyvinyl chloride blend nanocomposites. Res. Chem. Intermed. 49 (5), 1891–1908. doi:10.1007/s11164-022-04881-9
Suvarna, S., Niranjana, V. S., Subburaj, M., and Ramesan, M. T. (2022). Temperature-dependent conductivity, optical properties, thermal stability and dielectric modelling studies of Cu-Al2O3/CPE/PVC blend nanocomposites. Bull. Mater. Sci. 45 (4), 246. doi:10.1007/s12034-022-02829-8
Vishvanathperumal, S., and Kannan, A. (2025). Effect of graphene oxide (GO) on the mechanical properties of ethylene-propylene-diene monomer/acrylonitrile butadiene rubber (EPNBR) blend composites. J. Polym. Res. 32 (4), 145. doi:10.1007/s10965-025-04393-1
Yang, B., Zhang, H., Guo, J., Liu, Y., and Li, Z. (2016). Electrical properties and thermal sensitivity of Ti/Y modified CuO-based ceramic thermistors. Front. Mater. Sci. 10 (4), 413–421. doi:10.1007/s11706-016-0355-7
Yassin, A. Y., Mohamed, A. R., Abdelrazek, E. M., Morsi, M. A., and Abdelghany, A. M. (2019). Structural investigation and enhancement of optical, electrical and thermal properties of poly (vinyl chloride-co-vinyl acetate-co-2-hydroxypropyl acrylate)/graphene oxide nanocomposites. J. Mater. Res. Technol. 8 (1), 1111–1120. doi:10.1016/j.jmrt.2018.08.005
Zhang, B. S., Zhang, Z. X., Lv, X. F., Lu, B. X., and Xin, Z. X. (2012). Properties of chlorinated polyethylene rubber/ethylene vinyl acetate copolymer blend-based foam. Polym. Eng. Sci. 52 (1), 218–224. doi:10.1002/pen.22071
Zhang, Z., Zhang, J., Lucia, L. A., and Abidi, N. (2024). Bamboo fiber reinforced poly (acrylonitrile-styrene-acrylic)/chlorinated polyethylene via compabilization. Int. J. Biol. Macromol. 266, 131287. doi:10.1016/j.ijbiomac.2024.131287
Zhao, Y., Li, Q., Zhang, X., Li, H., Lu, J., and Zhang, Z. (2018). High energy density and discharging efficiency achieved in chlorinated polyethylene films for high energy-storage applications. Macromol. Chem. Phys. 219 (8), 1700621. doi:10.1002/macp.201700621
Zhao, L., Chen, Z., Ren, J., Yang, L., Li, Y., Wang, Z., et al. (2022). Synchronously improved thermal conductivity and dielectric constant for epoxy composites by introducing functionalized silicon carbide nanoparticles and boron nitride microspheres. J. Colloid Interface Sci. 627, 205–214. doi:10.1016/j.jcis.2022.07.058
Keywords: ethyl vinyl acetate, chlorinated polyethylene, blend, copper oxide, dielectric properties
Citation: Shini M and Ramesan MT (2025) Copper oxide–reinforced ethyl vinyl acetate/ chlorinated polyethylene blend nanocomposites: eco-friendly design of high-performance electroactive materials. Front. Mater. 12:1706929. doi: 10.3389/fmats.2025.1706929
Received: 16 September 2025; Accepted: 10 November 2025;
Published: 28 November 2025.
Edited by:
Antonio J Paleo, University of Minho, PortugalReviewed by:
Sameer Ahmad, Jamia Millia Islamia, IndiaMohamed Hassan Abdelkader, Taibah University, Saudi Arabia
Copyright © 2025 Shini and Ramesan. This is an open-access article distributed under the terms of the Creative Commons Attribution License (CC BY). The use, distribution or reproduction in other forums is permitted, provided the original author(s) and the copyright owner(s) are credited and that the original publication in this journal is cited, in accordance with accepted academic practice. No use, distribution or reproduction is permitted which does not comply with these terms.
*Correspondence: M. T. Ramesan, bXRyYW1lc2FuQHVvYy5hYy5pbg==