 Tony D. Kelly1
 James C. Petrosky1John W. McClory1
 Volodymyr T. Adamiv2
 Yaroslav V. Burak2Bohdan V. Padlyak2,3
 Ihor M. Teslyuk2Ning Lu4,5Lu Wang4Wai-Ning Mei4
 Peter A. Dowben5*
- 1Department of Engineering Physics, Air Force Institute of Technology, Dayton, OH, USA
- 2Institute of Physical Optics, Lviv, Ukraine
- 3Division of Spectroscopy of Functional Materials, Department of Physics, University of Zielona Góra, Zielona Góra, Poland
- 4Department of Physics, University of Nebraska at Omaha, Omaha, NE, USA
- 5Department of Physics and Astronomy, Nebraska Center for Materials and Nanoscience, University of Nebraska-Lincoln, Lincoln, NE, USA
The four dopants (Nd, Gd, Dy, and Er) substitutionally occupy the Li+ sites in lithium tetraborate (Li2B4O7: RE) glasses as determined by analysis of the extended X-ray absorption fine structure. The dopants are coordinated by 6-8 oxygen at a distance of 2.3 to 2.5 Å, depending on the rare earth. The inverse relationship between the RE-O coordination distance and rare earth (RE) atomic number is consistent with the expected lanthanide atomic radial contraction with increased atomic number. Through analysis of the X-ray absorption near edge structure, the rare earth dopants adopt the RE3+ valence state. There are indications of strong rare earth 5d hybridization with the trigonal and tetrahedral formations of BO3 and BO4 based on the determination of the rare earth substitutional Li+ site occupancy from the X-ray absorption near edge structure data. The local oxygen disorder around the RE3+ luminescence centers evident in the structural determination of the various glasses, and the hybridization of the RE3+ dopants with the host may contribute to the asymmetry evident in the luminescence emission spectral lines. The luminescence emission spectra are indeed characteristic of the expected f-to-f transitions; however, there is an observed asymmetry in some emission lines.
Introduction
Materials containing boron investigated for solid state neutron detection [1] include semiconducting boron carbide [1–12], boron nitride [13–15], boron phosphide [16–19], Mg2B14 [20] and lithium borates [21–27]. In particular, undoped lithium tetraborate (Li2B4O7) is capable of being enriched with 6Li up to 95% and 10B up to 97.3% [26], well above the natural abundances (6Li–7.42%, 10B–19%), thereby increasing thermal neutron capture [1, 21, 26].
Many rare earth (RE) ions exhibit high luminescence efficiency in host borate crystals and glasses with various chemical compositions [27–46]. Consequently, combining rare earth dopants with the high thermal neutron capture cross-sections of 6Li and 10B may result in highly efficient neutron scintillators [26, 27, 46, 47]. In lithium tetraborate, this is particularly true as undoped Li2B4O7 has a wide band gap of ~9.8 eV, based on measurements of {100} and {110} oriented single crystals [24, 48–51] and is highly transparent in the visible spectrum. In general, the borates, including lithium tetraborate (Li2B4O7) single crystals, are characterized by high optical transmission from far infrared to vacuum ultraviolet [49, 52].
Obtaining single crystal Li2B4O7 is technologically challenging; thus, application to large area scintillation detectors will favor glasses over single crystals due to lower fabrication costs. The very low crystal growth velocity and high melt viscosity lead to difficulties with dopants, particularly rare earths [53, 54]. Therefore, from the technological viewpoint, the vitreous Li2B4O7 compounds are more advantageous when compared with their crystalline analogs.
Padlyak, Teslyuk and coworkers studied the luminescence properties of some rare earth doped lithium tetraborate (Li2B4O7:RE) glasses [39, 41]. They deduced from the optical characteristics that the rare earths generally occupy the Li+ site exclusively in the +3 valence state. Compared to other rare earth doped borates and crystalline counterparts, a broadening of the spectral lines was observed which was theorized to be a result of the dopant interaction with a varying O-coordination environment in the glassy material. Studying this varying O-coordination structure is not ideal [55] with traditional bulk diffraction measurements (e.g., XRD) due to the lack of long range order. Instead, a more localized probe such as extended X-ray absorption fine structure (EXAFS) may be used.
In this research, lithium tetraborate glasses have been separately doped with four different rare earth elements: Nd, Gd, Dy, and Er. The local environment about the dopants was studied with EXAFS in order to determine the positional disorder of the varying O environment, an average coordination number and bond length, and to assist in validating the presumption that a varying O-environment is the source of the spectral line broadening. Further, the experimentally determined site has been used as a basis for density functional theory (DFT) calculations to investigate the electronic nature behind the spectral line broadening observed in the emission spectra.
Materials and Methods
The doped Li2B4O7:Nd, Li2B4O7:Gd, Li2B4O7:Dy, and Li2B4O7:Er glasses were obtained in the air from corresponding polycrystalline compounds according to standard glass synthesis. For solid state synthesis of the doped materials, highly pure carbonate (Li2CO3) and boric acid (H3BO3) were used. Solid-state synthesis of the doped Li2B4O7:RE compounds was carried out using a multi-step heating process that follows the reaction sequence [39, 41]:
The Nd, Gd, Dy, and Er impurities were added as RE2O3 (RE= Nd, Gd, Dy, and Er) in amounts of 0.5 and 1.0 mol. %. Large doped glasses were obtained by fast cooling of the corresponding melt that was heated more than 100 K higher than the melting temperature for excluding the crystallization processes. Samples were cut for optical measurements and polished to a size of approximately 5 × 3 × 2 mm3.
Optical absorption spectra were recorded at room temperature with a Varian spectrophotometer (model 5E UV–VIS–NIR). Emission and luminescence excitation spectra were acquired with a Dongwoo (model DM711) scanning system consisting of an excitation monochromator with 150 mm focal length and emission monochromator having 750 mm focal length equipped with a photomultiplier and an InGaAs detector.
The Li2B4O7:RE extended X-ray absorption fine structure (EXAFS) spectra were measured using a double crystal monochromator of Lemonnier type [56] at the DCM and WDCM beamlines located at the Center for Advanced Microstructures and Devices (CAMD) [57–59]. Due to the thickness of the glass samples and low dopant concentrations (nominally 1%), the absorption spectra were measured in fluorescence mode and the spectra analyzed without self-absorption corrections. For all samples, the L3 (2p3/2) edge fluorescence was measured corresponding to the M5-L3 (3d5/2–2p3/2) transition and was found to be in reasonable agreement with expectations [60].
The EXAFS spectra were analyzed in two different ways. First, the spectra were analyzed using standard procedures with the IFEFFIT tool suite and FEFF 6 [61–65]. This consisted of isolating the EXAFS signal, converting to k-space, then using the Fourier transform to determine the average coordination number and element-type around the rare earth dopants, as detailed elsewhere for other doped Li2B4O7 crystals [66] and glasses [67]. The second method of analysis employed the use of a Latin hyper-cube sampling (LHS) routine and the scattering code FEFF 9 for phase shifts and backscattering amplitudes. This code was developed as a bridge between a Monte Carlo modeling approach and traditional EXAFS fitting and is a more recent development. The power of this latter approach lies in the ability to cover a very large parameter space in modeling the experimental data and locating false minima in the fits to the data. The results of both analysis methods are generally in agreement, although the Latin hyper cube (LHS) approach is computationally faster.
Despite the glassy nature of the samples that may result in positional disorder around the RE dopant, the model used for fitting the EXAFS was based on the known crystal structure (Figure 1) of Li2B4O7 [49; 55, 68–69]. This was an appropriate starting point for analyzing EXAFS spectra that will on average reflect the coordinating environment, including an average distance to the first shell and an average coordination number. As it is hypothesized that the rare earth dopants will substitutionally dope for the Li+ atoms, starting with the crystalline model and then adjusting the O environment to reflect the average coordinating environment makes the most sense. Furthermore, due to the low Z nature of the glassy matrix, it is expected that the photoelectric backscattering signal will be very weak beyond the first shell, unless there is significant dopant clustering in the material, which would result in a detectable RE-RE scattering shell.
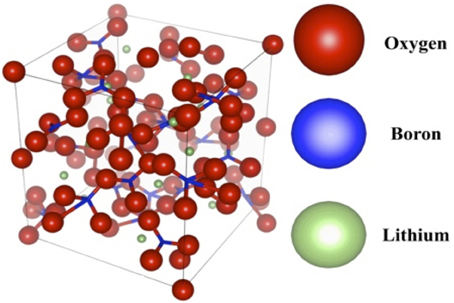
Figure 1. The undoped lithium tetraborate unit cell. The 104-atom-unit cell consists of bridging BO3 and BO4 complexes [63, 64], with Li+ ions distributed throughout.
Optical Absorption and Luminescence
High-quality scintillation is dependent upon significant quantum efficiency while retaining optical transparency [27, 43–47]. For energies less than 3.3 eV (wave lengths longer than 375 nm) the absorption is low [26, 27, 49, 70, 71] and the optical absorption spectra of the investigated glasses are dominated by absorption bands of the Nd3+, Gd3+, Dy3+, and Er3+ centers and can be generally assigned to the appropriate electronic f to f transitions, as illustrated for the doped Li2B4O7:Nd glass in Figure 2.
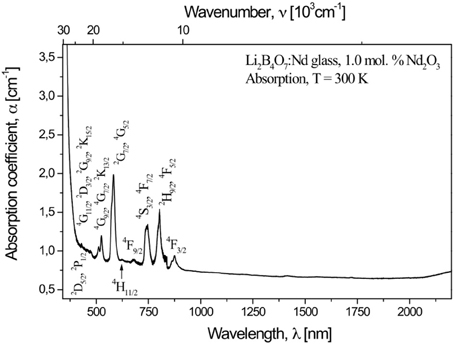
Figure 2. The optical absorption spectrum of Nd3+ centers in Li2B4O7:Nd glass.
Although the luminescence emission spectra are characteristic of the f to f transitions of the +3 rare earth ions, the effect of the host matrix plays a role. In the case of the Nd3+ centers, where four characteristic f to f transition bands due to the 4F3/2 → 4I9/2, 4F3/2 → 4I11/2, 4F3/2 → 4I13/2, and the 4F3/2 → 4I15/2 dipole transitions (some shown in Figure 3) combine to provide a net quantum efficiency of 24%, inhomogeneous broadening of spectral lines does occur [72, 73]. We know that the rare earth states will couple to the host matrix, as clearly demonstrated for rare earth doped GaN [74]. As with prior studies [41], the rare earth ions are placed in the Li+ site but there is positional disorder of the RE3+ luminescence centers in the Li+ sites of the Li2B4O7 lattice and this is characterized by slightly different spectroscopic parameters compared to other rare earth doped borates and crystalline counterparts. EXAFS studies of the L3 edge indicate that the local structure (first coordination shell) around the rare earth ions in glassy lithium tetraborate samples is closely similar. This similar result was observed in the EXAFS study of rare earth impurities on crystal and glass samples of the CaO–Ga2O3–GeO2 system [75]. The structural studies must be understood in this context.
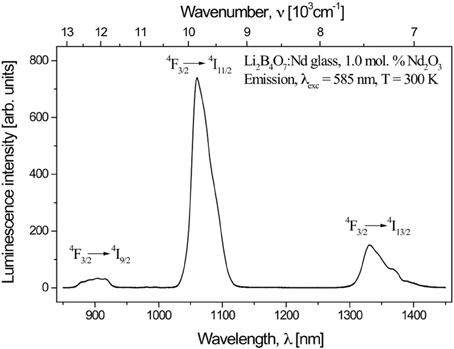
Figure 3. The luminescence emission spectrum of Nd3+ in Li2B4O7:Nd glass.
Extended X-Ray Absorption Fine Structure
In Figure 4, the normalized experimental XAFS signal is plotted for Li2B4O7:Nd. All the rare earth doped samples of this study, Li2B4O7:Nd, Li2B4O7:Gd, Li2B4O7:Dy, and Li2B4O7:Er, have very similar XAFS spectra (Figure 4 inset), including the presence of the sharp white line: a strong feature just above the absorption edge. The measured L3 edge for the Li2B4O7:Nd was determined to be 6212 eV by identifying the inflection point on the rising photoelectric edge, or about 4 eV greater than the expected 6208 eV [60]. This shift in the dopant core level absorption edge is typical of lithium tetraborate and in some cases has been attributed to the large band gap of this oxide, even when doped [66] (although such a shift is commonly related to the charge on the absorbing element – a rare earth in this case). This shift in the L3 absorption edge is similar for all the data obtained for all four of the rare earth doped Li2B4O7 glass samples.
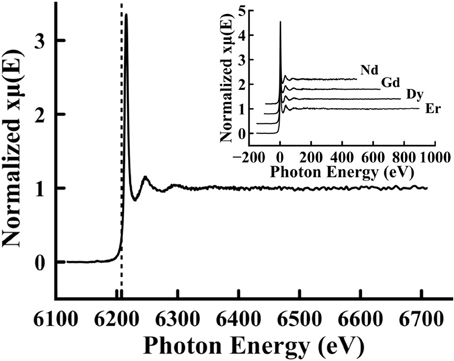
Figure 4. X-ray absorption fine structure spectrum of Li2B4O7:Nd. The absorption coefficient was measured for the L3 edge from 100 eV below the edge to approximately 500 eV above the edge. In addition to the X-ray absorption fine structure, a vertical line is shown at 6208 eV, which is at a smaller value than the experimental edge found to be 6212 eV. In the inset, the X-ray absorption fine structure spectra for all four samples (Nd, Gd, Dy, and Er) are plotted, shifted by their absorption edge energies so that they are centered at 0 eV to compare them directly.
In Figure 5, the experimental EXAFS spectra have been extracted from the data in Figure 4, taken above the rare earth dopant L3 edge, have been replotted as a function of wave vector k for the Li2B4O7:Nd, Li2B4O7:Gd, Li2B4O7:Dy, and Li2B4O7:Er glass samples. In all cases, the EXAFS is evident up to approximately 6 Å−1 and is similar for the rare earth doped lithium tetraborate samples studied, with only small shifts. The signal-to-noise in the EXAFS spectra deteriorate with wave vectors greater than about 7.5 Å−1 as is expected for glassy samples when the host matrix about the dopant consists primarily of low Z material [55, 67]. The energy range available for the various EXAFS spectra is limited by the presence of the L2 edge; hence, higher Z elements have a wider EXAFS energy range.
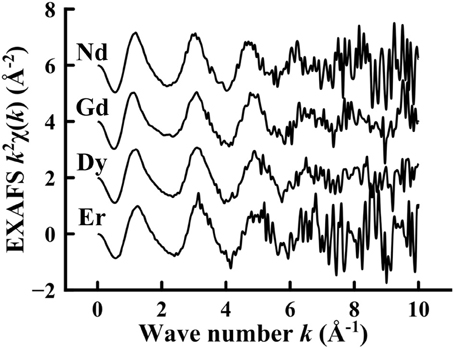
Figure 5. The k2 weighted extended X-ray absorption fine structure taken above the L3 rare earth dopant edge for Li2B4O7:Nd, Li2B4O7:Gd, Li2B4O7:Dy and Li2B4O7:Er.
The rare earth doped lithium tetraborates are very similar in structure, as is evident from the EXAFS spectra in Figure 5. The similarity in the EXAFS features for all the samples is an indication that the rare earths dope the Li2B4O7 lattice in a similar fashion. This is expected, as nearly all lanthanides adopt the +3 valence state [27–47]. In spite of the similarities of the spectra obtained for the Li2B4O7:Nd, Li2B4O7:Gd, Li2B4O7:Dy, and Li2B4O7:Er glass samples, there are small shifts in wave vector placement of the EXAFS oscillations with increasing atomic number. This characteristic shift in the EXAFS features corresponds to smaller bond lengths with increasing atomic number (lanthanide contraction); larger wave vector components correspond to smaller bond lengths in the Fourier transformation to R-space.
The reliability of the structural information from our EXAFS data is limited in scope to the first coordination shell due to the signal-to-noise deterioration. Furthermore, the structural information is an indication of the average environment due to the glassy nature of the lithium tetraborate host. The Fourier transformed EXAFS spectrum for Li2B4O7:Nd is plotted in Figure 6. The Fourier transformed EXAFS is typical for all the rare earth doped glass samples studied: Li2B4O7:Nd, Li2B4O7:Gd, Li2B4O7:Dy, and Li2B4O7:Er. The out-of-phase real and imaginary components of the R-space signal (plotted in Figure 6) demonstrate the high level of confidence that may be placed in the Fourier transform.
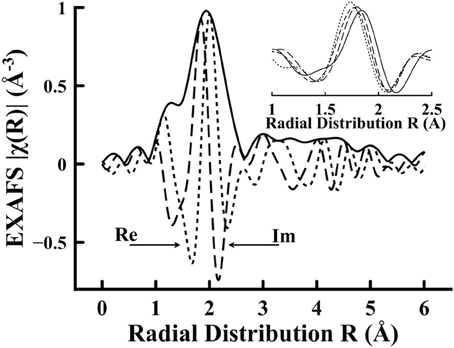
Figure 6. The Fourier transformed extended X-ray absorption fine structure signal (solid) for Li2B4O7:Nd plotted in Figure 5. The real (long dash) and imaginary (small dash) components are plotted to show Fourier transform contributions. In the inset, the Fourier transform imaginary components for Nd, Gd, Dy, and Er are shown. There is a trend from left to right in the inset, with the left most (small dash) line resulting from the Er doped sample and then as the atomic number decreases the peak position moves to longer bond length (Er → Dy → Gd → Nd) with Nd as the right most (solid) line.
In the inset of Figure 6, the imaginary component for the Fourier transforms of the data of Figure 5 are plotted for all the doped samples. Traditionally, peaks in the imaginary spectra for EXAFS transforms have been correlated to physical distance in the radial distributions. Figure 7 is provided to show the quality of the EXAFS fit results and is indicative of the RE located substitutionally in a Li+ site. Although all the fits are not exact, this and the extracted coordination numbers are an indication of multiple interactions being measured coherently. If each interaction was known exactly, then a multiple-FEFF calculation could be made and different weights applied to each in order to determine an exact fit. Figure 7, nonetheless, demonstrates that the fits, despite deficiencies, are acceptable for all of the studied doped glass samples. The bond length contraction is noticeable with increasing Z, matching with the inset of Figure 6. The fit quality may be determined from the fitting parameters given in Table 1 for both the standard fitting method and using the LHS routine. For this result of the rare earth dopant substituting in a Li+ site, the greater charge of the RE3+ dopant may be easily compensated by anion vacancies, (VLi)− and (VB)3−, elsewhere in the glassy matrix.
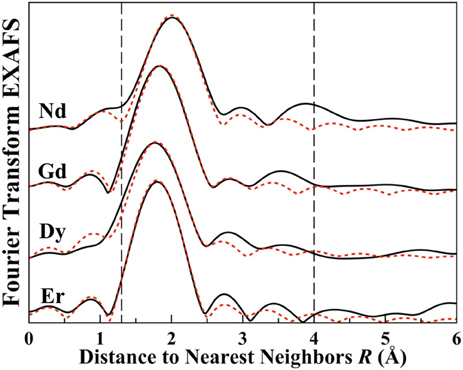
Figure 7. Plotted are the R-space Fourier transformed extended X-ray absorption fine structure signals for Li2B4O7:Nd, Li2B4O7:Gd, Li2B4O7:Dy and Li2B4O7:Er. The vertical dotted lines indicate the fitting window used for the backward Fourier transform range (1.3–4 Å). The primary peak is the first coordination shell, comprised of O atoms.
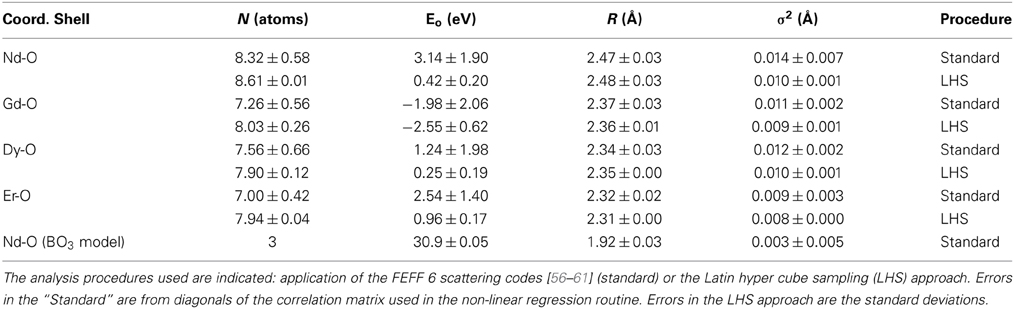
Table 1. Tabulated are the final fit parameters for the four rare earths analyzed including coordination number N, extracted photoelectric edge shift Eo, the first shell bond length R(Å) and σ2 which is the mean squared displacement in the rare earth to oxygen bond length, often referred to as the EXAFS Debye-Waller factor.
Due to the size and oxygen coordination number of the rare earths, placement of a rare earth dopant in the B complexes can almost immediately be excluded. A rare earth substitution for the B atom sites would result in a very large distortion of the lithium tetraborate lattice that does not fit with our experimental EXAFS data. Table 1 supports our position as to why a rare earth in a B substitution site can be neglected. To have a rare earth substitute for B in either the BO3 or BO4 clusters would result in coordination numbers of 3 and 4, less than the observed 7–10 oxygen coordination obtained from the EXAFS data. The RE-O bond length is reduced if placed in a boron site, even in the best fit to the EXAFS data. In the case for Nd, the Nd-O bond length is 1.92 Å for a boron site, still significantly less than the 2.7 Å observed, but this fit (Table 1) to the EXAFS data requires an unphysical shift in the adsorption edge, as discussed below in the context of our near edge X-ray absorption experimental data. It is noteworthy that for Nd substituting for boron in the BO3 structure, the fit to the EXAFS data would still require a expansion of the bonding distance from the B-O approximately 1.3–1.9 Å, which would greatly distort the interlocking BO3-BO4 portions of the unit cell. In general, substituting a rare earth element such as Nd with a radius of roughly 1.123 Å with a coordination number of 6 into a site where the B3+ radius is, on average, 0.15–0.25 Å for oxygen coordination numbers of 3 and 4 respectively, is unphysical. Substituting a rare earth element, such as Nd, in a manner that would in a way that would result in a bond length of 1.273 to 1.373 Å, so as to achieve less distortion of the interlocking BO3-BO4 portions of the unit cell, is possible only if we ignore the obvious problem of coordination number mismatch and the very large resulting charge distributions, as partly elaborated by theory below.
X-Ray Absorption Near Edge Structure
In Figure 8, the experimental X-ray absorption near edge structure (XANES) region for Li2B4O7:Nd has been plotted in more detail than in Figure 4. The solid black line is the experimental data and the dotted red line is the theoretical calculation using FEFF 9.05 and full metal scattering with a cluster size of 5.1 Å and a small convergence factor of 0.05. The Hedin-Lundqvist to ground state exchange correlation was used.
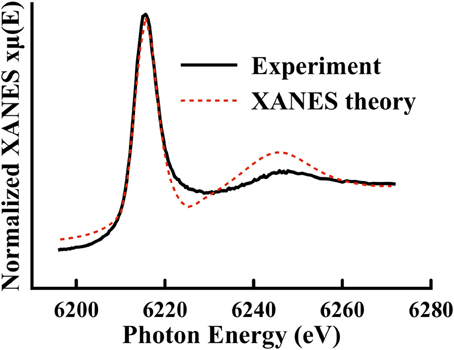
Figure 8. Plotted is the experimental data (solid black line) for Li2B4O7:Nd in the nominal X-ray absorption near edge structure region. FEFF 9.05 has been used to calculate a theoretical X-ray absorption near edge structure spectrum (red dotted line) using full multiple scattering. The theory has been shifted to higher binding energy by 2.8 eV (reflective of the +3 charge of the Nd dopant).
Peak fitting to the XANES data was accomplished by using an arctangent function to represent the bare atom absorption background and two Voigt functions to fit the peaks. The results are listed in Table 2. Two broad peaks are identified in the XANES spectra; one at approximately 4.00 eV beyond the experimentally determined core binding energy (6212 eV) and the other at approximately 37.57 eV above the core L3 edge. A similar peak structure is observed in a rare earth oxygen environment in Joseph et al. [76], where the broad peak at around 35 eV has been associated with nearest neighbor scattering. The other rare earth doped glass samples Li2B4O7:Gd, Li2B4O7:Dy, and Li2B4O7:Er provide similar results in spite of the differences in the placement of the L3 edge. Additionally, using the Nd doped sample as a reference, the total yields of each of the respective peaks were compared to one another and indicate similar absorption. If the total area/yield is associated with an unoccupied density of states, then there is no detectable (at least in these sample conditions) difference between the doped samples. In fact, compared to the yield, the first peak has an average ratio of 1.04 and the second 0.99, hovering just around 1 and indicating that the electronic density of states are nearly the same for all of the rare earth doped glass samples. This conclusion is consistent with strong hybridization of the unoccupied rare earth 5d states with the host Li2B4O7 and thus consistent with our model electronic structure calculations discussed below.
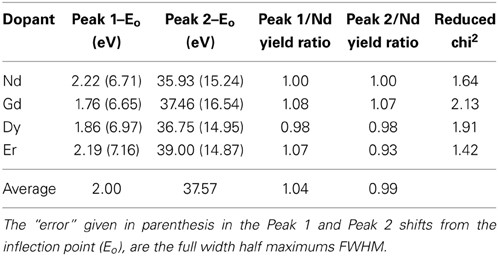
Table 2. Tabulated are the results for fitting the XANES region of the doped samples with an arctangent function and two Voigt functions.
For rare earth materials where the rare earth atom is in the +3 valence state, the XANES spectra have a single peak white line, whereas for RE elements that adopt the +4 valence state (e.g., Ce and Pr), the XANES spectra typically have a double peaked white line which occurs due to additional interactions with the ligand environment [77]. In this case, as has been discussed at length in other rare earth dopant systems literature [74, 76–82], the p → s and p → d transitions should be stronger than p → f, although the latter is not strictly forbidden if there is strong 4f state hybridization with the unoccupied band structure [74, 81–83]. In this case, the large white line peak may be associated with 2p → 5d transitions, typical of the +3 rare earth ion and similar to the Eu in doped borate glasses as in Shimizugawa et al. [78]. Placement of a rare earth (e.g., Nd) in a boron site, in the most realistic fit to the EXAFS data (as noted above), presents a huge problem for the XANES data. Such a placement of the rare earth would require an absorption edge shift of about 30 eV instead of the roughly 0 to 3 eV for substitution into a lithium site (Table 1), and it is the latter that is close to the 4 eV absorption edge shift observed, as seen in Figure 4.
Density Functional Theory Studies of RE Doped Lithium Tetraborate
To better ascertain the role the host matrix does play in the f to f transitions of the +3 rare earth ions in doped lithium tetraborate, we modeled the electron structure of Li2B4O7 doped with Nd, Gd, Dy, Er and Yb. Our calculations are carried out within density function theory (DFT) as implemented in the CASTEP software [84]. The plane wave basis set with an energy cutoff around 360 eV, an ultra-soft pseudopotential, and the local density approximation for the generalized gradient approximation (GGA) and Perdew-Burke-Ernzerhof (PBE) exchange and correlation functional are employed [85]. The DFT+U method was used for the corrections of on-site Coulomb interactions with U = 6 eV. These computational conditions were previously found to be successful with rare earth doped GaN studies [74]. In addition, we utilize the ensemble density functional theory (EDFT) [86, 87] scheme in CASTEP to overcome the convergence problem inherited in the RE system. In the Da Silva et al. [88], density functional theory calculations for CeO2 and Ce2O3 found that Perdew-Burke-Ernzerhof plus a scalar Hubbard U approach (PBE+U) worked reasonably well, with results similar to the Heyd-Scuseria-Ernzerhof hybrid functional (HSE). For example, PBE+U and HSE predict CeO2 to be an insulator with the band gaps 5.3 and 7.0 eV respectively compared to the experimental value of 6.0 eV. The calculated the energy difference between the lowest 4f state and the vacant conduction band (Eg−f) of Ce2O3 were found to be 2.6 eV (PBE+U) and 2.5 eV (HSE) compared to the experimental value of 2.4 eV [88]. Our approach is very much the same as that PBE+U approach in the work of Da Silva and coworkers [88] except we used U = 6.0 eV for the 4f states of Nd, Gd, Dy, Er, and Yb, instead of the U = 4.5 eV for the Ce 4f used in Da Silva et al. [88]. The band gap for undoped lithium tetraborate has been estimated [89], by the above DFT approach, to be 6.48 eV, much less than the experimental value of 9.8 eV found in combined photoemission and inverse photoemission [48, 49, 89]. This is not surprising as the band gaps found in density functional theory of Li2B4O7 are generally observed to the underestimates of values obtained from combined photoemission and inverse photoemission experiments [48, 49, 89].
We built a cubic cell of Li16B32O56, as shown in Figure 9. Based on our EXAFS results that place the RE dopant in a Li+ site, one Li+ atom is then substituted by a Nd, Gd, Dy, Er, or Yb atom, representing 6.25% atomic doping which is much higher than the experimental level, but computationally tractable. Monkhorst-Pack [90] 2 × 2 × 2, k-points grids were adopted for Brilliouin zone sampling. Geometry optimizations were performed for the coordinates of the atoms and the lattice parameters until the maximum force on the atoms was less than 0.01 eV/Å, confirming slight strain in the lattice in the vicinity of the rare earth dopant and dependent on the choice of the rare earth dopant. There is strong evidence of rare earth state hybridizations with the lithium tetraborate host, while the boron and oxygen are connected by valence bonds, but Li and borate are connected through ionic bonding, as is common in density functional calculations of lithium tetraborate [49–51] and is evident in the overlap of the partial density of states as plotted in Figure 10. This indicates that the Li+ site is also the most reasonable choice for substitutional rare earth dopants, because the borate B4O7 are mostly tied by strong covalent bonds, so a rare earth dopant is very unlikely to replace either B or O. The Li+, on the other hand, is bonded to the borate primary through ionic bonds, which is evident from the partial densities of states of Li2B4O7. Thus we feel that it is legitimate to substitute some of the Li+ by the rare earth atoms. In previous work [89], we noted that the Mulliken bond population, which is a measure of overlap charges in the chemical bonds [91, 92] of B-O bond is about 0.58 to 0.82, whereas Li-O bond is less than <0.06. From this one can deduce that the B-O bond is in nature strongly covalent, and Li-O is most likely ionic. The bond lengths of the B-O and Li-O are 1.36–1.51 Å and 1.97–2.46 Å, respectively, the latter being a much better fit to the EXAFS data discussed above, for substitutional rare earth doping.
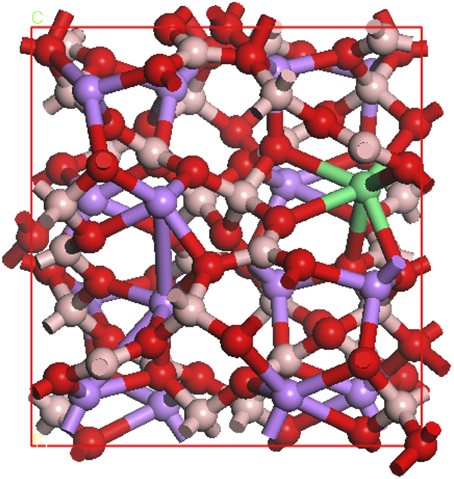
Figure 9. The schematic of the structural geometry for Li15B32O56RE (RE = Nd, Gd, Dy, Er, or Yb). Oxygen (red), boron (gray), lithium (blue), and rare earth (green) are indicated.
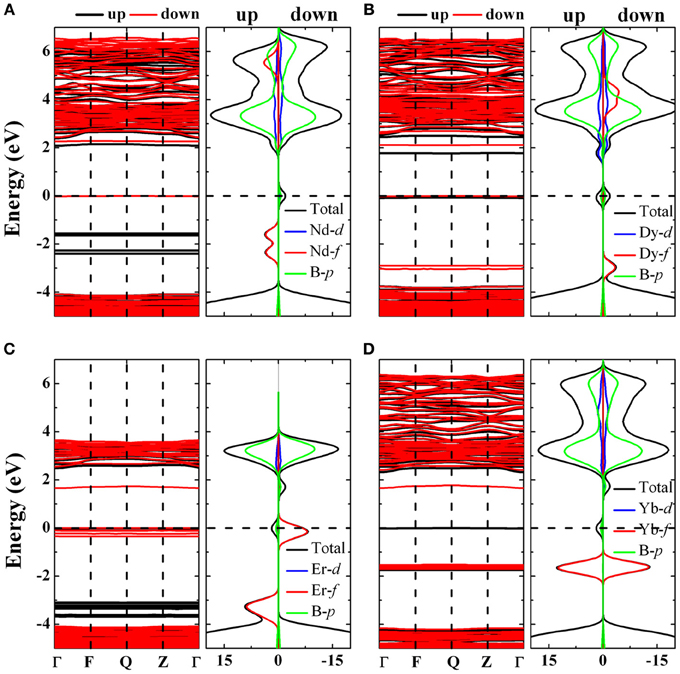
Figure 10. The band structure and density of states of Li15B32O56Nd (A), Li15B32O56Dy (B), Li15B32O56Er (C), Li15B32O56Yb (D). In band structure plots vs. wave vector, spin up is black and spin down is red, while in the density of states plots the rare earth d state densities are blue, f state densities are red and boron p state density is green while the total density of states envelope is black. The density of states are plotted spin resolved.
In Li2B4O7:Nd (Figure 10A) and Li2B4O7:Dy (Figure 10B), we observe that nearly all the unoccupied 4f levels hybridize with the lithium tetraborate conduction bands. This could explain the similarity of the edge shift uncovered by the Latin hyper cube sampling (LHS) analysis summarized in Table 1 between Nd and Dy doped samples. We find that in Er the 4f levels, particularly the spin down component situated at EF do not mix with the host lithium tetraborate, whereas at 2–4 eV above EF, the f state population is very low (Figure 10C). For Li2B4O7:Yb (Figure 10D), there are few unoccupied 4f states, which leads to little depletion of the Yb 4f14 occupancy, unlike GaN:Yb [74]. For Nd (Figure 10A), Dy (Figure 10B), Er (Figure 10C), and Yb (Figure 10D) there is a significant 4f partial density of states that shows up within the lithium tetraborate band gap, but this is not observed for Li2B4O7:Gd. We find that the occupied Gd 4f states are embedded deep at the bottom of the valence band of the Li2B4O7:Gd valence band. The differences in the Gd electronic 4f state are also reflected in Table 1 from the experimental edge shift E0 being very different from the other doped samples. Overall we interpret the rare earth 4f state placement and the clear rare earth 4f hybridization to the lithium tetraborate lattice as contributing to the f to f transition spectral broadening, similar to our expectations for Er doped GaN due to the strong hybridization of the GaN matrix with the imbedded Er 4f states [74]. Such 4f states, as calculated here, do give rise to states within the band gap, not only as plotted in Figure 10, but are seen as sharp absorption lines in the transmission spectra at wave lengths greater than 375 nm, as well as reflected in the luminescence spectra of rare earth doped lithium tetraborates [27, 72, 73].
The correlation U has been applied, as noted, to the rare earth 4f orbitals only, the remaining various orbital subset of orbitals may in some cases have applicable correlation energies as well. There is no a priori exclusion of multiple correlation energies, nor of wave vector dependence of the various possible correlation energies and such complications might well exist. This could lead to an incomplete (or insufficient) description of orbital hybridization effects including the luminescent and optical properties. In general, the increased hybridization will decrease excited state lifetimes and increase luminescent spectral feature widths, including the f to f transition spectral features. The contributions to f to f transition spectral broadening, nonetheless, arising from the strong rare earth hybridization with the lithium tetraborate lattice, are significant even without considering the variations in oxygen coordination, although Li2B4O7:Yb (Figure 10D) may be the exception. The variations in oxygen coordination evident from the EXAFS, and expected for a glassy lithium tetraborate, will be even more significant because of the strong rare earth hybridization with the lithium tetraborate lattice, affecting the f to f transition spectral broadening to a great degree.
Conclusion
Previous studies of rare earth doped lithium tetraborate glasses revealed asymmetry in the RE 4f spectral emission lines. In order to determine the source of the spectral line distortion, X-ray absorption fine structure studies were conducted in order to extract the local environment surrounding the rare earth dopants. The near edge absorption spectra data analysis indicates that for all of the rare earth doped samples studied (Li2B4O7:Nd, Li2B4O7:Gd, Li2B4O7:Dy, and Li2B4O7:Er), the dopant substitutes into the Li+ ion sites as RE3+. The empirically determined site was then used to perform a density functional theory calculation and determine the electronic source of the asymmetry in the spectral emission lines.
As a result of the doping, there is a slight expansion of the coordination shells (O and B atoms) that surrounded the original Li+ atom from approximately 2.0 Å to approximately 2.5 Å, the exact value depending upon the size of the rare earth. The results for rare earth doped borates compare well with expected bonding distances when compared with rare earth coordination number and atomic radii from Shannon [93], the radial distributions functions obtained from X-ray diffraction [55] and consistent with prior EXAFS studies [66, 67]. The first coordination shell's distance and coordination number (in the range of 6–8) (amplitude reduction factor fixed at 0.85) compares well with the expectations for a rare earth oxygen coordination environment and occupation of the Li+ site. Since these are an average coordination number and coordination distance in the glass samples, it is expected that there are hypo- and hyper- environments throughout the glass that average out.
A qualitative XANES analysis confirms a +3 valence state and is consistent with our theoretical expectations. The resulting density functional theory calculations indicate there is strong hybridization with the unoccupied 4f orbitals with the host lithium tetraborate matrix. This hybridization is a likely the source of the spectral emission line distortion observed when the glass oxygen positional disorder is also taken into account.
Conflict of Interest Statement
The authors declare that the research was conducted in the absence of any commercial or financial relationships that could be construed as a potential conflict of interest.
Acknowledgments
This work was supported by the Nebraska Public Power District through the Nebraska Center for Energy Sciences Research competitive grant program, the Defense Threat Reduction Agency (Grant No. HDTRA1-07-1-0008, HDTRA1-09-1-0060, and BRBAA08-I-2-0128), the NSF through the “QSPINS” MRSEC (DMR-0820521) at UNL. The views expressed in this article are those of the authors and do not reflect the official policy or position of the Air Force, Department of Defense or the U.S. Government.
References
1. Caruso AN. The physics of solid-state neutron detector materials and geometries. J Phys Condens Matter. (2010) 22:1–32. doi: 10.1088/0953-8984/22/44/443201
2. Caruso AN, Billa RB, Balaz S, Brand JI, Dowben PA. The heteroisomeric diode. J Phys Condens Matter. (2004) 16:L139–46. doi: 10.1088/0953-8984/16/10/L04
3. Robertson BW, Adenwalla S, Harken A, Welsch P, Brand JI, Dowben PA, et al. A Class of boron-rich solid-state neutron detectors. Appl Phys Lett. (2002) 80:3644–6. doi: 10.1063/1.1477942
4. Robertson BW, Adenwalla S, Harken A, Welsch P, Brand JI, Claassen JP, et al. Semiconducting boron-rich neutron detectors. Proc SPIE (2002) 4785:226–33. doi: 10.1117/12.453923
5. Adenwalla S, Billa R, Brand JI, Day E, Diaz MJ, Harken A, et al. Semiconducting boron-rich neutron detectors. Proc SPIE (2004) 5199:70–74. doi: 10.1117/12.506646
6. Osberg K, Schemm N, Balkir S, Brand JI, Hallbeck MS, Dowben PA, et al. A handheld neutron-detection sensor system utilizing a new class of boron carbide diode. IEEE Sens J. (2006) 6:1531–38. doi: 10.1109/JSEN.2006.883905
7. Osberg K, Schemm N, Balkir S, Brand JI, Hallbeck MS, Dowben PA. A handheld neutron-detection sensor system. IEEE Int Symp Circ. (2006) 1179–1182. doi: 10.1109/ISCAS.2006.1692801
8. Caruso AN, Dowben PA, Balkir S, Schemm N, Osberg K, Fairchild RW, et al. The all boron carbide neutron detector: comparison with theory. Mater Sci Eng. (2006) 135:129–133. doi: 10.1016/j.mseb.2006.08.049
9. Day E, Diaz MJ, Adenwalla S. Effect of bias on neutron detection in thin semiconducting boron carbide films. J Phys D Appl Phys. (2006) 39:2920–24. doi: 10.1088/0022-3727/39/14/007
10. Hong N, Mullins J, Foreman K, Adenwalla S. Boron carbide based solid state neutron detectors: the effects of bias and time constant on detection efficiency. J Phys D Appl Phys. (2010) 43:275101. doi: 10.1088/0022-3727/43/27/275101
11. Hong N, Crow L, Adenwalla S. Time-of-flight neutron detection using PECVD grown boron carbide diode detector. Nuc Intrumen Methods Phys Res A (2013) 708:19–23. doi: 10.1016/j.nima.2012.12.105
12. Emin D, Aselage TL. A proposed boron-carbide-based solid-state neutron detector. J Appl Phys. (2005) 97:013529. doi: 10.1063/1.1823579
13. McGregor DS, Unruh TC, McNeil WJ. Thermal neutron detection with pyrolytic boron nitride. Nucl Instrum Methods A (2008) 591:530–3. doi: 10.1016/j.nima.2008.03.002
14. Uher J, Pospisil S, Linhart V, Schieber M. Efficiency of composite boron nitride neutron detectors in comparison with helium-3 detectors. Appl Phys Lett. (2007) 90:124101. doi: 10.1063/1.2713869
15. Li J, Dahal R, Majety S, Lin JY, Jiang HX. Hexagonal boron nitride epitaxial layers as neutron detector materials. Nucl Instrum Methods A (2011) 654:417-20. doi: 10.1016/j.nima.2011.07.040
16. Kumashiro Y. Refractory semiconductor of boron phosphide. J Mater Res. (1990) 5:2933-47. doi: 10.1557/JMR.1990.2933
17. Kumashiro Y, Yokoyama T, Sato A, Ando Y. Thermoelectric properties of boron and boron phosphide CVD wafers. J Solid State Chem. (1997) 133:314–21. doi: 10.1006/jssc.1997.7493
18. Lund JC, Olschner F, Ahmed F, Shah KS. Boron phosphide on silicon for radiation detectors. Mater Res Soc Symp Proc. (1989) 162:601–4. doi: 10.1557/PROC-162-601
19. Viles TP, Brunnett BA, Yoon H, Lund JC, Hermon H, Buchenauer D, et al. Material requirements for a boron phosphide thermal neutron counter. Mater Res Soc Symp Proc. (1998) 487:585–90. doi: 10.1557/PROC-487-585
20. Bakalova S, Speller R, Lacey RJ, Frost C, Kuball M. Novel n-type Mg2B14 on silicon diode: demonstration of a thermal solid state neutron detector. Nucl Instrum Methods A (2013) 700:140–4. doi: 10.1016/j.nima.2012.10.035
21. Sangeeta CK, Desai DG, Sabharwal SC, Alex M, Ghodgaonkar MD. Neutron flux measurements with a Li2B4O7 crystal. Nucl Instrum Methods A (2006) 571:699-703. doi: 10.1016/j.nima.2006.10.401
22. Burak YV, Padlyak BV, Shevel VM. Neutron induced defects in the lithium tetraborate single crystals. Radiat Eff Defect Solid. (2002) 157:1101–9. doi: 10.1080/10420150215791
23. Doty FP, Zwieback I, Ruderman W, inventors; Sandia Corporation, assignee. Solid State Neutron Detector and Method for Use. United States patent US 6, 388, 260. (2002).
24. Siedland E, Schwertführer W. Lithiumborat-Einkristalle als Neutrinendetektoren. Atomkernenergie (1966) 11:155.
25. Wooten DJ. Electric Structure of Lithium Tetraborate [Dissertation]. Wright Patterson Air Force Base: Air Force Institute of Technology (2010) 195.
26. Burak YB, Adamiv VT, Teslyuk IM, Shevel VM. Optical absorption of isotopically enriched Li2B4O7 single crystals irradiated by thermal neutrons. Rad Meas. (2004) 38:681–4. doi: 10.1016/j.radmeas.2003.12.029
27. Zadneprovski BI, Eremin NV, Paskhalov AA. New inorganic scintillators on the basis of LBO glass for neutron registration. Funct Mater. (2005) 12:261–8.
28. Rzyski BM, Morato SP. Luminescence studies of rare earth doped lithium tetraborate. Nucl Instrum Methods (1980) 175:62–4. doi: 10.1016/0029-554X(80)90254-2
29. Saisudha MB, Ramakrishna J. Effect of host glass on the optical absorption properties of Nd3+, Sm3+, and Dy3+ in lead borate glasses. Phys Rev B (1996) 53:6186–96. doi: 10.1103/PhysRevB.53.6186
30. Jayasankar CK, Babu P. Optical properties of Sm3+ ions in lithium borate and lithium fluoroborate glasses. J Alloy Compd. (2000) 307:82–95. doi: 10.1016/S0925-8388(00)00888-4
31. Dubovik MF, Tolmachev AV, Grinyov BV, Grin', LA, Dolzhenkova EF, Dobrotvorskaya MV. Luminescence and radiation-induced defects in Li2B4O7:Eu single crystals. Semicond Phys Quantum Electron Optoelectron. (2000) 3:420–2. Available online at: http://spie.org.ua/n3_2000/420_3_00.htm
32. Kassab LRP, Tatumi SH, Morais AS, Courrol LC, Wetter NU, Salvador VLR. Spectroscopic properties of lead fluoroborate glasses doped with ytterbium. Opt Exp. (2001) 8:585-9. doi: 10.1364/OE.8.000585
33. Chen Y, Huang Y, Luo Z. Spectroscopic properties of Yb3+ in bismuth borate glasses. Chem Phys Lett. (2003) 382:481–8. doi: 10.1016/j.cplett.2003.10.121
34. Vivien D, Georges P. Crystal growth, optical spectroscopy and laser experiments on new Yb3+-doped borates and silicates. Opt Mater. (2003) 22:81–3. doi: 10.1016/S0925-3467(02)00349-X
35. Pisarski WA, Pisarska J, Dominiak-Dzik G, Ryba-Romanowski W. Visible and infrared spectroscopy of Pr3+ and Tm3+ ions in lead borate glasses. J Phys Condens Mater. (2004) 16:6171–84. doi: 10.1088/0953-8984/16/34/016
36. Lin H, Yang D, Liu G, Ma T, Zhai B, An Q, et al. Optical absorption and photoluminescence of Sm3+ and Eu3+ doped rare-earth borate glasses. J Lumin. (2005) 113:121–28. doi: 10.1016/j.jlumin.2004.09.115
37. Romero JJ, Johannsen J, Mond M, Petermann K, Huber G, Heumann E. Continuous-wave laster action of Yb3+-doped lanthanum scandium borate. Appl Phys B (2005) 80:159–63. doi: 10.1007/s00340-004-1674-4
38. Stefani R, Maia AD, Teotonio EES, Monteiro MAF, Felinto MCFC, Brito HF. Photoluminescent behavior of SrB4O7:RE2+ (RE=Sm and Eu) prepared by Pechini, combustion and ceramic methods. J Solid State Chem. (2006) 179:1086–92. doi: 10.1016/j.jssc.2006.01.006
39. Padlyak B, Ryba-Romanowski, LR, Adamiv V, Burak Y, Teslyuk I, Banaszak-Piechowska A. Optical spectra and luminescence kinetics of the Sm3+ and Yb3+ centres in the lithium tetraborate glasses. Opt Appl. (2010) 40:427–38. Available online at: http://www.if.pwr.wroc.pl/~optappl/article.php?lp=804
40. Padlyak B, Grinberg M, Kukliñski B, Oseledchik Y, Smyrnov O, Kudryavtcev D, et al. Synthesis and optical spectroscopy of the Eu- and Pr-doped glasses with SrO-2B2O3 composition. Opt Appl. (2010) 40:413–26. Available online at: http://www.if.pwr.wroc.pl/~optappl/article.php?lp=803
41. Padlyak B, Ryba-Romanowski W, Radoslaw L, Pieprzyk B, Drzewiecki A, Adamiv V, et al. Synthesis and optical spectroscopy of the lithium tetraborate glasses, doped with terbium and dysprosium. Opt Appl. (2012) 42:365–79. doi: 10.5277/oa120214
42. Li P, Wang Z, Yang Z, Guo Q, Li X. Luminescent characteristics of LiCaBO3:M (M = Eu3+, Sm3+, Tb3+, Ce3+, Dy3+) phosphor for white LED. J Lumin. (2005) 130:222–25. doi: 10.1016/j.jlumin.2009.08.010
43. Tanabe S, Kang J, Hanada T, Soga N. Yellow/blue luminescences of Dy3+-doped borate glasses and their anomalous temperature variations. J Non-Cryst. Solids (1998) 239:170–75. doi: 10.1016/S0022-3093(98)00734-0
44. Babu P, Jayasankar CK. Spectroscopic properties of Dy3+ ions in lithium borate and lithium fluoroborate glasses. Opt Mater. (2000) 15:65–79. doi: 10.1016/S0925-3467(00)00015-X
45. Kaczmarek SM. Li2B4O7 glasses doped with Cr, Co, Eu and Dy. Opt Mater. (2002) 19:189-94. doi: 10.1016/S0925-3467(01)00218-X
46. Baumer VN, Chernikov VV, Dubovik MF, Gavrylyuk VP, Grinyov BV, Korshikova TI, et al. Comparative analysis of scintillation parameter peculiarities of Li2B4O7, LaB3O6 and Li6Gd(BO3)3 single crystals. Funct Mater. (2001) 8:736–41.
47. Ishii M, Kuwano Y, Asaba S, Asai T, Kawamura M, Senguttuvan N, et al. Luminescence of doped lithium tetraborate single crystals and glass. Radiat Meas. (2004) 38:571–4. doi: 10.1016/j.radmeas.2004.03.017
48. Wooten D, Ketsman I, Xiao J, Losovyj YB, Petrosky J, McClory J, et al. The electronic structure of Li2B4O7(110) and Li2B4O7(100). Eur Phys J Appl Phys. (2010) 52:31601–8. doi: 10.1051/epjap/2010160
49. Adamiv VT, Burak YV, Wooten D, McClory J, Petrosky J, Ketsman I, et al. The electronic structure and secondary pyroelectric properties of lithium tetraborate. Materials (2010) 3:4550–79. doi: 10.3390/ma3094550
50. Maslyuk VV, Islam MM, Thomas BT. Electronic properties of compounds of the Li2O-B2O3 system. Phys Rev B (2005) 72:125101. doi: 10.1103/PhysRevB.72.125101
51. Islam MM, Maslyuk VV, Bredow T, Minot C. Structural and electronic properties of Li2B4O7. J Phys Chem B (2005) 109:13597–604. doi: 10.1021/jp044715q
52. Antonyak, OT, Burak YV, Lyseiko IT, Pidzyrailo NS, Khapko ZA. Luminescence of the Li2B4O7 single crystals. Opt. Spectrosc. (1986) 61:550–3.
53. McMillen CD, Giesber HG, Kolis JW. The hydrothermal synthesis, growth, and optical properties of γ-LiBO2. J Cryst Growth (2008) 310:299–305. doi: 10.1016/j.jcrysgro.2007.10.068
54. Leonyuk NI. Structural aspects in crystal growth of anhydrous borates. J Crystal Growth (1997) 174: 301–7. doi: 10.1016/S0022-0248(96)01164-5
55. Padlyak BV, Mudry SI, Kulyk YO, Drzewiecki A, Adamiv VT, Burak YV, et al. Synthesis and X-ray structural investigation of undoped borate glasses. Mater Sci Poland (2012) 30: 264–73. doi: 10.2478/s13536-012-0032-1
56. Lemonnier M, Collet O, Depautex C, Esteva JM, Raoux D. High vacuum two crystal X-ray monochromator. Nucl Instrum Methods A (1978) 152:109–11. doi: 10.1016/0029-554X(78)90246-X
57. Hormes J, Scott JD, Suller VP. Facility update: the center for advanced microstructures and devices: a status report. Syn Radiat News (2006) 19:27–30. doi: 10.1080/08940880500525093
58. Roy A, Morikawa E, Bellamy H, Jumar C, Goettert J, Suller V, et al. Status of the center for advanced microstructures and devices (CAMD) 2007. Nucl Instrum Methods A (2007) 582:22–5. doi: 10.1016/j.nima.2007.08.053
59. Morikawa E, Scott JD, Goettert J, Aigeldinger G, Kumar ChSSR, Craft BC, et al. Status of the center for advanced microstructures and devices (CAMD)-2001. Rev Sci Instrum. (2002) 73:1680–3. doi: 10.1063/1.1425391
60. Thompson AC, Kirz J, Attwood DT, Gullikson EM, Howells MR, Kortright JB, et al. X-Ray Data Booklet, 3rd Edn. Berkeley, CA: LBNL (2009) 1–3.
61. Newville M. IFEFFIT: interactive XAFS analysis and FEFF fitting. J Syn Radiat. (2001) 8:322-4. doi: 10.1107/S0909049500016964
62. Ravel B, Newville M. ATHENA, ARTEMIS, HEPHAESTUS: data analysis for X-ray absorption spectroscopy using IFEFFIT. J Synchrotron Radiat. (2005) 12:537–41. doi: 10.1107/S0909049505012719
63. Ravel B. ATOMS: crystallography for the X-ray absorption spectroscopist. J Synchrotron Radiat. (2001) 8:314–6. doi: 10.1107/S090904950001493X
64. Rehr JJ, Albers RC, Zabinsky SI. High-order multiple-scattering calculations of x-ray-absorption fine structure. Phys Rev Lett. (1992) 69:3397–400. doi: 10.1103/PhysRevLett.69.3397
65. Bunker G. Introduction to XAFS. New York, NY: Cambridge University Press (2010). doi: 10.1017/CBO9780511809194
66. Kelly TD, Kong L, Buchanan DA, Brant AT, Petrosky JC, McClory JW, et al. EXAFS and EPR analysis of the local structure of Mn-doped Li2B4O7. Phys Status Solid B (2013) 250:1376–83. doi: 10.1002/pssb.201349013
67. Kelly TD, Echeverria E, Beniwal S, Adamiv VT, Burak YV, Enders A, et al. The chromium site in doped glassy lithium tetraborate. Mater Chem Phys (in press). Available online at: http://www.ncbi.nlm.nih.gov/books/NBK7240
68. Krogh-Moe J. The crystal structure of lithium diborate, Li2O*2B2O3. Acta Cryst. (1962) 15:190-3. doi: 10.1107/S0365110X6200050X
69. Krogh-Moe J. Refinement of the crystal structure of lithium diborate Li2O*2B2O3. Acta Cryst. (1968) B24:179–81. doi: 10.1107/S0567740868001913
70. Podgórska D, Kaczmarek SM, Drozdowski W, Berkowski M, Worsztynowicza A. Growth and Optical Properties of Li2B4O7 Single Crystals Pure and Doped with Yb, Co and Mn ions for nonlinear applications. Acta Physica Polonica A (2005) 107:507. Available online at: http://przyrbwn.icm.edu.pl/APP/ABSTR/107/a107-3-7.html
71. Burak YV, Adamiv VT, Antonyak OT, Malynych SZ, Pidzyrailo MS, Teslyuk IM. Thermoluminescence in doped single crystals Li2B4O7:A (A = Cu, Ag). Ukr J Phys. (2005) 50:1153–8. Available online at: http://ujp.bitp.kiev.ua/index.php?item=j&id=63
72. Padlyak BV, Ryba-Romanowski W, Lisiecki R, Adamiv VT, Burak YaV, Teslyuk IM. Optical spectroscopy of Nd-doped Borate Glasses. Proc Int Conf OMEE (2012) OMEE-2012:200–1. doi: 10.1109/OMEE.2012.6464900
73. Padlyak BV, Ryba-Romanowski W, Lisiecki R. Optical and EPR spectroscopy of the Nd-doped borate glasses. J Phys Stud. (2012) 16:3998–4005.
74. Wang L, Wai-Ning M, McHale SR, McClory JW, Petrosky JC, Wu J, et al. Rare earth 4f hybridization with the GaN valence band. Semicond Sci Technol. (2012) 27:115017–23. doi: 10.1088/0268-1242/27/11/115017
75. Witkowska A, Padlyak B, Rybicki J. Influence of rare-earth impurities on the Ge and Ga local structure in the Ca3Ga2Ge3O12 glass. J Non-Cryst Solids (2006) 352:4346–50. doi: 10.1016/j.jnoncrysol.2006.07.031
76. Joseph B, Ladecola A, Bianconi, Marcelli A, Saini NL. RE L3 x-ray absorption study of REO1-xFxFeAs (RE = La, Pr, Nd, Sm) oxypnictides. J Phys Condens Mater. (2009) 21:432201–6. doi: 10.1088/0953-8984/21/43/432201
77. Pedersen KR, Jorgensen JE. XANES study of rare-earth valency and 4f hybridization in Pb2Sr2Ln1-xCaxCu3O8 for Ln = Ce, Pr, and Tb. Physica C (1996) 264:185-90. doi: 10.1016/0921-4534(96)00263-8
78. Shimizugawa Y, Umesaki N, Qiu J, Hirao K. Local structure around europium ions doped in borate glasses. J Synchrotron Rad. (1999) 6:624–6. doi: 10.1107/S0909049599000394
79. Smythe DJ, Brenan JM, Bennett NR, Regier T, Henderson GS. Quantitative determination of cerium oxidation states in alkali-aluminosilicate glasses using M4,5-edge. J Non-Cryst Solids (2013) 378:258–64. doi: 10.1016/j.jnoncrysol.2013.07.017
80. Lee CH, Oyanagi H, Sekine C, Shirotani I, Ishii M. XANES study of rare-earth valency in LRu4P12 (L = Ce and Pr). Phys Rev B (1999) 60:13253–6. doi: 10.1103/PhysRevB.60.13253
81. Santana JAC, Liu P, Wang X, Tang J, McHale SR, Wooten D, et al. The local metallicity of gadolinium doped compound semiconductors. J Phys Condens Mater. (2012) 24:445801–6. doi: 10.1088/0953-8984/24/44/445801
82. Liu P, Santana JAC, Dai Q, Wang X, Dowben PA, Tang J. Sign of the superexchange coupling between next-nearest neighbors in EuO. Phys Rev B (2012) 86:224408–13. doi: 10.1103/PhysRevB.86.224408
83. Sakisaka Y, Rhodin TN, Dowben PA. Resonant photoemission at the 3s threshold of Ni. Solid State Commun. (1984) 49:563–5. doi: 10.1016/0038-1098(84)90192-3
84. Segall MD, Lindan PJD, Probert MJ, Pickard CJ, Hasnip PJ, Clark SJ, et al. First-principles simulations: ideas, illustrations and the CASTEP code. J Phys Condens Mat. (2002) 14:2717–44. doi: 10.1088/0953-8984/14/11/301
85. Perdew JP, Burke K, Ernzerhof M. Generalized gradient approximation made simple. Phys Rev Lett. (1996) 77:3865–8. doi: 10.1103/PhysRevLett.77.3865
86. Marzari N, Vanderbilt D, Payne MC. Ensemble density-functional theory for ab initio molecular dynamics of metals and finite-temperature insulators. Phys Rev Lett. (1997) 79:1337–40. doi: 10.1103/PhysRevLett.79.1337
87. Payne MC, Teter MP, Allan DC, Arias TA, Joannopoulos JD. Iterative minimization techniques for ab initio total-energy calculations: molecular dynamics and conjugate gradients. Rev Mod Phys. (1992) 64:1045–97. doi: 10.1103/RevModPhys.64.1045
88. Da Silva JLF, Ganduglia-Pirovano MV, Sauer J, Bayer V, Kresse G. Hybrid functionals applied to rare-earth oxides: the example of ceria. Phys Rev B (2007) 75: 045121. doi: 10.1103/PhysRevB.75.045121
89. Wang L, Mei WN, Dowben PA. The surface states of lithium tetraborate. J Phys Condens Mat. (2013) 25:045014. doi: 10.1088/0953-8984/25/4/045014
90. Monkhorst HJ, Pack JD. Special points for Brillouin-zone integrations. Phys Rev B (1976) 13:5188–92. doi: 10.1103/PhysRevB.13.5188
91. Segall MD, Shah R, Pickard CJ, Payne MC. Population analysis of plane-wave electronic structure calculations of bulk materials. Phys Rev B (1996) 54:16317. doi: 10.1103/PhysRevB.54.16317
92. Mulliken RS. Electronic population analysis on LCAO–MO molecular wave functions. I. J Chem Phys. (1955) 23:1833. doi: 10.1063/1.1740588
Keywords: rare earth luminescence, lithium tetraborate, hyrbridization, x-ray absorption, local structure
Citation: Kelly TD, Petrosky JC, McClory JW, Adamiv VT, Burak YV, Padlyak BV, Teslyuk IM, Lu N, Wang L, Mei W-N and Dowben PA (2014) Rare earth dopant (Nd, Gd, Dy, and Er) hybridization in lithium tetraborate. Front. Physics 2:31. doi: 10.3389/fphy.2014.00031
Received: 21 March 2014; Accepted: 07 May 2014;
Published online: 27 May 2014.
Edited by:
Peter Fischer, Lawrence Berkeley National Laboratory, USAReviewed by:
Fengqi Song, Nanjing University, ChinaCesare Franchini, University of Vienna, Austria
Khim Karki, Brookhaven National Laboratory, USA
Copyright © 2014 Kelly, Petrosky, McClory, Adamiv, Burak, Padlyak, Teslyuk, Lu, Wang, Mei and Dowben. This is an open-access article distributed under the terms of the Creative Commons Attribution License (CC BY). The use, distribution or reproduction in other forums is permitted, provided the original author(s) or licensor are credited and that the original publication in this journal is cited, in accordance with accepted academic practice. No use, distribution or reproduction is permitted which does not comply with these terms.
*Correspondence: Peter A. Dowben, Department of Physics and Astronomy, University of Nebraska-Lincoln, Theodore Jorgensen Hall, 855 N 16th Street, Lincoln, NE, 68588-0299, USA e-mail:cGRvd2JlbjFAdW5sLmVkdQ==