 David Medina-Ortiz1,2
 Sebastián Contreras1
 Yasna Barrera-Saavedra3
 Gabriel Cabas-Mora3
 Álvaro Olivera-Nappa1,4*
- 1Centre for Biotechnology and Bioengineering, Universidad de Chile, Santiago, Chile
- 2Division of Chemistry and Chemical Engineering, California Institute of Technology, Pasadena, CA, United States
- 3Escuela de Ingeniería en Bioinformática, Universidad de Talca, Talca, Chile
- 4Departamento de Ingeniería Química, Biotecnología y Materiales, Facultad de Ciencias Físicas y Matemáticas, Universidad de Chile, Santiago, Chile
Due to the particularities of SARS-CoV-2, public health policies have played a crucial role in the control of the COVID-19 pandemic. Epidemiological parameters for assessing the stage of the outbreak, such as the Effective Reproduction Number (Rt), are not always straightforward to calculate, raising barriers between the scientific community and non-scientific decision-making actors. The combination of estimators of Rt with elaborated Machine Learning-based forecasting techniques provides a way to support decision-making when assessing governmental plans of action. In this work, we develop forecast models applying logistic growth strategies and auto-regression techniques based on Auto-Regressive Integrated Moving Average (ARIMA) models for each country that records information about the COVID-19 outbreak. Using the forecast for the main variables of the outbreak, namely the number of infected (I), recovered (R), and dead (D) individuals, we provide a real-time estimation of Rt and its temporal evolution within a timeframe. With such models, we evaluate Rt trends at the continental and country levels, providing a clear picture of the effect governmental actions have had on the spread. We expect this methodology of combining forecast models for raw data to calculate Rt to serve as valuable input to support decision-making related to controlling the spread of SARS-CoV-2.
1. Introduction
Different aspects of modern society favored the rapid spread of COVID-19 at a global level [1] so that it was declared as a pandemic by the World Health Organization in March 2020 [2]. SARS-CoV-2, the novel coronavirus associated with this disease, was identified for first time in the region of Wuhan, China, by sequence sampling from patients showing symptoms similar to pneumonia [3]. Genomic studies of SARS-CoV-2 suggest a phylogenetic relation with RaTG13, an endogenous variant reported in bats, based on the 96.2% identity between the two genomes [4]. Three different variants of SARS-CoV-2 have been reported, which are distributed on Asia, Europe, and America [5], to date accounting for 54 strains [6]. Additionally, among 103 strains of SARS-CoV-2 analyzed by Tang et al. [7], 101 exhibited a complete link between two specific Single Nucleotide Polymorphisms (SNPs): 72 strains exhibited a “CT” haplotype (defined as lineage L, because it is at the Leucine codon) and 29 strains exhibited a “TC” haplotype (defined as lineage S, because it is at the Serine codon) at these two SNPs. These lineages present significant differences of prevalence (70 and 30 %, respectively for L and S), and evolutionary analyses suggested that the S lineage appeared to be more related to corona viruses in animals, leaving open for question whether these lineages might have different rates of transmission or replication [7]. All of the variability and particularities of SARS-CoV-2 mentioned above make the development of a vaccine or effective treatments more difficult, demanding a considerable effort from governmental actors to control the COVID-19 outbreak.
In the current scenario, mathematical models, data mining, and pattern recognition techniques play fundamental roles in understanding, forecasting the evolution of the spread, and supporting public health policies. Herein, we present some remarkable examples of these. Hu et al. [8] proposes a prognosis model to estimate in real time the number of contagious people and the time when the propagation of COVID-19 will finish. Guo et al. [9] developed predictive models for early detection and generation of alerts to avoid SARS-CoV-2 outbreak. Following the same objective, applications of mathematical models based on the well-known SIR model proposed by Kermack and McKendrick [10] have been employed to assess the situations in different countries and as a support for health policies [11, 12]. Nevertheless, the use of these models required the resolution of inverse problems, demanding extensive volumes of data and elaborate strategies to identify their parameters. Moreover, these models fail to represent the spread in countries with heterogeneous demographics [13]. Machine Learning approaches have been extensively used in the diagnosis of COVID-19, especially in the fields of X-ray and image analysis using deep convolutional neural networks techniques [14–18], to predict critical patients to optimize hospital resources [19, 20], and to search for candidate drugs for the treatment of SARS-CoV-2 [21, 22].
Despite enormous efforts to make a prognosis of different variables to support and guide health policies, relevant parameters for studying the evolution of this outbreak are not always adequately delivered to the decision-making actors. The Effective Reproduction Number Rt, for example, is a well-known parameter used to evaluate the propagation of a disease. In previous work [23], we proposed a simple and fast methodology to estimate this rate directly from raw data. In this work, we applied a different approach to study Rt and its evolution. Through data mining and forecasting techniques, based on Auto-Regressive Integrated Moving Average (ARIMA) models, we identify different spreading behaviors of the pandemic in countries around the world and develop models to forecast the spread of this pandemic. Using the forecast for the number of infected (I), recovered (R), and dead (D) individuals, we calculate Rt and its temporal evolution.
2. Methods
The workflow to create forecast models of relevant variables necessary to estimate the Effective Reproduction Number Rt can be summarized as follows. First, the variables Infected (I), Dead (D), and Recovered (R) are processed to obtain the daily values. Next, Logistic Growth models were applied to estimated Infected (I) cases, and ARIMA models were used to create a forecast model of Dead (D) and Recovered (R) values. Finally, all predicted variables were employed to estimate Rt.
2.1. Preparation of Datasets
All datasets were gathered from public repositories, which are updated on a daily basis [24]. Data pre-processing, such as filtering and scaling, was performed with scripts written in Python version 3.6 [25].
2.2. Estimation of Rt
Using the data gathered for each country, we proceed to estimate Rt using the methodology proposed by Contreras et al. [23]. Assuming that the spreading dynamics of COVID-19 in a certain territory are well-described by a SIR model, represented by Equations (1)–(3), we can easily derive an expression for Rt.
Assuming that function I, active cases, can be expressed as a function of the susceptible fraction S, I(S), applying the chain rule in Equation (2) and replacing Equation (1), we obtain:
where . Following the formalism of Contreras et al. [23], after using the hypothesis , we write the discrete version of the equation in a given timeframe [ti−1, ti] that is consistent with the temporal resolution of the data:
As the different reported fractions must sum up the total population, applying a mass balance, we may state the following dynamic condition:
By using Equation (6) in Equation (5), we obtain Equation (7):
where ΔI, ΔR, and ΔD, represent the new reported infections, recoveries, and deaths in the estimation timeframe. To smooth the different trends, we apply mobile averages, which is also our variability estimation method. From its definition, Rt ≥ 1 indicates that the outbreak might have exponential growth, while Rt < 1 would indicate a disappearing infection. The above results from the analysis of Equation (2),
which, under the hypothesis , has a unstable bifurcation when Rt = 1, exhibiting an exponential growth or decay depending on whether Rt is greater or lower than 1, respectively.
2.3. Forecast Models
Auto-Regressive Integrated Moving Average (ARIMA) models, which are related to auto-regression techniques [26], were used to develop forecast model to predict the variables related to the number of deaths (D), and the number of recovered individuals (R). The selection of hyperparameters related to algorithm was based on the maximization of the performance metrics of the produced models, in this case, Root Mean Square Error (RMSE). All models were implemented using Python version 3.6 [25] and the libraries statsmodels [27] and scikit-learn [28].
Logistic Growth models [29], which follow Equation (9), were applied to create predictive models of the number of confirmed cases (I). Parameters r, P, and K were obtained and optimized for each country-model, applying Non-linear Least Square Estimation.
Finally, Rt for each country is estimated using Equation (7) considering the predicted variables by the prognosis models previously explained.
3. Results: Forecast Models
Forecast models of the variables Infected (I), Recovered (R), and Dead (D) were developed for 185 countries that track the progression of the COVID-19 outbreak, including countries, such as the United States, Italy, Australia, Chile, and Brazil, among others. Using the predictions generated by the forecast models, we estimate Rt and its evolution over time (Figure 2). The performance of each model was assessed using a root mean square error (RMSE)-based criterion. Figure 1 shows the RMSE histograms for each forecast variable in the different countries considered. Each histogram presents a division marked by a red line at RMSE = 1, setting a threshold for considering only those countries where the quality of the data provided was sufficient to obtain reliable predictors.
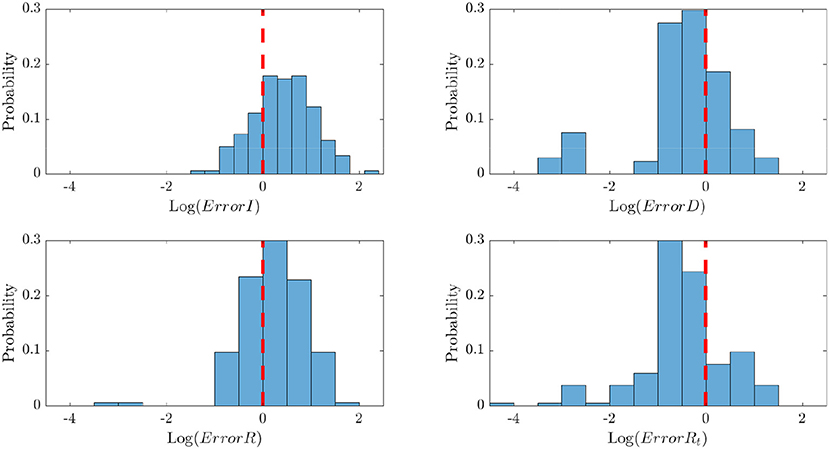
Figure 1. RMSE histograms for assessing the quality of the forecast models for each variable in the 185 countries considered. The red line in each histogram represents the division between models with RMSE ≤ 1. As every country could be associated with one RMSE value, this figure provides a visual idea of the fraction of countries where the data was good enough to train reliable forecast models.
A more detailed assessment of the models can be made through the use of the statistical distributions of the RMSE for each variable under study. Table 1 shows the error ranges obtained for each model divided into quartiles. Forecast models for variables D (Dead) and Rt present narrower ranges and lower values, mainly because of the low variability that these variables present in each country. Moreover, I and R sometimes exhibit abrupt increases on particular days and are more susceptible to presenting errors in data acquisition, as the distribution of resources (sampling capabilities) and the criteria for clinical recovery are not homogeneous.
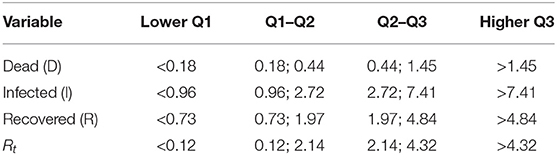
Table 1. Summary of performance measures by quartile based on RMSE distributions.
Data quality and the performance of the generated forecast model are deeply connected. In this example, if the forecast model for D has an RMSE ranking in the first quartile (Q1), the forecast models for the other variables are also likely to be satisfactory.
4. Evolution of COVID-19, Public Politics, and Tendencies of Countries
Figure 3A shows the SARS-CoV-2 propagation trend for different countries, divided by continents. To date, countries, such as South Korea, China, and Australia have successfully controlled the spread of the pandemic, as they have reached the Rt < 1 zone. However, attention should be paid to slight increases in Rt weeks after reaching control of the spread, as they could account for new outbreaks. Nevertheless, such outbreaks can occur regardless of the stage of evolution of the pandemic. For example, countries like France and Ecuador, which have not yet reached the control threshold but are approaching it, have shown patterns indicating new contagion peaks (see Figure 3A). The USA and Ecuador show values far above the control threshold Rt = 1, without a clear decreasing tendency. Countries, such as Chile, Canada, and Brazil, although presenting lower Rt values, are still fighting to control the spread of the virus. It is possible to associate differences in the Rt values with the actions applied to combat the SARS-CoV-2 outbreak. Moreover, Figure 3A highlights the effect of different health policies or government actions, such as border closings, periods of isolation or quarantine, and cancellation of massive events, on the spread of the virus. The effects after the application of the action plans are not immediate due to the incubation and spread dynamics of the virus, among other reasons. However, the trend is clear: Rt curves decrease –on average– over time, which is consistent with the progressive actions countries have executed. A detailed analysis of Chilean trends on Rt is presented in Contreras et al. [31], and iconic dates for control measures in other countries from Figures 2, 3A are listed in Table 2.
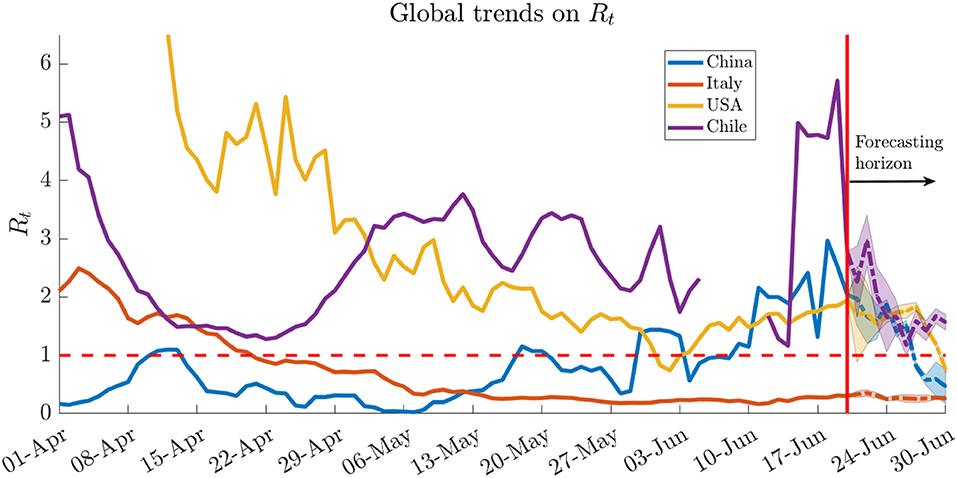
Figure 2. Forecast for the evolution of Rt in selected countries. Even though countries, such as Chile and the USA are approaching the control threshold of Rt = 1, the immediate forecast is not so optimistic. Details of the different governmental actions taken in the timeline are presented in Table 2. The Chilean curve is not continuous in the second week of June due to changes in the data-reporting criteria [30].
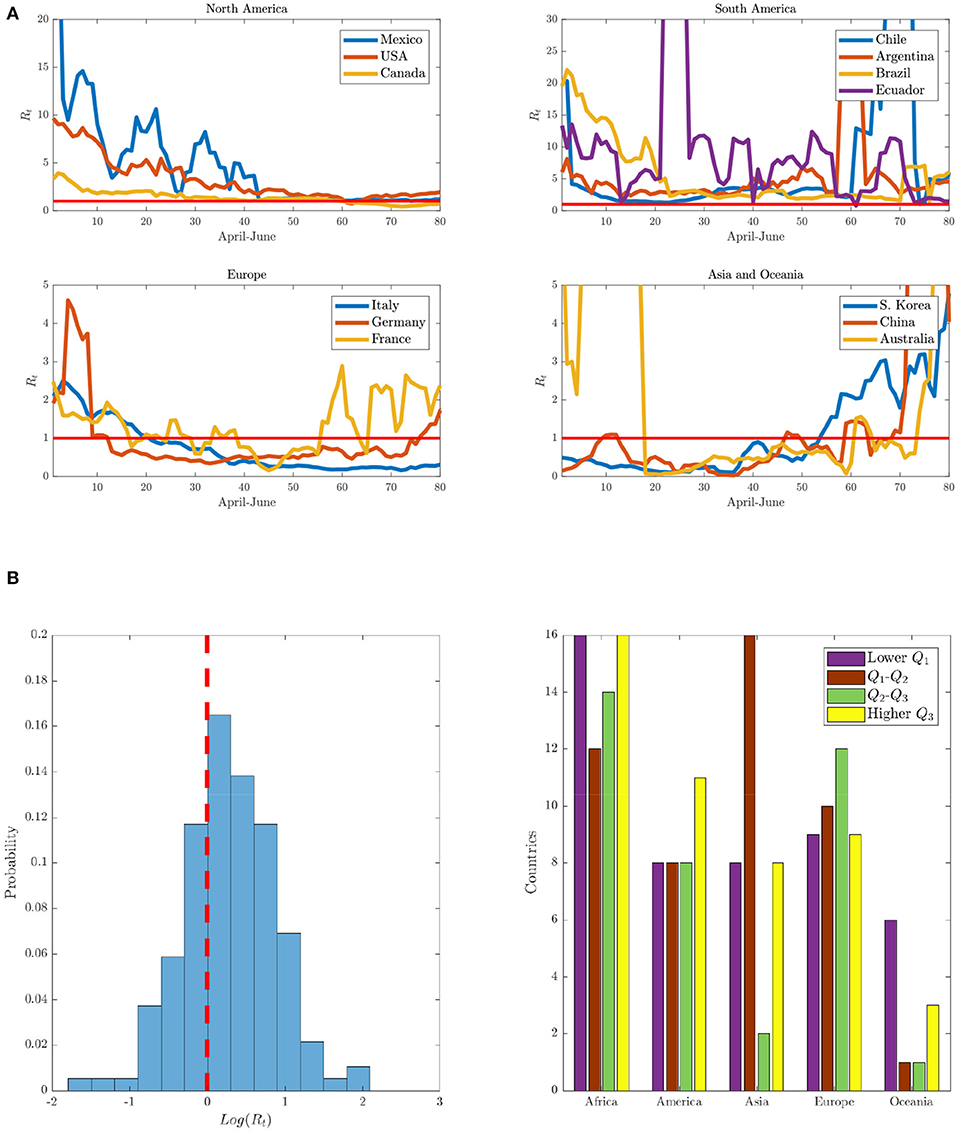
Figure 3. Analysis of spread of COVID-19. (A) Shows the Rt trends for different countries during the spread of COVID-19, separated by continent. (B) (Left) Shows the distribution of Rt during the last day of registration (June 21) and (right), the number of countries our models successfully forecast, per continent. Several countries above the Q3 quartile exhibit Rt values above 4.6, denoting a lack of relevant control over the SARS-CoV-2 outbreak. All data were obtained from Dong et al. [24].
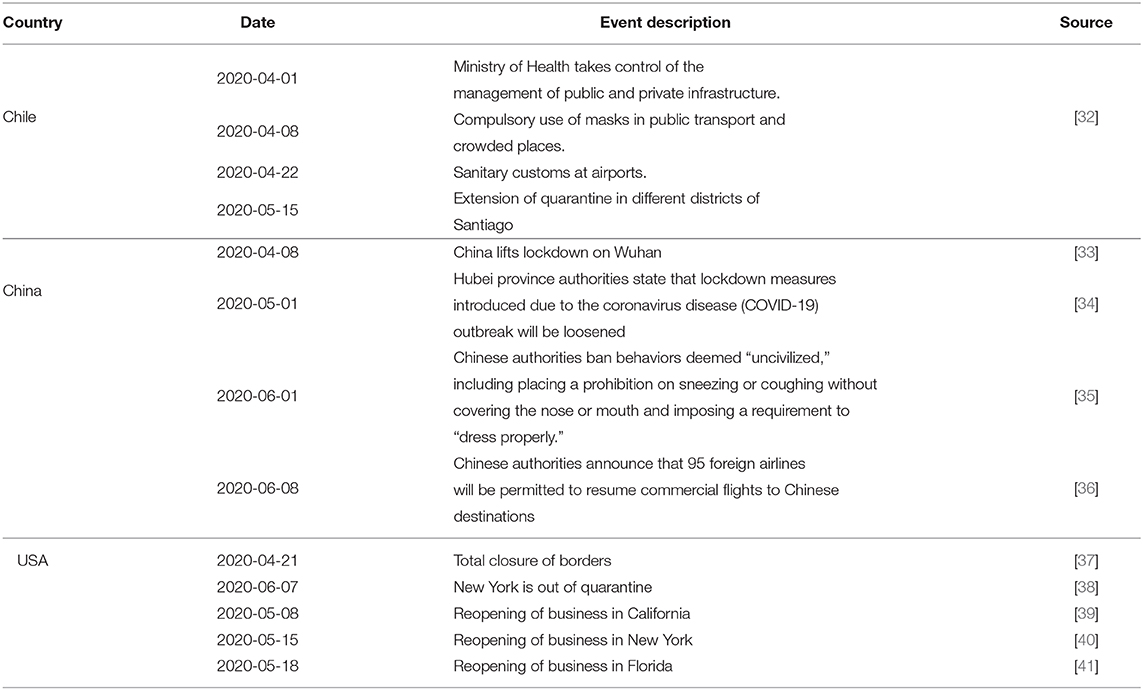
Table 2. Summary of the main governmental actions carried out by iconic countries to control the SARS-CoV-2 outbreak.
A statistical analysis of the value of Rt for the most recent day of analysis (June 21) is presented in Figure 3B. A limited number of countries, such as China or S. Korea, have controlled the spread of the virus. However, a significant number of countries present Rt values >4.6, belonging to the third quartile of the local distribution. In other words, most of the countries reporting progression of the COVID-19 outbreak have not reached the control threshold. At the continental level, Europe and Asia have a greater tendency to higher quartiles, while most African states belong to the first quartile, indicating satisfactory control of the outbreak. Nevertheless, those values should be analyzed carefully, as the latter effect might be rather a sampling effect than a planned situation, as the testing capabilities of most African countries have proven to be overridden by the contingency [42, 43]. Moreover, there are several sources of error to be considered in the analysis of Rt, some of them associated with the data processing and reporting protocols or rather with the nature of the virus.
Despite the several applications of Rt for the evaluation of government action plans and health policies and the assessment of the SARS-CoV-2 outbreak in a country, the estimators used remain somewhat naive, as they rely on the quality of the data. For example, some peaks that can be explained because of incorrect data-reporting or another sampling errors can be spotted in Figures 2, 3A. As estimators do not consider possible errors related to the COVID-19 detection tests, temporal delays between diagnosis and records, or discrepancies among the clinical recovery criteria, proper data pre-treatment should be carried out before using them in order to correct some of these errors. Moreover, in countries with limited resources that do not have sufficient testing capacity to apply screening tests, Rt trends will be altered and negatively affected, since the real dynamics will remain masked and uncertain.
5. Discussion
We have developed prognostic models for the variables infected (I), recovered (R), and dead (D) to enable the estimation of the rate of spread of novel SARS-CoV-2 through the Effective Reproduction Number Rt in different countries worldwide. The models implemented are based on the use of logistic growth techniques in combination with auto-regression, assessing their performance by using the root mean square error (RMSE). Of the models generated for the 185 countries that record data related to the COVID-19 outbreak, 25% have RMSE values under the typical threshold of 1, therefore having predictions for Rt with minimal errors. The source code is available on request.
Asian countries, such as China and S. Korea have controlled the spread in recent weeks, while in Europe, the average trend approaches control. However, new data provide evidence of new outbreaks of COVID-19. At the same time, the panorama in America is much more complicated, since the trends clearly show Rt = 1 roaming far above the control threshold.
Despite the usability of Rt, work should be done on estimating the magnitude of sources of error and the variability of the data. For instance, uncertainties in diagnosis, and differences in the testing strategy and clinical criteria of recovery might lead to temporal misclassification of patients, among others, therefore heavily impacting the reported value of Rt. Moreover, we found discrepancies between the data provider servers of Dong et al. [24] and Info [30] that should be carefully studied. The lack of a protocol to assess and incorporate such errors can lead to unrealistic estimations of Rt, which are particularly dangerous. In this way, new strategies for estimating sources of error in Rt, together with the proposed forecasting methodology, can provide a robust tool for decision-making agents in the COVID-19 pandemic.
Data Availability Statement
Publicly available datasets were analyzed in this study. This data can be found here: https://www.worldometers.info/coronavirus/, https://www.gob.cl/coronavirus/cifrasoficiales/, and https://github.com/CSSEGISandData/COVID-19/tree/master/csse_covid_19_data.
Author Contributions
DM-O and SC: conceptualization. DM-O: methodology. ÁO-N, DM-O, and SC: validation and writing, review, and editing. DM-O, SC, GC-M, and YB-S: investigation. ÁO-N and DM-O: supervision and project administration. ÁO-N: funding resources. All authors contributed to the article and approved the submitted version.
Conflict of Interest
The authors declare that the research was conducted in the absence of any commercial or financial relationships that could be construed as a potential conflict of interest.
Acknowledgments
The authors gratefully acknowledge support from the Centre for Biotechnology and Bioengineering-CeBiB (PIA project FB0001, Conicyt, Chile). DM-O gratefully acknowledges Conicyt, Chile, for Ph.D. fellowship 21181435. DM-O greatly thanks Cristofer Quiroz for his support in the search for databases and related services for the development of forecast models.
References
2. Cucinotta D, Vanelli M. WHO declares COVID-19 a pandemic. Acta Bio Med Atenei Parmensis. (2020) 91:157–60. doi: 10.23750/abm.v91i1.9397
3. Zhu N, Zhang D, Wang W, Li X, Yang B, Song J, et al. A novel coronavirus from patients with pneumonia in China, 2019. N Engl J Med. (2020) 382:727–33. doi: 10.1056/NEJMoa2001017
4. Zhou P, Yang XL, Wang XG, Hu B, Zhang L, Zhang W, et al. A pneumonia outbreak associated with a new coronavirus of probable bat origin. Nature. (2020) 579:270–3. doi: 10.1038/s41586-020-2012-7
5. Forster P, Forster L, Renfrew C, Forster M. Phylogenetic network analysis of SARS-CoV-2 genomes. Proc Natl Acad Sci USA. (2020) 117:9241–3. doi: 10.1073/pnas.2004999117
6. Xi J, Xu K, Jiang P, Lian J, Hao S, Jia H, et al. Virus strain of a mild COVID-19 patient in Hangzhou representing a new trend in SARS-CoV-2 evolution related to Furin cleavage site. medRxiv. (2020). doi: 10.1101/2020.03.10.20033944
7. Tang X, Wu C, Li X, Song Y, Yao X, Wu X, et al. On the origin and continuing evolution of SARS-CoV-2. Natl Sci Rev. (2020) 7:1012–23. doi: 10.1093/nsr/nwaa036
8. Hu Z, Ge Q, Jin L, Xiong M. Artificial intelligence forecasting of covid-19 in china. arXiv. (2020) 200207112.
9. Guo YR, Cao QD, Hong ZS, Tan YY, Chen SD, Jin HJ, et al. The origin, transmission and clinical therapies on coronavirus disease 2019 (COVID-19) outbreak–an update on the status. Milit Med Res. (2020) 7:11. doi: 10.1186/s40779-020-00240-0
10. Kermack WO, McKendrick AG. A contribution to the mathematical theory of epidemics. Proc R Soc Lond A. (1927) 115:700–21. doi: 10.1098/rspa.1927.0118
11. Gupta R, Pandey G, Chaudhary P, Pal SK. SEIR and regression model based COVID-19 outbreak predictions in India. medRxiv. (2020). doi: 10.1101/2020.04.01.20049825
12. Yang Z, Zeng Z, Wang K, Wong SS, Liang W, Zanin M, et al. Modified SEIR and AI prediction of the epidemics trend of COVID-19 in China under public health interventions. J Thorac Dis. (2020) 12:165. doi: 10.21037/jtd.2020.02.64
13. Contreras S, Villavicencio HA, Medina-Ortiz D, Biron-Lattes JP, Olivera-Nappa Á. A multi-group SEIRA model for the spread of COVID-19 among heterogeneous populations. Chaos Solit Fract. (2020) 136:109925. doi: 10.1016/j.chaos.2020.109925
14. Wang S, Kang B, Ma J, Zeng X, Xiao M, Guo J, et al. A deep learning algorithm using CT images to screen for corona virus disease (COVID-19). medRxiv. (2020). doi: 10.1101/2020.02.14.20023028
15. Narin A, Kaya C, Pamuk Z. Automatic detection of coronavirus disease (COVID-19) using X-ray images and deep convolutional neural networks. arXiv. (2020) abs/2003.10849.
16. Hemdan EED, Shouman MA, Karar ME. Covidx-net: a framework of deep learning classifiers to diagnose covid-19 in x-ray images. arXiv. (2020) 200311055.
17. Gozes O, Frid-Adar M, Greenspan H, Browning PD, Zhang H, Ji W, et al. Rapid AI development cycle for the coronavirus (covid-19) pandemic: initial results for automated detection & patient monitoring using deep learning ct image analysis. arXiv. (2020) 200305037.
18. Apostolopoulos ID, Mpesiana TA. Covid-19: automatic detection from x-ray images utilizing transfer learning with convolutional neural networks. Phys Eng Sci Med. (2020) 43:635–640. doi: 10.1007/s13246-020-00865-4
19. Yan L, Zhang HT, Xiao Y, Wang M, Sun C, Liang J, et al. Prediction of criticality in patients with severe Covid-19 infection using three clinical features: a machine learning-based prognostic model with clinical data in Wuhan. medRxiv. (2020). doi: 10.1101/2020.02.27.20028027
20. Gong J, Ou J, Qiu X, Jie Y, Chen Y, Yuan L, et al. A tool to early predict severe corona virus disease 2019 (COVID-19): a multicenter study using the risk nomogram in Wuhan and Guangdong, China. Clin Infect Dis. (2020). doi: 10.1093/cid/ciaa443. [Epub ahead of print].
21. Ge Y, Tian T, Huang S, Wan F, Li J, Li S, et al. A data-driven drug repositioning framework discovered a potential therapeutic agent targeting COVID-19. bioRxiv. (2020). doi: 10.1101/2020.03.11.986836
22. Ong E, Wong MU, Huffman A, He Y. COVID-19 coronavirus vaccine design using reverse vaccinology and machine learning. bioRxiv. (2020). doi: 10.1101/2020.03.20.000141
23. Contreras S, Villavicencio HA, Medina-Ortiz D, Saavedra CP, Olivera-Nappa A. Real-time estimation of R0 for supporting public-health policies against COVID-19. medRxiv. (2020). doi: 10.1101/2020.04.23.20076984
24. Dong E, Du H, Gardner L. An interactive web-based dashboard to track COVID-19 in real time. Lancet Infect Dis. (2020) 20:533–4. doi: 10.1016/S1473-3099(20)30120-1
25. Oliphant TE. Python for scientific computing. Comput Sci Eng. (2007) 9:10–20. doi: 10.1109/MCSE.2007.58
27. Seabold S, Perktold J. Statsmodels: Econometric and statistical modeling with python. In: Proceedings of the 9th Python in Science Conference, Vol. 57. Austin, TX (2010). p. 61. doi: 10.25080/Majora-92bf1922-011
28. Pedregosa F, Varoquaux G, Gramfort A, Michel V, Thirion B, Grisel O, et al. Scikit-learn: machine learning in Python. J Mach Learn Res. (2011) 12:2825–30.
29. Tsoularis A, Wallace J. Analysis of logistic growth models. Math Biosci. (2002) 179:21–55. doi: 10.1016/S0025-5564(02)00096-2
30. Info W. Official Numbers for the Coronavirus Outbreak in Chile. (2020). Available online at: https://www.worldometers.info/coronavirus/ (accessed June 21, 2020).
31. Contreras S, Biron-Lattes JP, Villavicencio HA, Medina-Ortiz D, Llanovarced-Kawles N, Olivera-Nappa Á. Statistically-based methodology for revealing real contagion trends and correcting delay-induced errors in the assessment of COVID-19 pandemic. arXiv. (2020) 200512376. doi: 10.1016/j.chaos.2020.110087
32. MSGG C. Plan de Acción por Coronavirus. (2020). Available online at: https://www.gob.cl/coronavirus/plandeaccion/ (accessed June 21, 2020).
33. Times TNY. China Ends Wuhan Lockdown, but Normal Life Is a Distant Dream. (2020). Available online at: https://www.nytimes.com/2020/04/07/world/asia/wuhan-coronavirus.html (accessed June 21, 2020).
34. GardaWorld. Garda World: China: Hubei Province to Ease Lockdown Restrictions From May 2. (2020). Available online at: https://www.garda.com/crisis24/news-alerts/338201/china-hubei-province-to-ease-lockdown-restrictions-from-may-2-update-60 (accessed June 21, 2020).
35. GardaWorld. Chinese Authorities Ban on Behaviors Deemed. (2020). Available online at: https://www.garda.com/crisis24/news-alerts/336636/china-authorities-to-implement-enhanced-hygienic-measures-from-june-1-amid-covid-19-pandemic-update-58 (accessed June 21, 2020).
36. GardaWorld. Chinese Authorities Have Announced That 95 Foreign Airlines. (2020). Available online at: https://www.garda.com/crisis24/news-alerts/348721/china-authorities-to-ease-international-travel-restrictions-from-june-8-update-65 (accessed June 21, 2020).
37. Hora Digital L. United States Closes Its Borders Due to Coronavirus. (2020). Available online at: https://lahoradigital.com/noticia/27114/sanidad/estados-unidos-cierra-sus-fronteras-por-el-coronavirus.html (accessed June 22, 2020).
38. News S. Phase 1 of Reopening Begins in New York City. (2020). Available online at: https://www.ny1.com/nyc/all-boroughs/noticias/2020/06/08/inicia-la-fase-1-de-la-reapertura-en-la-ciudad-de-nueva-york (accessed June 22, 2020).
39. 3 C. New York Comes Out of Quarantine After Three Months. (2020). Available online at: https://www.cadena3.com/noticia/internacionales/nueva-york-sale-de-la-cuarentena-despues-de-tres-meses_262236 (accessed June 22, 2020).
40. As. Phase 1 of Reopening in New York: Which Businesses Will Open on Friday? (2020). Available online at: https://us.as.com/us/2020/05/15/tikitakas/1589495858_959576.html (accessed June 22, 2020).
41. Infobae. Governor Ron De Santis Enabled the Opening of Commercial Stores in South Florida Starting Next Monday. (2020). Available online at: https://www.infobae.com/america/eeuu/2020/05/14/el-gobernador-ron-de-santis-habilito-la-apertura-de-tiendas-comerciales-en-el-sur-de-florida-a-partir-del-proximo-lunes/ (accessed June 22, 2020).
42. Chiang C, El Sony A. Tackling the threat of COVID-19 in Africa: an urgent need for practical planning. Int J Tuberc Lung Dis. (2020) 24:541–2. doi: 10.5588/ijtld.20.0192
Keywords: COVID-19, SARS-CoV-2, effective reproduction number Rt, public-health policies, epidemiologic modeling
Citation: Medina-Ortiz D, Contreras S, Barrera-Saavedra Y, Cabas-Mora G and Olivera-Nappa Á (2020) Country-Wise Forecast Model for the Effective Reproduction Number Rt of Coronavirus Disease. Front. Phys. 8:304. doi: 10.3389/fphy.2020.00304
Received: 02 May 2020; Accepted: 02 July 2020;
Published: 17 July 2020.
Edited by:
Matjaž Perc, University of Maribor, SloveniaReviewed by:
Michele Bellingeri, University of Parma, ItalyXiao Han, University of California, Davis, United States
Copyright © 2020 Medina-Ortiz, Contreras, Barrera-Saavedra, Cabas-Mora and Olivera-Nappa. This is an open-access article distributed under the terms of the Creative Commons Attribution License (CC BY). The use, distribution or reproduction in other forums is permitted, provided the original author(s) and the copyright owner(s) are credited and that the original publication in this journal is cited, in accordance with accepted academic practice. No use, distribution or reproduction is permitted which does not comply with these terms.
*Correspondence: Álvaro Olivera-Nappa, YW9saXZlcmFAaW5nLnVjaGlsZS5jbA==