 Gian Mauro Manzoni1,2*
 Robert A. Cribbie3
 Valentina Villa1
 Chantal A. Arpin-Cribbie4
 Luca Gondoni5
 Gianluca Castelnuovo1,6
- 1 Psychology Research Laboratory, Istituto Auxologico Italiano IRCCS, Ospedale San Giuseppe, Verbania, Italy
- 2 Department of Psychology, University of Bergamo, Bergamo, Italy
- 3 Department of Psychology, York University, Toronto, ON, Canada
- 4 Department of Psychology, Laurentian University at Georgian College, Barrie, ON, Canada
- 5 Istituto Auxologico Italiano IRCSS, Cardiac Rehabilitation Unit, Ospedale San Giuseppe, Verbania, Italy
- 6 Department of Psychology, Catholic University of Milan, Milan, Italy
The purposes of this observational pre-post study were twofold: 1- to evaluate psychological health in obese patients with ischemic heart disease at admission to cardiac rehabilitation (CR) and 2 – to examine the effectiveness of a 4-week CR residential program in improving obese patients’ psychological well-being at discharge from CR. A sample of 177 obese patients completed the Psychological General Well-Being Inventory (PGWBI) at admission to the CR program and at discharge. The equivalence testing method with normative comparisons was used to determine the clinical significance of improvements after having established that baseline mean scores on the PGWBI scales were significantly lower than normal means. Results show that patients scored equally or better than norms on many PGWBI dimensions at admission to CR but scored significantly worse on Global Score, Vitality and Self-control. At discharge, mean scores that were impaired at baseline returned to normal levels at the more conservative equivalence interval. A 4-week CR program was thus effective in improving obese patients’ psychological well-being. The equivalence testing method allowed to establish the clinical significance of such improvement.
Introduction
Obesity increases several coronary risk factors such as hypertension, hyperlipidemia, insulin resistance, hypercoagulation, generalized inflammatory state and sedentary life style (Savage and Ades, 2006; Lavie et al., 2009; Vanhecke et al., 2009). This is why rates of heart disease are far greater among overweight and obese individuals than in the general population, and nearly 80% of cardiac rehabilitation (CR) patients are overweight or obese (Brochu et al., 2000; Bader et al., 2001; Sierra-Johnson et al., 2005).
Obesity is also associated with quality of life (QoL) impairment (Kushner and Foster, 2000; Kolotkin et al., 2001, 2002). In large part, the poorer overall QoL perceived by obese individuals is due to worse physical functioning, role limitations due to physical problems and bodily pain (Kushner and Foster, 2000). However, obesity may create also a psychological burden on the individual, impair mental well-being and increase the risk of major psychopathological disorders such as depression (Kushner and Foster, 2000). Studies suggest that obese women do suffer from mild to severe psychological disorders more than obese men as well as obese persons who seek weight-loss treatment in comparison with obese individuals who do not (Fitzgibbon et al., 1993; Sullivan et al., 1993; Carpenter et al., 2000; Fontaine et al., 2000). Moreover, it has been observed that obese individuals with higher BMIs, the ones seeking surgical weight-loss treatment and the ones with a high number of acquired co-morbid illnesses have the lower scores in QoL measures (Doll et al., 2000; Kushner and Foster, 2000; Kolotkin et al., 2001).
Recent cross-sectional studies have also shown that higher BMI and obesity are associated with lower QoL scores even after adjusting for the presence of heart disease and other chronic illnesses such as diabetes (Jia and Lubetkin, 2005; Dennett et al., 2008; Hlatky et al., 2010). Furthermore, the few clinical studies that examined the effects of CR on obese patients and included a QoL measure found significant improvements in many outcomes such as exercise capacity, coronary risk factors and also QoL along with noticeable weight reductions (Lavie and Milani, 1997; Savage et al., 2002; Yu et al., 2003; Gunstad et al., 2007; Lavie et al., 2008).
However, the instruments that were used to evaluate QoL in obese patients with heart disease are generic questionnaires such as the SF36 (McHorney et al., 1994) and the EQ-5D (www.euroqol.org). To our knowledge, no study used a disease-specific or obesity-specific instrument for the evaluation of QoL in such a population and no study focused on the QoL psychosocial components.
The aims of this observational study are thus (1) to evaluate psychological health in obese patients with ischemic heart disease (IHD) at admission to CR and (2) to examine the effectiveness of a 4-week CR residential program in improving obese patients’ psychological well-being at discharge from CR.
Materials and Methods
Study Sample
We studied data from 175 white inpatients (52 females – 29.7%) with obesity and IHD who were referred to residential CR. Obesity was defined as body mass index (BMI) ≥30 kg/m2. IHD was defined as a history of at least one of the following: myocardial infarction, coronary artery by-pass (CABG), coronary angioplasty (PTCA). Every patient was in clinically stable conditions at admission to hospital and the ones with recent (less than 4 weeks) myocardial infarction, CABG or PTCA were not considered in the analysis. Time from cardiac disease onset was not recorded in the database and no attempt was made to get it from the medical records.
Baseline body weight was measured at admission to CR in the morning after overnight fasting and after voiding. Weight was further measured weekly and at discharge from CR.
Study Design
The study has a quasi-experimental pre-post design without control group. Patients included in the study were selected according to inclusion and exclusion criteria among a large sample of all cardiac patients who had completed the 4-week CR residential program between March and September 2009. Weight, medical and psychometric data were collected from individual records stored in a secured database. All patients gave their informed consent for anonymous data analysis and publication at admission to CR.
Multi-Factorial Cardiac Rehabilitation Program
The multi-factorial CR program that was delivered to the study patients has a 4-week time format, involves residential hospital stay and consists of the following clinical components:
Physical activity
The physical activity program entails daily sessions (6 days a week) of aerobic activity that include 30-min sessions of cycloergometer, walking at low speed for about 45 min (3–4 METs) and strength exercise. The activity level is checked weekly and the workload is redefined on the basis of the attained results. The intensity of the program is determined on the basis of the exercise test.
Hypocaloric diet
Diet is assigned by a dietician after a personal interview with the patient. The caloric intake is set at approximately 80% of resting energy expenditure (REE). Each week, on the basis of the amount of weight loss, the diet is checked and adapted. The diet derives 50% of energy from carbohydrates, 30% from lipids, and 20% from proteins. In the study sample, diet therapy provided 1579 Kcal/day on average.
Brief psychological treatment
Psychological treatment is cognitive-behavioral oriented and mainly based on the new cognitive-behavioral approach for the treatment of obesity developed by Cooper and Fairburn (Cooper and Fairburn, 2001). Psychological sessions are both individual and group-based. The individual work consists in bi-weekly psychological consultations that address the individual’s specific areas of vulnerability. Indeed, individual treatments are empirically supported and highly fitted on each patients’ personal needs in accordance with Wardle’s suggestions (Wardle, 2009). Group sessions are weekly scheduled and provide psycho-education about psychosocial cardiac risk factors and specific training on assertive, motivational, coping and stress management skills according to Italian and European guidelines for psychological interventions in CR (Sommaruga et al., 2003; Graham et al., 2007).
QoL Measurement
The Psychological General Well-Being Inventory (PGWBI) was used to measure subjective mental health (Dupuy, 1984). The responses to 22 questions are arranged in six subscales: anxiety, depressed mood, positive well-being, self-control, general health and vitality. Higher scores indicate better health. The questionnaire has already been used in cardiac patients in order to evaluate improvement in QoL during 10 years after CABG (Herlitz et al., 2003). The Italian version of the questionnaire has been recently validated and normative values are available to compare individual or group data with population norms (Grossi et al., 2002). PGWBI was administered by an assistant psychologist at admission and at discharge from hospital.
Statistical Analysis
Paired samples t-tests were used to statistically determine if patients improved from entry to discharge from CR on the Global Score and the six subscales of the PGWBI. Equivalence tests were conducted using normative comparisons (Kendall et al., 1999; Cribbie and Arpin-Cribbie, 2009) to assess the clinical significance of statistically significant improvements. More specifically, normative comparisons evaluate whether an intervention that has produced a statistically significant improvement in the outcome has also produced a clinically meaningful effect, by determining if the treated group is equivalent to a normal comparison group after the intervention. The equivalence of the patient and normal comparison groups is assessed through equivalence testing, in which the groups are declared equivalent if the difference between the means is trivial or, more specifically, if the difference between the means falls within an equivalence interval (Schuirmann, 1987; Rogers et al., 1993; Seaman and Serlin, 1998; Cribbie et al., 2004). An equivalence interval represents the smallest difference between the means that is considered inconsequential within the framework of the study. The normative comparisons conducted in this study followed the steps outlined in Cribbie and Arpin-Cribbie (2009). Specifically, in order to evaluate the efficacy of the CR program in improving obese patients’ mental health, we followed two consecutive steps: (1) we conducted a two independent-samples difference-based test, specifically the heteroscedastic t-test due to Welch (Welch, 1938), to establish if the baseline PGWBI means of the study sample were significantly lower than the normal comparison group means; (2) conditional on the results of the previous step, we utilized the heteroscedastic, two independent-sample, Schuirmann-Welch equivalence test (Gruman et al., 2007) to determine if the PGWBI means of the study sample were equivalent to the normal comparison group means at discharge. The second step involved only the PGWBI scales for which the baseline t-test was statistically significant.
Normal comparisons were conducted for the total study sample and separately for specific subgroups established by sex, age (<55, >55), diabetes status and BMI categories according to the international classification of obesity (Class I = BMI 30–34.9; Class II = BMI 35–39.9 and Class III = BMI ≥ 40). With respect to gender and age, separate normative data are available. In particular, normative data for the younger (<55) and older (>55) age groups was established by computing weighted averages from the specific age categories reported in the PGWBI manual (Grossi et al., 2002). Declarations of equivalence were made at the 0.5, 1.0 and 1.5 standard deviations levels (of the normal comparison group), which can be labeled “definitive equivalence”, “probable equivalence” and “potential equivalence”, respectively (Cribbie and Arpin-Cribbie, 2009).
The baseline and discharge distributions of the PGWBI subscales were slightly negatively skewed, although no actions (e.g., transformations) were performed because this would render the comparisons with the normal group data meaningless.
Results
Baseline demographic and medical characteristics are shown in Table 1. Males and females were almost equally represented in the sample and half of the patients had diabetes. Furthermore, BMIs spanned from the lower bound of the first obesity class (BMI = 30) to the third class with patients filling each category in similar proportions. However, two cases were removed from analyses because they had extreme scores (standard normal [z] scores greater than 3 in absolute value) on multiple subscales of the PGWBI. Hence, the total sample size for the analyses reduced to 175 patients.
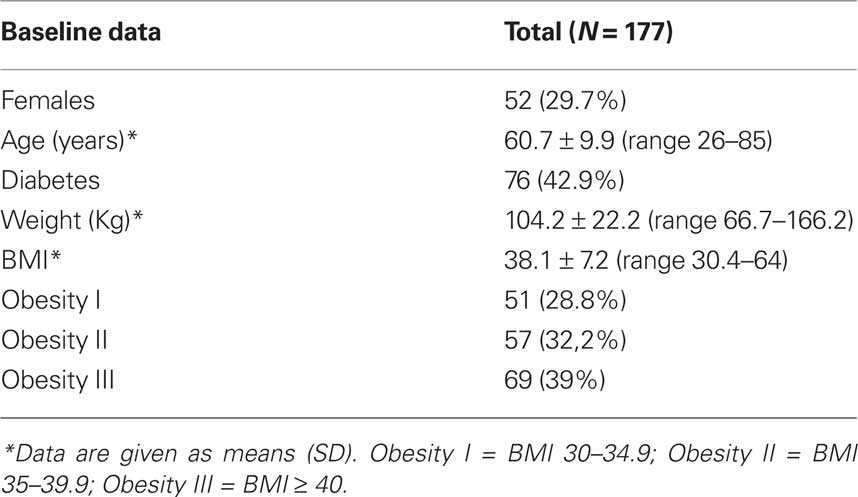
Table 1. Demographic and medical characteristics.
Baseline Comparisons with Norms
The study sample had similar or better mean scores compared with the normative population means in most of the PGWBI scales: Anxiety, Depression, Positive well-being and General health. However, on the Global score, Self-control and Vitality patients had significantly lower mean scores that norms (Table 2).
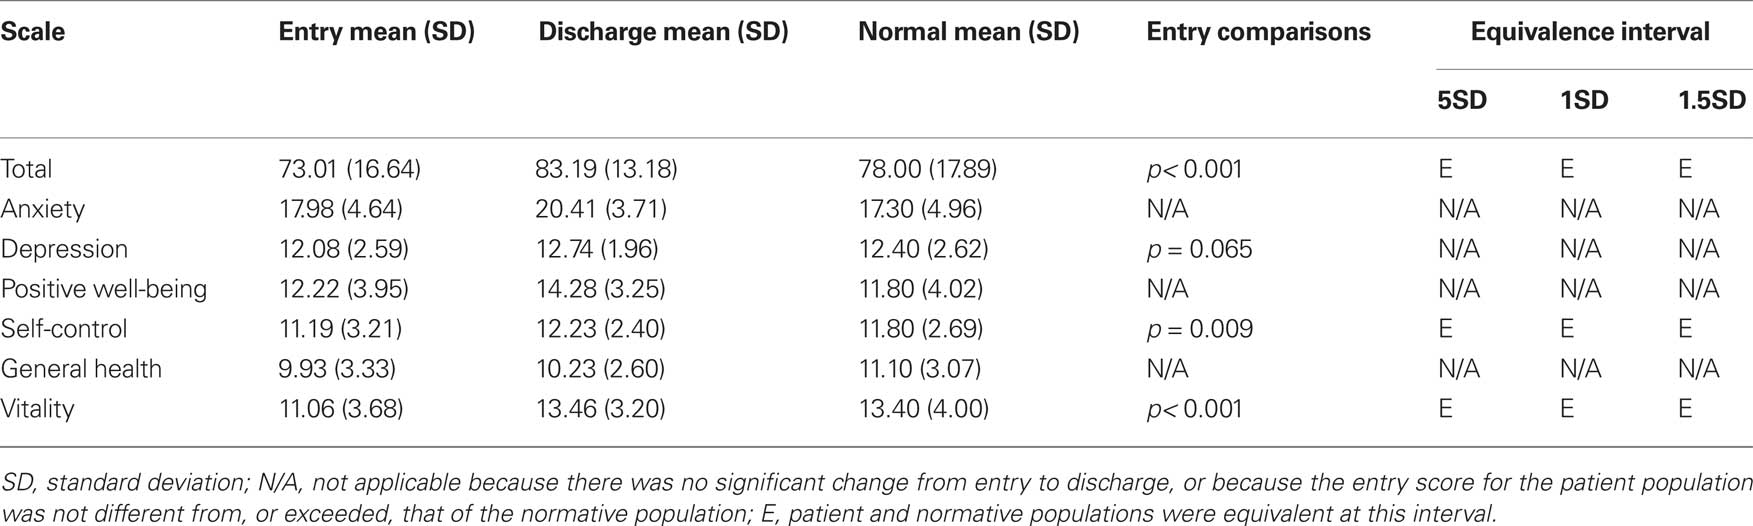
Table 2. Normative comparisons for all data (N = 175) for the PGWBI scales.
Within-Group Changes
The results of the paired samples t-tests show that patients had statistically significant improvements from baseline to discharge from CR on the PGWBI Global Score, t (174) = 10.38, p < 0.001, η2 = 0.382, Anxiety, t (174) = 7.65, p < 0.001, η2 = 0.252, Depression, t (174) = 3.71, p < 0.001, η2 = 0.073, Self-control, t (174) = 4.65, p < 0.001, η2 = 0.111, Positive well-being, t (174) = 8.59, p < 0.001, η2 = 0.298, and Vitality, t (174) = 9.47, p < 0.001, η2 = 0.340. There was no significant improvement in general health, t (174) = 1.14, p = 0.257, η2 = 0.007.
Clinical Significance Testing
Equivalence testing was not conducted for the Anxiety, Depression, Positive well-being and General health scales because the study sample had better or similar baseline mean scores in comparison with the normative population. On Global score, Self-control and Vitality patients scored significantly worse than norms at baseline, although sample means were equivalent to normal means at discharge at even the most conservative equivalence interval (0.5 SD), which can be described as “definitive equivalence”.
Subgroups Results
The normative comparison results for the subgroups (male/female, younger/older, diabetics/non-diabetics and obesity classes) are presented in Table 3. In instances where patients scored similarly or better than norms at baseline, data were omitted from the table but may be obtained by contacting the first author. Specifically, male patients scored statistically higher than the male norms on Anxiety and Positive well-being, while females scored higher than the respective normative comparison group on Anxiety. Further, females were not statistically different from to the normative group on Depression (p = 0.128) and Positive well-being (p = 0.311). Younger patients (<55-years old) scored higher than the age-matched normative group on Anxiety and Positive well-being, and were not statistically different from norms on Depression (p = 0.077). Older patients scored higher than the age-matched normative group on Anxiety, Depression and Positive well-being, and were not statistically different from norms on the Global score (p = 0.500) and Self-control (p = 0.332). Both non-diabetics and diabetics scored statistically higher than the total normative population on Anxiety and Positive well-being, and were not statistically different from norms on depression (p = 0.111 and p = 0.165 respectively). Diabetics were not statistically different from norms also on self-control (p = 0.078).
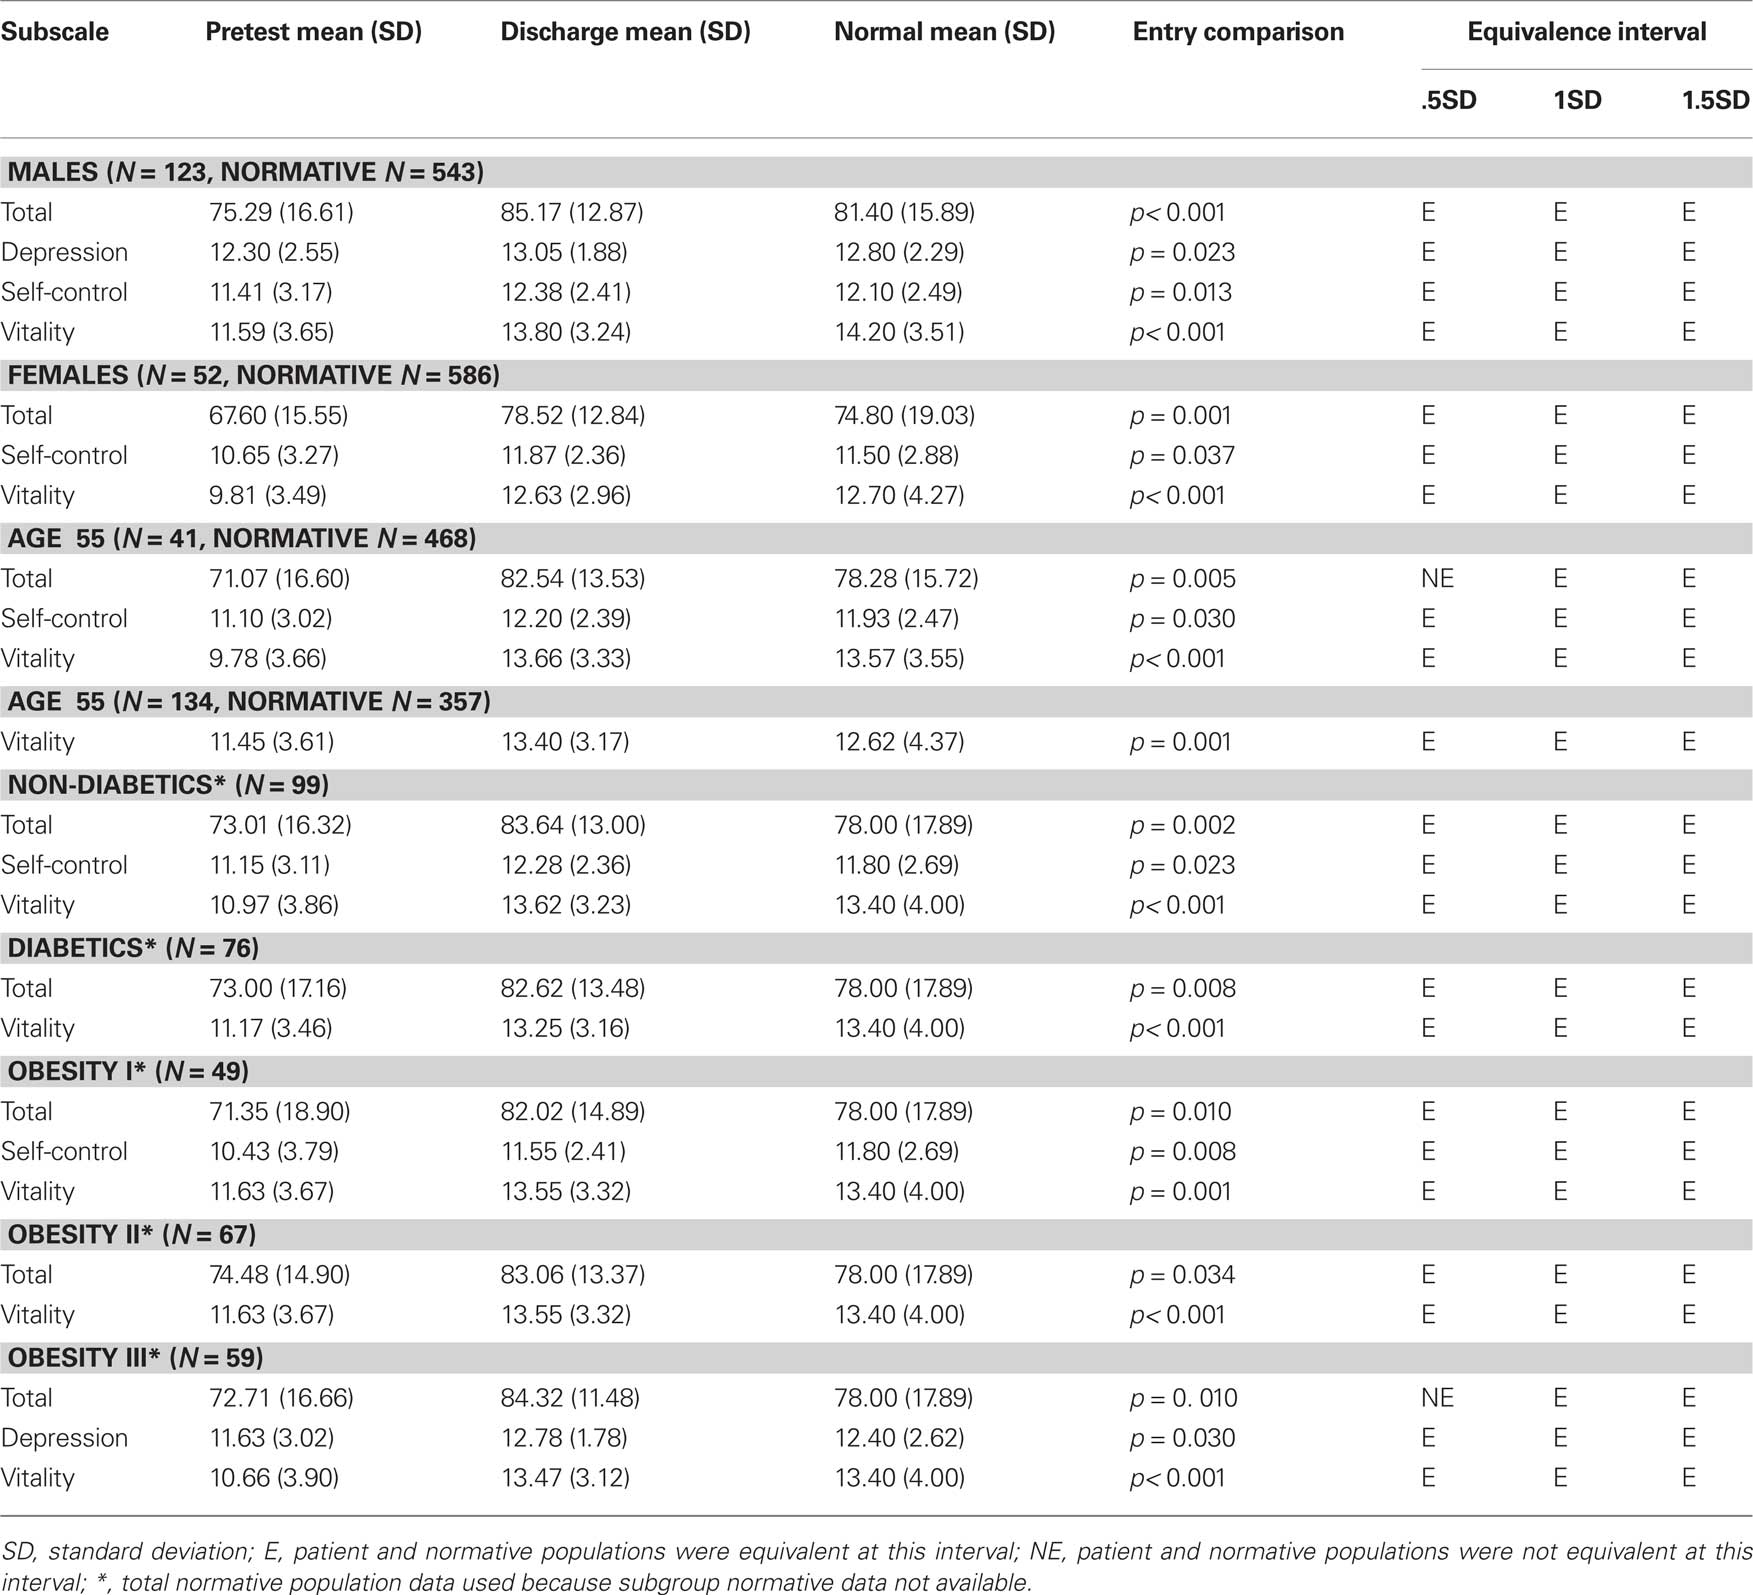
Table 3. Normative comparisons for subgroups of the patient data for the subscales of the PGWBI.
With respect to obesity classes, mildly obese patients scored higher than the total normative population on Anxiety and were not statistically different from norms on Depression (p = 0.279) and positive well-being (p = 0.098). Class II patients scored higher than the total normative population on Anxiety and Positive well-being, and were not statistically different from norms on Depression (p = 0.500) and Self-control (p = 0.123). Finally, class III patients scored higher than the total normative population on Anxiety and Positive well-being, and were not statistically different from norms on Self-control (p = 0.304).
At discharge, in instances where subgroups had statistically lower mean scores that norms, male and female patients were both found to be equivalent to their age-matched normative groups on Global score, Self-control and Vitality (all at the most conservative 0.5 SD interval), and male patients were also found to be equivalent to the respective normative group on depression (0.5 SD interval). Both the younger and older patients were equivalent to their respective normative groups on vitality at discharge from CR, and the younger subgroup was also equivalent to the respective normative group on Global score (1 SD interval) and Self-control (0.5 SD interval). With respect to diabetics versus non-diabetics, both were equivalent to norms on Global score and Vitality at discharge, and the non-diabetic group was also equivalent to the total normative population on Self-control (0.5 SD interval). Finally, each of the BMI categories was equivalent to the total normative population on Global score (Class I and II at the 0.5 SD interval and Class III at the 1 SD interval) and vitality at discharge (0.5 SD interval), while Obesity I patients were also equivalent to norms on self-control (0.5 SD interval) and Obesity III patients were equivalent to norms on depression (0.5 SD interval).
Discussion
In this observational study, we evaluated psychological and emotional health in a sample of obese patients with heart disease at admission to a 4-week residential CR program and determined the clinical significance of psychological and emotional health improvement at discharge from hospital. We hypothesized that obese patients with heart disease referred to CR have lower scores in a measure of QoL, i.e., the Psychological General Well-Being Inventory-PGWBI, compared with norms and that CR is effective in improving mental health to normal levels.
Results reveal that obese patients had similar or even better mean scores than norms on most of the PGWBI scales at admission to CR. However, Global score, Self-control and Vitality were significantly impaired in the study sample. On average, our patients were not suffering from emotional distress at admission to CR but were mainly experiencing feelings of tiredness, exhaustion, listlessness, low self-efficacy and general psychological distress. Global score and Vitality were significantly impaired even in all subgroups (males, females, younger and older patients, diabetics and non-diabetics, and all the obesity classes), while only males and obesity class III patients had lower mean scores on Depression at admission to CR.
All the PGWBI dimensions that were impaired at baseline significantly improved at the end of the CR program and even some of the scales that were not previously impaired further improved. Indeed, paired samples t-tests revealed statistically significant improvements in all the PGWBI scales but General Health. However, General Health was not significantly impaired at baseline and remained stable at discharge.
Equivalence testing with normative comparisons was used to evaluate whether the 4-week CR program was effective in improving impaired PGWBI dimensions to normal levels. Results show that patients’ mean scores on the PGWBI scales that were impaired at baseline in comparison to norms (Global score, Self-control and Vitality) were equivalent to normal means at discharge form CR at the most conservative equivalence interval (0.5 SD), which can be described as “definitive equivalence”. Even at subgroups level, the PGWBI scales that resulted impaired at baseline significantly improved to normal scores at the end of the CR program.
Over the past decade, evaluation of QoL has become an essential clinical and research outcome measurement in CR (McGee et al., 1999) as well as in other clinical interventions such as weight-loss treatment (Kushner and Foster, 2000). To our knowledge, this is the first study that used the PGWBI to assess the effectiveness of CR on obese patients with IHD. Most of previous studies utilized the SF36, a generic QoL questionnaire that covers psychological and emotional distress poorly, and does not consider the positive dimensions of QoL (Hevey et al., 2004). On the contrary, the PGWBI is a specific measure of psychological and emotional variables correlated to QoL and covers both positive and negative dimensions.
Returning patients to equivalency with a normal population is one of the most important goals of many interventions, including this one, and thus these analyses provided a valuable method for assessing the objectives of the study. One limitation of the use of normative equivalence testing with this data is that the patients scored similarly (or even better) than the normal comparison group on many PGWBI dimensions at the point of entry into the CR program. This not only limits the amount of improvement that can be expected on these variables, but also renders the normative comparisons meaningless because if the patients are not different from the normal comparison group at baseline then it does not make much sense to see if they are equivalent to the normal comparison group at discharge. However, the normative comparisons did allow for valuable assessment of the effectiveness of the CR program on many PGWBI dimensions in which the patients did score significantly worse than the normal comparison group at baseline.
Conflict of Interest Statement
The authors declare that the research was conducted in the absence of any commercial or financial relationships that could be construed as a potential conflict of interest.
References
Bader, D. S., Maguire, T. E., Spahn, C. M., O’Malley, C. J., and Balady, G. J. (2001). Clinical profile and outcomes of obese patients in cardiac rehabilitation stratified according to National Heart, Lung, and Blood Institute criteria. J. Cardiopulm. Rehabil. 21, 210–217.
Brochu, M., Poehlman, E. T., and Ades, P. A. (2000). Obesity, body fat distribution, and coronary artery disease. J. Cardiopulm. Rehabil. 20, 96–108.
Carpenter, K. M., Hasin, D. S., Allison, D. B., and Faith, M. S. (2000). Relationships between obesity and DSM-IV major depressive disorder, suicide ideation, and suicide attempts: results from a general population study. Am. J. Public Health 90, 251–257.
Cooper, Z., and Fairburn, C. G. (2001). A new cognitive behavioural approach to the treatment of obesity. Behav. Res. Ther. 39, 499–511.
Cribbie, R. A., and Arpin-Cribbie, C. A. (2009). Evaluating clinical significance through equivalence testing: extending the normative comparisons approach. Psychother. Res. 19, 677–686.
Cribbie, R. A., Gruman, J. A., and Arpin-Cribbie, C. A. (2004). Recommendations for applying tests of equivalence. J. Clin. Psychol. 60, 1–10.
Dennett, S. L., Boye, K. S., and Yurgin, N. R. (2008). The impact of body weight on patient utilities with or without type 2 diabetes: a review of the medical literature. Value Health 11, 478–486.
Doll, H. A., Petersen, S. E., and Stewart-Brown, S. L. (2000). Obesity and physical and emotional well-being: associations between body mass index, chronic illness, and the physical and mental components of the SF-36 questionnaire. Obes. Res. 8, 160–170.
Dupuy, H. (1984). “The psychological general well-being (PGWB) inventory,” in Assessment of Quality of Life in Clinical Trials of Cardiovascular Therapies, ed. N. Wenger (New York: Le Jacq Publications), 170–183.
Fitzgibbon, M. L., Stolley, M. R., and Kirschenbaum, D. S. (1993). Obese people who seek treatment have different characteristics than those who do not seek treatment. Health Psychol. 12, 342–345.
Fontaine, K. R., Bartlett, S. J., and Barofsky, I. (2000). Health-related quality of life among obese persons seeking and not currently seeking treatment. Int. J. Eat. Disord. 27, 101–105.
Graham, I., Atar, D., Borch-Johnsen, K., Boysen, G., Burell, G., Cifkova, R., Dallongeville, J., De Backer, G., Ebrahim, S., Gjelsvik, B., Herrmann-Lingen, C., Hoes, A., Humphries, S., Knapton, M., Perk, J., Priori, S. G., Pyorala, K., Reiner, Z., Ruilope, L., Sans-Menendez, S., Op Reimer, W. S., Weissberg, P., Wood, D., Yarnell, J., Zamorano, J. L., Walma, E., Fitzgerald, T., Cooney, M. T., Dudina, A., Vahanian, A., Camm, J., De Caterina, R., Dean, V., Dickstein, K., Funck-Brentano, C., Filippatos, G., Hellemans, I., Kristensen, S. D., McGregor, K., Sechtem, U., Silber, S., Tendera, M., Widimsky, P., Altiner, A., Bonora, E., Durrington, P. N., Fagard, R., Giampaoli, S., Hemingway, H., Hakansson, J., Kjeldsen, S. E., Larsen, L., Mancia, G., Manolis, A. J., Orth-Gomer, K., Pedersen, T., Rayner, M., Ryden, L., Sammut, M., Schneiderman, N., Stalenhoef, A. F., Tokgozoglu, L., Wiklund, O., and Zampelas, A. (2007). European guidelines on cardiovascular disease prevention in clinical practice: full text. Fourth Joint Task Force of the European Society of Cardiology and other societies on cardiovascular disease prevention in clinical practice (constituted by representatives of nine societies and by invited experts). Eur. J. Cardiovasc. Prev. Rehabil. 14(Suppl 2), S1–S113.
Grossi, E., Mosconi, P., and Groth, N. (2002). Il Questionario Psychological General Well-Being. Versione Italiana. Milan: Edizioni “Mario Negri”.
Gruman, J., Cribbie, R. A., and Arpin-Cribbie, C. A. (2007). The effects of heteroscedasticity on tests of equivalence. J. Mod. Appl. Stat. Methods 6, 133–140.
Gunstad, J., Luyster, F., Hughes, J., Waechter, D., Rosneck, J., and Josephson, R. (2007). The effects of obesity on functional work capacity and quality of life in phase II cardiac rehabilitation. Prev. Cardiol. 10, 64–67.
Herlitz, J., Brandrup-Wognsen, G., Caidahl, K., Haglid, M., Karlson, B. W., Hartford, M., Karlsson, T., and Sjoland, H. (2003). Improvement and factors associated with improvement in quality of life during 10 years after coronary artery bypass grafting. Coron. Artery Dis. 14, 509–517.
Hevey, D., McGee, H. M., and Horgan, J. (2004). Responsiveness of health-related quality of life outcome measures in cardiac rehabilitation: comparison of cardiac rehabilitation outcome measures. J. Consult. Clin. Psychol. 72, 1175–1180.
Hlatky, M. A., Chung, S. C., Escobedo, J., Hillegass, W. B., Melsop, K., Rogers, W., and Brooks, M. M. (2010). The effect of obesity on quality of life in patients with diabetes and coronary artery disease. Am. Heart J. 159, 292–300.
Jia, H., and Lubetkin, E. I. (2005). The impact of obesity on health-related quality-of-life in the general adult US population. J. Public Health (Oxf) 27, 156–164.
Kendall, P. C., Marrs-Garcia, A., Nath, S. R., and Sheldrick, R. C. (1999). Normative comparisons for the evaluation of clinical significance. J. Consult. Clin. Psychol. 67, 285–299.
Kolotkin, R. L., Crosby, R. D., and Williams, G. R. (2002). Health-related quality of life varies among obese subgroups. Obes. Res. 10, 748–756.
Kolotkin, R. L., Meter, K., and Williams, G. R. (2001). Quality of life and obesity. Obes. Rev. 2, 219–229.
Lavie, C. J., and Milani, R. V. (1997). Effects of cardiac rehabilitation, exercise training, and weight reduction on exercise capacity, coronary risk factors, behavioral characteristics, and quality of life in obese coronary patients. Am. J. Cardiol. 79, 397–401.
Lavie, C. J., Milani, R. V., and Ventura, H. O. (2009). Obesity and cardiovascular disease: risk factor, paradox, and impact of weight loss. J. Am. Coll. Cardiol. 53, 1925–1932.
Lavie, C. J., Morshedi-Meibodi, A., and Milani, R. V. (2008). Impact of cardiac rehabilitation on coronary risk factors, inflammation, and the metabolic syndrome in obese coronary patients. J. Cardiometab. Syndr. 3, 136–140.
McGee, H. M., Hevey, D., and Horgan, J. H. (1999). Psychosocial outcome assessments for use in cardiac rehabilitation service evaluation: a 10-year systematic review. Soc. Sci. Med. 48, 1373–1393.
McHorney, C. A., Ware, J. E. Jr., Lu, J. F., and Sherbourne, C. D. (1994). The MOS 36-item Short-Form Health Survey (SF-36): III. Tests of data quality, scaling assumptions, and reliability across diverse patient groups. Med. Care 32, 40–66.
Rogers, J. L., Howard, K. I., and Vessey, J. T. (1993). Using significance tests to evaluate equivalence between two experimental groups. Psychol. Bull. 113, 553–565.
Savage, P. D., and Ades, P. A. (2006). The obesity epidemic in the United States: role of cardiac rehabilitation. Coron. Artery Dis. 17, 227–231.
Savage, P. D., Lee, M., Harvey-Berino, J., Brochu, M., and Ades, P. A. (2002). Weight reduction in the cardiac rehabilitation setting. J. Cardiopulm. Rehabil. 22, 154–160.
Schuirmann, D. J. (1987). A comparison of the two one-sided tests procedure and the power approach for assessing the equivalence of average bioavailability. J. Pharmacokinet. Biopharm. 15, 657–680.
Seaman, M. A., and Serlin, R. C. (1998). Equivalence confidence intervals for two-group comparisons of means. Psychol. Methods 3, 403–411.
Sierra-Johnson, J., Wright, S. R., Lopez-Jimenez, F., and Allison, T. G. (2005). Relation of body mass index to fatal and nonfatal cardiovascular events after cardiac rehabilitation. Am. J. Cardiol. 96, 211–214.
Sommaruga, M., Tramarin, R., Angelino, E., Bettinardi, O., Cauteruccio, M. A., Miglioretti, M., Monti, M., Pierobon, A., and Sguazzin, C. (2003). Guidelines on psychological intervention in cardiac rehabilitation- methodological process. Monaldi Arch. Chest Dis. 60, 40–44.
Sullivan, M., Karlsson, J., Sjostrom, L., Backman, L., Bengtsson, C., Bouchard, C., Dahlgren, S., Jonsson, E., Larsson, B., Lindstedt, S., et al. (1993). Swedish obese subjects (SOS)--an intervention study of obesity. Baseline evaluation of health and psychosocial functioning in the first 1743 subjects examined. Int. J. Obes. Relat. Metab. Disord. 17, 503–512.
Vanhecke, T. E., Franklin, B. A., Miller, W. M., deJong, A. T., Coleman, C. J., and McCullough, P. A. (2009). Cardiorespiratory fitness and sedentary lifestyle in the morbidly obese. Clin. Cardiol. 32, 121–124.
Wardle, J. (2009). Current issues and new directions in Psychology and Health: The genetics of obesity-What is the role for health psychology? Psychol. Health 24, 997–1001.
Welch, B. L. (1938). The significance of the difference between two means when population variances are unequal. Biometrika 29, 350–362.
Keywords: cardiac rehabilitation, psychological well-being, mental health, obesity, weight loss
Citation: Manzoni GM, Cribbie RA, Villa V, Arpin-Cribbie CA, Gondoni L and Castelnuovo G (2010) Psychological well-being in obese inpatients with ischemic heart disease at entry and at discharge from a four-week cardiac rehabilitation program. Front. Psychology 1:38. doi: 10.3389/fpsyg.2010.00038
Received: 29 April 2010;
Paper pending published: 30 May 2010;
Accepted: 12 July 2010;
Published online: 03 August 2010
Edited by:
Francesco Pagnini, University of Bergamo, ItalyReviewed by:
Mauro Bertolotti, Catholic University of The Sacred Heart, ItalyCopyright: © 2010 Manzoni, Cribbie, Villa, Arpin-Cribbie, Gondoni and Castelnuovo. This is an open-access article subject to an exclusive license agreement between the authors and the Frontiers Research Foundation, which permits unrestricted use, distribution, and reproduction in any medium, provided the original authors and source are credited.
*Correspondence: Gian Mauro Manzoni, Psychology Research Laboratory, San Giuseppe Hospital, Istituto Auxologico Italiano Via Cadorna, 90 28824 Piancavallo (VB), Italy. e-mail:Z20ubWFuem9uaUBhdXhvbG9naWNvLml0