 Thomas V. Pollet
Several recent papers in the field of Evolution and Human Behavior rely on aggregate data when testing their hypothesis on adaptations in humans. This is perhaps most notably the case for studies on pathogen stress, (e.g., DeBruine et al., 2010; Thornhill and Fincher, 2011; Fincher and Thornhill, 2012). These studies predominantly rely on cross-cultural correlations and present p-values in support of their hypotheses. In this opinion article, I demonstrate why p-values can be questionable in this context. I do not wish to single out a particular research area, as the misinterpretation of p in this context seems relatively widespread. But for the purpose of this opinion article I will largely draw on examples from work relating to pathogen stress, as this research area most prominently appears to rely on aggregated cross-cultural data. I also want to stress that this is not a general critique of p-value usage or frequentist statistics (e.g., Johnson, 1999; Anderson et al., 2000; Goodman, 2008; Ziliak and McCloskey, 2008; Wetzels et al., 2011), but rather a critique on the reliance on p-values when using macrolevel data in cases where the sample closely matches the entire range of possible observations. This opinion article is also not a critique of reliance on macrolevel data per se, or of a research programme in particular, but focuses on one particular aspect: statistical inference from macrolevel data when a sample closely matches the entire population.
Inferential Statistics
As is commonly documented (e.g., Howell, 2010), inferential statistics are used when based on a finite sample set of observations, we want to make statistical inferences on the “population” of observations via comparing these to known statistical distributions (e.g., Spatz, 2007). For example, with a one-sample t-test, we can test whether the population mean of adult male heights from Amsterdam differs from a given value (e.g., 170 cm) based on a given set of observations, a sample of Amsterdammers’ heights (see Myers, 2009). The sample of male heights we obtained is compared to a known statistical distribution (t or Z distribution, in this case). This comparison gives us a p-value, which allows to reject the null hypothesis of no statistical difference between the proposed value of 170 cm and the “true” population mean. A p < 0.05 thus would allow us to reject the null hypothesis that the population mean is not statistically different from the hypothesized value of 170 cm, at a 5% significance level.
Similarly to a one sample t-test, when making statistical inferences on a Pearson correlation coefficient, we aim to reject the null hypothesis of no association between two given variables in the population based on a (randomized) sample drawn from that population. Statistical inference in this case is usually based on the t distribution (see Howell, 2010), but alternative modes of inference can be used (e.g., bootstrapping). The null hypothesis we aim to reject here is that the “true” correlation coefficient (ρ) is 0 in the population. When the concomitant t-test is significant, we reject this null hypothesis, in favor of the alternative hypothesis that the “true” correlation coefficient is different from 0 [H(a): ρ ≠ 0].
With cross-cultural correlations, researchers attempt to reject the null hypothesis of no association between these variables at a macrolevel level, i.e., country, region, or state level. This is where statistical inference can become problematic: the observations now consist of countries, states, regions, cultures, or other macrolevel units. In general, there is a relatively small, finite number of these units. It is unlikely that there will be more independent observations in the future. This is unlike observations from rolling a dice, for example, where we can continue to roll a dice, and gather ever more observations. As an example, Thornhill and Fincher (2011) present data on 48 US states, while the finite population of observations arguably consists of 50 US states (51 if we are lenient and grant Puerto Rico state status). In this case, the authors have thus sampled 48 out of the possible 50(/51) potential observations. It is unlikely, that there will be more US states for which we want to make statistical inferences. Even if there were, these “new states” would likely not be independent from the existing ones. In addition, it seems unreasonable to assume that the population of observations is anything else than US states, because this is the unit of observation being sampled (and if this is not the unit of observation, then authors should be explicit what the unit is which they are sampling and consequently wish to make statistical inferences about). In short, in this particular case the authors have sampled over 90% of the observable population and in such a case the use of statistical inference can be questioned. Of course, it is still useful to describe the association via a correlation coefficient, but a p-value makes little sense, as the sample very closely matches the entirety of the population, which we want to make inferences about. As an analogy, if I sampled 90% of all males in Amsterdam, then it makes little sense to still rely on p-values for making statistical inferences on all males from Amsterdam. Of course, it makes good sense to still describe the data via statistics such as the mean, standard deviation, median, etc., but we can question the use of a p-value, when a sample very closely matches the population.
In some cases, (for example, Kanazawa, 2006; DeBruine et al., 2011; Eppig et al., 2011), actually all US states have been sampled. In such a case, a p-value is entirely nonsensical, as the sample matches the population of possible observations, i.e., all US states. To return to the analogy of sampling adult males from Amsterdam, in this case we have the full 100% of the population and there simply is no use for statistical inference: the population is fixed and we have sampled all of the possible cases. There is no probability. Again, it is still useful to describe the associations found via correlation coefficients, for example, but statistical inference is unwarranted when the entire population is sampled.
The same argument on the value of statistical inference when the sample closely matches the population, holds for other aggregate units such as nation states or countries: the maximum number of countries in the world is finite [193 (United Nations, 2013) to 195 (U.S. Department of State, 2012) or 196 (Taiwan, included), depending on definitions] and if we have sampled close to all of them, then statistical inference makes little sense. Other aggregate units such as geopolitical regions (Hofstede, 2001), cultural units (e.g., Human Relations Area Files, Naroll, 1967; Lagacé, 1974, 1979), cultures (e.g., Standard Cross-Cultural Sample, Murdock and White, 1969), regions are also finite and we should think carefully about what the population of observations consists of in these cases and how a given sample relates to the population. In some cases, such as geopolitical regions [68 in case of (Hofstede, 2001)], regions [98 for Fincher et al. (2008)] the population of observations should conceivably be less than maximum of 196 states which exist and we can question whether “new” regions will ever exist or whether the number of regions should be treated as the complete population of possible observations.
Figure 1 shows some examples of the number of observations sampled out of the (reasonable) maximum possible number of observations (data from Kanazawa, 2006; DeBruine et al., 2010, 2011; Eppig et al., 2010, 2011; Letendre et al., 2010; Hruschka and Henrich, 2013). It is by no means a complete set but is merely meant as an illustration of the issue I outlined. As can be seen in some cases, for example DeBruine et al. (2010), a p-value could still be useful, when the sample size is relatively small as opposed to the population. However, when there is a large or complete overlap between the number of observations in and the total number of potential observations, we can question the use of a p-value.
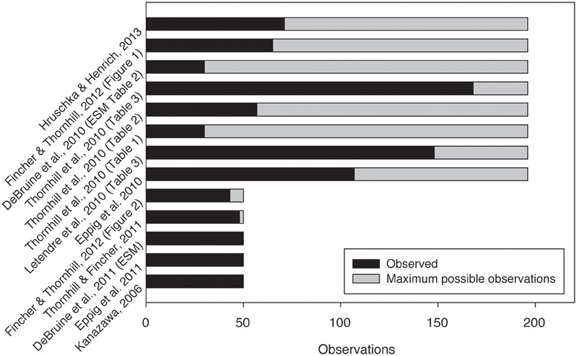
Figure 1. Some examples of papers with the number of observations and the maximum number of observations. This is a non-exhaustive list of examples to illustrate the issue at hand. [The cases for Hruschka and Henrich (2013) are the lowest N used in the paper].
For ease of comprehension, I have outlined the argument above based on the p-value, but the issue I outlined actually already arises with the calculation of the standard error (SE) (see Isserlis, 1918; Levy, 2005; Lavrakas, 2008). For finite samples a correction factor should be applied to the SE, the finite population correction factor: , whereby N is the population size and n is the size of the sample. When this correction factor is not applied, SE and therefore p is not correctly calculated. In the extreme case when N = n, this correction factor, and therefore the SE in question, will be 0.
A potential reason why some researchers in this area would rely on statistical inference in certain cases, where they should not, could be that they assume that statistical inferences are necessary because their measures (such as IQ for example) have some degree of uncertainty. However, the uncertainty of the measure does not call for statistical inference when all observations are given. Researchers could be mixing up the error associated with measurement for a variable such as IQ at an aggregate level with statistical inference of a relationship between aggregate units. Inference of a variable based on a sample (e.g., how well does this sample represent IQ of Wyoming?) is obviously different from inference on the relationship between variables at state level (Is there a statistical relationship between IQ and variable Y at state level?). Regardless of the measurement error of a variable, the “true” statistical relationship is certain when the population is completely sampled: no statistical inference can be made in such a case and therefore p is obsolete.
An additional possible reason for incorporating p-values when they are unwarranted could be that there are “political” reasons for ritualistically relying on them, perhaps as they provide dichotomous answers to research questions (also see Cohen, 1994; Hoekstra et al., 2006). Editors and reviewers can insist on reporting these p-values even when they seem unwarranted and even in the light of frequent calls for alternatives (e.g., Wilkinson, 1999), we continue to heavily rely on them.
In conclusion, in this brief opinion article I questioned the use of p-values when the sample consists of aggregate data and the sample of observations closely matches the range of possible observations. I recommend that p-values are more critically assessed when applied to macrolevel cross-cultural correlations but acknowledge that there can be many constraints which can lead to their continued usage.
Acknowledgments
Thomas V. Pollet is supported by The Netherlands Organisation for Scientific Research (Veni, 451.10.032). I am grateful to Peter Dekker and the reviewers for helpful comments, which helped to improve previous versions and Joshua Tybur, Willem Frankenhuis, Ian Rickard, Gert Stulp for helpful discussion.
References
Anderson, D. R., Burnham, K. P., and Thompson, W. L. (2000). Null hypothesis testing: problems, prevalence, and an alternative. J. Wildlife Manag. 64, 912–923. doi: 10.2307/3803199
Cohen, J. (1994). The earth is round (p < 0.05). Am. Psychol. 49, 997. doi: 10.1037/0003-066X.49.12.997
DeBruine, L. M., Jones, B. C., Crawford, J. R., Welling, L. L. M., and Little, A. C. (2010). The health of a nation predicts their mate preferences: cross-cultural variation in women’s preferences for masculinized male faces. Proc. R. Soc. B Biol. Sci. 277, 2405–2410. doi: 10.1098/rspb.2009.2184
DeBruine, L. M., Jones, B. C., Little, A. C., Crawford, J. R., and Welling, L. L. M. (2011). Further evidence for regional variation in women’s masculinity preferences. Proc. R. Soc. B Biol. Sci. 278, 813–814. doi: 10.1098/rspb.2010.2200
Eppig, C., Fincher, C. L., and Thornhill, R. (2010). Parasite prevalence and the worldwide distribution of cognitive ability. Proc. R. Soc. B Biol. Sci. 277, 3801–3808. doi: 10.1098/rspb.2010.0973
Eppig, C., Fincher, C. L., and Thornhill, R. (2011). Parasite prevalence and the distribution of intelligence among the states of the USA. Intelligence 39, 155–160. doi: 10.1016/j.intell.2011.02.008
Fincher, C. L., and Thornhill, R. (2012). Parasite-stress promotes in-group assortative sociality: the cases of strong family ties and heightened religiosity. Behav. Brain Sci. 35, 65–79. doi: 10.1017/S0140525X11000021
Fincher, C. L., Thornhill, R., Murray, D. R., and Schaller, M. (2008). Pathogen prevalence predicts human cross-cultural variability in individualism/collectivism. Proc. R. Soc. B Biol. Sci. 275, 1279–1285. doi: 10.1098/rspb.2008.0094
Goodman, S. (2008). A dirty dozen: twelve p-value misconceptions. Semin. Hematol. 45, 135–140. doi: 10.1053/j.seminhematol.2008.04.003
Hoekstra, R., Finch, S., Kiers, H. L., and Johnson, A. (2006). Probability as certainty: dichotomous thinking and the misuse of p values. Psychon. Bull. Rev. 13, 1033–1037. doi: 10.3758/BF03213921
Hofstede, G. H. (2001). Culture’s Consequences. Comparing Values, Behaviors, Institutions, and Organizations Across Nations, 2nd Edn. London: SAGE Publications.
Howell, D. C. (2010). Fundamental Statistics for the Behavioral Sciences. Belmont, CA: Wadsworth Publishing Company.
Hruschka, D. J., and Henrich, J. (2013). Institutions, parasites and the persistence of in-group preferences. PLoS ONE 8:e63642. doi: 10.1371/journal.pone.0063642
Isserlis, L. (1918). On the value of a mean as calculated from a sample. J. R. Stat. Soc. 81, 75–81. doi: 10.2307/2340569
Johnson, D. H. (1999). The insignificance of statistical significance testing. J. Wildlife Manag. 63, 763–772. doi: 10.2307/3802789
Kanazawa, S. (2006). IQ and the wealth of states. Intelligence 34, 593–600. doi: 10.1016/j.intell.2006.04.003
Lagacé, R. O. (1974). Nature and Use of the HRAF Files: a Research and Teaching Guide. New Haven, CT: Human Relations Areas Files, Inc.
Lagacé, R. O. (1979). The HRAF probability sample: retrospect and prospect. Cross Cult. Res. 14, 211–229. doi: 10.1177/106939717901400304
Lavrakas, P. J. (2008). Finite Population Correction (FPC) Factor. Encyclopedia of Survey Research Methods. London: Sage Publications. doi: 10.4135/9781412963947.n191
Letendre, K., Fincher, C. L., and Thornhill, R. (2010). Does infectious disease cause global variation in the frequency of intrastate armed conflict and civil war. Biol. Rev. 85, 669–683. doi: 10.1111/j.1469-185X.2010.00133.x
Levy, P. S. (2005). Finite Population Correction. Encyclopedia of Biostatistics. New York, NY: John Wiley and Sons, Ltd. doi: 10.1002/0470011815.b2a16024
Murdock, G. P., and White, D. R. (1969). Standard cross-cultural sample. Ethnology 8, 329–369. doi: 10.2307/3772907
Myers, A. (2009). Statistical Inference. The Concise Corsini Encyclopedia of Psychology and Behavioral Science. New York, NY: Wiley.
Naroll, R. (1967). The proposed HRAF probability sample. Cross Cult. Res. 2, 70–80. doi: 10.1177/106939716700200202
Spatz, C. (2007). Basic statistics: Tales of Distributions. Belmont, CA: Wadsworth Publishing Company.
Thornhill, R., and Fincher, C. L. (2011). Parasite stress promotes homicide and child maltreatment. Philos. Trans. R. Soc. B: Biol. Sci. 366, 3466–3477. doi: 10.1098/rstb.2011.0052
United Nations. (2013). What are Member States. Available online at: http://www.un.org/depts/dhl/unms/whatisms.shtml. [Retrieved: May 20, 2013].
U. S.Department of State. (2012). Independent States in the World. Available online at: http://www.state.gov/s/inr/rls/4250.htm. [Retrieved: May 20, 2013].
Wetzels, R., Matzke, D., Lee, M. D., Rouder, J. N., Iverson, G. J., and Wagenmakers, E.-J. (2011). Statistical evidence in experimental psychology an empirical comparison using 855 t-tests. Perspect. Psychol. Sci. 6, 291–298. doi: 10.1177/1745691611406923
Keywords: pathogen stress, cross-cultural correlation, inferential statistics, p-value, cross-cultural research
Citation: Pollet TV (2013) Much ado about p. What does a p-value mean when testing hypotheses with aggregated cross-cultural data in the field of evolution and human behavior? Front. Psychol. 4:734. doi: 10.3389/fpsyg.2013.00734
Received: 24 June 2013; Accepted: 22 September 2013;
Published online: 11 October 2013.
Edited by:
Axel Cleeremans, Université Libre de Bruxelles, BelgiumReviewed by:
Martin Fieder, University of Vienna, AustriaCopyright © 2013 Pollet. This is an open-access article distributed under the terms of the Creative Commons Attribution License (CC BY). The use, distribution or reproduction in other forums is permitted, provided the original author(s) or licensor are credited and that the original publication in this journal is cited, in accordance with accepted academic practice. No use, distribution or reproduction is permitted which does not comply with these terms.
*Correspondence:dC52LnBvbGxldEB2dS5ubA==