 Erik O'Hanlon
 Fiona N. Newell
 Kevin J. Mitchell
- 1School of Psychology and Institute of Neuroscience, Trinity College Dublin, Dublin, Ireland
- 2Smurfit Institute of Genetics and Institute of Neuroscience, Trinity College Dublin, Dublin, Ireland
Synaesthesia is a heritable condition in which particular stimuli generate specific and consistent sensory percepts or associations in another modality or processing stream. Functional neuroimaging studies have identified potential correlates of these experiences, including, in some but not all cases, the hyperactivation of visuotemporal areas and of parietal areas thought to be involved in perceptual binding. Structural studies have identified a similarly variable spectrum of differences between synaesthetes and controls. However, it remains unclear the extent to which these neural correlates reflect the synaesthetic experience itself or additional phenotypes associated with the condition. Here, we acquired both structural and functional neuroimaging data comparing thirteen grapheme-color synaesthetes with eleven non-synaesthetes. Using voxel-based morphometry and diffusion tensor imaging, we identify a number of clusters of increased volume of gray matter, of white matter or of increased fractional anisotropy in synaesthetes vs. controls. To assess the possible involvement of these areas in the synaesthetic experience, we used nine areas of increased gray matter volume as regions of interest in an fMRI experiment that characterized the contrast in response to stimuli which induced synaesthesia (i.e., letters) vs. those which did not (non-meaningful symbols). Four of these areas showed sensitivity to this contrast in synaesthetes but not controls. Unexpectedly, in two of them, in left lateral occipital cortex and in postcentral gyrus, the letter stimuli produced a strong negative BOLD signal in synaesthetes. An additional whole-brain fMRI analysis identified 14 areas, three of which were driven mainly by a negative BOLD response to letters in synaesthetes. Our findings suggest that cortical deactivations may be involved in the conscious experience of internally generated synaesthetic percepts.
Introduction
Synaesthesia is a heritable condition in which particular stimuli generate specific and consistent sensory percepts or associations in another modality or processing stream (Galton, 1883; Cytowic, 1989/2002; Baron-Cohen et al., 1993). Many different forms exist, including colored letters or words (grapheme- or linguistic-color synaesthesia), “colored hearing,” words to taste, tastes to shapes, music to color or shapes, the association of numbers or calendar units with spatial locations and many others (Rich and Mattingley, 2002; Ward, 2013). The condition is quite common, with between 1 and 4% of the population estimated to have the condition (Simner et al., 2006; Simner, 2012).
Though originally defined as a cross-sensory phenomenon, many cases involve cognitive or higher-level conceptual inducers and/or concurrents (Barnett et al., 2008a; Simner, 2012). Synaesthesia may thus, be better conceptualized as the association of additional attributes into the schema of the inducing object (Mitchell, 2011). The synaesthetic experience is characterized by conscious awareness of the concurrent, either as a vivid sensory percept—perceived externally (for “projector” synaesthetes) or “in the mind's eye”—or as an integral attribute brought to mind by the inducing stimulus (in the way that yellow is brought to mind by thinking of a banana) (for “associator” synaesthetes).
The mechanism driving these additional percepts or associations is unknown. In theory, it could involve cross-activation from a cortical area representing the inducing stimulus to one representing the concurrent percept or association. This cross-activation could be mediated by direct connections (Hubbard et al., 2005; Hubbard, 2007a) or indirectly, via an additional area or areas, possibly through feedback connections (Grossenbacher and Lovelace, 2001; Ward and Mattingley, 2006; Neufeld et al., 2012). Alternatively, the synaestheic experience could involve “hyper-binding” between cortical areas (Weiss and Fink, 2009; Van Leeuwen et al., 2010; Rouw et al., 2011), where some mechanism such as the synchronization of cortical oscillations drives the co-activation and thus, the mental association of patterns of activity representing the inducer and concurrent. While such synchronization may indeed be required it seems insufficient to explain the arbitrary, idiosyncratic, and stable nature of the synaesthetic associations—for example, for A to be bound to olive green, the representation of olive green would still have to be activated in the first place. An integrated model proposes that the synaesthetic experience may need both cross-activation and perceptual binding in order to engage frontal areas required for conscious awareness (Dehaene and Changeux, 2011; Hubbard et al., 2011).
A number of functional and structural neuroimaging experiments have been performed to try to define the neural correlates of synaesthetic experiences and to characterize structural differences associated with the condition. Functional magnetic resonance imaging (fMRI) and electroencephalography studies have provided some insights into the neural basis of synaesthesia but their findings are quite variable (Paulesu et al., 1995; Aleman et al., 2001; Nunn et al., 2002; Hubbard et al., 2005; Weiss et al., 2005; Gray et al., 2006; Rich et al., 2006; Sperling et al., 2006; Steven et al., 2006; Beeli et al., 2008; Barnett et al., 2008b; Goller et al., 2009; Brang et al., 2010). Many fMRI studies have found some anomalous activation of visual areas in response to the presentation of the “inducer”—either aurally presented sounds or visually presented achromatic graphemes. However, in addition to this major conclusion, equally remarkable is the variability of findings, even across studies that investigated the same form of (grapheme-color) synaesthesia. Several studies (Nunn et al., 2002; Hubbard et al., 2005; Sperling et al., 2006; Van Leeuwen et al., 2010) have found extra activation in the region of visual area V4, for example—a region involved in color perception (Lueck et al., 1989; Mckeefry and Zeki, 1997)—but others have not observed this and have seen activation or functional connectivity differences in other visual areas (Aleman et al., 2001; Rich et al., 2006) or in other areas, such as parietal cortex (Weiss et al., 2005; Van Leeuwen et al., 2010; Neufeld et al., 2012). Others have observed no additional activation correlating with the synaesthetic experience (Hupe et al., 2012). A positron emission tomography (PET) study also found, in addition to some areas of extra activation in colored-hearing synaesthetes, greater cortical deactivation in other areas in response to spoken words which induced a synaesthetic experience of color. These differential effects were induced selectively by words but not tones, in synaesthetes but not controls (Paulesu et al., 1995).
Phenotypic heterogeneity, including between “projector” and “associator” synaesthetes may explain some of the variation in these results (Hubbard et al., 2005; Rouw and Scholte, 2010). Nevertheless, a simple model of excess cross-activation between highly restricted cortical areas seems too minimal to accommodate all these findings. Rather, these findings suggest that differences in connectivity—either due to structural or functional changes—may be quite extensive in the brains of synaesthetes, a hypothesis which is supported by structural neuroimaging studies.
Several studies have identified structural differences in the brains of synaesthetes compared to controls (Rouw and Scholte, 2007, 2010; Hanggi et al., 2008; Jancke et al., 2009; Weiss and Fink, 2009; Banissy et al., 2012b). In almost all cases, synaesthetes showed greater volumes of areas of gray or white matter or greater fractional anisotropy (FA) within certain white matter tracts than controls [see Banissy et al. (2012b) for an exception]. Some of these differences are in the general region of visual areas thought to be involved in the synaesthetic experience but others are more widespread, in parietal or even frontal regions. A recent study analyzed global connectivity patterns in the brains of synaesthetes, using networks derived from correlations in cortical thickness (Hanggi et al., 2011). The global network topology was significantly different between synaesthetes and controls, with synaesthetes showing increased clustering, suggesting global hyperconnectivity. The differences driving these effects were widespread and not confined to areas hypothesized to be involved in the grapheme-color synaesthetic experience itself. Widespread functional connectivity differences have also been observed in a study using resting-state fMRI (Dovern et al., 2012).
Given the variability of functional imaging findings in synaesthesia, in particular the inconsistency of activation of specific visual areas such as V4, or indeed of any visual areas, we adopted an unbiased approach to look for differences in functional responses in synaesthetes vs. controls. We first carried out a whole-brain volumetric and diffusion tensor imaging (DTI) analysis to identify regions of structural differences between groups of synaesthetes and controls. We then used the clusters of gray matter difference as regions of interest for functional analyses, identifying differential sensitivity to the contrast between letters and non-meaningful characters in synaesthetes compared to controls. In parallel, we conducted a whole-brain functional analysis based on responses to visual stimuli that do or do not induce synaesthetic percepts between synaesthetes and non-synaesthete controls. Surprisingly, several of the functional differences we observe are driven by negative blood oxygen level-dependent (BOLD) response, reflecting unexpected cortical deactivations in this sample of synaesthetes in response to letters.
Methods
Participants
We recruited 24 right handed participants for our study through local and media advertising, and from the student population at Trinity College Dublin. All participants were female, with a mean age of 38.76 years, and an age range of between 20–58 years. This sample included 13 synaesthetes and 11 non-synaesthete controls and both groups were matched for age (mean ages of 38.1 years, SE = 3.6 and 37.1 years, SE = 4.2, for the synaesthete and non-synaesthete groups, respectively). Synaesthetes were identified by repeated testing for consistency of their letter-color associations over time. The details of the consistency tests used are described in Barnett et al. (2008a). None of our participants reported a history of neurological disorders or psychiatric diagnoses, substance abuse, or were treated at any time with psychiatric medications. All had normal or corrected-to-normal vision, and none reported any auditory deficits. The experimental protocol was approved by the School of Psychology Ethics Committee, Trinity College Dublin and all participants gave written informed consent to participate prior to the study.
MRI Scanning Parameters
Anatomical scanning protocol
All scanning was conducted on a Philips Achieva 3.0 T scanner, fitted with an eight channel head coil, equipped with a mirror that reflected the display projected on a 640 × 480 panel. This panel was placed behind the participant's head, outside the magnet. The mirror was mounted on the head coil in the participant's line of vision. 180 axial high-resolution T1-weighted anatomical Spoiled Gradient Echo (SPGR) images [Echo Time (TE) = 3.8 ms, Relaxation Time (TR) = 8.4 ms, Field Of View (FOV) = 230 mm, 162 mm, 0.898 × 0.898 mm2 in-plane resolution, slice thickness 0.9 mm, flip angle α = 8°] were acquired before the first functional imaging, to allow for subsequent activation localization and spatial normalization of fMRI data and for the purpose of Voxel Based Morphometry (VBM) analyses.
DTI scanning protocol
Diffusion weighted images were obtained using spin-echo, echo-planar imaging (SE EPI) pulse sequence (TE = 52 ms, TR = 11,260 ms, flip angle α = 90°, FOV = 224 mm, 149.7 mm). 60 axial slices were acquired with an in-plane resolution of 1.75 × 1.75 mm2, a slice thickness 2.5 mm, and a gap = 0.3 mm. Data with a b-value = 800 s mm−2 and 15 non-collinear gradient directions was collected. The start of each series of directions was preceded by the acquisition of a non-diffusion-weighted volume (b = 0) for the purpose of image registration and motion correction.
fMRI scanning protocol
The task was preceded by approximately 20 min of standard scout images, (including shimming to reduce the EPI image artifacts), and SPGR structural acquisitions. Thirty-two, non-contiguous (10% gap) 3.5 mm axial slices covering the entire brain were collected using a T2* weighted echo-planar imaging sequence (TE = 35 ms, TR = 2000 ms, flip angle α = 90°, FOV = 224 mm, 122.85 mm, 64 × 64 matrix size, 1.75 × 1.75 mm2 in-plane resolution). Imaging used a parallel SENSitivity Encoding (SENSE) approach with a reduction factor = 2.
MRI Data Analysis Protocols
Image pre-processing
The MR images were collected in Philips PAR and REC format and were converted to NIFTI file format for the purposes of VBM and diffusion tensor image analyses including tractography. Data acquired for the purpose of functional MRI analysis was converted to AFNI HEAD and BRIK file format and analyzed using the AFNI software tools (http://afni.nimh.nih.gov).
Whole-brain structural analysis using FSL-VBM
To investigate possible structural brain differences between synaesthetes and non-synaesthetes a voxel-wise whole brain “optimized” VBM-style analysis was performed using FMRIB FSL VBM tools (Smith et al., 2004). VBM is a voxel-wise automated analysis technique performed on high resolution structural images to investigate differences in local concentrations or volumes (with the inclusion of a modulation step) of gray and white matter [see Ashburner and Friston (2000); Good et al. (2001) for detailed descriptions of the standard and optimized VBM methods]. Briefly, structural images were brain-extracted using BET (Smith, 2002) and segmented before being registered to the MNI 152 standard space using non-linear registration (Andersson et al., 2007b). The resulting images were averaged and flipped along the x-axis to create a left-right symmetric, study-specific gray matter, white matter, and cerebrospinal fluid templates. Second, all native gray and white matter images were non-linearly registered to these study-specific templates and “modulated” to correct for local expansion (or contraction) due to the non-linear component of the spatial transformation. The modulated gray and white matter images were then smoothed with an isotropic Gaussian kernel with a sigma of 2.5 mm (5.75 FWHM).
VBM statistical analysis
MRICron was used for the purpose of voxelwise non-parametric statistical tests featuring Brunner Munzel tests for the purpose of group comparisons and correction for multiple comparisons using False Discovery Rate (FDR). These were conducted for the purpose of group comparisons and the identification of global gray and white matter volume differences. Significant voxels passed a voxelwise statistical FDR threshold of p = 0.01 corrected and a minimum cluster size threshhold of 10 mm3.
Whole-brain DTI white matter analysis using FSL
Data analysis was performed with FSL. Pre-processing featured eddy current and movement correction. Voxelwise statistical analysis of the FA data was carried out using (TBSS) Tract-Based Spatial Statistics, (Smith et al., 2006), which is part of FSL (Smith et al., 2004). First, FA images were created by fitting a tensor model to the raw diffusion data using FDT, and then brain-extracted using BET (Smith, 2002). All participants' FA data were then aligned into a common space using the non-linear registration tool FNIRT (Andersson et al., 2007a,b), which uses a b-spline representation of the registration warp field (Rueckert et al., 1999). Next, the mean FA image was created and thinned to create a mean FA skeleton, which represents the centers of all tracts common to the group. Each participant's aligned FA data was then projected onto this skeleton and the resulting data fed into voxelwise, cross-subject statistics.
DTI statistical analysis
MRICron was used for the purpose of voxelwise non-parametric statistical tests featuring Brunner Munzel tests for the purpose of group comparisons and correction for multiple comparisons using FDR. Significant voxels passed a voxelwise statistical threshold of p ≤ 0.01 with a cluster size criterion based on the skeletonized images of 5 mm3.
Structure/function region of interest (ROI) anlayses (GM VBM-derived).
The gray matter VBM results, (ROIs), showing significant volume differences between synaesthetes and non synaesthete controls were used as mask regions and applied to the functional MRI activation measures for each of the four independent fMRI stimulus conditions (color, achromatic, letter and non meaningful character). Separate 2 × 2 mixed ANOVAs were conducted based on responses to each of the stimulus conditions (either letters vs. non-letters or colors vs. achromatic) with group (synaesthetes or controls) as a between-subjects factor and each of the stimulus conditions as within-subjects factors to examine a main effect for group, for condition and possible group × stimulus condition interactions. Post-hoc analyses were carried out to determine the directions of any effects using IBM SPSS version 19 statistical software.
Experimental Design for fMRI Test
Two independent functional MRI tasks were employed to assess the BOLD response to chromatic or achromatic check patterns and graphemes which were meaningful or “non-meaningful” letters. Our grapheme stimulus set were adopted from those previously described by Pesenti et al. (2000). Stimulus presentations were projected onto a viewing screen behind the magnet bore and viewed by the participants via a mirror attached to the head coil, The fMRI sessions consisted of two conditions, namely the Color Images session and the Grapheme Images session. Each session featured two runs of 15 blocks (each block lasting 30 s) with each run containing equal quantities of three conditions, namely rest, chromatic check patterns and achromatic check patterns and rest, letters and non-meaningful characters, respectively. The presentation order of the condition blocks was pseudo randomized across participants. The images were presented at a rate of 0.5 Hz and alternated with a gray background image to reduce after-image effects (Figures 1, 2). Each gray background image for both inter-stimulus and rest condition blocks featured a fixation cross at the center, upon which the participant was instructed to gaze.
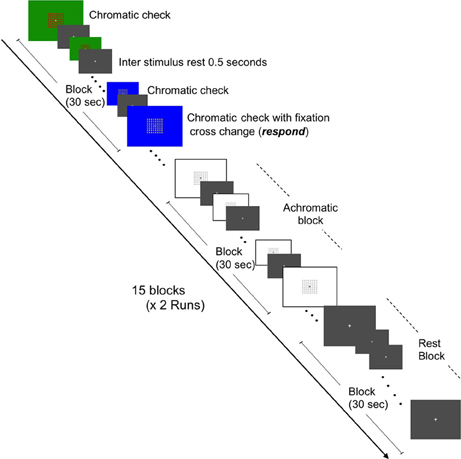
Figure 1. Schematic representation of fMRI task for brain activation in response to chromatic check patterns and color localization. Representations of the three conditions (chromatic, achromatic, and rest states) are depicted. Two runs (7 min and 30 s each) containing 15 blocks (30 s in duration) and consisting of equal amounts of each condition, i.e., five blocks of each condition per run were constructed.
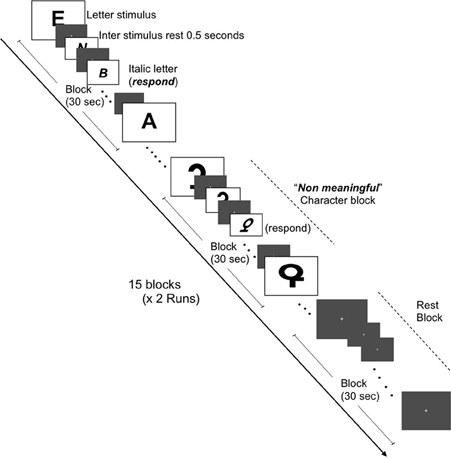
Figure 2. Schematic of fMRI task for brain activation in response to meaningful letters and non-meaningful characters. Representations of the three conditions (letters, non-meaningful characters, and rest states) are depicted. Two runs (7 min and 30 s each) containing 15 blocks (30 s in duration) and consisting of equal amounts of each condition, i.e., five blocks of each condition per run were constructed.
Color images session
BOLD activations were acquired whilst the participant viewed chromatic and achromatic check pattern stimuli. The chromatic blocks consisted of images of check patterns, viewed in either red/green or blue/yellow combinations. Each check pattern featured a fixation cross at the center, upon which the participant was instructed to gaze. In order to ensure the participant viewed the center of the images, they were instructed to respond whenever a change occurred to the shape of the fixation cross (i.e., from the normal cross to a star shape). Participants responded via a button-press response mechanism was utilized to avoid head motion associated with verbal responses. The change in fixation cross occurred at a rate of four times per block in a pseudo random order used to avoid predictability.
Grapheme images session
Changes in BOLD activations were acquired whilst the participants viewed images of graphemes (meaningful letters and non-meaningful characters which shared many of the same visual features as the meaningful letters). As before in the color stimulus presentations, each gray background image for both inter-stimulus and rest condition blocks featured a fixation cross at the center, upon which the participant was instructed to gaze. Participants were required to respond when the letters or non-meaningful characters appeared in an “italic” font format. The change in letter font occurred at a rate of four times per block in a pseudo random presentation to avoid predictability.
fMRI Data Analysis
The fMRI data were analyzed using the AFNI software tools (http://afni.nimh.nih.gov) (Cox, 1996). Following image reconstruction, both runs for each session, (i.e., color and grapheme stimuli) were concatenated and motion corrected using 3-D volume registration (least-squares alignment of three translational and three rotational parameters). Noise related artifacts outside the brain were also removed using edge detection techniques.
A block analysis was performed to estimate the activation for the chromatic and achromatic conditions (for the color task) and for the letters and non-meaningful characters conditions (for the grapheme task) separately. The on–off block regressors were convolved with a standard haemodynamic response to accommodate the lag time of the BOLD response. Multiple regression analyses were then used to determine the average level of BOLD activation relative to the rest state periods (baseline). The baseline activations were also derived by averaging the rest periods in each block over both runs for each separate task.
The percentage change map (block activation) voxels were resampled to 1 × 1 × 1 mm voxel resolution, aligned to their T1 anatomy image and then warped into Talairach standard space and spatially blurred with a 3-mm isotropic rms Gaussian kernel.
fMRI “whole-brain” voxelwise analysis
Separate whole-brain voxelwise analyses, based on each of the stimulus conditions (i.e., color/achromatic and letter/character contrasts) were conducted based on a Two-Way mixed ANOVA with group as the between-subject factor and stimulus condition as the within-subject factor. Each 2 × 2 ANOVA was used to assess for main effects of group (synaesthete or controls), or stimulus condition (color/achromatic or letters/characters) and for any Group × Condition interactions. Significant voxels passed a voxelwise statistical threshold (t = 17.19, p < 0.0005, N = 22) and were required to be part of a minimum cluster of 134 mm3 of contintiguous significant voxels. Thresholding was determined through 5000 Monte Carlo simulations and resulted in a 1% probability of a cluster surviving due to chance, fully corrected for multiple corrections. Resultant thresholded cluster maps were examined through post-hoc statistical analysis using a cluster based ROI approach to determine the effect of each condition per significant region of interest. This entailed extracting the mean activation levels for each task condition per cluster and conducting between group t-tests per condition. These values were then extracted to SPSS for the purposes of cluster-level statistical analysis and featured Bonferroni correction at P = 0.05. In the case of the color/achromatic contrast, the thresholded maps were inspected to ensure activation of color selective regions in response to task stimuli at a threshold of p = 0.05 corrected using the same method described above (t = 18.68, p < 0.005, N = 22).
Results
Whole Brain Analyses
Gray matter volume comparison
Gray matter volumetric analysis results are presented in Table 1. The non-parametric FDR t-test (p ≤ 0.01 and a minimum cluster size criteria of 10 mm3) revealed nine regions of increased gray matter volume in synaesthetes relative to controls (see Figure 3 and Table 1). These regions included bilateral cerebellum, left lateral occipital cortex including the precuneus, the left lateral occipital cortex/fusiform gyrus, bilateral occipital cortex/fusiform gyrus, right lingual gyrus, the right posterior division of the post-central gyrus and the right post-central/pre-central gyrus. No clusters showed a greater volume in controls.
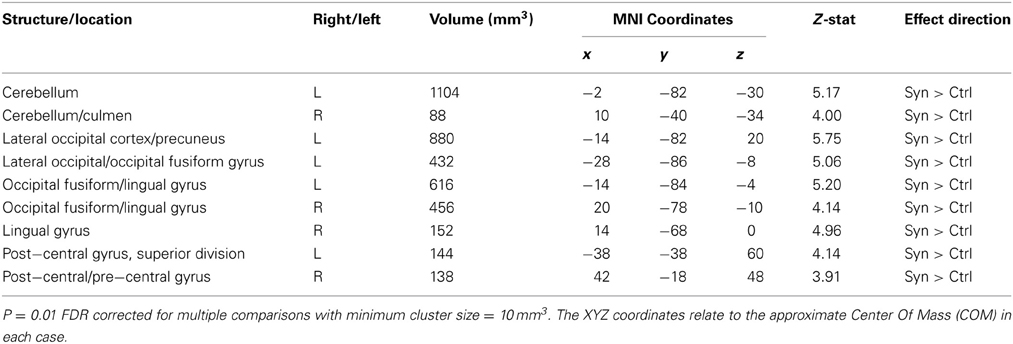
Table 1. Gray matter volume difference (whole brain VBM analysis).
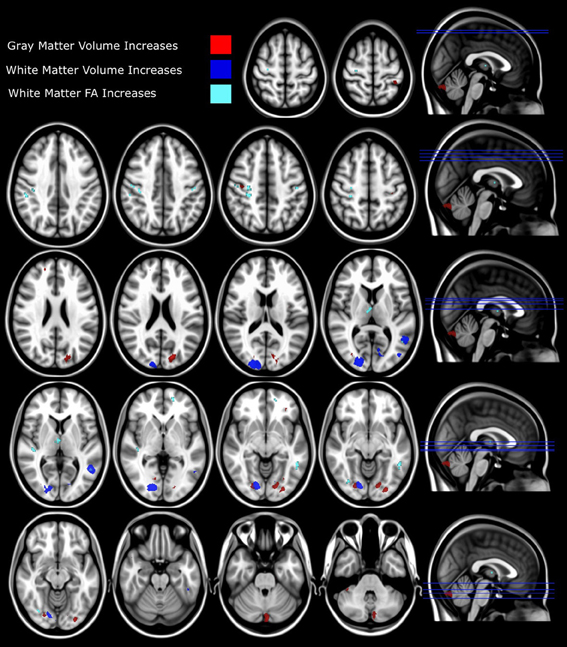
Figure 3. Structural differences between synaesthetes and non-synaesthete controls. Whole brain VBM analysis results are shown with significant between-group differences (p = 0.01 FDR corrected) for gray matter shown in red (refer to Table 1) and white matter (p = 0.01 FDR corrected) shown in blue (refer to Table 2). The slice location of each volumetric difference is indicated on the right hand side of the image. In addition, significant between-group differences from the whole-brain DTI TBSS FA analysis (p = 0.05 FDR corrected) are also shown in cyan (refer to Table 3). For all measures (GM, WM, and FA), the effect direction for the significant between-group differences identified was: synaesthetes > non-synaesthete controls. All significant clusters of between-group differences are overlaid on the standard MNI 152 T1 image provided within the FSL toolbox.
White matter volume comparison
White matter volumetric analysis results are presented in Table 2. FDR statistical comparisons (p = 0.01 with a minimum cluster criteria of 10 mm3) revealed six regions of white matter volume increases in synaesthetes compared to controls (see Figure 3 and Table 2). Similar to the gray matter differences, the white matter volume differences again showed increased volumes in the synaesthetes relative to controls and featured the right occiptal pole including the precuneus, left middle occiptal gyrus, left temporal gyrus, left temporal/fusiform gyrus and bilateral lingual gyrus. No clusters showed a greater volume in controls.
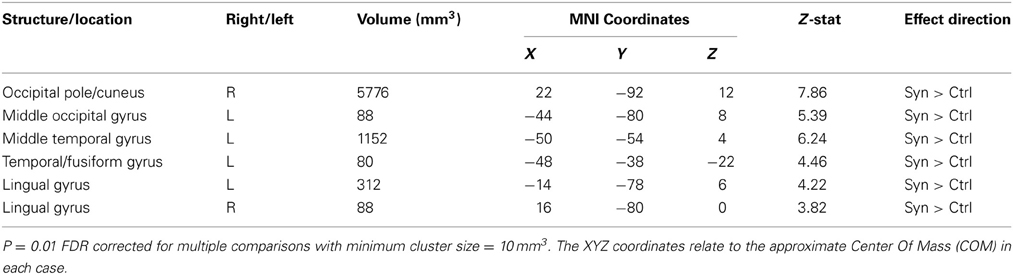
Table 2. White matter volume difference (whole brain VBM analysis).
White matter FA comparison
Whole brain white matter FA was examined and 14 clusters showed significantly increased FA in synaesthetes compared to controls (presented with the GM and WM clusters in Figure 3 and by themselves on a skeletonized framework of axonal tracts in Supplemental Figure 1. See also Table 3). Three regions of increased FA were identified along the right superior longitudinal fasiculus and included parietal/subgyral and supramarginal areas. Two clusters of increased FA were identified along the right inferior longitudinal fasiculus featuring the insula and fronto-occipital and lingual gyrus. The right thalamus showed two clusters of increased FA along the anterior thalamic radiation. There were no clusters showing increased FA in controls compared to synaesthetes.
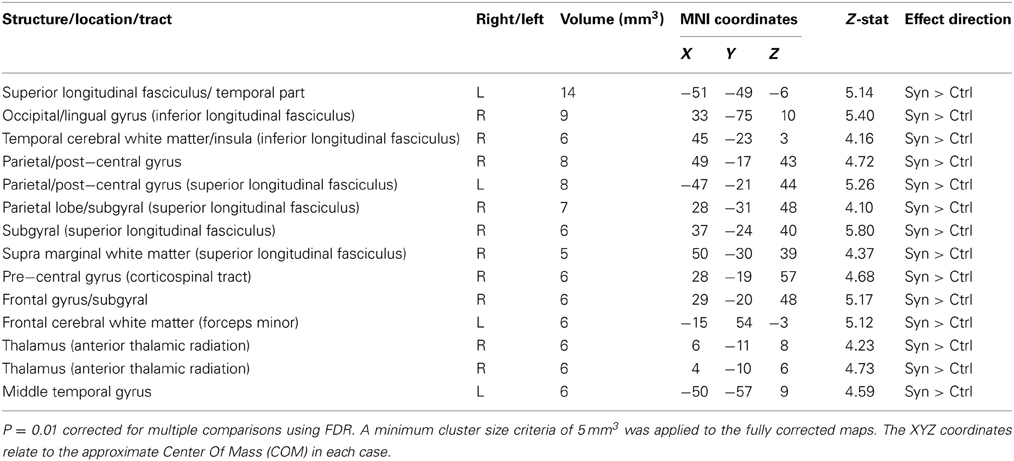
Table 3. White matter fractional anisotropy FA (whole brain analysis).
fMRI region of interest analysis featuring GM VBM clusters
Using the nine GM VBM clusters, the mean activation levels for each of the fMRI conditions were extracted for the purpose of an ROI analysis to investigate the functional response to the letter/non-meaningful character stimuli at each of these cluster locations. The values were entered into a 2 × 2 ANOVA in SPSS [with group as the between-group measure and condition (letter, non-meaningful characters) as the within-group measure]. The ANOVA did not identify any regions with a significant main effect for either group or condition. Four of the nine clusters showed a significant group × condition interaction for the letter/non-meaningful characters contrast (see Table 4 and Figure 4). Bonferroni correction for multiple testing divides the p-value significance cut-off (<0.05) by the number of tests (9 in this case), to generate a corrected significance value for any single test of 0.0056. None of the single clusters pass this corrected significance threshold. However, this only corrects for any one test showing a significant result at p < 0.05. The binomial distribution can be used to calculate the likelihood of seeing × out of nine tests being significant at p < 0.05, by chance. While the chance of seeing at least 1/9 tests significant at this level is quite high (0.37), the chance of seeing 4/9 tests significant by chance is very low (0.0006). The overall pattern of effects observed is thus highly significant.
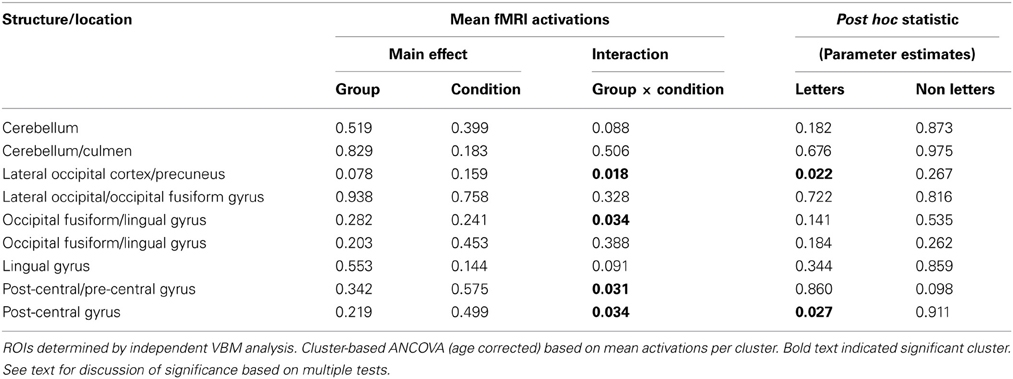
Table 4. ROI analysis for fMRI conditions using gray matter VBM defined clusters.
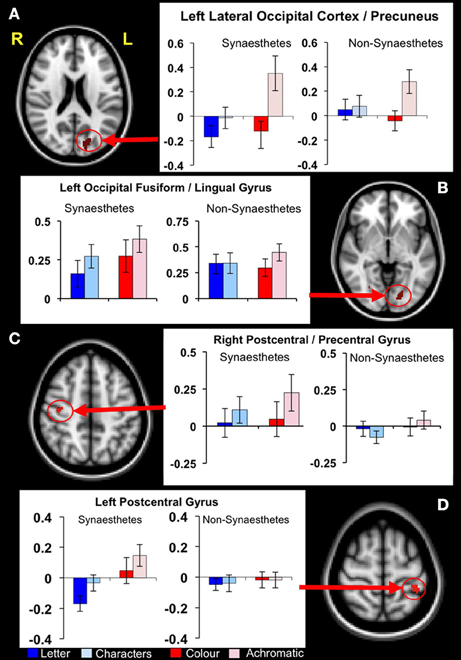
Figure 4. Functional differences in structurally defined regions of interest. Four clusters of significantly increased GM volume in synaestehetes showed a significant group × condition interaction for the letter/non-meaningful characters contrast. Mean fMRI task activations within these ROIs are detailed for each task condition (letter/character and color/achromatic) in synaesthetes and controls. Two clusters, in left lateral occipital cortex/precuneus panel (A) and in left post-central gyrus panel (D) show a main group effect in response to letters (blue bars). These differences are driven by a strong negative BOLD response to letters in synaesthetes. The other two clusters, in left occipital fusiform/lingual gyrus (B) and right postcentral/precentral gyrus (C) did not show a main group effect for letters.
Post hoc statistical analyses were used to investigate condition-specific group comparisons. Post hoc parameter estimates (letter and non meaningful character conditions) identified two clusters where a greater response for the “letter” condition was found in the synaesthete group, namely the left lateral occipital cortex/precuneus and the right post-central/pre-central gyrus. In both clusters the mean activation levels revealed significantly greater negative BOLD response to letters in synaesthetes compared to controls (Figure 4).
fMRI “whole-brain” voxelwise analyses
To determine whether any other brain areas showed a similar response to letters, or, alternatively, showed the more expected positive BOLD increase, we performed voxelwise whole-brain analyses, looking again for regions showing differential responsiveness to letters vs. non-meaningful characters, in synaesthetes compared to controls. A mixed, 2 × 2 ANOVA using matched samples revealed 14 significant areas showing a group × condition interaction, fully corrected for multiple corrections at a threshold of P = 0.01 as detailed in the methods above. Post hoc cluster based statistical analyses were carried out to determine the direction of responses driving these group × condition interaction effects. None of these areas showed increased responsiveness to letters vs. characters in synaesthetes but not controls. Three showed a main effect group difference in the response to letters, with synaesthetes having a lower and negative average BOLD response in all three (Table 5). These clusters are in the left and right inferior parietal lobules and the left transverse temporal gyrus (Figure 5). These regions did not overlap the previously defined clusters of increased gray matter volume.
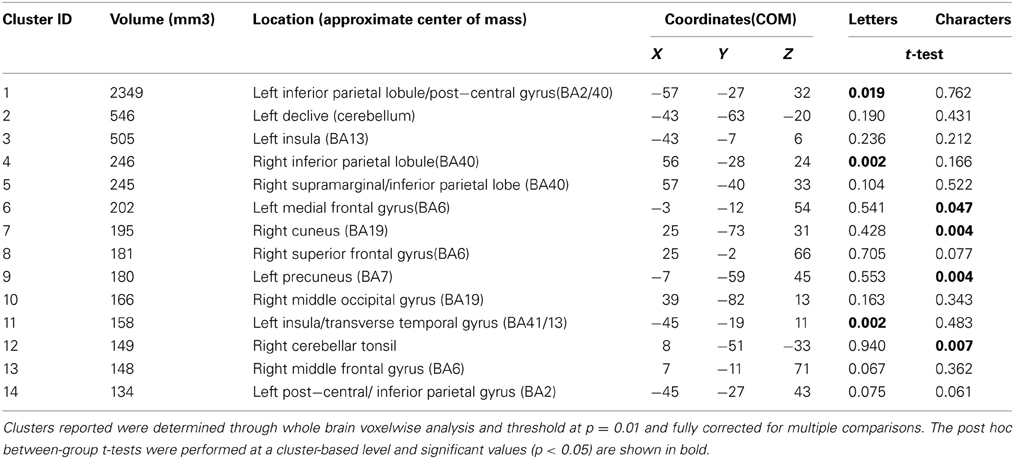
Table 5. Voxelwise ANOVA—Group × Condition Interaction (letters/characters).
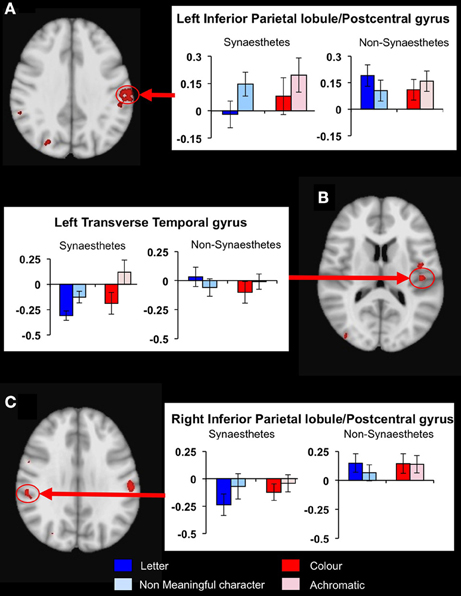
Figure 5. Results from the whole-brain voxelwise ANOVA for the letter/non-meaningful character contrast. Three clusters showed a significant group x condition interaction and a main group effect in response to letters. Mean fMRI task activations within these clusters are detailed for each task condition (letter/character and color/achromatic) in synaesthetes and controls. In each case, synaesthetes show a mean negative BOLD response to letters. (A) Left inferior parietal lobule/post-central gyrus; (B) left transverse temporal gyrus; (C) right inferior parietal lobule/post-central gyrus.
Discussion
Several studies have now looked for structural differences in the brains of synaesthetes, using various modalities, with results that show general consistencies but that vary considerably in the details (Rouw and Scholte, 2007, 2010; Hanggi et al., 2008, 2011; Jancke et al., 2009; Weiss and Fink, 2009; Hupe et al., 2012; Zamm et al., 2013). One general point of agreement is that almost all the structural differences observed between synaesthetes and controls, across all studies—whether in cortical thickness, surface area, volume of gray or white matter clusters or FA of white matter—are increases in synaesthetes (Rouw et al., 2011; Hupe et al., 2012; Zamm et al., 2013); [see Banissy et al. (2012b) for an exception, where decreases as well as increases were observed]. This is also true in our study and argues strongly for the validity and generality of these findings on the basis that random differences would be expected to be observed in both directions.
The other trend that is evident across these studies is that though the observed structural differences are concentrated in occipital regions, they are also observed in temporal, parietal, and frontal areas and have even been reported in hippocampus, cerebellum, and thalamus. We see a similar distribution with structural volumetric differences observed most prominently in occipital and temporal areas (including cuneus, lateral occipital cortex, fusiform and lingual gyri), as well as post-central/pre-central gyrus and cerebellum and FA differences apparent in occipital, but also parietal areas and even in thalamic radiations. Though the overall pattern is fairly consistent, no particular locations emerge as a general finding across all these studies.
While the details may vary, the primary picture is quite consistent: synaesthetes strongly tend to show greater gray and white matter volume and greater FA in many regions of the brain. We and others have previously argued that these data provide evidence for a structural difference as the primary cause of synaesthesia (Hubbard, 2007b; Rouw and Scholte, 2007; Bargary and Mitchell, 2008). While these findings are clearly consistent with that model, it has been rightly pointed out that structural differences could of course alternatively arise secondarily due to altered activity patterns in particular brain regions and circuits (Cohen Kadosh and Walsh, 2008). The structural findings thus do not yet lay to rest the question of whether the primary alteration in synaesthesia is anatomical or neurochemical (Grossenbacher and Lovelace, 2001; Ramachandran and Hubbard, 2001; Ward et al., 2006; Hubbard, 2007a; Bargary and Mitchell, 2008).
The fact that the structural differences are quite widespread is consistent with the view that the synaesthetic experience may be just one manifestation of a wider profile of differences between synaesthetes and non-synaesthetes (Bargary and Mitchell, 2008; Barnett et al., 2008a; Hanggi et al., 2011; Dovern et al., 2012). A variety of additional evidence supports this hypothesis. First, different types of synaesthesia can co-occur in individuals (Ward and Simner, 2005; Asher et al., 2009) or in different members of the same family (Barnett et al., 2008a). This led us to propose that an individual genetic mutation may either probabilistically affect wiring across the brain, giving a distinct profile in each individual, or may cause initially widespread differences in wiring, which could be resolved differently in different individuals through experience-dependent processes (Barnett et al., 2008a). Second, several studies have found differences in more general psychological characteristics between synaesthetes and controls, including mental imagery (Barnett and Newell, 2008), sensory sensitivity (Banissy et al., 2009) and significantly higher scores on positive and disorganized schizotypy (Banissy et al., 2012a). Third, we and others have detected differences in very early stages of sensory processing in visual and auditory evoked potentials (Beeli et al., 2008; Barnett et al., 2008b; Goller et al., 2009; Jancke et al., 2012), apparently independent of synaesthetic cross-activation per se. Finally, synaesthetes showed widespread differences in global network topology based on cortical thickness correlations (Hanggi et al., 2011) or on functional connectivity measures (Dovern et al., 2012), which were not confined to areas hypothesized to be involved in the grapheme-color synaesthetic experience itself.
To attempt to address whether the areas of structural differences are involved in the synaesthetic experience per se, we used the clusters of increased gray matter volume as regions of interest in an fMRI experiment. The goal was to identify regions showing differential responsiveness to letters vs. non-meaningful characters, in synaesthetes but not in controls. Our expectation was that any such differences would be caused by an increased response specifically to letters in synaesthetes, reflecting the supposed “extra activation” associated with the concurrent percept. To our surprise, the areas that did show a difference showed the opposite effect—the response to letters in synaesthetes was not just lower than to meaningless characters (and also lower than in controls), it was negative in sign. This is calculated relative to the baseline activity in the individual voxels of each cluster over the course of the experiment. It is thus not an artifact of averaging across the whole brain. As a control, we examined whole-brain responses to colors and achromatic stimuli to ensure that we could detect an expected positive BOLD response to this contrast in our experiment. We did indeed detect such a signal in the generally expected regions of ventral occipitotemporal cortex (Lueck et al., 1989; Mckeefry and Zeki, 1997; Brouwer and Heeger, 2009) (as well as a number of other regions) in both synaesthetes and controls (Table 6 and Supplementary Figure 2).
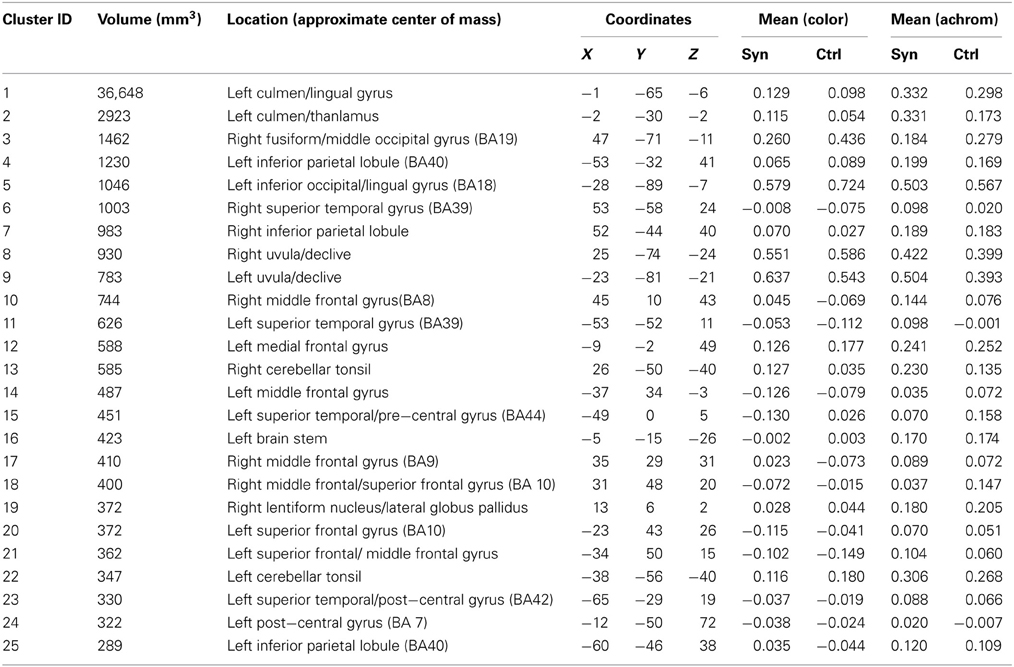
Table 6. Voxelwise ANOVA main effect for condition (color/achromatic) P = 0.05 corrected.
Our whole-brain analyses also revealed several areas showing a negative BOLD response to letters, but not characters, in synaesthetes, but not controls. No areas showed a similarly selective greater positive BOLD response to letters in synaesthetes. The lack of positive BOLD signals reflecting the synaesthetic experience is similar to the results of Hupe et al. (2012) and reflects the general variability in fMRI findings where such signals are not reliably found in any specific brain region (Rouw et al., 2011). The negative BOLD signals should be interpreted with caution, given that these findings were unexpected, arose in a modest sample size, and differ from most previous reports.
Nevertheless, the observation of negative BOLD signals is congruent with an early PET imaging study of auditory-color synaesthesia that also reported cortical deactivations, in addition to activations, in synaesthetes but not controls, in response to stimuli inducing synaesthesia (Paulesu et al., 1995). It would be interesting to know whether previous fMRI studies of synaesthesia did not report negative BOLD signals because they did not arise or because they were not detected due to differences in experimental design (such as focus on specific regions of interest) or analysis methods.
With the caveat that the generalizability of these findings will have to be confirmed in future studies, it is interesting to speculate on what they might mean. Negative BOLD is associated with decreased neuronal activity (Shmuel et al., 2006; Pasley et al., 2007; Wade and Rowland, 2010; Keller et al., 2013) and increased GABA concentrations (Northoff et al., 2007) and thus seems to reflect true deactivation or inhibition, as opposed to physiological artifacts such as blood stealing by nearby active areas. The induction of negative BOLD in the somatosensory cortex ipsilateral to a peripheral stimulus correlates with a reduction in perceptual sensitivity of the non-stimulated hand (Kastrup et al., 2008), reflecting neuronal hyperpolarization and increased inhibition (Devor et al., 2007). The physiological importance of such mechanisms is supported by their involvement in somatosensory habituation (Klingner et al., 2012) and implication in the enhancement of contrast between stimulated regions of visual cortex and surrounding regions with adjacent receptive fields (Wade and Rowland, 2010). In the latter case, active long-range suppressive mechanisms have been invoked to explain the emergence of negative BOLD signals.
One possible, though speculative, explanation for these observations relates to the fact that the synaesthetic percept or association is internally generated and often reported as being “in the mind's eye.” A number of studies have shown that generation of an internal sensory representation induces deactivation of regions which might compete for attention or provide conflicting information. For example, visual imagery induces negative BOLD in auditory cortex (Amedi et al., 2005), verbal memory induces deactivation across auditory and visual cortices (Azulay et al., 2009) and imagery of visual motion induces deactivation of early visual cortices (V1-3) (Kaas et al., 2010). Amedi and colleagues found a strong correlation across subjects between the deactivation of auditory cortex during visual mental imagery and their score on the vividness of visual imagery questionnaire (VVIQ). We have previously reported that synaesthetes tend to score higher on this imagery measure (Barnett and Newell, 2008). This is not to suggest that the synaesthetic percepts arise from the same processes as mental imagery per se—there is evidence from functional imaging that this is not the case (Rich et al., 2006; Steven et al., 2006). But it is possible that the vividness of a mental image and of a synaesthetic percept both rely on deactivation of other areas.
Such a conclusion is supported by findings from a transcranial direct current stimulation (tCDS) study. Terhune and colleagues found that synaesthetes showed enhanced cortical excitability of primary visual cortex, with a 3-fold lower phosphene detection threshold in response to activation by tCDS (Terhune et al., 2011). They tested whether this hyperexcitability of primary cortex could be either a contributing source to the generation of the synaesthetic percept, or, alternatively, a competing signal, which would interfere with the conscious perception of the synaesthetic percept. They show strong evidence that the latter is the case—stimulation or inhibition of primary visual cortical activity diminished or enhanced, respectively, the synaesthetic experience, based on both self-reports and behavioral interference measures. It thus seems plausible that the cortical deactivations we observe in response to stimuli that induce the synaesthetic experience could be an important part of that response, possibly involved in reducing the signals of competing percepts and allowing the internally generated synaesthetic percept to reach conscious awareness. Future experiments will be required to determine whether such deactivations are indeed a replicable finding and what their functional roles may be.
Conflict of Interest Statement
The authors declare that the research was conducted in the absence of any commercial or financial relationships that could be construed as a potential conflict of interest.
Acknowledgments
We are deeply grateful to Kylie Barnett and Hugh Garavan for their invaluable input into the design of these experiments. We would like to thank Danuta Lisiecka for excellent technical support. We are grateful to Edward Hubbard for providing the non-meaningful character symbols. This work was supported in part by grant HRB RP/2004/191 from the Health Research Board of Ireland to Kevin J. Mitchell and Fiona N. Newell (principal investigators) and by the Higher Education Authority grant (PRTLI grant, cycle 3) awarded to Fiona N. Newell as a member of Trinity College Institute of Neuroscience. We would also like to acknowledge the Trinity College High Performance Computer facilities for computational support.
Supplementary Material
The Supplementary Material for this article can be found online at: http://www.frontiersin.org/journal/10.3389/fpsyg.2013.00755/abstract
Supplemental Figure 1 | Results for the TBSS whole brain skeletonized white matter analysis showing significant between-group increases in synaesthetes compared to non-synaesthete controls (p = 0.01 FDR corrected). The significant clusters of FA difference are enhanced for visualization purposes using standard FSL TBSS visualization tools and are shown on the typical mean white matter skeleton image on the MNI 152 TI image within FSL. The slice locations for significant clusters are in shown in blue on the right of the image.
Supplemental Figure 2 | Responses to color/achromatic contrast. Two cortical clusters, in (A) right fusiform/middle occipital gyrus and (B) left inferior occipital/lingual gyri, show increased positive BOLD responses to colored compared to achromatic stimuli, in both synaesthetes and controls.
Abbreviations
DTI, diffusion tensor imaging; FA, fractional anisotropy; GM, gray matter; VBM, voxel based morphometry; WM, white matter.
References
Aleman, A., Rutten, G. J., Sitskoorn, M. M., Dautzenberg, G., and Ramsey, N. F. (2001). Activation of striate cortex in the absence of visual stimulation: an fMRI study of synesthesia. Neuroreport 12, 2827–2830. doi: 10.1097/00001756-200109170-00015
Amedi, A., Malach, R., and Pascual-Leone, A. (2005). Negative BOLD differentiates visual imagery and perception. Neuron 48, 859–872. doi: 10.1016/j.neuron.2005.10.032
Andersson, J. L. R., Jenkinson, M., and Smith, S. (2007a). Non-Linear Optimisation. FMRIB Technical Report TR07JA1. Available online at: http://www.fmrib.ox.ac.uk/analysis/techrep
Andersson, J. L. R., Jenkinson, M., and Smith, S. (2007b). Non-Linear Registration, Aka Spatial Normalisation. FMRIB Technical Report TR07JA2. Available online at: http://www.fmrib.ox.ac.uk/analysis/techrep
Ashburner, J., and Friston, K. J. (2000). Voxel-based morphometry–the methods. Neuroimage 11, 805–821. doi: 10.1006/nimg.2000.0582
Asher, J. E., Lamb, J. A., Brocklebank, D., Cazier, J. B., Maestrini, E., Addis, L., et al. (2009). A whole-genome scan and fine-mapping linkage study of auditory-visual synesthesia reveals evidence of linkage to chromosomes 2q24, 5q33, 6p12, and 12p12. Am. J. Hum. Genet. 84, 279–285. doi: 10.1016/j.ajhg.2009.01.012
Azulay, H., Striem, E., and Amedi, A. (2009). Negative BOLD in sensory cortices during verbal memory: a component in generating internal representations? Brain Topogr. 21, 221–231. doi: 10.1007/s10548-009-0089-2
Banissy, M., Cassell, J., Fitzpatrick, S., Ward, J., Walsh, V., and Muggleton, N. (2012a). Increased positive and disorganised schizotypy in synaesthetes who experience colour from letters and tones. Cortex 48, 1085–1087. doi: 10.1016/j.cortex.2011.06.009
Banissy, M. J., Stewart, L., Muggleton, N. G., Griffiths, T. D., Walsh, V. Y., Ward, J., et al. (2012b). Grapheme-color and tone-color synesthesia is associated with structural brain changes in visual regions implicated in color, form, and motion. Cogn. Neurosci. 3, 29–35. doi: 10.1080/17588928.2011.594499
Banissy, M. J., Walsh, V., and Ward, J. (2009). Enhanced sensory perception in synaesthesia. Exp. Brain Res. 196, 565–571. doi: 10.1007/s00221-009-1888-0
Bargary, G., and Mitchell, K. J. (2008). Synaesthesia and cortical connectivity. Trends Neurosci. 31, 335–342. doi: 10.1016/j.tins.2008.03.007
Barnett, K. J., Finucane, C., Asher, J. E., Bargary, G., Corvin, A. P., Newell, F. N., et al. (2008a). Familial patterns and the origins of individual differences in synaesthesia. Cognition 106, 871–893. doi: 10.1016/j.cognition.2007.05.003
Barnett, K. J., Foxe, J. J., Molholm, S., Kelly, S. P., Shalgi, S., Mitchell, K. J., et al. (2008b). Differences in early sensory-perceptual processing in synesthesia: a visual evoked potential study. Neuroimage 43, 605–613. doi: 10.1016/j.neuroimage.2008.07.028
Barnett, K. J., and Newell, F. N. (2008). Synaesthesia is associated with enhanced, self-rated visual imagery. Conscious. Cogn. 17, 1032–1039. doi: 10.1016/j.concog.2007.05.011
Baron-Cohen, S., Harrison, J., Goldstein, L. H., and Wyke, M. (1993). Coloured speech perception: is synaesthesia what happens when modularity breaks down? Perception 22, 419–426. doi: 10.1068/p220419
Beeli, G., Esslen, M., and Jancke, L. (2008). Time course of neural activity correlated with colored-hearing synesthesia. Cereb. Cortex 18, 379–385. doi: 10.1093/cercor/bhm072
Brang, D., Hubbard, E. M., Coulson, S., Huang, M., and Ramachandran, V. S. (2010). Magnetoencephalography reveals early activation of V4 in grapheme-color synesthesia. Neuroimage 53, 268–274. doi: 10.1016/j.neuroimage.2010.06.008
Brouwer, G. J., and Heeger, D. J. (2009). Decoding and reconstructing color from responses in human visual cortex. J. Neurosci. 29, 13992–14003. doi: 10.1523/JNEUROSCI.3577-09.2009
Cohen Kadosh, R., and Walsh, V. (2008). Synaesthesia and cortical connections: cause or correlation? Trends Neurosci. 31, 549–550. doi: 10.1016/j.tins.2008.08.004
Cox, R. W. (1996). AFNI: software for analysis and visualization of functional magnetic resonance neuroimages. Comput. Biomed. Res. 29, 162–173. doi: 10.1006/cbmr.1996.0014
Cytowic, R. E. (1989/2002). Synesthesia: A Union of the Senses. 2nd Edn. Cambridge, MA: The MIT Press. doi: 10.1007/978-1-4612-3542-2
Dehaene, S., and Changeux, J. P. (2011). Experimental and theoretical approaches to conscious processing. Neuron 70, 200–227. doi: 10.1016/j.neuron.2011.03.018
Devor, A., Tian, P., Nishimura, N., Teng, I. C., Hillman, E. M., Narayanan, S. N., et al. (2007). Suppressed neuronal activity and concurrent arteriolar vasoconstriction may explain negative blood oxygenation level-dependent signal. J. Neurosci. 27, 4452–4459. doi: 10.1523/JNEUROSCI.0134-07.2007
Dovern, A., Fink, G. R., Fromme, A. C., Wohlschlager, A. M., Weiss, P. H., and Riedl, V. (2012). Intrinsic network connectivity reflects consistency of synesthetic experiences. J. Neurosci. 32, 7614–7621. doi: 10.1523/JNEUROSCI.5401-11.2012
Galton, F. (1883). Enquiries into the Human Faculty and its Development. London: Everyman. doi: 10.1037/14178-000
Goller, A. I., Otten, L. J., and Ward, J. (2009). Seeing sounds and hearing colors: an event-related. Potential study of auditory–visual synesthesia. J. Cogn. Neurosci. 21, 1869–1881. doi: 10.1162/jocn.2009.21134
Good, C. D., Johnsrude, I. S., Ashburner, J., Henson, R. N., Friston, K. J., and Frackowiak, R. S. (2001). A voxel-based morphometric study of ageing in 465 normal adult human brains. Neuroimage 14, 21–36. doi: 10.1006/nimg.2001.0786
Gray, J. A., Parslow, D. M., Brammer, M. J., Chopping, S., Vythelingum, G. N., and Ffytche, D. H. (2006). Evidence against functionalism from neuroimaging of the alien colour effect in synaesthesia. Cortex 42, 309–318. doi: 10.1016/S0010-9452(08)70357-5
Grossenbacher, P. G., and Lovelace, C. T. (2001). Mechanisms of synesthesia: cognitive and physiological constraints. Trends Cogn. Sci. 5, 36–41. doi: 10.1016/S1364-6613(00)01571-0
Hanggi, J., Beeli, G., Oechslin, M. S., and Jancke, L. (2008). The multiple synaesthete E.S.: neuroanatomical basis of interval-taste and tone-colour synaesthesia. Neuroimage 43, 192–203. doi: 10.1016/j.neuroimage.2008.07.018
Hanggi, J., Wotruba, D., and Jancke, L. (2011). Globally altered structural brain network topology in grapheme-color synesthesia. J. Neurosci. 31, 5816–5828. doi: 10.1523/JNEUROSCI.0964-10.2011
Hubbard, E. M. (2007a). Neurophysiology of synesthesia. Curr. Psychiatry Rep. 9, 193–199. doi: 10.1007/s11920-007-0018-6
Hubbard, E. M., Arman, A. C., Ramachandran, V. S., and Boynton, G. M. (2005). Individual differences among grapheme-color synesthetes: brain-behavior correlations. Neuron 45, 975–985. doi: 10.1016/j.neuron.2005.02.008
Hubbard, E. M., Brang, D., and Ramachandran, V. S. (2011). The cross-activation theory at 10. J. Neuropsychol. 5, 152–177. doi: 10.1111/j.1748-6653.2011.02014.x
Hupe, J. M., Bordier, C., and Dojat, M. (2012). The neural bases of grapheme-color synesthesia are not localized in real color-sensitive areas. Cereb. cortex 22, 1622–1633. doi: 10.1093/cercor/bhr236
Jancke, L., Beeli, G., Eulig, C., and Hanggi, J. (2009). The neuroanatomy of grapheme-color synesthesia. Eur. J. Neurosci. 29, 1287–1293. doi: 10.1111/j.1460-9568.2009.06673.x
Jancke, L., Rogenmoser, L., Meyer, M., and Elmer, S. (2012). Pre-attentive modulation of brain responses to tones in coloured-hearing synesthetes. BMC Neurosci. 13:151. doi: 10.1186/1471-2202-13-151
Kaas, A., Weigelt, S., Roebroeck, A., Kohler, A., and Muckli, L. (2010). Imagery of a moving object: the role of occipital cortex and human MT/V5+. Neuroimage 49, 794–804. doi: 10.1016/j.neuroimage.2009.07.055
Kastrup, A., Baudewig, J., Schnaudigel, S., Huonker, R., Becker, L., Sohns, J. M., et al. (2008). Behavioral correlates of negative BOLD signal changes in the primary somatosensory cortex. Neuroimage 41, 1364–1371. doi: 10.1016/j.neuroimage.2008.03.049
Keller, C. J., Bickel, S., Honey, C. J., Groppe, D. M., Entz, L., Craddock, R. C., et al. (2013). Neurophysiological investigation of spontaneous correlated and anticorrelated fluctuations of the BOLD signal. J. Neurosci. 33, 6333–6342. doi: 10.1523/JNEUROSCI.4837-12.2013
Klingner, C. M., Hasler, C., Brodoehl, S., and Witte, O. W. (2012). Excitatory and inhibitory mechanisms underlying somatosensory habituation. Hum. Brain Mapp. doi: 10.1002/hbm.22163. [Epub ahead of print].
Lueck, C. J., Zeki, S., Friston, K. J., Deiber, M. P., Cope, P., Cunningham, V. J., et al. (1989). The colour centre in the cerebral cortex of man. Nature 340, 386–389. doi: 10.1038/340386a0
Mckeefry, D. J., and Zeki, S. (1997). The position and topography of the human colour centre as revealed by functional magnetic resonance imaging. Brain 120(Pt 12), 2229–2242. doi: 10.1093/brain/120.12.2229
Mitchell, K. J. (2011). Curiouser and curiouser: genetic disorders of cortical specialization. Curr. Opin. Genet. Dev. 21, 271–277. doi: 10.1016/j.gde.2010.12.003
Neufeld, J., Sinke, C., Zedler, M., Dillo, W., Emrich, H. M., Bleich, S., et al. (2012). Disinhibited feedback as a cause of synesthesia: evidence from a functional connectivity study on auditory-visual synesthetes. Neuropsychologia 50, 1471–1477. doi: 10.1016/j.neuropsychologia.2012.02.032
Northoff, G., Walter, M., Schulte, R. F., Beck, J., Dydak, U., Henning, A., et al. (2007). GABA concentrations in the human anterior cingulate cortex predict negative BOLD responses in fMRI. Nat. Neurosci. 10, 1515–1517. doi: 10.1038/nn2001
Nunn, J. A., Gregory, L. J., Brammer, M., Williams, S. C., Parslow, D. M., Morgan, M. J., et al. (2002). Functional magnetic resonance imaging of synesthesia: activation of V4/V8 by spoken words. Nat. Neurosci. 5, 371–375. doi: 10.1038/nn818
Pasley, B. N., Inglis, B. A., and Freeman, R. D. (2007). Analysis of oxygen metabolism implies a neural origin for the negative BOLD response in human visual cortex. Neuroimage 36, 269–276. doi: 10.1016/j.neuroimage.2006.09.015
Paulesu, E., Harrison, J., Baron-Cohen, S., Watson, J. D., Goldstein, L., Heather, J., et al. (1995). The physiology of coloured hearing. A PET activation study of colour-word synaesthesia. Brain 118(Pt 3), 661–676. doi: 10.1093/brain/118.3.661
Pesenti, M., Thioux, M., Seron, X., and De Volder, A. (2000). Neuroanatomical substrates of Arabic number processing, numerical comparison, and simple addition: a PET study. J. Cogn. Neurosci. 12, 461–479. doi: 10.1162/089892900562273
Ramachandran, V. S., and Hubbard, E. M. (2001). Psychophysical investigations into the neural basis of synaesthesia. Proc. Biol. Sci. 268, 979–983. doi: 10.1098/rspb.2000.1576
Rich, A. N., and Mattingley, J. B. (2002). Anomalous perception in synaesthesia: a cognitive neuroscience perspective. Nat. Rev. Neurosci. 3, 43–52. doi: 10.1038/nrn702
Rich, A. N., Williams, M. A., Puce, A., Syngeniotis, A., Howard, M. A., McGlone, F., et al. (2006). Neural correlates of imagined and synaesthetic colours. Neuropsychologia 44, 2918–2925. doi: 10.1016/j.neuropsychologia.2006.06.024
Rouw, R., and Scholte, H. S. (2007). Increased structural connectivity in grapheme-color synesthesia. Nat. Neurosci. 10, 792–797. doi: 10.1038/nn1906
Rouw, R., and Scholte, H. S. (2010). Neural basis of individual differences in synesthetic experiences. J. Neurosci. 30, 6205–6213. doi: 10.1523/JNEUROSCI.3444-09.2010
Rouw, R., Scholte, H. S., and Colizoli, O. (2011). Brain areas involved in synaesthesia: a review. J. Neuropsychol. 5, 214–242. doi: 10.1111/j.1748-6653.2011.02006.x
Rueckert, D., Sonoda, L. I., Hayes, C., Hill, D. L., Leach, M. O., and Hawkes, D. J. (1999). Nonrigid registration using free-form deformations: application to breast MR images. IEEE Trans. Med. Imaging 18, 712–721. doi: 10.1109/42.796284
Shmuel, A., Augath, M., Oeltermann, A., and Logothetis, N. K. (2006). Negative functional MRI response correlates with decreases in neuronal activity in monkey visual area V1. Nat. Neurosci. 9, 569–577. doi: 10.1038/nn1675
Simner, J., Mulvenna, C., Sagiv, N., Tsakanikos, E., Witherby, S. A., Fraser, C., et al. (2006). Synaesthesia: the prevalence of atypical cross-modal experiences. Perception 35, 1024–1033. doi: 10.1068/p5469
Smith, S. M. (2002). Fast robust automated brain extraction. Hum. Brain Mapp. 17, 143–155. doi: 10.1002/hbm.10062
Smith, S. M., Jenkinson, M., Johansen-Berg, H., Rueckert, D., Nichols, T. E., Mackay, C. E., et al. (2006). Tract-based spatial statistics: voxelwise analysis of multi-subject diffusion data. Neuroimage 31, 1487–1505. doi: 10.1016/j.neuroimage.2006.02.024
Smith, S. M., Jenkinson, M., Woolrich, M. W., Beckmann, C. F., Behrens, T. E., Johansen-Berg, H., et al. (2004). Advances in functional and structural MR image analysis and implementation as FSL. Neuroimage 23(Suppl. 1), S208–S219. doi: 10.1016/j.neuroimage.2004.07.051
Sperling, J. M., Prvulovic, D., Linden, D. E., Singer, W., and Stirn, A. (2006). Neuronal correlates of colour-graphemic synaesthesia: a fMRI study. Cortex 42, 295–303. doi: 10.1016/S0010-9452(08)70355-1
Steven, M. S., Hansen, P. C., and Blakemore, C. (2006). Activation of color-selective areas of the visual cortex in a blind synesthete. Cortex 42, 304–308. doi: 10.1016/S0010-9452(08)70356-3
Terhune, D. B., Tai, S., Cowey, A., Popescu, T., and Cohen Kadosh, R. (2011). Enhanced cortical excitability in grapheme-color synesthesia and its modulation. Curr. Biol. 21, 2006–2009. doi: 10.1016/j.cub.2011.10.032
Van Leeuwen, T. M., Petersson, K. M., and Hagoort, P. (2010). Synaesthetic colour in the brain: beyond colour areas. A functional magnetic resonance imaging study of synaesthetes and matched controls. PLoS ONE 5:e12074. doi: 10.1371/journal.pone.0012074
Wade, A. R., and Rowland, J. (2010). Early suppressive mechanisms and the negative blood oxygenation level-dependent response in human visual cortex. J. Neurosci. 30, 5008–5019. doi: 10.1523/JNEUROSCI.6260-09.2010
Ward, J. (2013). Synesthesia. Annu. Rev. Psychol. 64, 49–75. doi: 10.1146/annurev-psych-113011-143840
Ward, J., Huckstep, B., and Tsakanikos, E. (2006). Sound-colour synaesthesia: to what extent does it use cross-modal mechanisms common to us all? Cortex 42, 264–280. doi: 10.1016/S0010-9452(08)70352-6
Ward, J., and Mattingley, J. B. (2006). Synaesthesia: an overview of contemporary findings and controversies. Cortex. 42, 129–136. doi: 10.1016/S0010-9452(08)70336-8
Ward, J., and Simner, J. (2005). Is synaesthesia an X-linked dominant trait with lethality in males? Perception 34, 611–623. doi: 10.1068/p5250
Weiss, P. H., and Fink, G. R. (2009). Grapheme-colour synaesthetes show increased grey matter volumes of parietal and fusiform cortex. Brain 132, 65–70. doi: 10.1093/brain/awn304
Weiss, P. H., Zilles, K., and Fink, G. R. (2005). When visual perception causes feeling: enhanced cross-modal processing in grapheme-color synesthesia. Neuroimage 28, 859–868. doi: 10.1016/j.neuroimage.2005.06.052
Keywords: VBM, fMRI, diffusion, DTI, structural, negative BOLD, deactivation, synesthesia
Citation: O'Hanlon E, Newell FN and Mitchell KJ (2013) Combined structural and functional imaging reveals cortical deactivations in grapheme-color synaesthesia. Front. Psychol. 4:755. doi: 10.3389/fpsyg.2013.00755
Received: 28 May 2013; Accepted: 27 September 2013;
Published online: 30 October 2013.
Edited by:
Michael Banissy, Goldsmiths University of London, UKReviewed by:
H. Steven Scholte, University of Amsterdam, NetherlandsJürgen Hänggi, University of Zurich, Switzerland
Copyright © 2013 O'Hanlon, Newell and Mitchell. This is an open-access article distributed under the terms of the Creative Commons Attribution License (CC BY). The use, distribution or reproduction in other forums is permitted, provided the original author(s) or licensor are credited and that the original publication in this journal is cited, in accordance with accepted academic practice. No use, distribution or reproduction is permitted which does not comply with these terms.
*Correspondence: Kevin J. Mitchell, Smurfit Institute of Genetics, Trinity College Dublin, Dublin 2, Ireland e-mail:a2V2aW4ubWl0Y2hlbGxAdGNkLmll