 Claire A. A. Mitchell1*
 Murray T. Maybery1
 Suzanna N. Russell-Smith1
 Daniel Collerton2,3Gilles E. Gignac1
 Flavie Waters1,4
- 1School of Psychological Science, The University of Western Australia, Crawley, WA, Australia
- 2Northumberland, Tyne and Wear NHS Foundation Trust, Bensham Hospital, Gateshead, United Kingdom
- 3Institute of Neuroscience, Newcastle University, Newcastle upon Tyne, United Kingdom
- 4Clinical Research Centre, Graylands Hospital, North Metro Health Service Mental Health, Mount Claremont, WA, Australia
Hallucinations and other unusual sensory experiences (USE) can occur in all modalities in the general population. Yet, the existing literature is dominated by investigations into auditory hallucinations (“voices”), while other modalities remain under-researched. Furthermore, there is a paucity of measures which can systematically assess different modalities, which limits our ability to detect individual and group differences across modalities. The current study explored such differences using a new scale, the Multi-Modality Unusual Sensory Experiences Questionnaire (MUSEQ). The MUSEQ is a 43-item self-report measure which assesses USE in six modalities: auditory, visual, olfactory, gustatory, bodily sensations, and sensed presence. Scale development and validation involved a total of 1,300 participants, which included: 513 students and community members for initial development, 32 individuals with schizophrenia spectrum disorder or bipolar disorder for validation, 659 students for factor replication, and 96 students for test-retest reliability. Confirmatory factor analyses showed that a correlated-factors model and bifactor model yielded acceptable model fit, while a unidimensional model fitted poorly. These findings were confirmed in the replication sample. Results showed contributions from a general common factor, as well as modality-specific factors. The latter accounted for less variance than the general factor, but could still detect theoretically meaningful group differences. The MUSEQ showed good reliability, construct validity, and could discriminate non-clinical and clinical groups. The MUSEQ offers a reliable means of measuring hallucinations and other USE in six different modalities.
Introduction
The assessment and classification of psychopathology and other psychological constructs is historically categorical in nature. Some mental experiences, however, can occur on a continuum ranging from subthreshold levels in the general population to acute symptoms in clinical groups, and this observation has led to the exploration of symptom dimensions. In particular, the psychosis continuum theory (Johns and Van Os, 2001) suggests that the positive symptoms of psychosis (i.e., hallucinations and delusions) can exist at attenuated levels in the general population without being associated with distress or a loss of contact with reality that might warrant a need for treatment (Preti et al., 2014; Brett et al., 2015; Waters et al., 2017).
Although the psychosis continuum model is debated (Kaymaz and Van Os, 2010; Lawrie et al., 2010), there is overwhelming evidence that people in the general population report a range of hallucinations and other unusual sensory experiences (USE) (see Nuevo et al., 2010; Pechey and Halligan, 2012; McGrath et al., 2015). In this report, the term USE refers to a range of phenomena such as hallucinations and misperceptions where there is discrepancy between what is perceived and what actually exists in the real world. It is sometimes difficult to precisely distinguish hallucinations from other perceptual experiences given that perception is subjective and complex (Dror, 2005), and there is no clear-cut distinction between categories of experiences. Nonetheless, hallucinations are often defined as waking experiences which have the character of veridical perceptions, but are elicited in the absence of a relevant external stimulus. Misperceptions refer to experiences (images, sounds, etc.) whose relationship to stimuli in the outside world is distorted or changed in some way.
Studies of USE in the general population typically focus on hallucinations. Epidemiological studies estimate a lifetime prevalence of approximately 5–30% of (Linscott and Van Os, 2013; Kråkvik et al., 2015; McGrath et al., 2015; Peters et al., 2016). For about 80% of individuals who experience psychotic-like experiences (including hallucinations), these are transient experiences that tend to remit over time (Linscott and Van Os, 2013). In the remaining 20%, symptoms are persistent and distressing, and approximately 7% may go on to develop a psychotic disorder (Linscott and Van Os, 2013). Studies tend to screen community participants for psychiatric disorders, but it is possible that these experiences are related to prodromal psychosis, an undiagnosed medical condition (e.g., disease of the sensory organs), or other disorders (e.g., sleep disorders).
The auditory and visual modalities are the most commonly investigated, although investigators often tend to focus exclusively on one modality. The other sensory modalities however require further attention. USE can occur in different modalities (e.g., auditory, visual, olfactory, gustatory, and bodily sensations), as shown in a broad variety of clinical conditions (e.g., schizophrenia and other psychosis, neurodegenerative diseases, eye disease, and temporal lobe epilepsy) (see Lewandowski et al., 2009; Ford and Almeida, 2014; Larøi et al., 2014; Stephane et al., 2014; Waters et al., 2014a). Different modalities of USE have also been reported in the general population (Tien, 1991; Ohayon, 2000; Peters et al., 2016). Lifetime prevalence rates of auditory hallucinations range between 2.5 and 15% (e.g., Beavan et al., 2011; Kråkvik et al., 2015; McGrath et al., 2015). Similarly, visual experiences are relatively common with lifetime estimates ranging between 3 and 15%, and these prevalence rates escalate rapidly in association with increase age, visual loss, social isolation, and sleep deprivation (Tien, 1991; Ohayon, 2000; McGrath et al., 2015; Peters et al., 2016). Studies also suggest non-negligible lifetime estimates of olfactory hallucinations in approximately 3–9% of the population (Ohayon, 2000; García-Ptacek et al., 2013), gustatory hallucinations in 1% (Tien, 1991; Ohayon, 2000), and bodily/somatic hallucinations in 3–7% (Ohayon, 2000; Shevlin et al., 2007; Peters et al., 2016). Peters et al. (2016) even suggest that bodily and olfactory hallucinations may be more common in the general community than in psychosis. Sensed presence is another sensory domain which is underreported. Despite limited research, existing evidence suggests that the lifetime prevalence of sensed presence experiences may be as high as 30–60% in selected (e.g., bereaved) populations (Castelnovo et al., 2015).
Given the existence of USE in multiple sensory domains, comprehensive and sensitive assessment scales are required, although currently lacking. The development of a comprehensive and accurate measure of USE in different modalities is critical to furthering our understanding of these phenomena, and of their relation to other psychological constructs and mental health outcomes. Until now, the presence and frequency of hallucinations and other USE in the general population have been assessed rather broadly. For example, scales such as the Oxford-Liverpool Inventory of Feelings and Experiences (O-LIFE; Mason et al., 1995, 2005) which targets the schizotypy personality construct, assess unusual experiences via items relating to daydreaming, magical thinking, and paranoia. This limits the subscale's utility in examining specific perceptual changes.
The Launay Slade Hallucination Scale (LSHS; Launay and Slade, 1981) and its revisions (e.g., Revised Hallucination Scale; Morrison et al., 2000; LSHS-Modified; Larøi et al., 2004; LSHS-Modified-II [LSHS-M-II]; Larøi and Van der Linden, 2005), are the most commonly used measures of hallucination “proneness.” Recent versions of the LSHS (e.g., LSHS-M-II) target hallucinations in various modalities (auditory, visual, olfactory, tactile, and sensed presence) (Larøi and Van der Linden, 2005; Kråkvik et al., 2015). However, these modalities are not assessed in detail (i.e., one or two items per modality) and the scale was developed without theoretical underpinnings except to build on the notion of “proneness,” which does not have a clear definition or meaning. If the focus of research is on particular aspects of hallucinations in the community, the development of more internally consistent scale is required.
A more detailed focus on perceptual anomalies was achieved with the Cardiff Anomalous Perception Scale (CAPS; Bell et al., 2006). The CAPS assesses a range of perceptual anomalies in different modalities, but these are grouped into different phenomenological dimensions (e.g., changes in sensory intensity, sensory experience from an unexplained source, and thought echo) rather than by modality. Precise frequency labels are also lacking, which limits the assessment of frequency and persistence of symptoms which can signal a transition into a psychotic state (Stefanis et al., 2002; Dominguez et al., 2011). In summary, no measure is yet available to systematically explore the frequency of hallucination and USE in different modalities. The first aim of this study was therefore to create a scale that assesses USE in the six most common sensory modalities.
Scale development and validation, however, is not a simple task, particularly if different factors/modalities are thought to be separable. The ability to accurately measure USE in different modalities is dependent on the statistical separability of these experiences. Principal components analyses and exploratory methods were previously used to guide previous scale development (e.g., in the creation of the CAPS). These methods can be helpful for item reduction, although there is no a priori expectation regarding how items may be related.
One question to consider is whether USE are better explained by a single general “proneness” or “hallucination” factor, or whether the different modalities are sufficiently unique to lead to individual differences. Previous findings have indicated significant correlations between hallucinations in different modalities within the same individuals (e.g., Launay and Slade, 1981; Morrison et al., 2000; Larøi and Van der Linden, 2005; Bell et al., 2006; Lewandowski et al., 2009; Preti et al., 2014). However, evidence from phenomenological and neurobiological studies also indicated that USE can be differentiated at the modality level (Weiss and Heckers, 1999; Larøi, 2006; Jardri et al., 2013; Waters et al., 2014b), such that individuals may only ever experience hallucinations in one modality. Since both approaches appear valid, we put forward a third possiblity which incorporates both views, and which proposes one large general factor as well as unique variance from different modalities.
This hybrid approach has support from other domains of psychology. For example, Lahey et al. (2012) proposed that high correlations between dimensions of general psychopathology (externalizing, internalizing, and thought disorder) may be reflective of a general factor representing an individual's predisposition to developing psychopathology, but with additional separate factors which act to shape this vulnerability into a specific symptom manifestation. Statistical methods which employ confirmatory factor analysis using a bifactor modeling approach (e.g., Caspi et al., 2014; Laceulle et al., 2015; Waldman et al., 2016) also support this model.
A bifactor modeling approach assessing for the presence of a general factor and (typically correlated) domain-specific latent factors has also been used successfully in psychosis research by Reininghaus et al. (2013). Their findings demonstrated the presence of a general psychosis factor as well as individual symptom dimensions. This has been replicated in a general population sample (Shevlin et al., 2016). Interpretations of what the general factor represents include a general risk or common etiology, associated distress or impairment, or a level of symptom acuity (Lahey et al., 2012; Caspi et al., 2014; Waldman et al., 2016).
This hierarchical structure is yet to be explored in relation to different sensory modalities of USE, and to do so is of great importance in furthering our understanding of the commonalities and separability of these phenomena. It also allows us to explore conceptual issues relating modality-specific vs. generalized deficits. Indeed, the nature of hallucinations in individuals with psychosis, in which the presence of hallucinations in the auditory and visual modalities increases the chance of additional hallucinations (e.g., tactile and olfactory) (see Lim et al., 2016; Clark et al., 2017), suggests related but potentially differentiable “vulnerability” mechanisms.
Notwithstanding the possibility of a general USE factor, evidence exists of independent sensory contributions. Examples include schizophrenia spectrum disorders, which are characterized predominantly by auditory hallucinations in contrast to other medical conditions and psychiatric disorders, in which visual hallucinations are more common (Lewandowski et al., 2009; Waters et al., 2014a). Another example includes an overrepresentation of visual hallucinations in developing countries compared to Western cultures (Luhrmann, 2011). Yet another example is that of the role of childhood trauma mpacting on the specific modality of USE, with tactile hallucinations being linked to physical abuse and visual hallucinations with neglect (Shevlin et al., 2007). Factors which serve to accentuate the expression of one modality over another therefore appear to include neurobiological mechanisms, culture, and psychosocial factors.
Such findings indicate that USE should be characterized by multiple sensory dimensions, and also indicate the importance of assessing both a general factor and individual modalities. Confirmatory approaches are preferred in scale development where theoretical knowledge anticipates a relationship between items (Ten Holt et al., 2010). Exploratory approaches, by contrast, do not allow for the testing of multidimensionality or higher-order constructs which may result in an inappropriate solution (McGartland Rubio et al., 2001). The second aim of this study was therefore to perform a series of confirmatory factor analyses to assess the factor structure of the new scale. Specifically, we aimed to test alternative models of the factorial structure of USE as a way of exploring their potential separability at the modality level.
In summary, existing measures of USE have contributed to a rich body of knowledge but are limited in their ability to systematically assess different modalities. Approaches toward scale development also need to be more systematic and theoretically guided to validly measure USE in their respective modalities. Specifically, the possibility of a model structure comprising a general factor and modality-specific factors is yet to be explored regarding USE. Therefore, the aims of the current study were to:
(1) Create a scale that separately assesses USE in six common sensory modalities, and
(2) Evaluate the psychometric properties of this scale, while testing alternative factor structure models to explore the contribution of general and specific factors.
We report on the development and psychometric properties of the resulting scale, called the Multi-Modality Unusual Sensory Experiences Questionnaire (MUSEQ). The development of the MUSEQ was theory-driven with a priori hypotheses regarding the relationship between modalities. Specifically, it was hypothesized that all items (and modalities) would be positively related to each other, but still be separable into modality-specific domains. Results regarding the factorial structure are checked in a replication sample.
Method
Participants
Non-clinical
Six-hundred and sixteen participants took part in the initial scale development study. Forty participants were excluded due to incomplete questionnaires. Recruitment targeted students (N = 298) and non-student general community volunteers (N = 215) aged 17 and above. Students were recruited via an undergraduate student pool at the University of Western Australia and through research and social media websites (Call for Participants, Psychological Research on the Net, Online Psychology Research UK, The Inquisitive Mind, PsyResearch, Social Psychology Network, Intervoice, U3A Online, Facebook, Find Participants, and CrowdFlower). The community sample was also obtained via these websites. To ensure endorsed USE were not due to other psychiatric and neurological conditions, exclusion criteria included a self-reported history of diagnosed schizophrenia spectrum disorder or bipolar disorder (N = 31), epilepsy (N = 10), neurodegenerative disease (N = 4), and traumatic brain injury associated with loss of consciousness (N = 18).
The final sample comprised 513 participants (386 female, 127 male), with a mean age of 27.75 years (SD = 13.28, range 17–76; N = 489). Participants were drawn from Australia (48.7%), United States of America/Canada (42.8%), United Kingdom (5.3%), and other countries (3.2%), with most obtaining an education level of high school or greater (High School 53.4%; Tertiary Studies 37.0%; other 9.6%). Participants who were not students (N = 215) predominantly worked full-time (50.2%), followed by part-time work (20%), unemployment (14%), retirement (8.4%), casual work (5.6%), and volunteering (1.9%). Reported marital status was as follows: Single (69.4%), Married (14.8%), De Facto (9.9%), Divorced (4.3%), and Widowed (1.6%). Religious affiliations were: Atheism (44.8%), Christianity (39.4%), Buddhism (2.9%), Islam (2.3%), Judaism (1.2%), Hinduism (1.0%), other (6.2%), and undisclosed (2.1%).
Clinical
Thirty-two individuals (20 female, 12 male) with schizophrenia spectrum disorder (N = 10) or bipolar disorder (N = 14) completed the MUSEQ (age M = 34.17 years, SD = 13.09, range 18–67) for validation purposes. Participants reported their diagnosis was made by a medical or mental health practitioner. A subset of eight participants chose not to disclose which of these two diagnostic categories pertained to them. Recruitment occurred via outpatient hospital clinics (N = 6) and online research websites (as above).
Replication and Test-Retest Samples
Two additional samples were recruited via the undergraduate student pool at the University of Western Australia. Applying the same exclusion criteria as used for the original sample, 659 students (438 female, 221 male, M age = 20.92 years, SD = 5.58, range 16–71) were used to test the replicability of the factor structure. A further 96 students (68 female, 27 male, 1 “other”; M age = 19.82 years, SD = 4.49, range 17–41) completed the MUSEQ at two time points (6 months apart) to determine test-retest reliability.
Questionnaires
Demographic and Health Questionnaire
The non-clinical sample (N = 513) completed 13 questions relating to demographic information (e.g., age, gender, education level, and marital status). There were also 10 questions covering lifetime medical history (sleep disorder, epilepsy, traumatic head injury, neurodegenerative disease), mental health history (including schizophrenia spectrum disorder and bipolar disorder), and sensory-related conditions or experiences (eye problems/disease not including glasses/contact prescriptions, ear/nose/throat problems, and synaesthesia). The year of diagnosis was requested for any questions positively endorsed (where applicable).
Cardiff Anomalous Perception Scale (CAPS)
The CAPS (Bell et al., 2006) is a 32-item self-report measure that assesses a range of perceptual anomalies (e.g., sensory intensity, sensory flooding, and hallucinations) on a dichotomous “Yes” or “No” scale. If items are positively endorsed, participants are required to rate the distress (“Not at all distressing” to “Very distressing”), intrusiveness (“Not at all distracting” to “Completely intrusive”), and frequency (“Happens hardly at all” to “Happens all the time”) associated with that experience on a 1–5 Likert scale. Total scores range from 0 to 32 (for the dichotomous responses) and subscale scores range from 0 to 160 (for the five-point responses).
Launay Slade Hallucination Scale-Modified-II (LSHS-M-II)
The LSHS-M-II (Larøi and Van der Linden, 2005) is a 16-item self-report scale assessing hallucination proneness. This study used Larøi and Van der Linden's (2005) adaptation of the scale, but excluded the follow-up questions. Items are rated on a five-point Likert scale (0: “Certainly does not apply to me” to 4: “Certainly applies to me”). Potential scores range from 0 to 60.
Oxford-Liverpool Inventory of Feelings and Experiences—Short Version (O-LIFE-S)
The O-LIFE-S (Mason et al., 2005) is a 43-item self-report measure of schizotypal traits. We utilized three subscales: unusual experiences (UE; 12 items), cognitive disorganization (CD; 11 items), and introvertive anhedonia (IA; 10 items). Items are rated on a dichotomous “Yes” or “No” scale, and potential scores range from zero to the total number of items in each subscale.
Scale Development
Item Creation
The objective of the item creation stage was to identify a range of questions to assess USE according to a continuum structure. This included items ranging from the most frequent phenomena (likely to be strongly endorsed) through to “borderland”-like perceptual experiences, which are experienced as external and non-self (i.e., akin to clinical phenomena). This continuum was informed by theoretical work which describes the qualitative ranges in consciousness and subjectivity that occur in schizotypy, the prodrome phase of psychosis, and in some organic, medical, or affective states (Meehl, 1962; Jansson, 2014).
An extensive review was conducted of scales and interviews that assess hallucination proneness, delusional ideation, psychosis proneness, schizotypy, perceptual anomalies, and hallucinations in different clinical groups (see Table 1). Items were selected in six modalities (auditory, visual, olfactory, gustatory, bodily sensations, and sensed presence). This review resulted in a list of 82 items, which were used as a foundation to create the new scale items.
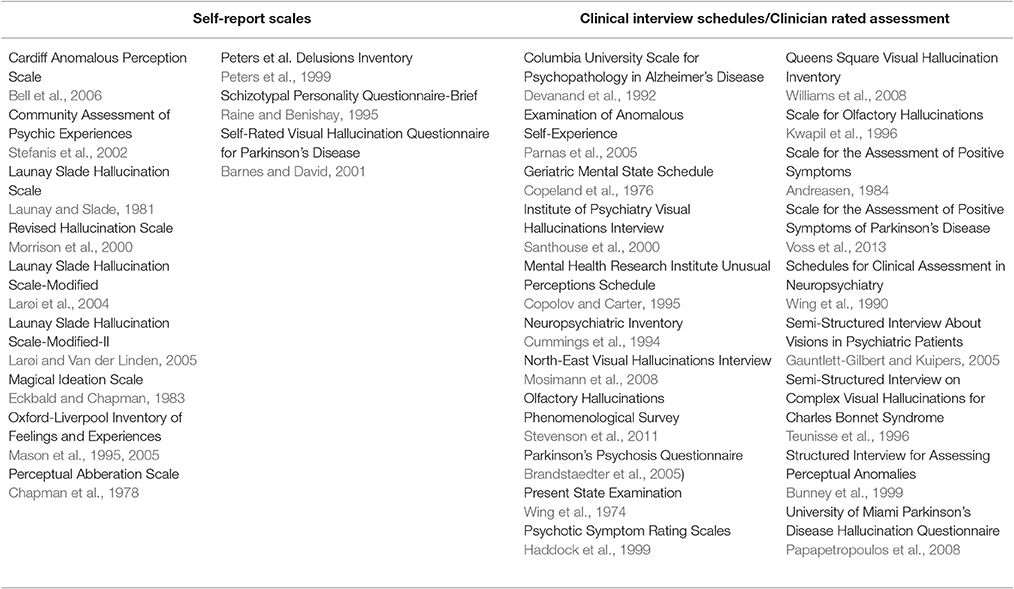
Table 1. Scales and assessment measures reviewed during development of the MUSEQ.
With the exception of sensed presence, items in each modality were created to encompass a range of experiences corresponding with the following general continuum structure: item 1 = broad subclinical sensory experiences (e.g., senses playing tricks), item 2 = changes in perceptual intensity, item 3 = internal events become externalized, item 4 = misperceptions, and item 5 (and above) = hallucinations (having a non-self origin). Consultation was sought with an expert in the field throughout the scale development process to confirm item suitability.
Item Selection
A brief exploratory factor analysis was initially conducted on each subscale separately (one-factor) to aid with item selection analysis. Following Osborne and Costello's (2009) guidelines, item analysis involved checking items had appropriate communalities (>0.40) and strong factor loadings (>0.50) within their respective subscale. Only one bodily sensation item, which related to feeling vibration on one's body with no apparent stimulus, was removed due to a low communality and weak factor loading. All other items had adequate communalities, and medium to strong (0.40–0.79) factor loadings within their respective subscales. The items were piloted with participants from the general population (N = 8) who provided feedback on their relevance, phrasing, and comprehensibility.
The final scale comprised 43 questions organized across six modality subscales: auditory (7 items), visual (8 items), olfactory (8 items), gustatory (8 items), bodily sensations (8 items), and sensed presence (4 items) (see Table 2). Items are rated on a five-point Likert scale that targets the frequency of USE, specifically adapted for a non-clinical population (0 = Never [Never Happened]; 1 = Hardly Ever [Once or twice in my life]; 2 = Rarely [Once or twice a year]; 3 = Occasionally [A few times a year]; 4 = Frequently [At least monthly]. The MUSEQ is available online (see Supplementary Table 4)
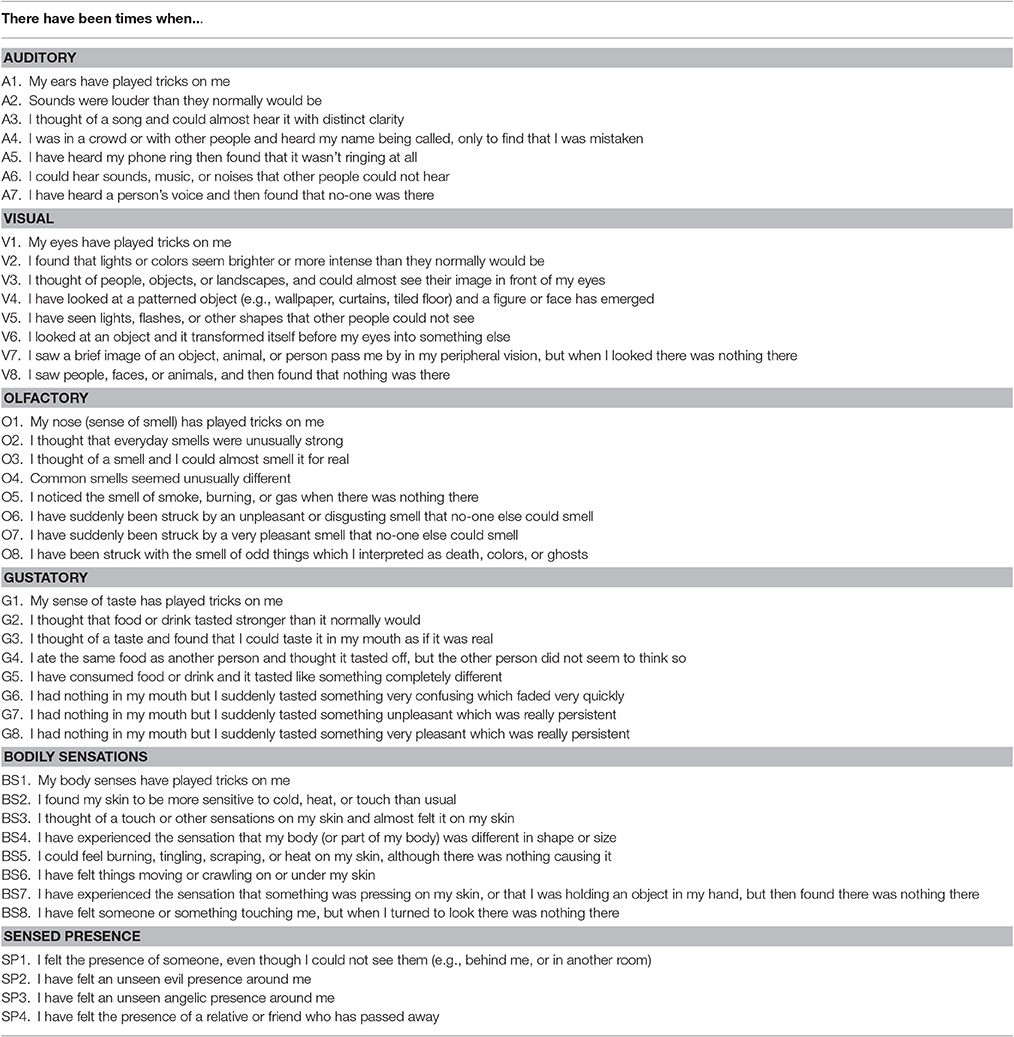
Table 2. Final MUSEQ items.
Procedure
Participants anonymously completed the self-report questionnaires on Qualtrics software accessed via a secure internet hyperlink, or via hard copy administration. The non-clinical sample (N = 513) completed the MUSEQ, O-LIFE-S, LSHS-M-II, and CAPS, whereas the clinical sample (N = 32), replication sample (N = 659), and test-retest sample (N = 96) completed the MUSEQ only. This study and its protocols were approved by the Human Research Ethics Committee of the University of Western Australia. All participants provided written informed consent prior to their participation.
Statistical Analyses
A series of confirmatory factor analyses were performed using MPlus 7 (Muthén and Muthén, 1998-2012) in the original sample (N = 513) in order to assess the factor structure of the new scale. Due to the non-normal and ordinal nature of the data, analyses were based on polychoric correlations, and a weighted least squares means and variance adjusted (WLSMV) estimation was used (Brown, 2015). For the purposes of factor identification, all latent variable variances in the model were constrained to 1, except the second-order model. The second-order model first-order factors were scaled by constraining a loading from each to 1. Model comparisons were facilitated by testing a series of four progressively more complex models that have been frequently used in studies examining the structure of hierarchical constructs (e.g., Reininghaus et al., 2013; Caspi et al., 2014; Laceulle et al., 2015):
(i) One-factor model: Tested the hypothesis that all items are influenced by a general factor and are unidimensional (see Figure 1 Model A).
(ii) Second-order (higher-order) model: Tested the hypothesis that the covariance between the modality-specific latent factors is explained by a higher-order general latent factor. In this model, there is no direct relationship between the general factor and individual items; rather, the relationship is indirectly mediated by the modality-specific latent factors (see Figure 1 Model B).
(iii) Bifactor model: Tested the hypothesis that all items load onto both a general factor and one of the six modality-specific factors (see Figure 1 Model C). For example, all auditory items load onto the general factor and the auditory latent factor, but no other modality-specific factor. This model specifies a general factor that may reflect what is common between the items, while also being able to simultaneously test the unique variance associated with each modality factor. Thus, the model allows both the general factor and specific modality factors to have direct influence on the items, but unlike the second-order model, the specific modality factors do not mediate the influence of the general factor.
(iv) Correlated-factors (six-factor) model: Tested the hypothesis that each modality forms a latent factor, with each factor influencing a subset of USE in the respective modality (see Figure 1 Model D). This model assumes that the latent modality factors may be correlated.
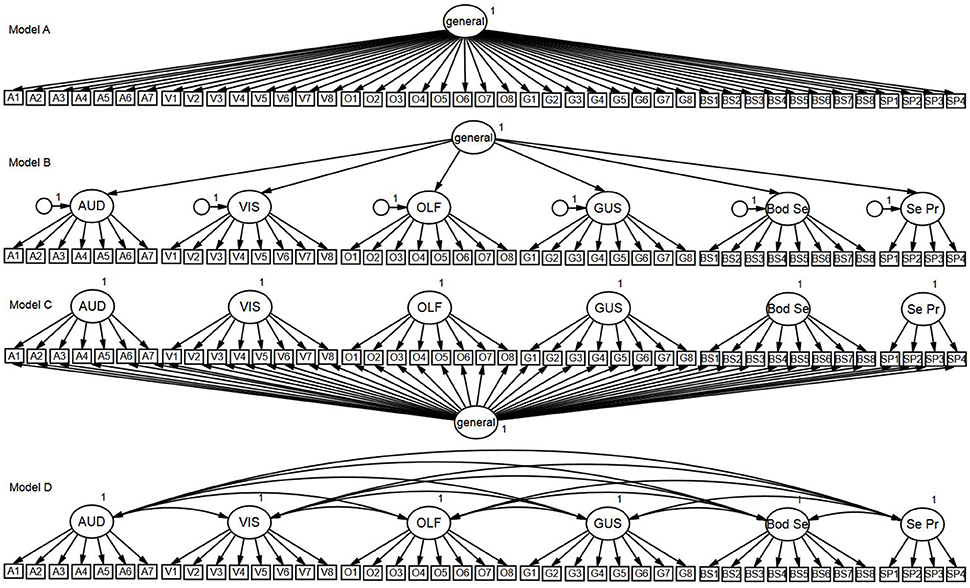
Figure 1. Confirmatory factor analysis models. Model A, One-Factor Model; Model B, Second-Order Model; Model C, Bifactor Model; Model D, Correlated-Factors Model.
These four models were re-tested in the replication sample.
Acceptable model fit was determined using the following criteria: a relative chi-square statistic <3, root mean square error of approximation (RMSEA) values <0.08 (good absolute close-fit <0.05), and comparative fit index (CFI) and Tucker-Lewis Index (TLI) values >0.90 (good incremental close-fit >0.95) (Schweizer, 2010). Model comparisons were based on the degree of practical improvement in the models, as determined by a TLI difference of 0.10 or greater (Gignac, 2016). The use of a bifactor model also provided the opportunity to calculate omega subscale (ωs) and omega hierarchical (ωh) coefficients. The ωs measures the degree to which the subscales are reliable and interpretable after controlling for the general factor, while the (ωh) represents the degree to which the general factor can be interpreted as reflective of a single common construct while controlling for the modality factors (Zinbarg et al., 2005; Reise et al., 2013). There are currently no specific guidelines for interpreting ωs and ωh coefficients, but Gignac and Kretzschmar (2017) proposed relative values of <0.20 (relatively small), 0.20–0.30 (typical), and >0.30 (relatively large) for ωs based on a quantitative survey of the published literature.
Internal consistency reliability was estimated for each of the six modality subscales and calculated using the Cronbach's α coefficient. Test-retest reliability was determined using a Pearson's correlation between MUSEQ scores at two time points (6 months apart). Convergent and discriminant validity was assessed by correlating the MUSEQ total and subscale scores with the LSHS-M-II, CAPS, and O-LIFE-S subscales using Pearson's r. The ability of the scale to discriminate between non-clinical and clinical groups was measured by comparing mean differences (t-tests) on the total and subscale MUSEQ scores between the non-clinical sample and clinical sample. Incremental validity was assessed using t-tests on the data of participants with and without a history of sleep disorder, eye problems/disease, and synaesthesia. These three variables were selected due to sufficient sample size compared to other health variables recorded during the study. These comparisons allow us to demonstrate the usefulness of assessing modalities separately, rather than measuring USE as a unidimensional construct (i.e., total score). Given the non-normality of the data, correlation and mean difference analyses used bootstrapping (1,000 samples) to estimate the p-values and 95% confidence intervals. Descriptive and inferential analyses were performed using SPSS Statistics Version 22.
Results
Factor Structure
One-Factor Model: Is a Unidimensional Model Suitable?
As can be seen in Table 3, the one-factor model (Figure 1 Model A) was associated with unacceptable levels of absolute (RMSEA) and incremental close-fit (CFI and TLI). Factor loadings are shown in Table 4. These results indicated that a unidimensional general factor was not appropriate in explaining the relationship between the MUSEQ items.
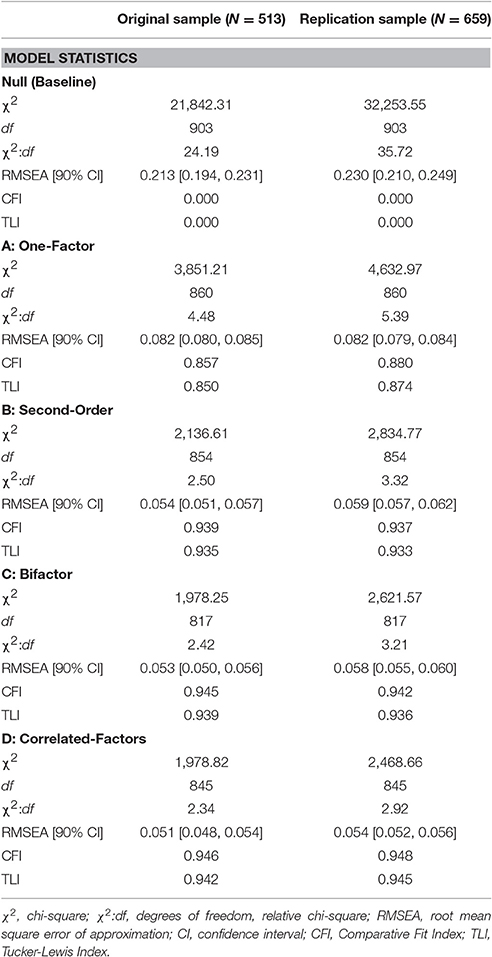
Table 3. Model fit statistics associated with the confirmatory factor analysis models for the original and replication samples.
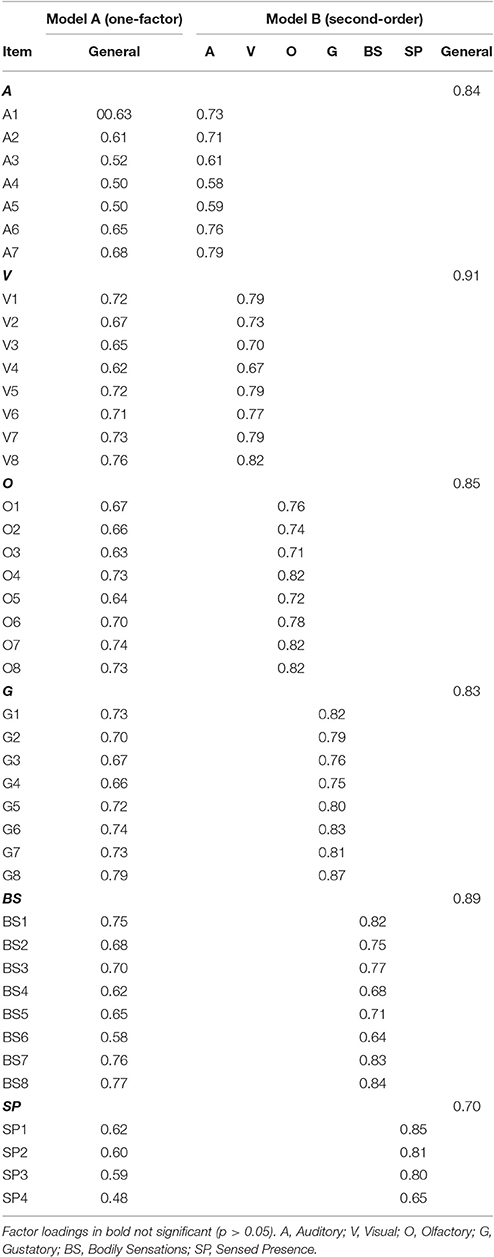
Table 4. Standardized factor loadings (WLSMV) for the one-factor and second-order models in the original sample (N = 513).
Second-Order Model: Is the Covariance between Modalities Explained by a Higher-Order General Factor?
The second-order model (Figure 1 Model B) yielded acceptable absolute and incremental close-fit. All standardized loadings were significant (p < 0.001) and positive (see Table 4). Loadings between the general factor and the modality factors ranged from 0.70–0.91 (all p < 0.001). The TLI difference >0.10 in favor of Model B vs. Model A suggested practical improvement in model fit for Model B (compared to Model A) (see Table 3).
Bifactor Model: Can the Variance Be Explained by both a General Factor and Modality-Specific Factor?
The bifactor model (Figure 1 Model C) yielded acceptable absolute and incremental close-fit (see Table 3). All items loaded significantly (p < 0.001, item V3 p = 0.01) onto their respective modality factors, with the exception of item V2 on the visual factor (see Table 5). All items loaded significantly (p < 0.001) on the general factor, ranging from 0.45 to 0.77. There was practical improvement in model fit (TLI difference >0.10) from Model A to C, but not from Model B to C (see Table 3).
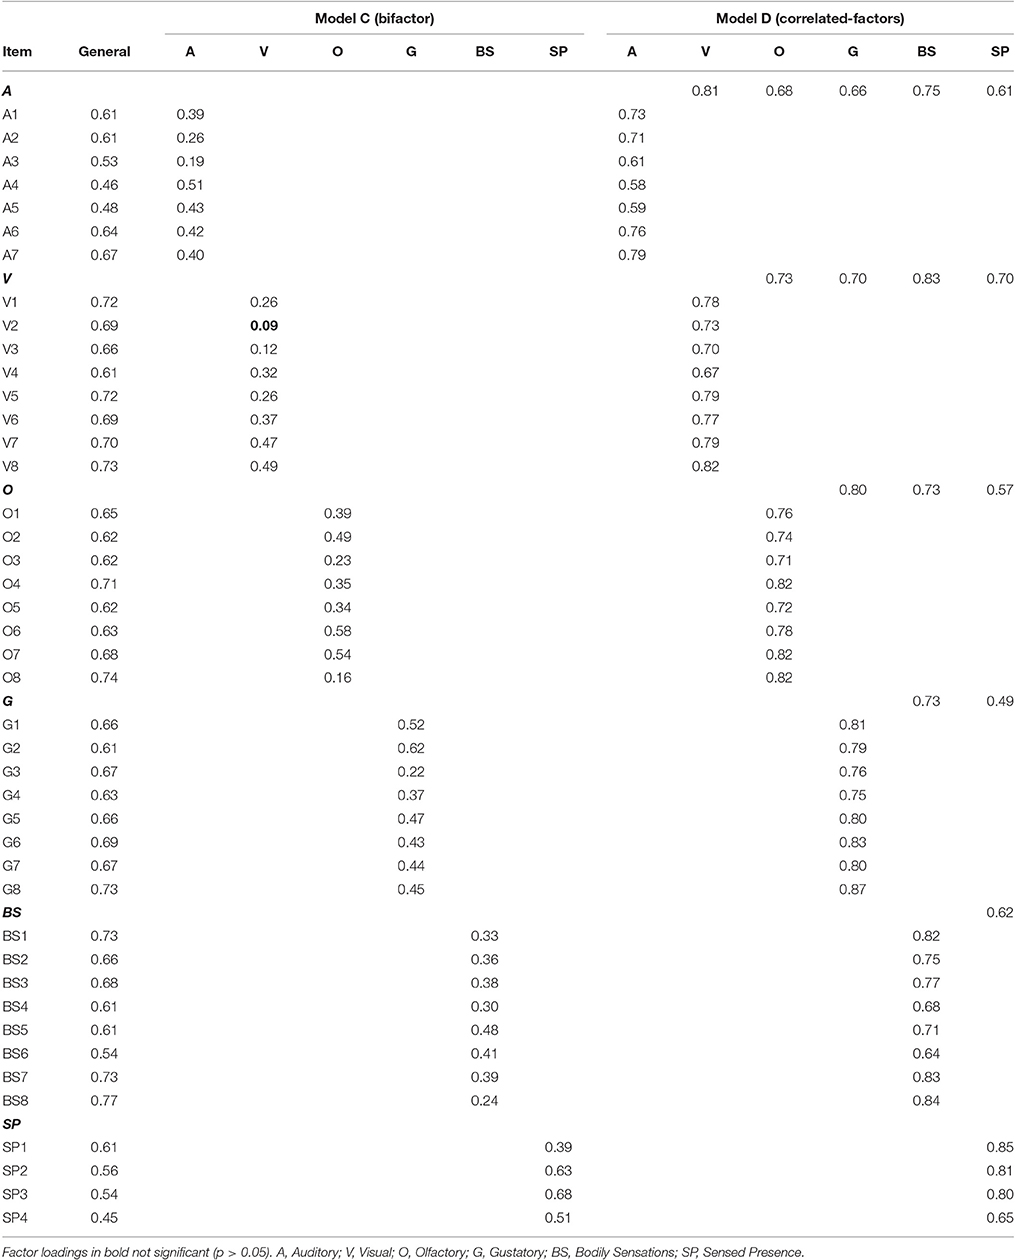
Table 5. Standardized factor loadings (WLSMV) for the bifactor and correlated-factors models in the original sample (N = 513).
In order to determine the strength and importance of the modality factors in the bifactor model, the ωs coefficients and ωh coefficient were estimated. Modality subscales were associated with the following ωs estimates: auditory ωs = 0.26 (typical); visual ωs = 0.14 (relatively small); olfactory ωs = 0.24 (typical); gustatory ωs = 0.29 (typical); bodily sensations ωs = 0.21 (typical); and sensed presence ωs = 0.44 (relatively large). The general factor was found to be associated with a ωh = 0.92. Thus, the subscales appear to account for a relatively small amount of unique variance compared to the variance explained by the general factor.
The Correlated-Factors Model: Six Modality-Specific Dimensions
As shown in Table 3, the correlated-factors model (Figure 1 Model D) fit the data well and was associated with acceptable levels of absolute and incremental close-fit. Standardized factor loadings (see Table 5) were all positive and significant at the p < 0.001 level. The correlations between the sensory modality factors ranged from 0.49 to 0.83, with the strongest correlations yielded between the visual and bodily sensations factors (r = 0.83), followed by the auditory and visual factors (r = 0.81). The TLI difference >0.10 in favor of Model D from Model B suggested practical improvement in model fit for Model D compared to Model B (see Table 3).
Direct comparisons between Model C (bifactor) and Model D (correlated-factors) were not possible as they are not nested models, and the WLSMV estimator does not provide estimations of alternative comparative fit indices (e.g., Akaike information criterion or Bayesian information criterion). Both models appeared to fit the data relatively well, with Model D being the most parsimonious model. A comparison of the specific modality factor loadings for Model C and Model D (see Table 5) found that, generally, loadings were greatly reduced when the general factor was removed in the bifactor model (e.g., item V1 reduced from 0.78 to 0.26). This suggested that the general factor accounted for a majority of the variance between USE in different modalities. However, it is important to note that for some items the difference was minimal (e.g., item A4 Model C = 0.51, Model D = 0.58 and item SP3 Model C = 0.68, Model D = 0.80), which suggests that the specific modality factors still account for some unique variance.
Descriptive Statistics
Given the findings of the factor analyses, the 43-item scale with six modality factors was conceptualized as the Multi-Modality Unusual Sensory Experiences Questionnaire (MUSEQ). Summing item responses on the 0–4 Likert scale, total scores can range from 0 to 172, with possible subscale scores as follows: auditory (0–28), visual (0–32), olfactory (0–32), gustatory (0–32), bodily sensations (0–32), and sensed presence (0–16). Table 6 presents the descriptive statistics associated with the MUSEQ for the non-clinical and clinical samples, as well as the LSHS-M-II, CAPS, and O-LIFE-S for the non-clinical sample.
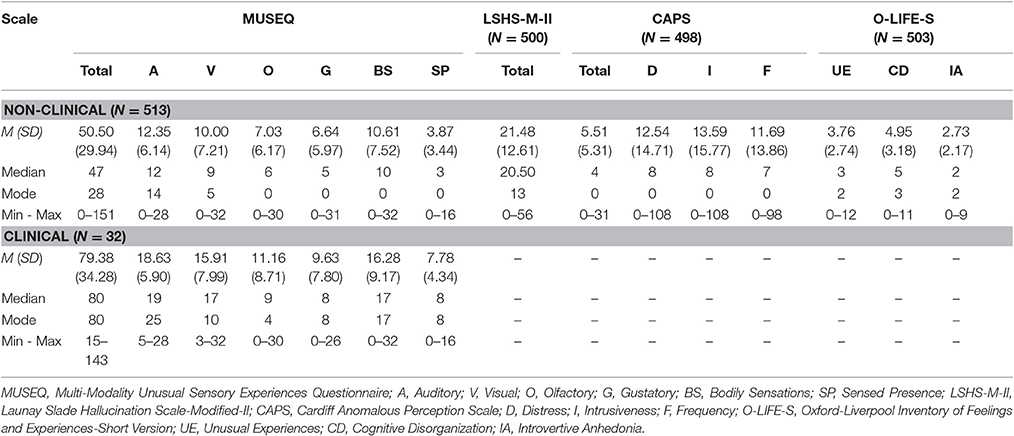
Table 6. Non-clinical and clinical descriptive statistics for the MUSEQ and validation questionnaires.
Reliability
Internal Consistency
The MUSEQ subscales possess good internal consistency with Cronbach's alpha coefficients as follows: auditory α = 0.82; visual α = 0.88; olfactory α = 0.87; gustatory α = 0.88; bodily sensations α = 0.88; sensed presence α = 0.77.
Test-Retest
All subscale and total scores showed acceptable test-retest correlation estimates at the p < 0.001 level: Auditory r = 0.72; Visual: r = 0.72; Olfactory: r = 0.57; Gustatory: r = 0.56; Bodily Sensations: r = 0.70; Sensed Presence: r = 0.69; MUSEQ Total: r = 0.77. In the test-retest sample, the Cronbach's alpha coefficients were estimated at: auditory α = 0.86; visual α = 0.91; olfactory α = 0.92; gustatory α = 0.93; bodily sensations α = 0.88; sensed presence α = 0.85. These results suggested stability of internal consistency over time.
Validity
Convergent and Divergent Validity
The MUSEQ total score and modality subscale scores demonstrated good convergent validity through significant positive correlations with other measures of USE (see Table 7). Good discriminant validity was also observed via small or non-significant correlations of the MUSEQ total and subscale scores with O-LIFE-S subscales that relate to aspects of schizotypy that are not USE (i.e., CD and IA).
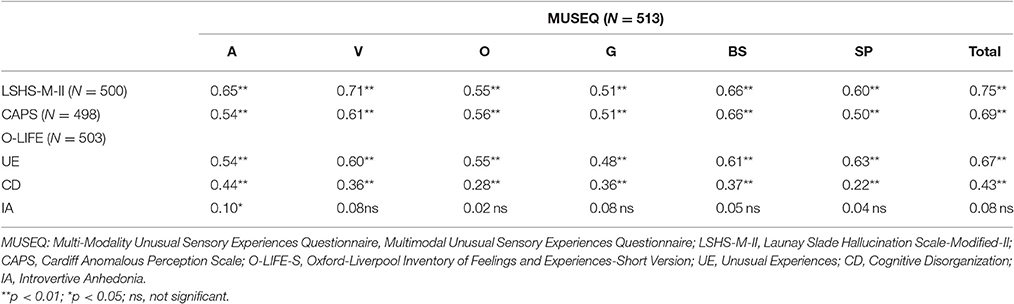
Table 7. Bootstrapped pearson correlations between MUSEQ scores and the LSHS-M-II, CAPS, and O-LIFE-S.
Non-clinical vs. Clinical Group
Table 6 shows the descriptive statistics of the clinical sample. The clinical sample had significantly higher MUSEQ total scores than the non-clinical sample (t[543] = 5.25, p < 0.001, Cohen's d [95% CI] = 0.96 [0.59, 1.32]). The clinical sample also had significantly higher mean scores on every modality subscale compared to the non-clinical sample, with moderate to strong effect sizes (auditory: t[543] = 5.63, p < 0.001, d [95% CI] = 1.02 [0.66, 1.39]; visual: t[543] = 4.46, p < 0.001, d [95% CI] = 0.81 [0.45, 1.17]; olfactory: t[543] = 3.57, p < 0.001, d [95% CI] = 0.65 [0.29, 1.01]; gustatory: t[543] = 2.69, p < 0.05, d [95% CI] = 0.49 [0.13, 0.85]; bodily sensations: t[543] = 4.08, p < 0.01, d [95% CI] = 0.74 [0.38, 1.10]; and sensed presence: t[543] = 6.14, p < 0.001, d [95% CI] = 1.12 [0.75, 1.48]).
Incremental Validity
Participants with sleep disorder reported: sleep apnoea (n = 18), insomnia (n = 18), night terrors (n = 2), sleep paralysis disorder (n = 1), and unspecified (n = 14). Those with a history of eye problems/disease (other than requiring glasses or contacts) reported the following: cataracts (n = 2), conjunctivitis (n = 2), blepharitis (n = 2), astigmatism (n = 3), floaters (n = 4), intraocular pressure (n = 2), macular degeneration (n = 2), amblyopia (n = 2), and other (e.g., cornea transplant, vitreous detachment, optic neuritis; n = 28). Thirty-two participants reported experiencing synaesthesia.
Table 8 shows the results of the t-tests between these groups and participants without a history of these variables. Participants who reported a history of sleep disorder scored significantly higher on the olfactory and gustatory subscales compared to those who did not, but their scores on other subscales and total score did not significantly differ. Individuals with a history of eye problems/disease showed significant elevations on the visual and sensed presence subscales, with non-significant differences on other modalities or total scores. The synaesthesia group scored significantly higher on all modality subscales and MUSEQ total scores compared to those who did not report experiencing synaesthesia. The ability for the MUSEQ subscales to yield group differences on different modality subscales supports its novelty in contrast to existing scales, which are designed to yield a single overall score (i.e., equivalent to the MUSEQ total score). The MUSEQ therefore appears to possess good incremental validity.
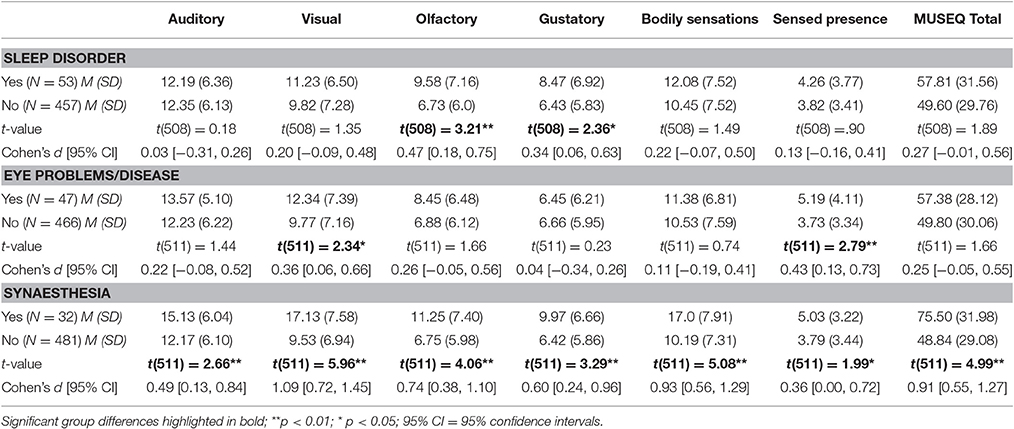
Table 8. Mean Differences on MUSEQ subscales and total scores in participants with and without a history of sleep disorder, eye problems/disease, and synaesthesia.
Replication Sample
Descriptive statistics for the replication sample yielded similar results to the initial sample (see Supplementary Table 1). The four confirmatory factor analysis models (Figure 1) were retested in the replication sample. As can be seen in Table 3, the pattern of model absolute and incremental close-fit fit indices yielded by the analyses were identical to the first study. Specifically, Models B to D yielded acceptable model fit, while Model A showed poor model fit. The correlated-factors model (Model D) showed a practical improvement in fit compared to the second-order model (Model B), but not from the bifactor model (Model C). Models B and C did not differ at the practical level (TLI difference <0.10) of improvement in model fit. Again, Models C and D fit the data well, but Model D was the most parsimonious model. Supplementary Tables 2, 3 show the factor loadings of the four models. Loadings in all four models were significant at the p < 0.001 level, with BS1 and O8 in Model C significant at p < 0.05. In Model D, the correlations between the sensory modality factors ranged from 0.56 to 0.86, with the strongest correlations yielded between the auditory and visual factors (r = 0.86), and the olfactory and gustatory factors (r = 0.86).
The omega coefficients were again estimated for Model C. Modality subscales were associated with the following ωs estimates: auditory ωs = 0.23 (typical); visual ωs = 0.19 (relatively small); olfactory ωs = 0.18 (relatively small); gustatory ωs = 0.22 (typical); bodily sensations ωs = 0.15 (relatively small); and sensed presence ωs = 0.43 (relatively large). The ωh coefficient was 0.93, confirming that in comparison to the modality subscales, the general factor again accounted for most of the reliable variance in the MUSEQ items.
Discussion
The current study aimed to develop a reliable and valid scale that separately assesses USE in six different modalities (auditory, visual, olfactory, gustatory, bodily sensations, and sensed presence). Furthermore, it aimed to evaluate the factorial structure of these experiences and explore whether USE in different modalities could be measured separately in addition to loading onto a general factor. The development of the MUSEQ was theory-driven, and it was hypothesized that the items and modalities would be strongly related (i.e., presence of a general factor), but still uniquely accounting for some unique variance.
Confirmatory factor analyses were used to assess the psychometric quality of the MUSEQ and explore whether USE in different modalities were statistically separable. Four different models were tested: a one-factor model, second-order model, bifactor model, and correlated-factors model. In both the original sample and replication sample, the correlated-factors model and bifactor model showed similar results and yielded the best model fit. The second-order model also fit the data relatively well, but was significantly poorer than the correlated-factors model (but not the bifactor model). The one-factor model fitted the data poorly, suggesting that capturing all of the USE in the MUSEQ under one construct (i.e., a general factor) was not appropriate. All modality factors were positively correlated, which is consistent with previous findings (Launay and Slade, 1981; Morrison et al., 2000; Larøi and Van der Linden, 2005; Bell et al., 2006; Lewandowski et al., 2009; Preti et al., 2014).
All models except the unidimensional model fit well in absolute terms and yielded similar fit indices. This was expected given that the correlated-factors, second-order, and bifactor models frequently yield overlapping fit indices despite their specification of different relationships between the items (see Morgan et al., 2015). Morgan et al. (2015) suggest that approximate fit indices are useful, but that conceptual and substantive grounds must be used in determining which model most appropriately fits the data. In the current study, the bifactor model may be the preferred model compared to the correlated factors model, as the latter does not include a general factor and attributes all the variance to the modality factors. The presence of a general factor, in addition to specific modality factors, is more congruent with the current literature on USE. For example, theoretical models of visual and auditory hallucinations propose a role for both specific sensory activation and general cognitive mechanisms (see Collerton et al., 2005; Barnes and Boubert, 2008; Waters et al., 2012; Shine et al., 2014; Linszen et al., 2016).
Modality Subscales and Group Differences
Relating to this latter point is the issue of whether the modality factors are viable as subscales, as the presence of multidimensionality does not necessarily warrant the creation of subscores (Reise, 2012). The omega subscale coefficients (ωs) obtained from the bifactor model can be considered useful indicators of a factor's unique strength, independent from the general factor, and can also help determine the plausibility of subscales. In the current study, the ωs values obtained in both the original sample and replication sample were relatively low to typical in range (Gignac and Kretzschmar, 2017), but do overlap with coefficients yielded by other psychological measures with strong validity (see Hull et al., 2010; Tiffin and Rolling, 2012; Dombrowski et al., 2015). Despite the dominance of a general factor and low to typical ωs values, we argue that from a theoretical and conceptual point of view, the modality subscales in the MUSEQ still serve a unique function, as indicated by theoretically meaningful group differences yielded on the subscales.
For example, the current results showed individual differences in the profile of USE supporting the notion of the independence of modality factors. The community subgroups reporting the presence of eye disease, sleep disorder, and synaesthesia, each yielded a unique symptom profile. Those with eye problems or disease scored significantly higher on the visual and sensed presence subscales (and not on the other subscales), consistent with visuoperceptual deficits in this group (Schultz and Melzack, 1991; Scott et al., 2001; Collerton et al., 2005; Schwartzman et al., 2008; Vukicevic and Fitzmaurice, 2008), and findings of frequent positive correlations between visual experiences and sensed presence phenomena (Cheyne and Girard, 2007; Fénelon et al., 2011). The group with sleep disorder scored higher on the olfactory and gustatory subscales, which is in line with the reported side effects of sleep medications such as zopiclone (Ohayon, 2000). Finally, individuals with synaesthesia scored significantly higher on all modality subscales (especially visual) consistent with a blurring of sensory function (Baron-Cohen and Harrison, 1997) with a predominance of visual experiences (Novich et al., 2011; Niccolai et al., 2012).
It is important to note that significant differences in subscale scores, but not in the total score, suggests that simply calculating a total score (as is the case with current measures of USE) would fail to identify these individual differences. Thus, modality subscale scores serve a unique purpose by unmasking the presence and frequency of these experiences. The ability to measure USE in this way may be of great value in future research examining individual and group differences regarding modalities. Taking all of our findings into consideration, our hypothesis that USE may form one large constellation with a common core, but with the different modalities accounting for some unique variance, is supported.
What Does the General Factor Represent?
It is also important to acknowledge the dominant general factor in our model. This general factor may represent what is commonly referred to as “hallucination proneness,” which may comprise a range of factors found in individuals with higher levels of USE (e.g., schizotypal traits, sensory disturbances, cognitive difficulties, low mood, and other sociodemographic variables). It could also potentially reflect an accumulation of vulnerability risk factors, based on research suggesting that the presence of hallucinations in one modality increases the risk of hallucinations and USE in other modalities (e.g., Lim et al., 2016; Clark et al., 2017). However, further investigation is required to determine what specifically accounts for the shared variance between modalities.
Psychometric Properties of the MUSEQ
Regarding the MUSEQ more generally, results indicated good internal reliability and acceptable test-retest reliability. The test-retest results may be conservative, given that such analyses assumes a person's true score remains unchanged (Vaz et al., 2013). Participants may have experienced additional experiences on the MUSEQ in the time between measurements. Both MUSEQ total and subscale scores yielded significant positive correlations with other measures of USE indicating good convergent validity. Furthermore, weak and non-significant correlations with the CD and IA subscales of the O-LIFE-S were expected, and indicate good discriminant validity. Overall, these results indicate that the MUSEQ appears to be a reliable and valid instrument.
The MUSEQ also demonstrated good ability to discriminate between clinical and non-clinical groups. The clinical sample had significantly higher MUSEQ scores (all modalities and total) than the non-clinical sample, but with a degree of overlap in the frequency distributions. This finding supports the notion of a psychosis continuum (Johns and Van Os, 2001), and suggests that the MUSEQ may have some applicability in clinical populations. It is important to acknowledge that the subjective experience appears to differ in a qualitative sense between clinical and non-clinical samples (Stanghellini et al., 2012). Given the subjective nature of USE, however, this limitation seems applicable to all individuals, regardless of their level of pathology.
Sensory Modality Findings
Other results obtained from the MUSEQ yielded some interesting findings. At the modality level, auditory and visual experiences were found to be the most common, followed by bodily sensations. Unusual auditory experiences were slightly more common than visual experiences. This outcome appears to contrast with reports that visual experiences may be more common than auditory experiences in the general population (Tien, 1991; Ohayon, 2000; McGrath et al., 2015; Peters et al., 2016). However, there are key differences between the current study and previous studies including the constructs being assessed and methodology. Specifically, the MUSEQ encompasses a continuum of USE, which contrasts with the standard screening questions in prevalence studies that are more reminiscent of clinical experiences (e.g., a single question asking about hearing sounds/voices, or seeing things that others do not). Future research may therefore be required to explore meaningful comparisons of the frequency rates of USE in different modalities.
Frequency data indicated that USE resembling “hallucination” (i.e., items at the end of each modality subscale) occurred on a monthly to annual basis in approximately 5% (for olfactory), 7% (gustatory), 17% (sensed presence), 27% (visual), and 33% (auditory and bodily sensations) of the non-clinical sample. These results are congruent with the lifetime prevalence rates of USE (i.e., hallucinations) in previous large-scale non-clinical studies (Tien, 1991; Ohayon, 2000; Nuevo et al., 2010; McGrath et al., 2015; Peters et al., 2016) and support suggestions that they do not necessarily indicate the presence of psychosis (Linscott and Van Os, 2013; Waters et al., 2017).
An additional finding of interest was the relatively high endorsement of the sensed presence items. Sensed presence experiences are under-researched, with most investigations focusing on specific populations such as the bereaved (Dewi Rees, 1971; Keen et al., 2013; Castelnovo et al., 2015), temporal lobe epilepsy (Cook and Persinger, 1997), and social isolation (Suedfeld and Mocellin, 1987). Despite ongoing debate regarding whether sensed presence experiences are illusionary, hallucinatory, or delusional in nature (Castelnovo et al., 2015), the current results add to the body of evidence showing these types of USE occur in a non-negligible number of people in the general populations (Braithwaite et al., 2013; Castelnovo et al., 2015).
Limitations, Strengths, and Future Directions
The current study possesses some limitations, one being that the predictive validity of the MUSEQ and its subscales was not tested (i.e., the ability for the modality subscales to predict external criterion above and beyond the general factor). The use of bifactor modeling (Model C in the current study) allows such investigations. Future studies may investigate the ability for the MUSEQ subscales to predict theoretically relevant criteria, and such research is currently being pursued by the authors. It is worth noting that the current finding of theoretically meaningful group differences on the MUSEQ subscales does provide some initial support for assessing USE in different modalities.
Another limitation is that invariance testing between groups (e.g., age, students/non-students, and different countries) was not conducted due to insufficient sample size in the required subgroups. However, previous studies have found no significant differences in the frequency of experiences between students and general communities (e.g., Lincoln and Keller, 2008), or between individuals residing in countries of a similar socioeconomic standing (McGrath et al., 2015). One exception is religious beliefs, which are associated with a higher prevalence of hallucinatory phenomena (Pelletier-Baldelli et al., 2014; Steenhuis et al., 2016). Although of interest, exploring such factors was outside the scope of this study. In regard to other invariance factors (e.g., age), only 8.5% of the current sample were older than 50 years of age, and thus it is unlikely this subsample would have significantly affected the results.
While our focus was on the six most common modalities, we are aware of other, less common, modalities such as proprioceptive, kinesthetic, vestibular, temporal, sexual, pain, and cenesthetic (Blom, 2013). There also exists multimodal USE, in which the experience occurs in more than one modality simultaneously or serially (see Lim et al., 2016). There is no doubt that investigating such experiences would be of great value, but this was beyond the scope of the current study. Future adaptations of the scale may wish to consider these other modalities and more complex multimodal experiences, or include sections allowing for qualitative responses about USE in different modalities. The authors are currently working on the addition of other dimensions to the scale such as distress, intrusiveness, and impact, and testing the reliability and validity of these modifications.
A strength of this study included a novel approach which explored the underlying structure of USE in the general population by creating a scale designed to investigate whether there is any use in separating out modalities at the measurement level. Another strength was our sample sizes, allowing sufficient exploration of USE and replication of our results in a separate sample. The MUSEQ also possesses strengths, including the ability to discriminate between different groups across modalities, and the use of a more precise frequency rating scale. Existing measures of USE calculate a total score and use response formats that do not tap into the frequency of unusual experiences, or which target frequency in a non-specific way. The features of the MUSEQ compared to the LSHS-M-II, and O-LIFE are further demonstrated in Table 9. It is hoped that the current findings and the creation of the MUSEQ will aid further investigations of USE in the general population.
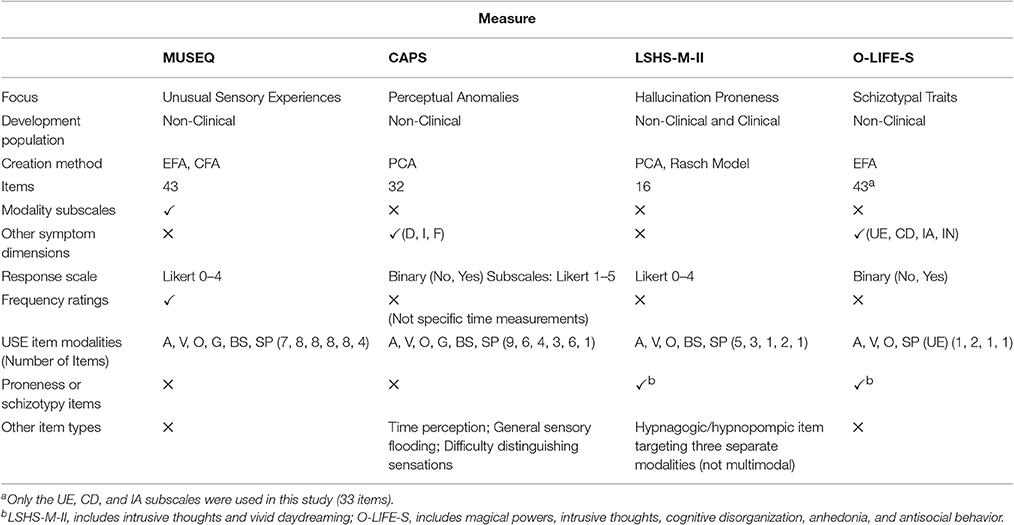
Table 9. Comparison of the MUSEQ, CAPS, LSHS-M-II and O-LIFE-S features.
Conclusion
In conclusion, the MUSEQ is a reliable and valid scale that measures USE in six different modalities. Results suggested that a correlated-factors model and a bifactor model fit the data similarly well, while a one dimensional model fitted poorly. While the unique modality factors accounted for less variance than the general factor, the subscales were able to detect theoretically meaningful differences in groups of individuals with a history of eye problems/disease, sleep disorder, and synaesthesia. This has important implications for the measurement of USE, such that it allows greater specificity and better characterization of experiences while moving away from the commonly used, but poorly defined, construct of “hallucination proneness.” It also indicates that ignoring experiences in commonly under-represented modalities may be slowing progress in understanding such phenomena.
Ethics Statement
This study was carried out in accordance with the recommendations of the “National Statement on Ethical Conduct in Human Research” (National Health and Medical Research Council/Australian Research Council). All participants provided gave written informed consent in accordance with the Declaration of Helsinki. The study protocol was approved the Human Research Ethics Committee of the University of Western Australia.
Author Contributions
CM was the primary developer of the scale, conducted the analyses, interpreted the initial data, and drafted the final manuscript. MM and FW made significant contributions to the conceptual development of the scale, interpretation of the data, and critically revised drafts of the manuscript. SR and DC made significant contributions to the conceptual development of the scale and critically revised drafts of the manuscript. GG provided substantial contribution in regards to data analysis, interpretation, and critically revised drafts of the manuscript. All authors have approved the final version of this manuscript and have agreed to be accountable for all aspects of the work.
Conflict of Interest Statement
The authors declare that the research was conducted in the absence of any commercial or financial relationships that could be construed as a potential conflict of interest.
Acknowledgments
We would like to thank Vivian Chiu for her assistance in collecting the clinical MUSEQ data, and Dr Patrick Dunlop for his guidance with our statistical analyses. The primary author was supported by an Australian Postgraduate Award Scholarship while conducting this study. This research was partly supported by the University of Western Australia, School of Psychological Science External Research Associate funding to SR.
Supplementary Material
The Supplementary Material for this article can be found online at: http://journal.frontiersin.org/article/10.3389/fpsyg.2017.01363/full#supplementary-material
Abbreviations
Analyses: EFA, Exploratory Factor Analysis; CFA, Confirmatory Factor Analysis; PCA, Principal Components Analysis. Modalities: A, Auditory; V, Visual; O, Olfactory; G, Gustatory; BS, Bodily Sensations; SP, Sensed Presence. Scales/Subscales: LSHS-M-II, Launay Slade Hallucination Scale-Modified-II; CAPS, Cardiff Anomalous Perception Scale; D, Distress; I, Intrusiveness; F, Frequency; UE, Unusual Experiences; CD, Cognitive Disorganization; IA, Introvertive Anhedonia; IN, Impulsive Non-Conformity.
References
Andreasen, N. C. (1984). Scale for the Assessment of Positive Symptoms: (SAPS). Iowa City: University of Iowa.
Barnes, J., and Boubert, L. (2008). Executive functions are impaired in patients with Parkinson's disease with visual hallucinations. J. Neurol. Neurosurg. Psychiatr. 79, 190–192. doi: 10.1136/jnnp.2007.116202
Barnes, J., and David, A. S. (2001). Visual hallucinations in Parkinson's disease: a review and phenomenological survey. J. Neurol. Neurosurg. Psychiatr. 70, 727–733. doi: 10.1136/jnnp.70.6.727
Baron-Cohen, S. E., and Harrison, J. E. (1997). Synaesthesia: Classic and Contemporary Readings. Oxford: Blackwell Publishing.
Beavan, V., Read, J., and Cartwright, C. (2011). The prevalence of voice-hearers in the general population: a literature review. J. Ment. Health 20, 281–292. doi: 10.3109/09638237.2011.562262
Bell, V., Halligan, P. W., and Ellis, H. D. (2006). The Cardiff Anomalous Perceptions Scale (CAPS): a new validated measure of anomalous perceptual experience. Schizophr. Bull. 32, 366–377. doi: 10.1093/schbul/sbj014
Blom, J. D. (2013). “Hallucinations and other sensory deceptions in psychiatric disorders,” in The Neuroscience of Hallucinations, eds R. Jardri, A. Cachia, P. Thomas, and D. Pins (New York, NY: Springer), 43–58.
Braithwaite, J. J., Broglia, E., Brincat, O., Stapley, L., Wilkins, A. J., and Takahashi, C. (2013). Signs of increased cortical hyperexcitability selectively associated with spontaneous anomalous bodily experiences in a nonclinical population. Cogn. Neuropsychiatry 18, 549–573. doi: 10.1080/13546805.2013.768176
Brandstaedter, D., Spieker, S., Ulm, G., Siebert, U., Eichhorn, T. E., Krieg, J. C., et al. (2005). Development and evaluation of the Parkinson Psychosis Questionnaire. J. Neurol. 252, 1060–1066. doi: 10.1007/s00415-005-0816-x
Brett, C. M., Peters, E. R., and McGuire, P. K. (2015). Which psychotic experiences are associated with a need for clinical care? Eur. Psychiatry 30, 648–654. doi: 10.1016/j.eurpsy.2014.12.005
Brown, T. A. (2015). Confirmatory Factor Analysis for Applied Research, 2nd Edn. New York, NY: Guilford Press.
Bunney, W. E., Hetrick, W. P., Bunney, B. G., Patterson, J. V., Jin, Y., Potkin, S. G., et al. (1999). Structured interview for assessing perceptual anomalies (SIAPA). Schizophr. Bull. 25, 577–592. doi: 10.1093/oxfordjournals.schbul.a033402
Caspi, A., Houts, R. M., Belsky, D. W., Goldman-Mellor, S. J., Harrington, H., Israel, S., et al. (2014). The p factor: one general psychopathology factor in the structure of psychiatric disorders? Clin. Psychol. Sci. 2, 119–137. doi: 10.1177/2167702613497473
Castelnovo, A., Cavallotti, S., Gambini, O., and D'Agostino, A. (2015). Post-bereavement hallucinatory experiences: a critical overview of population and clinical studies. J. Affect. Disord. 186, 266–274. doi: 10.1016/j.jad.2015.07.032
Chapman, L. J., Chapman, J. P., and Raulin, M. L. (1978). Body-image aberration in Schizophrenia. J. Abnorm. Psychol. 87, 399–407. doi: 10.1037/0021-843X.87.4.399
Cheyne, J. A., and Girard, T. A. (2007). The nature and varieties of felt presence experiences: a reply to Nielsen. Conscious. Cogn. 16, 984–991. doi: 10.1016/j.concog.2007.02.003
Clark, M. L., Waters, F., Vatskalis, T. M., and Jablensky, A. (2017). On the interconnectedness and prognostic value of visual and auditory hallucinations in first-episode psychosis. Eur. Psychiatry 41, 122–128. doi: 10.1016/j.eurpsy.2016.10.011
Collerton, D., Perry, E., and McKeith, I. (2005). Why people see things that are not there: a novel perception and attention deficit model for recurrent complex visual hallucinations. Behav. Brain Sci. 28, 737–757. doi: 10.1017/S0140525X05000130
Cook, C. M., and Persinger, M. A. (1997). Experimental induction of the “sensed presence” in normal subjects and an exceptional subject. Percept. Mot. Skills 85, 683–693. doi: 10.2466/pms.1997.85.2.683
Copeland, J. R., Kelleher, M. J., Kellett, J. M., Gourlay, A. J., Gurland, B. J., Fleiss, J. L., et al. (1976). A semi-structured clinical interview for the assessment of diagnosis and mental state in the elderly: the Geriatric Mental State Schedule: I. Development and reliability. Psychol. Med. 6, 439–449. doi: 10.1017/S0033291700015889
Copolov, D., and Carter, D. (1995). The mental health research institute unusual perceptions schedule (MUPS). Schizophr. Res. 15, 8–9. doi: 10.1016/0920-9964(95)95036-9
Cummings, J. L., Mega, M., Gray, K., Rosenberg-Thompson, S., Carusi, D. A., and Gornbein, J. (1994). The Neuropsychiatric Inventory comprehensive assessment of psychopathology in dementia. Neurology 44, 2308–2308. doi: 10.1212/WNL.44.12.2308
Devanand, D. P., Miller, L., Richards, M., Marder, K., Bell, K., Mayeux, R., et al. (1992). The Columbia University scale for psychopathology in Alzheimer's disease. Arch. Neurol. 49, 371–376. doi: 10.1001/archneur.1992.00530280051022
Dombrowski, S. C., Canivez, G. L., Watkins, M. W., and Beaujean, A. A. (2015). Exploratory bifactor analysis of the Wechsler Intelligence Scale for Children-Fifth Edition with the 16 primary and secondary subtests. Intelligence 53, 194–201. doi: 10.1016/j.intell.2015.10.009
Dominguez, M. D., Wichers, M., Lieb, R., Wittchen, H. U., and van Os, J. (2011). Evidence that onset of clinical psychosis is an outcome of progressively more persistent subclinical psychotic experiences: an 8-year cohort study. Schizophr. Bull. 37, 84–93. doi: 10.1093/schbul/sbp022
Dror, I. E. (2005). Perception is far from perfection: the role of the brain and mind in constructing realities. Behav. Brain Sci. 28, 763–763. doi: 10.1017/S0140525X05270139
Eckbald, M., and Chapman, L. J. (1983). Magical ideation as an indicator of schizotypy. J. Consult. Clin. Psychol. 51, 215–225. doi: 10.1037/0022-006X.51.2.215
Fénelon, G., Soulas, T., Cleret de Langavant, L., Trinkler, I., and Bachoud-Lévi, A. C. (2011). Feeling of presence in Parkinson's disease. J. Neurol. Neurosur. Psychiatr. 82, 1219–1224. doi: 10.1136/jnnp.2010.234799
Ford, A., and Almeida, O. P. (2014). “Psychosis in older adults and dementia populations,” in The Assessment of Psychosis: A Reference Book and Rating Scales for Research and Practice, eds F. Waters and M. Stephane (New York, NY: Routledge), 150–162.
García-Ptacek, S., García Azorín, D., Salmador, R. S., Cuadrado, M. L., and Porta-Etessam, J. (2013). Hallucinations and aberrant perceptions are prevalent among the young healthy adult population. Neurologia 28, 19–23. doi: 10.1016/j.nrl.2012.02.004
Gauntlett-Gilbert, J., and Kuipers, E. (2005). Visual hallucinations in psychiatric conditions: appraisals and their relationship to distress. Br. J. Clin. Psychol. 44, 77–87. doi: 10.1348/014466504x19451
Gignac, G. E. (2016). The higher-order model imposes a proportionality constraint: that is why the bifactor model tends to fit better. Intelligence 55, 57–68. doi: 10.1016/j.intell.2016.01.006
Gignac, G. E., and Kretzschmar, A. (2017). Evaluating dimensional distinctness with correlated-factor models: limitations and suggestions. Intelligence., 62, 138–147. doi: 10.1016/j.intell.2017.04.001
Haddock, G., McCarron, J., Tarrier, N., and Faragher, E. B. (1999). Scales to measure dimensions of hallucinations and delusions: the psychotic symptom rating scales (PSYRATS). Psychol. Med. 29, 879–889. doi: 10.1017/S0033291799008661
Hull, D. M., Beaujean, A. A., Worrell, F. C., and Verdisco, A. E. (2010). An item-level examination of the factorial validity of neo five-factor inventory scores. Educ. Psychol. Meas. 70, 1021–1041. doi: 10.1177/0013164410378091
Jansson, L. (2014). “Near-psychotic phenomena in a clinical context,” in The Assessment of Psychosis: A Reference Book and Rating Scales for Research and Practice, eds F. Waters and M. Stephane (New York, NY: Routledge), 55–74.
Jardri, R., Thomas, P., Delmaire, C., Delion, P., and Pins, D. (2013). The neurodynamic organization of modality-dependent hallucinations. Cereb. Cortex 23, 1108–1117. doi: 10.1093/cercor/bhs082
Johns, L. C., and van Os, J. (2001). The continuity of psychotic experiences in the general population. Clin. Psychol. Rev. 21, 1125–1141. doi: 10.1016/S0272-7358(01)00103-9
Kaymaz, N., and van Os, J. (2010). Extended psychosis phenotype–yes: single continuum–unlikely. Psychol. Med. 40, 1963–1966. doi: 10.1017/S0033291710000358
Keen, C., Murray, C. D., and Payne, S. (2013). A qualitative exploration of sensing the presence of the deceased following bereavement. Mortality 18, 339–357. doi: 10.1080/13576275.2013.819320
Kråkvik, B., Larøi, F., Kalhovde, A. M., Hugdahl, K., Kompus, K., Salvesen, Ø., et al. (2015). Prevalence of auditory verbal hallucinations in a general population: a group comparison study. Scand. J. Psychol. 56, 508–515. doi: 10.1111/sjop.12236
Kwapil, T. R., Chapman, J. P., Chapman, L. J., and Miller, M. B. (1996). Deviant olfactory experiences as indicators of risk for psychosis. Schizophr. Bull. 22, 371–382. doi: 10.1093/schbul/22.2.371
Laceulle, O. M., Vollebergh, W. A., and Ormel, J. (2015). The structure of psychopathology in adolescence replication of a general psychopathology factor in the TRAILS Study. Clin. Psychol. Sci. 3, 850–860. doi: 10.1177/2167702614560750
Lahey, B. B., Applegate, B., Hakes, J. K., Zald, D. H., Hariri, A. R., and Rathouz, P. J. (2012). Is there a general factor of prevalent psychopathology during adulthood? J. Abnorm. Psychol. 121, 971–977. doi: 10.1037/a0028355
Larøi, F. (2006). The phenomenological diversity of hallucinations: some theoretical and clinical implications. Psychol. Belg. 46, 163–183. doi: 10.5334/pb-46-1-2-163
Larøi, F., Marczewski, P., and Van der Linden, M. (2004). Further evidence of the multi-dimensionality of hallucinatory predisposition: factor structure of a modified version of the Launay-Slade Hallucinations Scale in a normal sample. Eur. Psychiatry 19, 15–20. doi: 10.1016/S0924-9338(03)00028-2
Larøi, F., Raballo, A., and Bell, V. (2014). “Psychosis-like experiences in non-clinical populations,” in The Assessment of Psychosis: A Reference Book and Rating Scales for Research and Practice, F. Waters and M. Stephane (New York: Routledge), 92–101.
Larøi, F., and Van der Linden, M. (2005). Nonclinical Participants' reports of hallucinatory experiences. Can. J. Behav. Sci. 37, 33–43. doi: 10.1037/h0087243
Launay, G., and Slade, P. (1981). The measurement of hallucinatory predisposition in male and female prisoners. Pers. Individ. Dif. 2, 221–234. doi: 10.1016/0191-8869(81)90027-1
Lawrie, S. M., Hall, J., McIntosh, A. M., Owens, D. G., and Johnstone, E. C. (2010). The ‘continuum of psychosis’: scientifically unproven and clinically impractical. Br. J. Psychiatry 197, 423–425. doi: 10.1192/bjp.bp.109.072827
Lewandowski, K. E., DePaola, J., Camsari, G. B., Cohen, B. M., and Ongur, D. (2009). Tactile, olfactory, and gustatory hallucinations in psychotic disorders: a descriptive study. Ann. Acad. Med. Singapore 38, 383–385.
Lim, A., Hoek, H. W., Deen, M. L., Blom, J. D., and GROUP Investigators (2016). Prevalence and classification of hallucinations in multiple sensory modalities in schizophrenia spectrum disorders. Schizophr. Res. 176, 493–499. doi: 10.1016/j.schres.2016.06.010
Lincoln, T. M., and Keller, E. (2008). Delusions and hallucinations in students compared to the general population. Psychol. Psychother. Theory Res. Practice 81, 231–235. doi: 10.1348/147608308X297096
Linscott, R. J., and Van Os, J. (2013). An updated and conservative systematic review and meta-analysis of epidemiological evidence on psychotic experiences in children and adults: on the pathway from proneness to persistence to dimensional expression across mental disorders. Psychol. Med. 43, 1133–1149. doi: 10.1017/S0033291712001626
Linszen, M. M., Brouwer, R. M., Heringa, S. M., and Sommer, I. E. (2016). Increased risk of psychosis in patients with hearing impairment: review and meta-analyses. Neurosci. Biobehav. Rev. 62, 1–20. doi: 10.1016/j.neubiorev.2015.12.012
Luhrmann, T. M. (2011). Hallucinations and sensory overrides. Annu. Rev. Anthropol. 40, 71–85. doi: 10.1146/annurev-anthro-081309-145819
Mason, O., Claridge, G., and Jackson, M. (1995). New scales for the assessment of schizotypy. Pers. Individ. Dif. 18, 7–13. doi: 10.1016/0191-8869(94)00132-C
Mason, O., Linney, Y., and Claridge, G. (2005). Short scales for measuring schizotypy. Schizophr. Res. 78, 293–296. doi: 10.1016/j.schres.2005.06.020
McGartland Rubio, D., Berg-Weger, M., and Tebb, S. S. (2001). Using structural equation modeling to test for multidimensionality. Struct. Eq. Model. 8, 613–626. doi: 10.1207/S15328007SEM0804_06
McGrath, J. J., Saha, S., Al-Hamzawi, A., Alonso, J., Bromet, E. J., Bruffaerts, R., et al. (2015). Psychotic experiences in the general population: a cross-national analysis based on 31 261 respondents from 18 countries. JAMA Psychiatry 72, 697–705. doi: 10.1001/jamapsychiatry.2015.0575
Meehl, P. E. (1962). Schizotaxia, schizotypy, schizophrenia. Am. Psychol. 17, 827. doi: 10.1037/h0041029
Muthén, L. K., and Muthén, B. O. (1998-2012). Mplus User's Guide, 7th Edn. Los Angeles, CA: Muthén Muthén.
Morgan, G. B., Hodge, K. J., Wells, K. E., and Watkins, M. W. (2015). Are fit indices biased in favor of bi-factor models in cognitive ability research? A comparison of fit in correlated factors, higher-order, and bi-factor models via Monte Carlo simulations. J. Intell. 3, 2–20. doi: 10.3390/jintelligence3010002
Morrison, A. P., Wells, A., and Nothard, S. (2000). Cognitive factors in predisposition to auditory and visual hallucinations. Br. J. Clin. Psychol. 39, 67–78. doi: 10.1348/014466500163112
Mosimann, U. P., Collerton, D., Dudley, R., Meyer, T. D., Graham, G., Dean, J. L., et al. (2008). A semi-structured interview to assess visual hallucinations in older people. Int. J. Geriatr. Psychiatry 3, 712–718. doi: 10.1002/gps.1965
Niccolai, V., Jennes, J., Stoerig, P., and Van Leeuwen, T. M. (2012). Modality and variability of synesthetic experience. Am. J. Psychol. 125, 81–94. doi: 10.5406/amerjpsyc.125.1.0081
Novich, S., Cheng, S., and Eagleman, D. M. (2011). Is synaesthesia one condition or many? A large-scale analysis reveals subgroups. J. Neuropsychol. 5, 353–371. doi: 10.1111/j.1748-6653.2011.02015.x
Nuevo, R., Chatterji, S., Verdes, E., Naidoo, N., Arango, C., and Ayuso-Mateos, J. L. (2010). The continuum of psychotic symptoms in the general population: a cross-national study. Schizophr. Bull. 38, 531–542. doi: 10.1093/schbul/sbq099
Ohayon, M. M. (2000). Prevalence of hallucinations and their pathological associations in the general population. Psychiatry Res. 97, 153–164. doi: 10.1016/S0165-1781(00)00227-4
Osborne, J. W., and Costello, A. B. (2009). Best practices in exploratory factor analysis: four recommendations for getting the most from your analysis. Pan-Pac. Manage. Rev. 12, 131–146.
Papapetropoulos, S., Katzen, H., Schrag, A., Singer, C., Scanlon, B. K., Nation, D., et al. (2008). A questionnaire-based (UM-PDHQ) study of hallucinations in Parkinson's disease. BMC Neurol. 8:21. doi: 10.1186/1471-2377-8-21
Parnas, J., Møller, P., Kircher, T., Thalbitzer, J., Jansson, L., Handest, P., et al. (2005). EASE: examination of anomalous self-experience. Psychopathology 38, 236–258. doi: 10.1159/000088441
Pechey, R., and Halligan, P. (2012). Prevalence and correlates of anomalous experiences in a large non-clinical sample. Psychol. Psychother. Theory Res. Practice 85, 150–162. doi: 10.1111/j.2044-8341.2011.02024.x
Pelletier-Baldelli, A., Dean, D. J., Lunsford-Avery, J. R., Smith Watts, A. K., Orr, J. M., Gupta, T., et al. (2014). Orbitofrontal cortex volume and intrinsic religiosity in non-clinical psychosis. Psychiatry Res. Neuroimaging 222, 124–130. doi: 10.1016/j.pscychresns.2014.03.010
Peters, E. R., Joseph, S. A., and Garety, P. A. (1999). Measurement of delusional ideation in the normal population: introducing the PDI (Peters et al. Delusions Inventory). Schizophrenia Bull. 25, 553–576. doi: 10.1093/oxfordjournals.schbul.a033401
Peters, E., Ward, T., Jackson, M., Morgan, C., Charalambides, M., McGuire, P., et al. (2016). Clinical, socio-demographic and psychological characteristics in individuals with persistent psychotic experiences with and without a “need for care”. World Psychiatry 15, 41–52. doi: 10.1002/wps.20301
Preti, A., Sisti, D., Rocchi, M. B., Siddi, S., Cella, M., Masala, C., et al. (2014). Prevalence and dimensionality of hallucination-like experiences in young adults. Compr. Psychiatry 55, 826–836. doi: 10.1016/j.comppsych.2014.01.015
Raine, A., and Benishay, D. (1995). The SPQ-B: a brief screening instrument for schizotypal personality disorder. J. Pers. Disord. 9, 346–355. doi: 10.1521/pedi.1995.9.4.346
Reininghaus, U., Priebe, S., and Bentall, R. P. (2013). Testing the psychopathology of psychosis: evidence for a general psychosis dimension. Schizophr. Bull. 39, 884–895. doi: 10.1093/schbul/sbr182
Reise, S. P. (2012). The rediscovery of bifactor measurement models. Multiv. Behav. Res. 47, 667–696. doi: 10.1080/00273171.2012.715555
Reise, S. P., Bonifay, W. E., and Haviland, M. G. (2013). Scoring and modeling psychological measures in the presence of multidimensionality. J. Pers. Assess. 95, 129–140. doi: 10.1080/00223891.2012.725437
Santhouse, A. M., Howard, R. J., and ffytche, D. H. (2000). Visual hallucinatory syndromes and the anatomy of the visual brain. Brain 123, 2055–2064. doi: 10.1093/brain/123.10.2055
Schultz, G., and Melzack, R. (1991). The Charles Bonnet syndrome:‘phantom visual images’. Perception 20, 809–825. doi: 10.1068/p200809
Schwartzman, D., Maravic, K., Kranczioch, C., and Barnes, J. (2008). Altered early visual processing components in hallucination-prone individuals. Neuroreport 19, 933–937. doi: 10.1097/WNR.0b013e328301a640
Schweizer, K. (2010). Some guidelines concerning the modeling of traits and abilities in test construction. Eur. J. Psychol. Assess. 26, 1–2. doi: 10.1027/1015-5759/a000001
Scott, I. U., Schein, O. D., Feuer, W. J., and Folstein, M. F. (2001). Visual hallucinations in patients with retinal disease. Am. J. Ophthalmol. 131, 590–598. doi: 10.1016/S0002-9394(01)00833-9
Shevlin, M., Dorahy, M., and Adamson, G. (2007). Childhood traumas and hallucinations: an analysis of the National Comorbidity Survey. J. Psychiatr. Res. 41, 222–228. doi: 10.1016/j.jpsychires.2006.03.004
Shevlin, M., McElroy, E., Bentall, R. P., Reininghaus, U., and Murphy, J. (2016). The psychosis continuum: testing a bifactor model of psychosis in a general population sample. Schizophr. Bull. 43, 133–141. doi: 10.1093/schbul/sbw067
Shine, J. M., O'Callaghan, C., Halliday, G. M., and Lewis, S. J. (2014). Tricks of the mind: visual hallucinations as disorders of attention. Prog. Neurobiol. 116, 58–65. doi: 10.1016/j.pneurobio.2014.01.004
Stanghellini, G., Langer, A. I., Ambrosini, A., and Cangas, A. J. (2012). Quality of hallucinatory experiences: differences between a clinical and a non-clinical sample. World Psychiatry 11, 110–113. doi: 10.1016/j.wpsyc.2012.05.007
Steenhuis, L. A., Bartels-Velthuis, A. A., Jenner, J. A., Aleman, A., Bruggeman, R., Nauta, M. H., et al. (2016). Religiosity in young adolescents with auditory vocal hallucinations. Psychiatry Res. 236, 158–164. doi: 10.1016/j.psychres.2015.12.014
Stefanis, N. C., Hanssen, M., Smirnis, N. K., Avramopoulos, D. A., Evdokimidis, I. K., Stefanis, C. N., et al. (2002). Evidence that three dimensions of psychosis have a distribution in the general population. Psychol. Med. 32, 347–358. doi: 10.1017/S0033291701005141
Stephane, M., Starkstein, S., and Pahissa, J. (2014). “Psychosis in general medical and neurological conditions,” in The Assessment of Psychosis: A Reference Book and Rating Scales for Research and Practice, ed F. Waters and M. Stephane (New York, NY: Routledge), 136–149.
Stevenson, R. J., Langdon, R., and McGuire, J. (2011). Olfactory hallucinations in schizophrenia and schizoaffective disorder: a phenomenological survey. Psychiatry Res. 185, 321–327. doi: 10.1016/j.psychres.2010.07.032
Suedfeld, P., and Mocellin, J. S. (1987). The “sensed presence” in unusual environments. Environ. Behav. 19, 33–52. doi: 10.1177/0013916587191002
Ten Holt, J. C., van Duijn, M. A., and Boomsma, A. (2010). Scale construction and evaluation in practice: a review of factor analysis vs item response theory applications. Psychol. Test Assess. Model. 52, 272–297.
Teunisse, R. J., Cruysberg, J. R., Hoefnagels, W. H., Verbeek, A. L., and Zitman, F. G. (1996). Visual hallucinations in psychologically normal people: charles Bonnet's syndrome. Lancet 347, 794–797.
Tien, A. Y. (1991). Distribution of hallucinations in the population. Soc. Psychiatry Psychiatr. Epidemiol. 26, 287–292. doi: 10.1007/BF00789221
Tiffin, P. A., and Rolling, K. (2012). Structure of the Health of the Nation Outcome Scales for Children and Adolescents: an ordinal factor analysis of clinician ratings of a sample of young people referred to community mental health services. Psychiatry Res. 197, 154–162. doi: 10.1016/j.psychres.2012.02.007
Vaz, S., Falkmer, T., Passmore, A. E., Parsons, R., and Andreou, P. (2013). The case for using the repeatability coefficient when calculating test–retest reliability. PLoS ONE 8:e73990. doi: 10.1371/journal.pone.0073990
Voss, T., Bahr, D., Cummings, J., Mills, R., Ravina, B., and Williams, H. (2013). Performance of a shortened Scale for Assessment of Positive Symptoms for Parkinson's disease psychosis. Parkins. Related Disord. 19, 295–299. doi: 10.1016/j.parkreldis.2012.10.022
Vukicevic, M., and Fitzmaurice, K. (2008). Butterflies and black lacy patterns: the prevalence and characteristics of Charles Bonnet hallucinations in an Australian population. Clin. Exp. Ophthalmol. 36, 659–665. doi: 10.1111/j.1442-9071.2008.01814.x
Waldman, I. D., Poore, H. E., van Hulle, C., Rathouz, P. J., and Lahey, B. B. (2016). External validity of a hierarchical dimensional model of child and adolescent psychopathology: tests using confirmatory factor analyses and multivariate behavior genetic analyses. J. Abnorm. Psychol. 125, 1053–1066. doi: 10.1037/abn0000183
Waters, F., Allen, P., Aleman, A., Fernyhough, C., Woodward, T. S., Badcock, J. C., et al. (2012). Auditory hallucinations in schizophrenia and nonschizophrenia populations: a review and integrated model of cognitive mechanisms. Schizophr. Bull. 38, 683–693. doi: 10.1093/schbul/sbs045
Waters, F., Blom, J. D., Jardri, R., Hugdahl, K., and Sommer, I. (2017). Auditory hallucinations, not necessarily a hallmark of psychotic disorder. Psychol. Med.
Waters, F., Collerton, D., Ffytche, D. H., Jardri, R., Pins, D., Dudley, R., et al. (2014a). Visual hallucinations in the psychosis spectrum and comparative information from neurodegenerative disorders and eye disease. Schizophr. Bull. 40, S233–S245. doi: 10.1093/schbul/sbu036
Waters, F., Connors, M. H., and Langdon, R. (2014b). “Visual, olfactory, gustatory and somatic hallucinations,” in The Assessment of Psychosis: A Reference Book and Rating Scales for Research and Practice, eds F. Waters and M. Stephane (New York: Routledge), 181–194.
Weiss, A. P., and Heckers, S. (1999). Neuroimaging of hallucinations: a review of the literature. Psychiatry Res. Neuroimaging 92, 61–74. doi: 10.1016/S0925-4927(99)00041-4
Williams, D. R., Warren, J. D., and Lees, A. J. (2008). Using the presence of visual hallucinations to differentiate Parkinson's disease from atypical parkinsonism. J. Neurol. Neurosurg. Psychiatr. 79, 652–655. doi: 10.1136/jnnp.2007.124677
Wing, J. K., Babor, T., Brugha, T., Burke, J., Cooper, J. E., Giel, R., et al. (1990). SCAN: schedules for clinical assessment in neuropsychiatry. Arch. Gen. Psychiatry 47, 589–593. doi: 10.1001/archpsyc.1990.01810180089012
Wing, J. K., Cooper, J. E., and Sartorius, N. (1974). Present state examination. Measurement and Classification of Psychiatric Symptoms; an Instruction Manual for the PSE and Catego Program. London: Cambridge University Press.
Keywords: hallucination, voices, visions, sensed presence, perception, sensory modalities, self-report scale, proneness
Citation: Mitchell CAA, Maybery MT, Russell-Smith SN, Collerton D, Gignac GE and Waters F (2017) The Structure and Measurement of Unusual Sensory Experiences in Different Modalities: The Multi-Modality Unusual Sensory Experiences Questionnaire (MUSEQ). Front. Psychol. 8:1363. doi: 10.3389/fpsyg.2017.01363
Received: 18 May 2017; Accepted: 27 July 2017;
Published: 11 August 2017.
Edited by:
Anne Giersch, Institut National de la Santé et de la Recherche Médicale, FranceReviewed by:
Sohee Park, Vanderbilt University, United StatesBrian P. Keane, Robert Wood Johnson Medical School, United States
Copyright © 2017 Mitchell, Maybery, Russell-Smith, Collerton, Gignac and Waters. This is an open-access article distributed under the terms of the Creative Commons Attribution License (CC BY). The use, distribution or reproduction in other forums is permitted, provided the original author(s) or licensor are credited and that the original publication in this journal is cited, in accordance with accepted academic practice. No use, distribution or reproduction is permitted which does not comply with these terms.
*Correspondence: Claire A. A. Mitchell, Y2xhaXJlLm1pdGNoZWxsQHJlc2VhcmNoLnV3YS5lZHUuYXU=