 Lorena Vallejo1
 Mariola Zapater-Fajarí1
 Teresa Montoliu1
 Sara Puig-Perez2
 Juan Nacher3,4
 Vanesa Hidalgo1,5
 Alicia Salvador1,3*
- 1Laboratory of Social Cognitive Neuroscience, Department of Psychobiology and University Institute for Research in Psychology of Human Resources, Organizational Development and Quality of Work Life (IDOCAL), University of Valencia, Valencia, Spain
- 2Department of Health Sciences, Valencian International University, Valencia, Spain
- 3Valencian (VLC) Campus Research Microcluster “Technologies of Information and Control Applied to the Pathophysiology and Treatment of Diabetes,” University of Valencia, Valencia, Spain
- 4Centro de Investigación Biomédica en Red de Salud Mental: Spanish National Network of Research in Mental Health, Madrid, Spain
- 5II Aragón, Department of Psychology and Sociology, Area of Psychobiology, University of Zaragoza, Teruel, Spain
Type 2 diabetes (T2D) has been considered a public health threat due to its growing prevalence, particularly in the older population. It is important to know the effects of psychosocial stress and its potential consequences for some basic cognitive processes that are important in daily life. Currently, there is very little information about how people with T2D face acute psychosocial stressors, and even less about how their response affects working memory (WM), which is essential for their functionality and independence. Our aim was to characterize the response to an acute laboratory psychosocial stressor and its effects on WM in older people with T2D. Fifty participants with T2D from 52 to 77 years old were randomly assigned to a stress (12 men and 12 women) or control (12 men and 14 women) condition. Mood and physiological (cortisol, C, and salivary alpha-amylase, sAA) responses to tasks were measured. In addition, participants completed a WM test before and after the stress or control task. Our results showed that the TSST elicited higher negative affect and greater C and sAA responses than the control task. No significant differences in WM were observed depending on the exposure to stress or the control task. Finally, participants who showed higher C and sAA responses to the stressor had lower WM performance. Our results indicate that medically treated older adults with T2D show clear, typical mood and physiological responses to an acute psychosocial stressor. Finally, the lack of acute psychosocial stress effects on WM suggests that it could be related to aging and not to this disease, at least when T2D is adequately treated.
Introduction
Type 2 diabetes (T2D) has been considered a public health threat (Rucker et al., 2012) because of its growing prevalence (Exalto et al., 2013), particularly in the older population (Rucker et al., 2012). Disturbances in blood glucose (BG) homeostasis in these individuals can lead to transient or permanent alterations, such as decreased psychomotor speed and memory deficits (Yeung et al., 2009). In addition, learning also seems to be very sensitive to glycemic variations (Ryan and Geckle, 2000) and poorer metabolic control (Ryan et al., 2016), which are associated with the development of cognitive complications (Ryan et al., 2006) and a faster decline on memory measures compared to normo-glycemic subjects (Tuligenga et al., 2014). Furthermore, reduced frontal lobe/executive function has been found in the T2D population, including in certain memory domains such as working memory (WM) (Kim, 2019). Prefrontal cortex also contributes to other cognitive functions, such as reasoning, planning, and decision-making (Funahashi, 2015, 2017), which are essential for well-being and quality of life. Hence, the impact of T2D on these cognitive functions is a crucial topic that should be addressed.
In this sense, Ryan et al. (2006) reported that subjects with poor glycemic control had difficulty performing the WM tasks. Furthermore, WM impairments associated with episodes of both hypoglycemia (Aung et al., 2012) and hyperglycemia (Cerasuolo and Izzo, 2017) have been found in diagnosed T2D patients. However, Arvanitakis et al. (2006) concluded that T2D was not associated with worse WM performance.
There is a large body of evidence about the relationship between stress and T2D. In fact, chronic stress seems to play an important role in the etiology (Surwit et al., 1992) and development of T2D (Agardh et al., 2003; Heraclides et al., 2009; Eriksson et al., 2013; Hackett and Steptoe, 2016). In this line, Mommersteeg et al. (2012) showed that high psychological distress was a risk factor for the development of diabetes in an 18-year follow-up study. Furthermore, a prospective 35-year follow-up study reported that high perceived stress in adulthood increased the risk of T2D (Novak et al., 2012). It has been well established that the exposure to stress is associated with the activation of both the sympathetic nervous system (SNS) and the hypothalamic-pituitary-adrenal (HPA) axis. Consequently, large amounts of alpha-amylase (an indirect marker of SNS) and cortisol (C), the main human glucocorticoid, are secreted. The chronic activation of these two systems produces an increase in BG levels, contributing to T2D development (Boaz et al., 2013; Lundqvist et al., 2019).
Regarding acute stress, higher glucose and C levels were reported in T2D patients after exposure to a psychosocial stressor (i.e., Trier Social Stress Test, TSST), in comparison with a control session (Faulenbach et al., 2011). However, significant C decreases immediately after a mental stressor have also been found and interpreted as a disruption in stress-related biological systems (Steptoe et al., 2014; Carvalho et al., 2015). To the best of our knowledge, no previous study has investigated the salivary alpha-amylase (sAA) response to an acute stress in T2D patients. Only one study has analyzed the relationships between sAA levels and perceived stress in T2D patients (Siddiqui et al., 2015), and it reported a positive relationship between them.
It has been well established that acute stress affects memory processes (Lindau et al., 2016; Hidalgo et al., 2019), given that there is an overlap of the brain structures involved in the stress response and memory processes. Specifically, the prefrontal cortex and the hippocampus, brain areas with a high density of glucocorticoid receptors, are involved in WM (Galloway et al., 2008; Kumar et al., 2016). It is important to note that most of the studies investigating stress-induced cortisol effects on WM have been carried out in healthy young people (for a review see Hidalgo et al., 2019), with only one in healthy older people (Pulopulos et al., 2015). In this study, the authors failed to find acute stress effects on WM performance, even though participants showed C and sAA responses to the TSST.
In addition, there is evidence of an association between cognitive performance in T2D and hippocampal integrity (Jones et al., 2014). This structure is especially sensitive to the effects of hypoglycemia (Marks and Rose, 1965) and higher BG levels, leading to hippocampus and amygdala atrophy (Cherbuin et al., 2012). Hippocampal atrophy was found in individuals with T2D, which could correlate with impairments in immediate memory (Gold et al., 2007). However, no previous studies have investigated the acute effects of stress on WM in T2D older people in spite of, as noted above, T2D patients show deficits in WM (for reviews see: Palta et al., 2014; Pelimanni and Jehkonen, 2018; Kim, 2019).
Hence, the aim of the present study was to assess the psychobiological (i.e., mood, sAA, and C) response to an acute stressor (i.e., TSST) and its effect on WM performance in diagnosed and medically treated older people with T2D. We expected that participants in the stress condition would show increases in negative mood and decreases in positive mood (Almela et al., 2011; Hidalgo et al., 2020) and higher C and sAA levels (Almela et al., 2011; Pulopulos et al., 2015) than participants in the control condition. In spite of the lack of significant findings in healthy older people (Pulopulos et al., 2015), based on worse WM performance in people with T2D (Gorniak et al., 2018), we expected that acute stress would impair WM performance.
Materials and Methods
Participants
The final sample was composed of 50 participants from 52 to 77 years old, 24 men and 26 women, with a medical diagnosis of T2D. They were randomly assigned to two conditions in a counter-balanced way: 24 to the stress condition (12 men and 12 women) and 26 to the control condition (12 men and 14 women). No gender differences were found between the two conditions (X2 = 0.074, p = 0.786) (see Table 1 for sample characteristics).
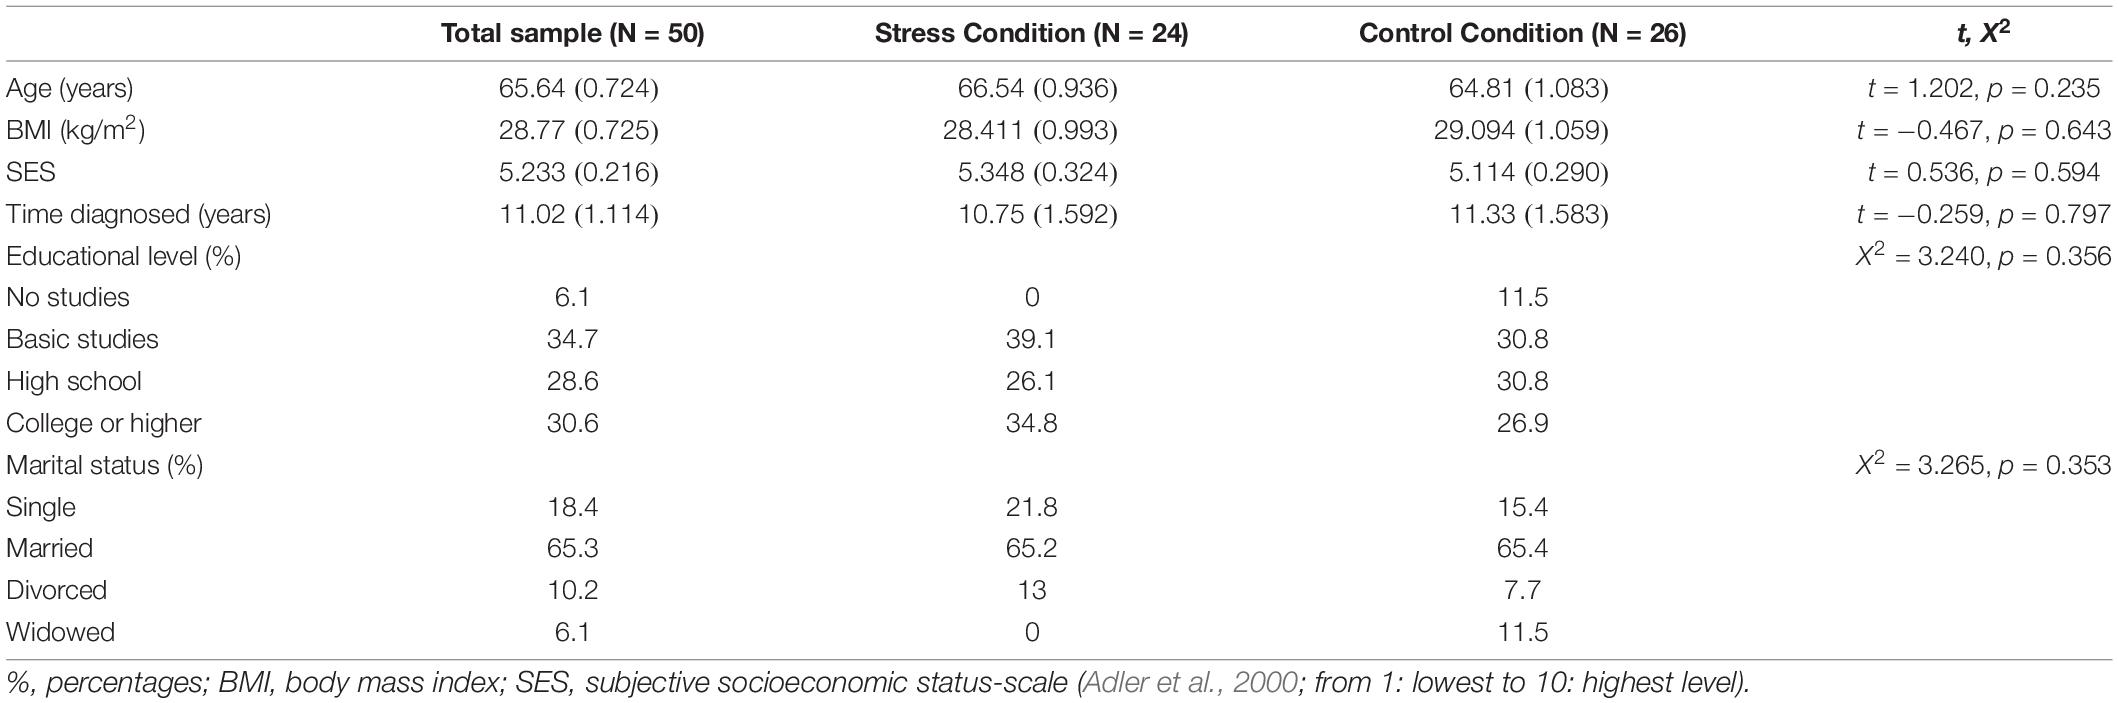
Table 1. Descriptive statistics (mean ± SEM) for total sample and both experimental conditions.
Participants were recruited from hospitals and medical clinics and referred by their doctors; all of them were being medically treated and controlled during the period of the research. All volunteers were interviewed by telephone in order to find out if they met the exclusion criteria, which were: smoking more than 10 cigarettes per day, abuse of alcohol or other drugs of abuse, presence of severe cardiovascular disorder, psychiatric or neurological disorder, visual or hearing impairments, having been under general anesthesia in the past year, the presence of a stressful life event in the past year, and consuming drugs related to cognitive or emotional functions or psychotropic substances. As T2D patients, they were medicated as follows: 54.5% oral antidiabetic, 34.1% oral and injectable, and 11.4% only injectable. Additionally, volunteers who used other medications that could influence hormonal levels (glucocorticoids, beta-blockers, antidepressants, asthma medication, or thyroid therapies) were excluded from the study.
All participants received verbal and written information about the study and signed an informed consent form. The study was carried out in accordance with the Declaration of Helsinki, and the Ethics Research Committee of the University approved the protocol.
Procedure
Participants attended an individual session held between 16:00 and 18:00 in the Laboratory of Social Cognitive Neuroscience at the University of Valencia. Before the session, the experimenter first checked whether each participant had followed the instructions prior to participation: refrain from heavy physical activity from the evening before the session, sleep as long as usual, and not consume alcohol since the night before the session. Additionally, participants were instructed to drink only water and not eat, smoke, take any stimulants (e.g., coffee, cola, tea, chocolate), or brush their teeth at least 2 h prior to the session.
Stress Condition
To produce stress, we employed the TSST (Kirschbaum et al., 1993). This task consisted of 5 min of free speech (simulated job interview) and 5 min of an arithmetic task. Participants stood in front of a committee with a video camera and a microphone clearly visible. Before the TSST, participants completed several items to assess their perceived self-efficacy and the PANAS (pre-task PANAS) to obtain the baseline measure for mood. In addition, WM was evaluated with Letters and Number Sequencing (pre-task LNS). Immediately after the TSST, participants filled in some items about the task (Situational Appraisal), the PANAS (post-task PANAS), and the LNS (post-task LNS).
Control Condition
This condition was similar to the stress condition in terms of mental workload and global physical activity, but it lacked the main components that could provoke stress, such as evaluative threat and uncontrollability (Dickerson and Kemeny, 2004). The control task consisted of 5 min of free speech about a recent non-emotional experience, followed by an arithmetic task consisting of 5 min of counting by 5 aloud. This control task has been used in previous studies (Pulopulos et al., 2013, 2019; Puig-Perez et al., 2015).
During each session, we collected seven saliva samples to measure sAA and C levels. Specifically, the first saliva sample was collected prior to the stress/control task at habituation (−15 min pre-stress). The rest of the saliva samples were taken during the stress/control task (+5 min), after the TSST/Control task (+10 min post-stress), three at 10 min periods after the task (+25, +35, and +45 min), and finally at +50 min post-stress. In addition, two capillary blood samples were taken at habituation (−20 min) and in the recovery period (+55 min) to measure glucose concentrations. Both conditions followed the same time schedule for sample collection, phase durations, and questionnaires administered, and they only differed on the task (Stress vs. Control) (see Figure 1).
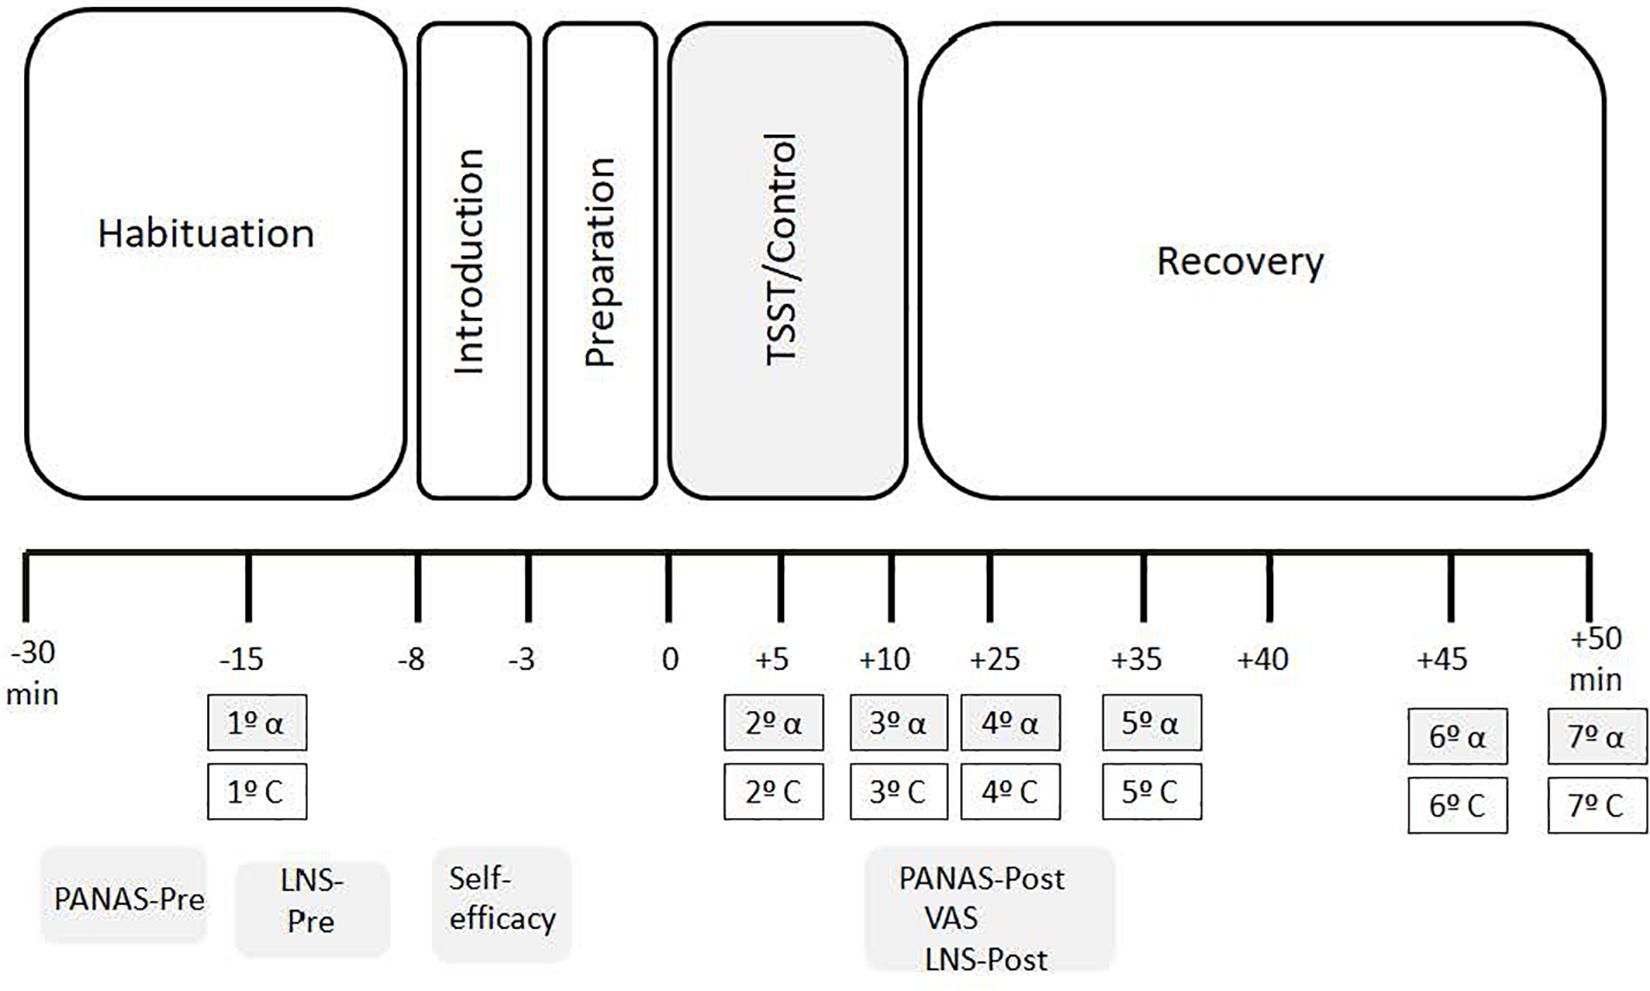
Figure 1. Timeline of the TSST (S) and control (C) conditions. Salivary cortisol samples = 1o̱ C, 2o̱ 3o̱ C, 4o̱ C, 5o̱ C, 6o̱ C, 7o̱ C Salivary alpha-amylase samples = 1o̱α, 2o̱α 3o̱α, 4o̱α, 5o̱α, 6o̱α, 7o̱α. Time of collection of saliva samples (−15, +5, +10, +25, +35j +45, +50). TSST, trier social stress test; PANAS, positive and negative affect; LNS, letter-number sequencing; VAS, situational appraisal.
Psychological Assessment
Self-Efficacy
Participants’ self-efficacy, understood as beliefs about one’s capacity to organize and carry out actions (Bandura, 1997), was evaluated with three items (van der Meij et al., 2010; Villada et al., 2017). These items were formulated to measure capacity (“How capable are you of successfully performing the task?”), self- confidence (“How confident are you that you will successfully perform the task?”), and importance of successfully performing the task (“How important is it to you to perform this task successfully?”). Participants had to respond on a Likert scale ranging from “1 = not at all” to “100 = totally.”
Situational Appraisal
Several items were used to measure the participants’ situational appraisal (Gonzalez-Bono et al., 2002), focusing on the following aspects: frustration, motivation, amount of perceived stress, difficulty of the task, assessment of their own performance, expected outcome of the evaluation, and perception of the effort required (e.g., How much effort did the task require?). Each item was rated on a 5-point Likert scale (not at all = 1 to extremely = 5).
Mood
The Spanish version (Sandín et al., 1999) of the Positive and Negative Affect Scale (PANAS) (Watson et al., 1988) was employed. This 20-item questionnaire assesses mood in two dimensions: positive affect (PA: interested, excited, strong, enthusiastic, etc.) and negative affect (NA: distressed, upset, guilty, scared, etc.), with 10 items measuring each state. The participants were asked to complete the questionnaire based on how they felt at that particular moment. They responded using a 5-point Likert scale ranging from 1 (not at all) to 5 (extremely). In the current study, Cronbach alpha coefficients were 0.91 and 0.87 for PA and NA, respectively.
Working Memory Task
The Letter–Number Sequencing (LNS) task from the Wechsler Memory Scale III (Wechsler, 1997) was used to assess WM performance. This test requires participants to listen to sequences of alternating digits (ranging from 0 to 9) and letters (from A to Z) of increasing lengths. Then, they have to repeat the digits and letters from each sequence, beginning with the digits in numerical order and then the letters in alphabetical order. The length of the sequences increased from two to eight items, and participants were allowed three attempts to solve each sequence length. One point was assigned for each correct attempt, and the task ended when the participant had failed the three attempts for the same sequence length. The raw scores range from 0 to 21. The longest score, the last item, has a maximum of 7. We calculated three outcomes from this test: (i) LNS pre-task: Total number of correctly recalled attempts pre-task; (ii) LNS post-task: Total number of correctly recalled attempts post-task; and (iii) Retention Rate: percentage of the score after the TSST/control task compared to the total score before the task (WM post-task/WM pre-task × 100).
Biochemical Analyses
Salivary samples were collected using salivettes (Sarstedt, Nümbrecht, Germany). Participants were instructed to keep the cotton swab in their mouths for exactly 2 min, not chew the cotton, and move the swab around in a circular pattern to collect saliva from all the salivary glands. The samples were kept in the refrigerator until they were centrifuged at 3,000 rpm for 5 min, resulting in a clear supernatant of low viscosity that was stored at −80 C until the analyses. For each subject, all C and sAA samples were analyzed in the same trial. C levels were analyzed using the commercial enzymeimmunoassay kit from Salimetrics (Newmarket, United Kingdom). The sensitivity of the assay was <0.007 μg/dL, and the intra- and inter-assay coefficients of variation were all below 10%. C levels were expressed in nmol/L.
The sAA concentration was measured by using an enzyme kinetic method with the commercial salivary sAA assay kit from Salimetrics (United States). Assay sensitivity was 0.4 U/mL. Inter- and intra-assay variation coefficients were all below 10%. sAA concentrations were expressed in U/mL.
Two capillary blood samples taken at habituation (−20 min) and recovery period (+55) were employed to measure glucose concentration using a glucose monitoring system (Onetouch ultraeasy life Scan Europe 6300 Zug. Switzerland. AW 0639870).
Statistical Analyses and Data Management
Student’s t-test was used to analyze socio-demographic differences between stress and control participants, whereas differences in educational level and marital status were analyzed with Chi-square tests.
To investigate the effects of stress on self-efficacy and situational appraisal, multivariate analyses of variance (MANOVA) were performed with each self-efficacy (i.e., capacity, self-confidence, and motivation) and situational appraisal (i.e., effort required, frustration, own performance, stress perceived, difficulty, importance of doing the task, and expected outcome) item as dependent variable and Condition as independent variable.
In order to investigate the effects of stress on mood, glucose levels, and WM performance (LNS), ANOVAs for repeated measures were performed, with Condition as a between-subject factor and Time (pre vs. post) as a within-subject factor.
Because C and sAA values did not show a normal distribution, they were log transformed. ANOVAs for repeated measures with Condition (stress vs. control) as a within-subject factor and Time (−15, +5, +15, +25, +35, +45, +50 min) as a between-subject factor were performed to assess the C and sAA levels. Partial eta squared (η2) is reported as a measure of effect sizes for ANOVAs (Cohen, 1973).
Finally, to assess whether the psychobiology response to the stressor was related to WM performance, two regression analyses were performed only for the participants in the stress condition. In one regression we included in Step 1 Creactivity (maximum C levels after the stressful task minus baseline period) and sAAreactivity (maximum value on the stressful task minus baseline period) and in Step 2 the interaction between Creactivity and sAAreactivity. In the second regression, we included in Step 1 the positive affect reactivity (PAreactivity) and negative affect reactivity (NAreactivity), that is, the positive or negative affect post task minus positive or negative affect pre task, respectively.
Two outliers in the mood data, two outliers in the glucose data, one outlier in the cortisol data, and two outliers in the sAA data were excluded from the analyses because their values differed by more than 3 SD. from the mean. In addition, one woman was removed because her scores on the WM retention rate differed by more than 3 SD.
Greenhouse–Geisser was used when the requirement of sphericity was violated in the ANOVA for repeated measures. Post hoc planned comparisons were performed using Bonferroni adjustments for the p-values. Analyses were carried out using SPSS 25.0. All p values reported are two-tailed. The level of significance was fixed as <0.05. For easy interpretation, the values in the figures represent raw values.
Results
Preliminary Analyses
No condition effects were found on age (p = 0.235), education level (p = 0.356), SES (p = 0.594), BMI (p = 0.643), marital status (p = 0.353), or years of diagnosis (p = 0.797).
Self-Efficacy
The MANOVA showed significant differences between conditions in capacity [F(1, 47) = 10.144, p = 0.003, η2p = 0.178] and self-confidence [F(1, 47) = 4.215, p = 0.046, η2p = 0.082]; participants in the stress condition reported less ability and less confidence about performing the task successfully than those in the control condition. No significant differences in motivation [F(1, 47) = 0.748, p = 0.391, η2p = 0.016] were observed.
Situational Appraisal
The MANOVA showed that the stress task was perceived as more stressful [F(1, 44) = 7.796, p = 0.008, η2p = 0.151], frustrating [F(1, 44) = 17.438, p < 0.001, η2p = 0.284], difficult [F(1, 44) = 65.838, p < 0.001, η2p = 0.599], and requiring more effort [F(1, 44) = 20.777, p < 0.001, η2p = 0.321] than the control task. In contrast, participants in the control condition thought they performed the task better [F(1, 44) = 36.529, p < 0.001, η2p = 0.454] and had better results [F(1, 44) = 35.675, p < 0.001, η2p = 0.448] than those in the stress condition. No significant differences in the importance of doing the task were observed between conditions [F(1, 44) = 0.390, p = 0.536, η2p = 0.009].
Glucose Levels
Regarding the glucose levels, the ANOVA for repeated measures showed a main effect of Time [F(1, 46) = 5.857, p = 0.020, η2p = 0.113]. However, no effects of Condition [F(1, 46) = 0.202, p = 0.655, η2p = 0.004] or the Time × Condition interaction [F(1, 46) = 0.537, p = 0.468, η2p = 0.012] were found. In both conditions, participants showed significantly lower glucose levels after the task than before it (Pre task: M = 153.36, SEM = 6.86; Post task: M = 142.76, SEM = 7.52).
Psychobiological Stress Response
Positive and Negative Affect
The ANOVA for repeated measures did not show effects of Condition [F(1, 46) = 0.116, p = 0.735, η2p = 0.003] on positive affect (PA). Although, the Time factor failed to reach significance [F(1, 46) = 3.972, p = 0.052, η2p = 0.079], the Time × Condition interaction was significant [F(1, 46) = 6.447, p = 0.015, η2p = 0.123]. Post hoc analyses showed that, overall, participants presented less positive affect after the stress task than before it. No differences were found between conditions before and after the task. However, participants in the stress condition reported significantly less PA after the stress task than before it (p = 0.003). No differences were observed in the control condition (p = 0.695) (Table 2).

Table 2. Mood changes (mean ± SEM) for total sample and both conditions.
Regarding negative affect (NA), there were no significant effects of Time [F(1, 44) = 2.033, p = 0.161, η2p = 0.44] or Condition [F(1, 44) = 2.911, p = 0.091, η2p = 0.064], but the Time x Condition interaction was significant [F(1, 44) = 5.083, p = 0.029, η2p = 0.104]. Post hoc analysis showed no differences between conditions before the task. After the task, participants in the stress condition showed higher NA than participants in the control condition. Moreover, participants in the stress condition reported higher NA after the stress task than before it (p = 0.014). No differences were observed in the control condition (p = 0.552).
Cortisol
The ANOVA for repeated measures did not show an effect of Condition [F(1, 43) = 2.850, p = 0.099, η2p = 0.062], although Time [F(2.101, 90.328) = 3.167, p = 0.044, η2p = 0.069] and the Time x Condition interaction were significant [F(2.101, 90.328) = 6.807, p = 0.001, η2p = 0.137]. Post hoc analyses showed that C levels were significantly higher in the stress condition than in the control condition +25 (p = 0.026), +35 (p = 0.019), and +50 (p = 0.048) min after the onset of the task. In addition, in the stress condition, there were no significant differences between C levels before and during the stress task (−15 vs. +5 samples: p = 0.147). However, C levels increased significantly from +10 min to +25 min (p = 0.003). After peaking at +35, cortisol levels started to decrease (+35 vs. +50 samples: p = 0.032) until finally reaching baseline levels (+ 50 vs. −15 samples: p > 0.99). In the control condition, no significant differences were observed (all p > 0.147) (Figure 2).
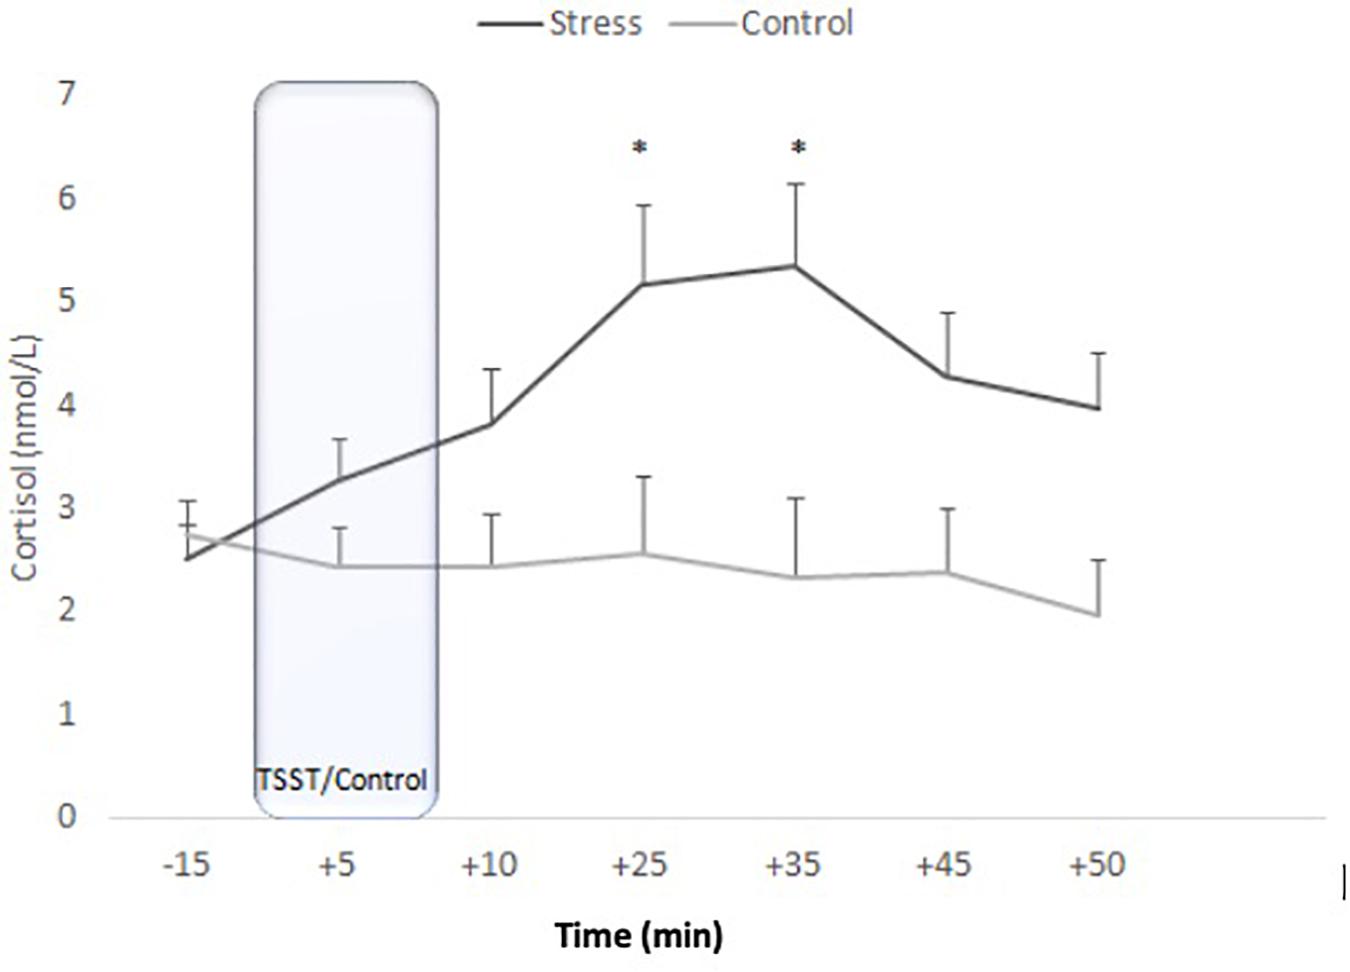
Figure 2. Means of salivary corliaol concentrations for stress and control conditions. Error bars represent standard error of means (∗p < 0.05).
sAA
ANOVA for repeated measures showed an effect of Time [F(4.379, 170.765) = 11.900, p < 0.001, η2p = 0.234] and the Time x Condition interaction [F(4.379, 170.765) = 5.171, p < 0.001, η2p = 0.117]. No effects of Condition were observed [F(1, 39) = 0.069, p = 0.795, η2p = 0.002]. In the stress group, sAA levels started to increase at −15 min and were significantly higher at +5 min (p = 0.002). After peaking at +5 min, sAA levels significantly decreased (+5 vs. +35 samples: p < 0.001) and then remained stable (+35 vs. +50 samples; p > 0.99). In the control condition, no significant differences were observed (all p > 0.137) (Figure 3).
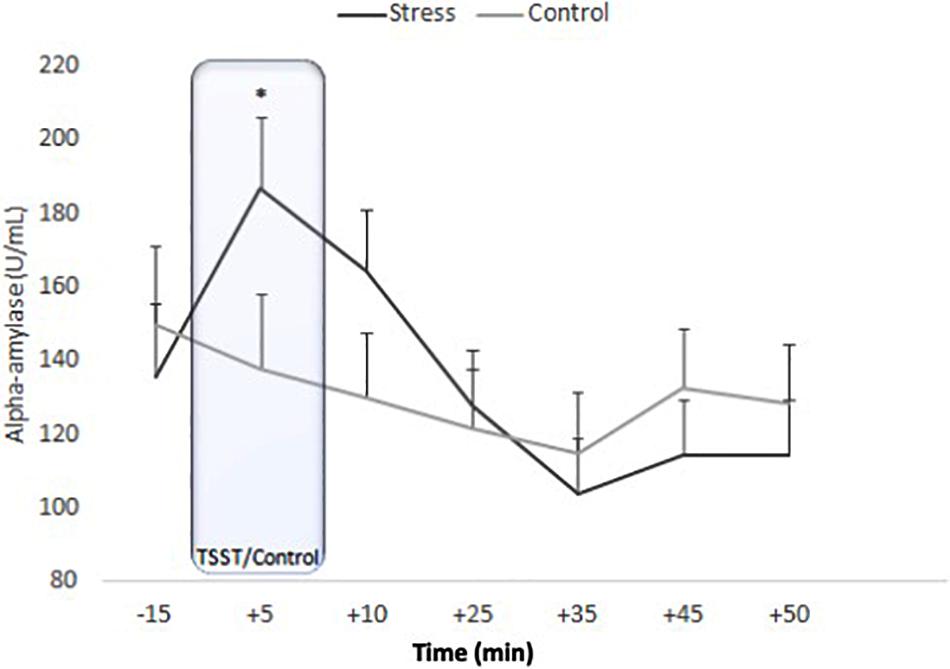
Figure 3. Means of salivary alpha-amylase concentrations for stress and control conditions. Error bars represent standard error of means (∗p = 0.002).
Working Memory Performance
The ANOVA for repeated measures did not show significant effects of Time [F(1, 46) = 1.946, p = 0.170, η2p = 0.041], Condition [F(1, 46) = 0.657, p = 0.422, η2p = 0.014], or the Time × Condition interaction [F(1, 46) = 0.133, p = 0.717, η2p = 0.003]. The performance in both groups was similar (Figure 4).
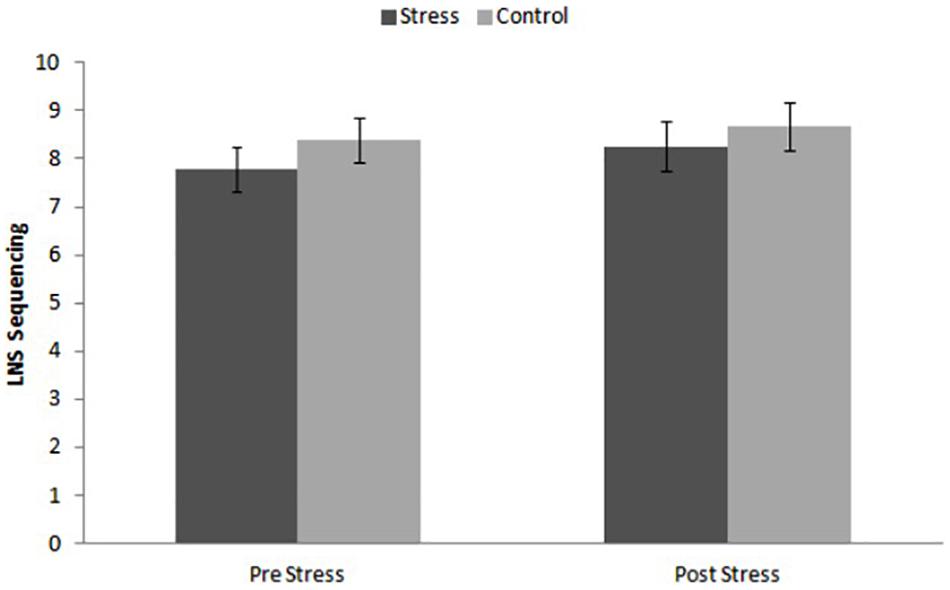
Figure 4. Performance on Letter-Number sequencing (LNS) tor stress and control conditions before and after the task.
Relationship Between the Psychobiological Response and WM Performance
In the stress condition, the WM retention rate was not related to PAreactivity (B = −0.367; p = 0.108), NAreactivity (B = 0.194; p = 0.383), Creactivity (B = 0.055, p = 0.831), or sAAreactivity (B = 0.038, p = 0.882). However, the interaction term Creactivity × sAAreactivity was negatively associated with the WM retention rate (B = −0.549, p = 0.026). Thus, participants in the stress condition who showed higher C and sAA responses to the TSST had lower WM performance.
Discussion
The main purpose of the present study was to characterize the response of older men and women with T2D to an acute psychosocial stressor (i.e., TSST) and its effects on WM performance. As we expected, the TSST provoked significant mood changes and C and sAA responses in participants who were exposed to it, compared to those in the control condition. In addition, although stress did not affect WM performance, the WM retention rate was negatively related to the interaction between the C and sAA responses to stress.
Our results confirm that a psychosocial stressor (TSST) was able to produce a “typical” or characteristic psychobiological response in medically treated T2D patients. At the subjective level, the TSST was perceived as more stressful, frustrating, difficult, and requiring more effort than the control task, and the participants in the stress condition perceived that they had less ability to perform the task successfully. However, both stress and control participants showed a similar motivation to perform the task because they gave the same importance to their performance. Furthermore, the TSST elicited mood changes characterized by decreases in positive mood and increases in negative mood. This pattern confirms that this laboratory psychosocial stressor is able to generate a similar mood response in T2D patients to the one reported for healthy older adults (Hidalgo et al., 2020).
The TSST also provoked a clear C response in T2D patients. This result is consistent with a previous study (Faulenbach et al., 2011) reporting that, although C did not increase right after the stress task, the increase was detectable 30 min after the TSST in T2D patients. It is worth mentioning that in Faulenbach et al.’s study, T2D patients were subjected to the stress and control conditions in two different states (fasting or postprandial state). C increases were found in both states, although they were slightly greater in the fasting state. In our study, participants were in a short fasting state (1–2 h fasting period), and they showed significant reductions in their glucose levels throughout the session, regardless of the condition. Faulenbach et al. (2011) reported stable glucose concentrations in the TSST condition and slight reductions in the control condition in the fasting state (a 10 h overnight fasting period, including stopping medication); in the postprandial state, they found higher glucose levels in the stress session than in the control session. In our case, after exposure to the TSST, participants in both conditions showed glucose decreases (4.52%) fairly similar to those in non-T2D groups (5.6%) assessed in our lab in other studies (unpublished data). It is worth noting that participants in this study were periodically supervised by their doctors and maintained adequate metabolic control.
In addition, in our study, participants showed a sAA response to the TSST. This finding is consistent with results found in healthy older people (Almela et al., 2011; Pulopulos et al., 2015). However, Strahler et al. (2010) found an attenuated sAA response to TSST in this age group. To the best of our knowledge, the current study is the first one to investigate the sAA response to an acute psychosocial stressor in older people with T2D. As in healthy older people, our results support the idea that the TSST also provokes a greater sympathetic-adrenal-medullary system response than the control task in older T2D subjects.
Until now, only a few studies have been carried out on sAA, with heterogenous results in terms of differences between T2D and healthy people (Panchbhai et al., 2010; Shankaraiah and Reddy, 2011). We found higher levels of sAA in older adults with T2D undergoing acute psychosocial stress, compared to older subjects with T2D in a control condition. Our results are in line with those described in healthy older people (Pulopulos et al., 2015) and extend to T2D patients. In addition, they provide new information about the acute sAA response in T2D patients, and they confirm the relationship previously reported between sAA and perceived stress assessed by the Perceived Stress Scale (Siddiqui et al., 2015).
We did not find a significant effect of the TSST on WM performance or a relationship between the C response and WM performance. Our findings agree with other studies on both C administration (Wolf et al., 2001; Porter et al., 2002; Yehuda et al., 2007) and a stress-induced C response (Pulopulos et al., 2015) in healthy older people. Despite this, these results contrast with the conclusions observed in most studies with young male populations exposed to the TSST (Luethi et al., 2009; Engert et al., 2011) and the cold-pressor test (Schoofs et al., 2009; Becker and Rohleder, 2019). The lack of stress effects on WM performance in our sample of older people with T2D extends previous findings found in healthy older people and supports the idea that older people may be less sensitive to the effects of stress on memory than young people, as we previously reported for WM (Pulopulos et al., 2015) and declarative memory (Pulopulos et al., 2013; Hidalgo et al., 2014, 2015) performance. This lack of stress effects on WM performance could be due to an age-related dysregulation of HPA-axis activity (Mizoguchi et al., 2009) and functional changes in the amygdala and hippocampus (Mather, 2006; Murty et al., 2009; St. Jaques et al., 2009) in older people. However, this lack of acute stress effects on WM in older people with T2D should be interpreted with caution, given that a healthy control older group was not included in the present study.
Although we failed to find a stress effect on WM performance, the interaction term between the C and sAA reactivities to the stressor was negatively associated with WM performance. Thus, participants who responded to stress with higher cortisol and sAA levels had worse WM performance. It has been well established that WM depends on prefrontal cortex functioning (Galloway et al., 2008), and that this brain area is affected by the glucocorticoid action and noradrenergic activation in response to stress (Patel et al., 2000; Schoofs et al., 2008). Hence, it is conceivable that this type of memory would be affected by the activation of both stress systems; therefore, the WM performance could be related not only to the HPA-axis or SNS action separately, but also to the interaction between these two systems. To the best of our knowledge, this association has not been previously reported in patients with T2D. Future studies are needed to support this association.
The present study has some limitations. To avoid as many confounding factors as possible, we were conservative and selected a homogeneous T2D sample in terms of age, sex, and other relevant sociodemographic characteristics. Consequently, the number of participants included was limited, which meant that we could not study possible gender differences in the acute stress effects on WM in older people with T2D. Therefore, future studies should include bigger sample sizes and study the role of gender in this clinical population. In addition, although this study has a control group with T2D patients who did not undergo stress, further studies would benefit by also including other control group with healthy people. In spite of these limitations, the current study makes it possible to advance the knowledge about the characteristics of the acute response to psychosocial stress in medically treated T2D. In fact, our results suggest a psychobiological response similar to the one found in healthy older people, and different from that of young people. This similitude extends to the stress effects on WM for this age group. WM has great relevance in older people, and particularly in the T2D population, because many therapeutic actions are based on information that is necessary for a high degree of patient self-management. In sum, this study provides interesting findings about the psychobiological response to acute psychosocial stress in older T2D men and women. The results provide empirical evidence about the cognitive and physiological response in older people with T2D with adequate medical supervision.
Data Availability Statement
The raw data supporting the conclusions of this article will be made available by the authors, without undue reservation, to any qualified researcher.
Ethics Statement
The studies involving human participants were reviewed and approved by the La Fe- Hospital Clínico Universitario- Instituto de Investigación Universitario- Universitat de València. The patients/participants provided their written informed consent to participate in this study.
Author Contributions
AS, VH, and SP-P: conceptualization and design. SP-P and TM: recruitment and data collection. LV and MZ-F: data curation and writing—original draft preparation. AS and VH: writing—review and editing. AS and JN: supervision. AS: project administration and funding acquisition. All authors have read and agreed to the published version of the manuscript.
Funding
This research study was supported by the Spanish Education and Science Ministry with grant nos. PSI2016-78763-P and PSI2017-90806-REDT, by the Spanish Science, Innovation and Universities Ministry (FPU17/03428), and by the Generalitat Valenciana no. PROMETEOII2015/20. Moreover, the contribution of VH has been supported by the Government of Aragón (Department of Innovation, Research and University) and FEDER “Construyendo desde Aragón” for the research group S31_20D.
Conflict of Interest
The authors declare that the research was conducted in the absence of any commercial or financial relationships that could be construed as a potential conflict of interest.
Acknowledgments
We are grateful to the Endocrinology Service of the Hospital la Fe, to the medical team of the Clinical Hospital, and to the Primary Care Service of Alboraya for their support in the research. We wish to thank Ms. Cindy DePoy for the revision of the English text.
References
Adler, N. E., Epel, E., Castellazzo, G., and Ickovics, J. (2000). Relationship of subjective and objective social status with psychological and physical health: preliminary data in healthy white women. Health Psychol. 19, 586–592. doi: 10.1037//0278-6133.19.6.586
Agardh, E. E., Ahlbom, A., Andersson, T., Efendic, S., Grill, V., Hallqvist, J., et al. (2003). Work stress and low sense of coherence is associated with type 2 diabetes in middle-aged Swedish women. Diab. Care 26, 719–724. doi: 10.2337/diacare.26.3.719
Almela, M., Hidalgo, V., Villada, C., van der Meij, L., Espín, L., Gómez-Amor, J., et al. (2011). Salivary alpha-amylase response to acute psychosocial stress: the impact of age. Biol. Psychol. 87, 421–429. doi: 10.1016/j.biopsycho.2011.05.008
Arvanitakis, Z., Wilson, R. S., Li, Y., Aggarwal, N. T., and Bennett, D. A. (2006). Diabetes and function in different cognitive systems in older individuals without dementia. Diab. Care 29, 560–565. doi: 10.2337/diacare.29.03.06.dc05-1901
Aung, P. P., Strachan, M. W. J., Frier, B. M., Butcher, I., Deary, I. J., and Price, J. F. (2012). Severe hypoglycaemia and late-life cognitive ability in older people with type 2 diabetes: the edinburgh type 2 diabetes study. Diab. Med. 29, 328–336. doi: 10.1111/j.1464-5491.2011.03505.x
Becker, L., and Rohleder, N. (2019). Time course of the physiological stress response to an acute stressor and its associations with the primacy and recency effect of the serial position curve. PLoS One 14:e0213883. doi: 10.1371/journal.pone.0213883
Boaz, M., Matas, Z., Chaimy, T., Landau, Z., Dayan, Y. B., Berlovitz, Y., et al. (2013). Institutional point-of-care glucometer identifies population trends in blood glucose associated with war. Diabetes Technol. Ther. 15, 964–967. doi: 10.1089/dia.2013.0035
Carvalho, L. A., Urbanova, L., Hamer, M., Hackett, R. A., Lazzarino, A. I., and Steptoe, A. (2015). Blunted glucocorticoid and mineralocorticoid sensitivity to stress in people with diabetes. Psychoneuroendocrinology 51, 209–218. doi: 10.1016/j.psyneuen.2014.09.023
Cerasuolo, J., and Izzo, A. (2017). Persistent impairment in working memory following severe hyperglycemia in newly diagnosed type 2 diabetes. Endocrinol. Diabetes Metab. Case Rep. 2017:17-0101. doi: 10.1530/EDM-17-0101
Cohen, J. (1973). Eta-squared and partial eta-squared in fixed factor ANOVA designs. Educ. Psychol. Meas. 33, 107–112. doi: 10.1177/001316447303300111
Cherbuin, N., Sachdev, P., and Anstey, K. J. (2012). Higher normal fasting plasma glucose is associated with hippocampal atrophy: the PATH Study. Neurology 79, 1019–1026. doi: 10.1212/wnl.0b013e31826846de
Dickerson, S. S., and Kemeny, M. E. (2004). Acute stressors and cortisol responses: a theoretical integration and synthesis of laboratory research. Psychol. Bull. 130, 355–391. doi: 10.1037/0033-2909.130.3.355
Engert, V., Vogel, S., Efanov, S. I., Duchesne, A., Corbo, V., Ali, N., et al. (2011). Investigation into the cross-correlation of salivary cortisol and alpha-amylase responses to psychological stress. Psychoneuroendocrinology 36, 1294–1302. doi: 10.1016/j.psyneuen.2011.02.018
Eriksson, A. K., van den Donk, M., Hilding, A., and Östenson, C. G. (2013). Work stress, sense of coherence, and risk of type 2 diabetes in a prospective study of middle-aged Swedish men and women. Diab. Care 36, 2683–2689. doi: 10.2337/dc12-1738
Exalto, L. G., Biessels, G. J., Karter, A. J., Huang, E. S., Katon, W. J., Minkoff, J. R., et al. (2013). Risk score for prediction of 10 year dementia risk in individuals with type 2 diabetes: a cohort study. Lancet Diabetes Endocrinol. 1, 183–190. doi: 10.1016/s2213-8587(13)70048-2
Faulenbach, M., Uthoff, H., Schwegler, K., Spinas, G. A., Schmid, C., and Wiesli, P. (2011). Effect of psychological stress on glucose control in patients with Type 2 diabetes. Diab. Med. 29, 128–131. doi: 10.1111/j.1464-5491.2011.03431x
Funahashi, S. (2015). Functions of delay-period activity in the prefrontal cortex and mnemonic scotomas revisited. Front. Syst. Neurosci. 9:2. doi: 10.3389/fnsys.2015.00002
Funahashi, S. (2017). Working memory in the prefrontal cortex. Brain Sci. 7:49. doi: 10.3390/brainsci7050049
Galloway, E. M., Woo, N. H., and Lu, B. (2008). Persistent neural activity in the prefrontal cortex: a mechanism by which BDNF regulates working memory? Prog. Brain Res. 169, 251–266. doi: 10.1016/s0079-6123(07)00015-5
Gold, S. M., Dziobek, I., Sweat, V., Tirsi, A., Rogers, K., Bruehl, H., et al. (2007). Hippocampal damage and memory impairments as possible early brain complications of type 2 diabetes. Diabetologia 50, 711–719. doi: 10.1007/s00125-007-0602-7
Gonzalez-Bono, E., Moya-Albiol, L., Salvador, A., Carrillo, E., Ricarte, J., and Gomez-Amor, J. (2002). Anticipatory autonomic response to a public speaking task in women. Biol. Psychol. 60, 37–49. doi: 10.1016/s0301-0511(02)00008-x
Gorniak, S. L., Lu, F. Y., Lee, B. C., Massman, P. J., and Wang, J. (2018). DMRR-18-RES-207.R2: cognitive impairment and postural control deficits in adults with Type 2 diabetes. Diabetes Metab. Res. Rev. 35:e3089. doi: 10.1002/dmrr.3089
Hackett, R. A., and Steptoe, A. (2016). Psychosocial factors in diabetes and cardiovascular risk. Curr. Cardiol. Rep. 18:95. doi: 10.1007/s11886-016-0771-4
Heraclides, A., Chandola, T., Witte, D. R., and Brunner, E. J. (2009). Psychosocial stress at work doubles the risk of type 2 diabetes in middle-aged women: evidence from the whitehall II study. Diabetes Care 32, 2230–2235. doi: 10.2337/dc09-0132
Hidalgo, V., Almela, M., Villada, C., and Salvador, A. (2014). Acute stress impairs recall after interference in older people, but not in young people. Horm. Behav. 65, 264–272. doi: 10.1016/j.yhbeh.2013.12.017
Hidalgo, V., Pulopulos, M. M., Puig-Perez, S., Espin, L., Gomez-Amor, J., and Salvador, A. (2015). Acute stress affects free recall and recognition of pictures differently depending on age and sex. Behav. Brain Res. 292, 393–402. doi: 10.1016/j.bbr.2015.07.011
Hidalgo, V., Pulopulos, M. M., and Salvador, A. (2019). Acute psychosocial stress effects on memory performance: relevance of age and sex. Neurobiol. Learn. Mem. 157, 48–60. doi: 10.1016/j.nlm.2018.11.013
Hidalgo, V., Almela, M., Villada, C., van der Meij, L., and Salvador, A. (2020). Verbal performance during stress in healthy older people: influence of dehydroepiandrosterone (DHEA) and cortisol reactivity. Biol. Psychol. 149:107786. doi: 10.1016/j.biopsycho.2019.107786
Jones, N., Riby, L., Mitchell, R., and Smith, M. (2014). Type 2 diabetes and memory: using neuroimaging to understand the mechanisms. Curr. Diabetes Rev. 10, 118–123. doi: 10.2174/1573399810666140425160811
Kim, H. G. (2019). Cognitive dysfunctions in individuals with diabetes mellitus. Yeungnam Univ. J. Med. 36, 183–191. doi: 10.12701/yujm.2019.00255
Kirschbaum, C., Pirke, K. M., and Hellhammer, D. H. (1993). The ‘trier social stress test’ – a tool for investigating psychobiological stress responses in a laboratory setting. Neuropsychobiology 28, 76–81. doi: 10.1159/000119004
Kumar, S., Joseph, S., Gander, P. E., Barascud, N., Halpern, A. R., and Griffiths, T. D. (2016). A brain system for auditory working memory. J. Neurosci. 36, 4492–4505. doi: 10.1523/jneurosci.4341-14.2016
Lindau, M., Almkvist, O., and Mohammed, A. (2016). “Effects of stress on learning and memory,” in Stress: Concepts, Cognition, Emotion, and Behavior, ed. G. Fink (Cambridge, MA: Elsevier Academic Press), 153–160. doi: 10.1016/b978-0-12-800951-2.00018-2
Luethi, M., Meier, B., and Sandi, C. (2009). Stress effects on working memory, explicit memory, and implicit memory for neutral and emotional stimuli in healthy men. Behav. Neurosci. 2, 1–9. doi: 10.3389/neuro.08.005.2008
Lundqvist, M. H., Almby, K., Abrahamsson, N., and Eriksson, J. W. (2019). Is the brain a key player in glucose regulation and development of type 2 diabetes? Front. Physiol. 10:457. doi: 10.3389/fphys.2019.00457
Mather, M. (2006). “Why memories may become more positive as people age,” in Memory and Emotion: Interdisciplinary Perspectives, eds B. Uttl and A. L. Ohta (Malden, MA: Blackwell), 135–157. doi: 10.1002/9780470756232.ch7
Mizoguchi, K., Ikeda, R., Shoji, H., Tanaka, Y., Maruyama, W., and Tabira, T. (2009). Aging attenuates glucocorticoid negative feedback in rat brain. Neuroscience 159, 259–270. doi: 10.1016/j.neuroscience.2008.12.020
Mommersteeg, P. M., Herr, R., Zijlstra, W. P., Schneider, S., and Pouwer, F. (2012). Higher levels of psychological distress are associated with a higher risk of incident diabetes during 18 years follow-up: results from the British household panel survey. BMC Public Health 12:1109. doi: 10.1186/1471-2458-12-1109
Murty, V. P., Sambataro, F., Das, S., Tan, H.-Y., Callicott, J. H., Goldberg, T. E., et al. (2009). Age-related alterations in simple declarative memory and the effect of negative stimulus valence. J. Cogn. Neurosci. 21, 1920–1933. doi: 10.1162/jocn.2009.21130
Novak, M., Björck, L., Giang, K. W., Heden-Ståhl, C., Wilhelmsen, L., and Rosengren, A. (2012). Perceived stress and incidence of Type 2 diabetes: a 35-year follow-up study of middle-aged Swedish men. Diabetic Med. 30, e8–e16. doi: 10.1111/dme.12037
Palta, P., Schneider, A. L. C., Biessels, G. J., Touradji, P., and Hill-Briggs, F. (2014). Magnitude of cognitive dysfunction in adults with type 2 diabetes: a meta-analysis of six cognitive domains and the most frequently reported neuropsychological tests within domains. J. Int. Neuropsychol. Soc. 20, 278–291. doi: 10.1017/s1355617713001483
Panchbhai, A. S., Degwekar, S. S., and Bhowte, R. R. (2010). Estimation of salivary glucose, salivary amylase, salivary total protein and salivary flow rate in diabetics in India. J. Oral Sci. 52, 359–368. doi: 10.2334/josnusd.52.359
Patel, P. D., Lopez, J. F., Lyons, D. M., Burke, S., Wallace, M., and Schatzberg, A. F. (2000). Glucocorticoid and mineralcorticoid receptor mRNA expression in squirrel monkey brain. J. Psychiatr. Res. 34, 383–392. doi: 10.1016/s0022-3956(00)00035-2
Pelimanni, E., and Jehkonen, M. (2018). Type 2 diabetes and cognitive functions in middle age: a meta-analysis. J. Int. Neuropsychol. Soc. 25, 215–229. doi: 10.1017/s1355617718001042
Porter, R. J., Barnett, N. A., Idey, A., McGuckin, E. A., and O’Brien, J. T. (2002). Effects of hydrocortisone administration on cognitive function in the elderly. J. Psychopharmacol. 16, 65–71. doi: 10.1177/026988110201600106
Puig-Perez, S., Villada, C., Pulopulos, M. M., Almela, M., Hidalgo, V., and Salvador, A. (2015). Optimism and pessimism are related to different components of the stress response in healthy older people. Int. J. Psychophysiol. 98, 213–221. doi: 10.1016/j.ijpsycho.2015.09.002
Pulopulos, M. M., Almela, M., Hidalgo, V., Villada, C., Puig-Perez, S., and Salvador, A. (2013). Acute stress does not impair long-term memory retrieval in older people. Neurobiol. Learn. Mem. 104, 16–24. doi: 10.1016/j.nlm.2013.04.010
Pulopulos, M. M., Hidalgo, V., Almela, M., Puig-Perez, S., Villada, C., and Salvador, A. (2015). Acute stress and working memory in older people. Stress 18, 178–187. doi: 10.3109/10253890.2015.1004538
Pulopulos, M. M., Witte, S. D., Vanderhasselt, M.-A., Raedt, R. D., Schiettecatte, J., Anckaert, E., et al. (2019). The influence of personality on the effect of iTBS after being stressed on cortisol secretion. PLoS One 14:e0223927. doi: 10.1371/journal.pone.0223927
Rucker, J. L., McDowd, J. M., and Kluding, P. M. (2012). Executive function and type 2 diabetes: putting the pieces together. Phys. Ther. 92, 454–462. doi: 10.2522/ptj.20100397
Ryan, C. M., and Geckle, M. O. (2000). Circumscribed cognitive dysfunction in middle-aged adults with type 2 diabetes. Diabetes Care 23, 1486–1493. doi: 10.2337/diacare.23.10.1486
Ryan, C. M., Freed, M. I., Rood, J. A., Cobitz, A. R., Waterhouse, B. R., and Strachan, M. W. J. (2006). Improving metabolic control leads to better working memory in adults with type 2 diabetes. Diabetes Care 29, 345–351. doi: 10.2337/diacare.29.02.06.dc05-1626
Ryan, C. M., Duinkerken, E. V., and Rosano, C. (2016). Neurocognitive consequences of diabetes. Am. Psychol. 71, 563–576. doi: 10.1037/a0040455
Sandín, B., Chorot, P., Lostao, L., Joiner, T. E., Santed, M. A., and Valiente, R. M. (1999). The PANAS scales of positive and negative affect: factor analytic validation and cross-cultural convergence. Psicothema 11, 37–51.
Shankaraiah, P., and Reddy, Y. N. (2011). α-amylase expressions in Indian type-2 diabetic patients. J. Med. Sci. 11, 280–284. doi: 10.3923/jms.2011.280.284
Siddiqui, A., Madhu, S. V., Sharma, S. B., and Desai, N. G. (2015). Endocrine stress responses and risk of type 2 diabetes mellitus. Stress 18, 498–506. doi: 10.3109/10253890.2015.1067677
Schoofs, D., Preuß, D., and Wolf, O. T. (2008). Psychosocial stress induces working memory impairments in an n-back paradigm. Psychoneuroendocrinology 33, 643–653. doi: 10.1016/j.psyneuen.2008.02.004
Schoofs, D., Wolf, O. T., and Smeets, T. (2009). Cold pressor stress impairs performance on working memory tasks requiring executive functions in healthy young men. Behav. Neurosci. 123, 1066–1075. doi: 10.1037/a0016980
Steptoe, A., Hackett, R. A., Lazzarino, A. I., Bostock, S., Marca, R. L., Carvalho, L. A., et al. (2014). Disruption of multisystem responses to stress in type 2 diabetes: investigating the dynamics of allostatic load. Proc. Natl. Acad. Sci. U.S.A. 111, 15693–15698. doi: 10.1073/pnas.1410401111
St. Jaques, P. L., Dolcos, F., and Cabeza, R. (2009). Effects of aging on functional con- nectivity of the amygdala for subsequent memory of negative pictures: a network analysis of functional magnetic resonance imaging data. Psychol. Sci. 20, 74–84. doi: 10.1111/j.1467-9280.2008.02258.x
Strahler, J., Mueller, A., Rosenloecher, F., Kirschbaum, C., and Rohleder, N. (2010). Salivary α-amylase stress reactivity across different age groups. Psychophysiology 47, 587–595. doi: 10.1111/j.1469-8986.2009.00957.x
Surwit, R. S., Schneider, M. S., and Feinglos, M. N. (1992). Stress and diabetes mellitus. Diabetes Care 15, 1413–1422. doi: 10.2337/diacare.15.10.1413
Tuligenga, R. H., Dugravot, A., Tabák, A. G., Elbaz, A., Brunner, E. J., Kivimäki, M., et al. (2014). Midlife type 2 diabetes and poor glycaemic control as risk factors for cognitive decline in early old age: a post-hoc analysis of the Whitehall II cohort study. Lancet Diabetes Endocrinol. 2, 228–235. doi: 10.1016/s2213-8587(13)70192-x
van der Meij, L., Buunk, A. P., Almela, M., and Salvador, A. (2010). Testosterone responses to competition: the opponents psychological state makes it challenging. Biol. Psychol. 84, 330–335. doi: 10.1016/j.biopsycho.2010.03.017
Villada, C., Espin, L., Hidalgo, V., Rubagotti, S., Sgoifo, A., and Salvador, A. (2017). The influence of coping strategies and behavior on the physiological response to social stress in women: the role of age and menstrual cycle phase. Physiol. Behav. 170, 37–46. doi: 10.1016/j.physbeh.2016.12.011
Watson, D., Clark, L. A., and Tellegen, A. (1988). Development and validation of brief measures of positive and negative affect: the PANAS scales. J. Pers. Soc. Psychol. 54, 1063–1070. doi: 10.1037/0022-3514.54.6.1063
Wolf, O. T., Convit, A., McHugh, P. F., Kandil, E., Thorn, E. L., De Santi, S., et al. (2001). Cortisol differentially affects memory in young and elderly men. Behav. Neurosci. 115, 1002–1011. doi: 10.1037/0735-7044.115.5.1002
Yehuda, R., Harvey, P. D., Buchsbaum, M., Tischler, L., and Schmeidler, J. (2007). Enhanced effects of cortisol administration on episodic and working memory in aging veterans with PTSD. Neuropsychopharmacology 32, 2581–2591. doi: 10.1038/sj.npp.1301380
Keywords: psychosocial stress, working memory, type 2 diabetes, older adults, cortisol, alpha-amylase
Citation: Vallejo L, Zapater-Fajarí M, Montoliu T, Puig-Perez S, Nacher J, Hidalgo V and Salvador A (2021) No Effects of Acute Psychosocial Stress on Working Memory in Older People With Type 2 Diabetes. Front. Psychol. 11:596584. doi: 10.3389/fpsyg.2020.596584
Received: 19 August 2020; Accepted: 04 December 2020;
Published: 07 January 2021.
Edited by:
Vicente Javier Clemente-Suárez, European University of Madrid, SpainReviewed by:
Jana Strahler, University of Giessen, GermanyLinda Becker, University of Erlangen Nuremberg, Germany
Copyright © 2021 Vallejo, Zapater-Fajarí, Montoliu, Puig-Perez, Nacher, Hidalgo and Salvador. This is an open-access article distributed under the terms of the Creative Commons Attribution License (CC BY). The use, distribution or reproduction in other forums is permitted, provided the original author(s) and the copyright owner(s) are credited and that the original publication in this journal is cited, in accordance with accepted academic practice. No use, distribution or reproduction is permitted which does not comply with these terms.
*Correspondence: Alicia Salvador, YWxpY2lhLnNhbHZhZG9yQHV2LmVz