 Yanqun Yang
 Yang Feng
 Said M. Easa
 Xinyi Zheng
- 1College of Civil Engineering, Fuzhou University, Fuzhou, China
- 2Traffic Research Center, Fuzhou University, Fuzhou, China
- 3Department of Civil Engineering, Ryerson University, Toronto, ON, Canada
- 4Faculty of Humanities and Social Sciences, Fuzhou University, Fuzhou, China
In recent years, the mileage of the tunnels has substantially increased with the rapid highway construction that led to increasing highway tunnels. Most studies on tunnel accidents have mainly focused on the external environments, such as tunnel structure, traffic volume, and lighting. In addition, although many studies on mental load of drivers have been conducted for public roads, such studies for highway tunnels have been limited. In this study, three scenarios with different front vehicle speeds (60, 45, and 30 km/h) in a two-lane long tunnel (one lane in each travel direction) were evaluated using a driving simulator. The experiment involved 24 participants (14 men and 10 women) with an average age of 25.8 years and an average experience of 3.2 years. The electroencephalogram (EEG) technology was used to collect the leading EEG indicators during the driving simulation of the scenarios: α, β, and θ waves and the wave ratio, (α + θ)/β. According to the β-wave energy measurements, the alertness of drivers was the lowest at 45 km/h after adapting to the tunnel environment, indicating that the drivers were more comfortable at this speed. This preliminary finding should help in determining the speed limit in this type of tunnel.
Introduction
The tunnel is an alternative solution for the roadway along rugged topography to overcome natural conditions. Thus, road tunnels usually represent bottlenecks in the road network (Bassan, 2016). The tunnels are at risk of hazard and intractable accidents. The severe accident rates and costs in tunnels were often higher than those on the corresponding roads (Caliendo and De Guglielmo, 2012). Therefore, safety studies on driving in tunnels are necessary.
For general highways, many studies on mental load of drivers have been conducted using electroencephalograph (EEG). These studies have made it possible to evaluate mental load and behavior of drivers in tunnels. The studies have used different indicators, such as heart rate variability, eye-tracking movements (Yang et al., 2019b, 2020d), and EEG. Using EEG to study the mental state of drivers in a driving simulator is a mature technique, which was first used in the 1980's (Lemke, 1982; Torsvall, 1987). The accuracy and efficiency of this technology have been demonstrated (Haak et al., 2008; Li et al., 2010; Borghini et al., 2012; Bashivan et al., 2016; Kim et al., 2018). Many researchers have studied essential driver characteristics, such as driver sleepiness (Resalat and Saba, 2015), drowsiness (Lin et al., 2005), fatigue (Jap et al., 2009; Arakawa et al., 2019), alertness level (Kiymik et al., 2004), and cognitive load (Barua et al., 2017). Other studies have used EEG, as the effect of color scheme (Yang et al., 2020a), situation awareness (Yang et al., 2020b), and the effect of directional signs (Yang et al., 2020c). Other studies on brain activities, driver aggressiveness, music and emotion, and EEG classification have also been conducted (Fan et al., 2010; Liu et al., 2013; Lin et al., 2014; Yang et al., 2018, 2019a; Zeng et al., 2018).
For tunnels, numerous studies have been conducted on traffic safety. However, most studies have focused on tunnel geometric characteristics and traffic volumes, tunnel illumination and visibility (Miyake et al., 2019), accident zone locations (Amundsen and Ranes, 2000; Ma et al., 2009), and safety speed (Yan et al., 2019). The interesting study by Yan et al. (2019) addressed driving risk levels in continuous tunnels, 250–1,000 m long and two lanes in each direction, using various risk indicators. A naturalistic driving system equipped with a road environment and driving-behavior data acquisition system was used to collect the data in 130 tunnels on four highways. The American Association of State Highway and Transportation Officials (AASHTO) braking model and the convex hull algorithm were used to predict the critical safety speed and the critical time headway of each risk feature. In contrast, this study was designed to predict the speed of car-following that is most comfortable for the drivers using brain waves and eye movements. Specifically, this study evaluated the effect of a 1,800-m long tunnel on the EEG of drivers in a car-following situation. Thus, this study complements the study by Yan et al. (2019).
However, a few studies have been conducted on driver behavior in tunnels. The literature shows that the pathological discomfort of drivers strongly correlates with the accident rate when driving in tunnels (Calvi and D'amico, 2013). The behavioral training using virtual reality affects the self-evacuation during a drill (Kinateder et al., 2013). Thus, more studies on driver behavior in tunnels are needed. The novelty of this study lies in the evaluation of the mental state of drivers to determine the appropriate speed limit in a highway tunnel, which has not been addressed in the literature. In the experimental scenarios, the driver followed a car in front, which traveled at a specific speed to simulate different speed limits. The EEG of drivers was measured to determine the change in the mental state of drivers, mainly those undesirable emotions, such as tension, depression, and anger. The findings of this study might strengthen the inference and analysis of the motivation and mechanism of the lousy behavior of drivers and might provide a theoretical basis for the prevention of tunnel traffic accidents.
Experimental Design
Experimental Subjects
Drivers of similar ages were selected to avoid the influence of age on driving. A total of 24 subjects were recruited for the experiments (14 men and 10 women). Each participant was in good physical condition, with no color weakness or color blindness. The driving experience of the subjects varied. The average age was 25.8 years, with an SD of 5.5 years. The average experience was 3.2 years, with an SD of 3.7 years. Notably, in previous driving simulation studies, this sample size was considered enough to arrive at some preliminary conclusions, especially using the EEG index. The number of participants used in previous studies has ranged from 10 to 24 (Reed and Green, 1999; Risser et al., 2000; Godley et al., 2002; Philip et al., 2005; Ingre et al., 2006).
Driving Simulator and EEG System
The experiment was carried out indoor in a driving simulator cabin, eliminating the effects of weather, light, and noise on the experimental results. The indoor illumination was 300 lx. There is no noticeable light change in and out of the tunnel in the simulator test, which avoids physiological changes due to light changes, such as dim light that makes the pupils of drivers enlarged after entering the tunnel. The wireless EEG system and the driving simulator were used to collect the data in the experiments, as shown in Figure 1. The hardware parts of the driving simulator include the display, transmission, clutch, cockpit, sensors, steering, throttle, brake, and seat. The EEG acquisition part consists of the Enobio wireless EEG system, which transmits 24-bit EEG data and accurately restores the original EEG signal. Its bandwidth is 0–250 Hz, the sampling rate is 500 samples per second (sps), the resolution is 24 bits, i.e., 0.05 uv, and the noise is <1 uvrms (0–250 Hz).
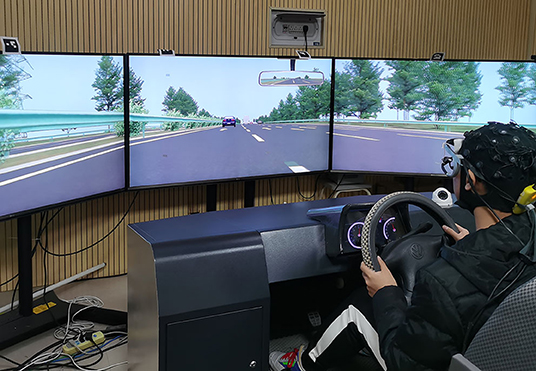
Figure 1. Experimental equipment.
The EEG test provides information concerning the dynamics and simulated electrical brain activity, where brain cells communicate through electrical impulses. An EEG can be used to help detect potential abnormalities in the brain waves. The small flat metal disks (i.e., electrodes) that are attached to the scalp with wires analyze the electrical impulses of the brain and send signals to a computer that records the results. The charges are amplified and appear as a graph on a computer screen. The details on the mathematical foundation of EEG can be found elsewhere (Doschoris and Kariotou, 2017).
Experimental Scenarios
Experimental Road
The scene of this experiment was a long two-lane, second-class highway tunnel (i.e., one lane in each travel direction). According to the highway technical standards by the Standardization Administration of the People's Republic of China (Standardization Administration of the People's Republic of China, 2014), the length of the long highway tunnel ranges from 1,000 to 3,000 m. The tunnel length was set as 1,800 m, which is classified as a long tunnel. Also, this length would help control the total time of the experiment to avoid driver fatigue. The length of the experimental section was 2.2 km. Figure 2 shows a schematic diagram of the experimental highway tunnel. The length of the section from the starting point to the tunnel entrance was 200 m, and the length from the tunnel exit to the end point was 200 m. The width of each lane was 3.75 m, and the total width of the cross-section was 7.5 m (i.e., there was no median). Figure 3 shows a schematic diagram of the internal environment of the tunnel. A truck escape ramp existed on the right-hand side of the traveled way, with a width of 1.8 m. The experiment was carried out in the driving simulator, where the illumination was controlled as the indoor lighting (300 lx). There was no specific noise interfering with the participants, apart from the driving simulator sound.
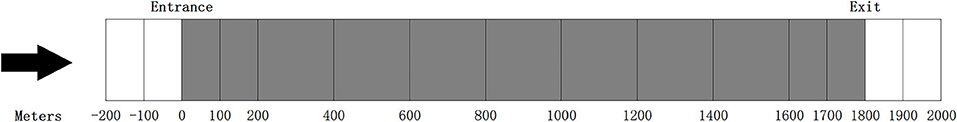
Figure 2. Schematic diagram of the experimental highway tunnel.
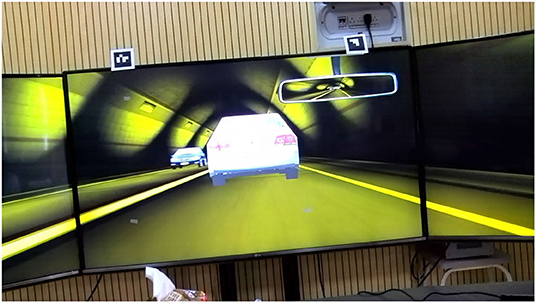
Figure 3. Schematic diagram of the internal environment of the tunnel.
Driving Speed and Traffic Flow
Both the mental state and the behavior of drivers were explored in a vehicle-following situation. The independent variable controlled in this study was a single factor, i.e., the speed of the leader vehicle. The speed limit of the second-class highway is normally set as 60 or 80 km/h, so this experiment took a design speed of 60 km/h as the maximum speed limit. The minimum speed limit zone was 30 km/h with increases of 15 km/h increments up to a maximum of 60 km/h. Thus, the three experimental scenarios in the following situations in the long tunnel were set with the driving speed of the front car set at 60 km/h (Scenario A), 45 km/h (Scenario B), and 30 km/h (Scenario C). Based on the United States Standards (Transportation Research Board, 2010), an average traffic flow in the steady-state of 700 passenger car units per hour (pcu/h) was selected as the experimental traffic flow for all scenarios.
Experimental Process
Each subject needed to be familiar with the operation of the driving simulator before starting the formal experiment. The drivers followed the vehicle in front of them and drove according to their everyday driving habits. When driving in a tunnel, overtaking was forbidden. The experimental scenarios were based on a fully balanced method that eliminated the mutual interference of the testing sequence caused by various experimental conditions. Experiments were carried out in the morning, afternoon, and evening. The experiment was carried out in a room with curtains closed and lights on to reduce the influence of light. All participants were asked to have a good sleep before the experiment to ensure that they were full of energy and good mental state.
An example of the subject sequence was as follows: Subject 1 completed driving in Scenario A; after that, the driver rested for a while and then drove the simulator in Scenarios B and C. Then, Subject 2 would drive in the sequence of Scenarios C, A, and B, while Subject 3 drives in the sequence of Scenarios A, C, and B. The rest of the 21 subjects followed the same sequence pattern of the three scenarios. The EEG data, such as α-, β-, and θ-wave energy, were collected during the experiment. Thus, all 24 subjects participated in the investigation.
Data Preprocessing
Filtering and Re-referencing
The filtering mainly filtered the useless part of the original EEG data from 32 electrode locations and included two steps. The first step was the low-pass filtering, which filtered the EEG waveform with a frequency below 0.5 Hz. The second step was the high-pass filtering, which screened the EEG waveform with a frequency above 40 Hz (i.e., this frequency is commonly used for EEG pre-analysis). The re-referencing is to use the average value of EEG data on each electrode as a reference for calibration to prevent the artifacts from affecting the overall EEG data.
Independent Component Analysis Technology Denoising
The independent component analysis (ICA) is a data processing technology widely used in many fields. The ICA technology is mainly used to find and remove specific EEG artifacts after filtering and re-referencing in EEGLAB.
EEG Energy Value Data Extraction
In this experiment, the data for the EEG energy value were extracted in the α, β, and θ waves, and the wave ratio (α + θ)/β. Their characteristics are presented in Table 1. The specific extraction process was as follows:
(a) Export the original data from the Enobio system and import it into the EEGLAB toolbox. Perform filtering, sequencing, and ICA preprocessing to remove unwanted frequency waves and noise.
(b) Use EEGLAB to remove the artifacts that still existed manually. The EEG signal after removing the artifacts is shown in Figure 4. Y-axis represents the 32 channels of EEG. The numbers −500, 0, 500, and 1,000 in the X-axis represent −500, 0, 500, and 1,000 ms at this marker time point. The changing lines in the figure represent the change of EEG collected from the participants. The marker 1–5 at the top of the figure refers to the time when the EEG data were collected from the participants. The markers are the specific points used to collect EEG signals in the experiment. The other six markers are not shown in the figure due to the size of the window. The markers are set every 300 m to collect the data of drivers for the first 500 ms and then 1,000 ms, adding up to 11 markers in this experiment. Then, MATLAB was used to extract the EEG energy data (μv2), which correspond to various frequency waves, into Excel files for analysis.
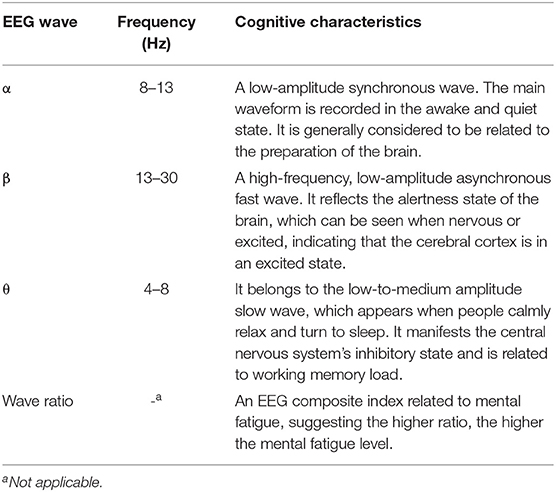
Table 1. Characteristics of three types of electroencephalogram (EEG) rhythms and a composite index.
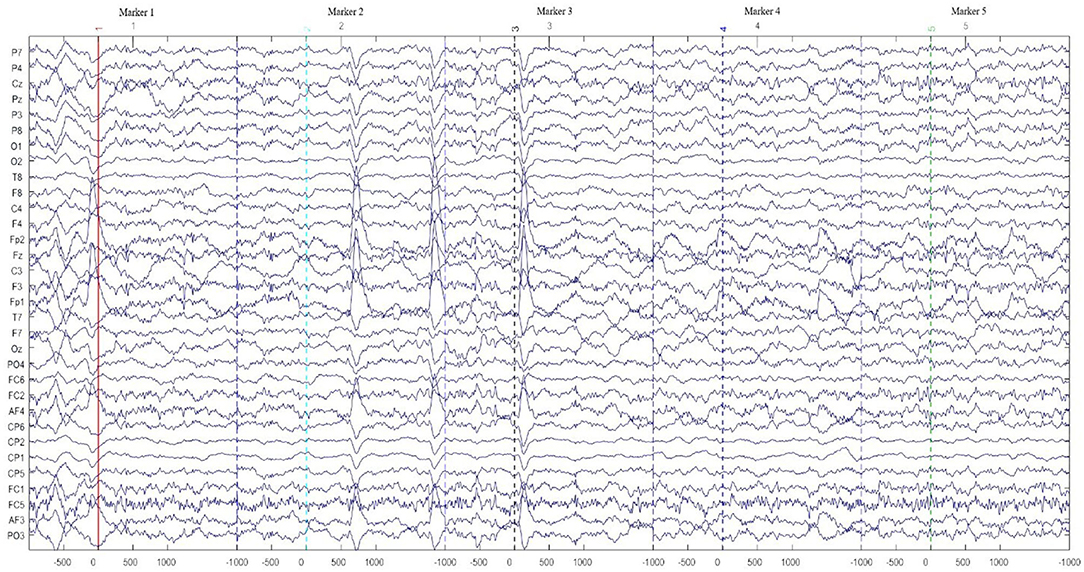
Figure 4. Sample electroencephalogram (EEG) waveforms after removing artifacts.
Results and Discussion
Analysis of Repeated Measurement of Variance
This analysis was based on the mean values of different speeds and involved Mauchly's sphericity test and the within-subject test. Mauchly's spherical hypothesis is used to test the autocorrelation degree of each level in a group. The repeated measures ANOVA is based on Mauchly's sphericity test of each data. If the spherical assumption is not satisfied, the Epsilon test should be used to correct the error. According to Tables 2, 3, the significance of all variables was >0.05, which satisfied the spherical assumption, and thus, the Epsilon correction was not required.
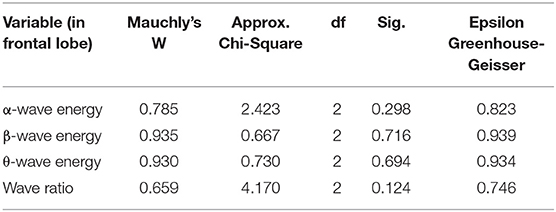
Table 2. Mauchly's test of sphericity.
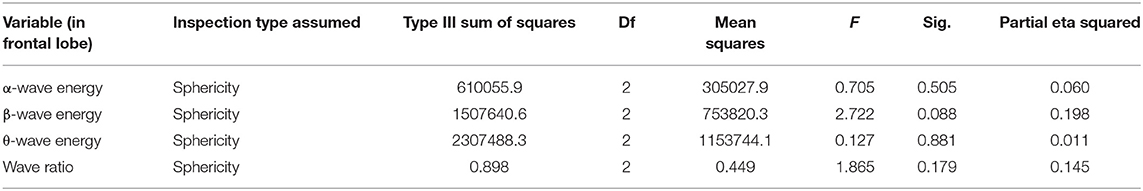
Table 3. Tests of within-subject effects.
The within-subject test aims to study the relationship between each dependent variable and the speed change. The within-subject tests refer to the comparison of the mean-variance among the groups. There would be no significant difference in the mean among the groups if p > 0.05. If the statistical significance requirement is met, this proves that the speed change has a substantial effect on the dependent variable. All the indicators meet the spherical assumption. However, in terms of the speed of the assumed sphericity, only the β-wave and the wave ratio are rather significant but are still not <0.05. The indifference assumption is accepted. Although all variables in the within-subject effects were not significant, in the tests of the within-subject contrasts shown in Table 4, the significance of the β-wave energy and the wave ratio in the second measurement were 0.037 and 0.031, respectively, with a p-value < 0.05. As noted, under the quadratic relationship, the β-wave energy and the wave ratio are related to the speed effect.
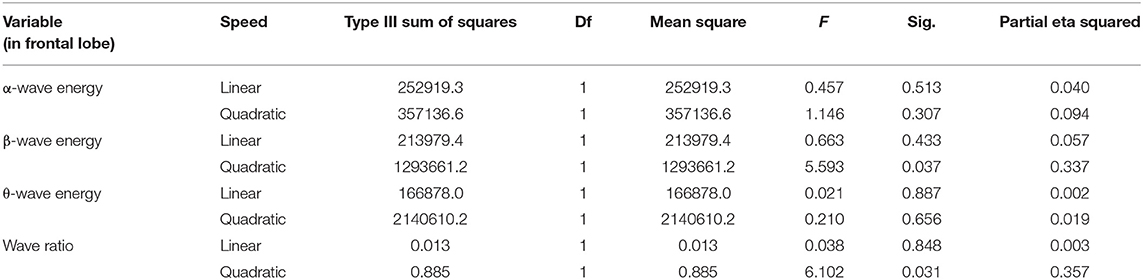
Table 4. Tests of within-subject contrasts.
EEG Test Comparison During Driving
This test evaluates the significance of the changes in the EEG data during the follow-up process under a car-following situation. This test would help indicate whether the EEG data have changed significantly during the entire driving process. When the distance is 0, 100, 400, 600, 800, 1,200, 1,400, and 1,600 m, the number of contrasts is ≥2, and the significance of each indicator is ≤0.05, indicating that the energy value indicators are changed significantly at these positions. In general, as the driving distance changes, the changes in the EEG energy value are statistically significant. Table 5 presents the results of the tests of contrasts of the three EEG indicators, which show the significance of the change in these indicators during the driving process.
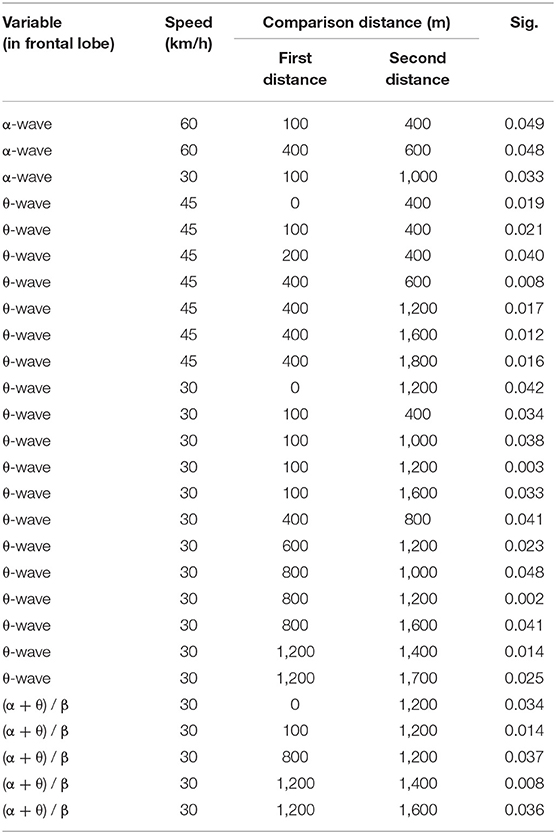
Table 5. Tests of contrasts of different speeds for various driving distances.
EEG Topography in Three Following Scenarios in the Tunnel
Figure 5 shows the EEG topographic maps of the three waves for different speeds. The color in the topographic map (from yellow to dark blue) indicates the activation level of the brain wave. The bluer the color, the less active it is. Intuitively, under the scenarios of the α-wave and β-wave at 45 km/h, the blue area of the EEG topographic map is larger than that at 30 and 60 km/h, indicating that the mental state of drivers at 45 km/h is more stable than at other speeds. Notably, the depth of the color in the map represents the visualized EEG activity, which directly reflects the activity of drivers at each following speed. However, the map cannot be used for the quantitative analysis.
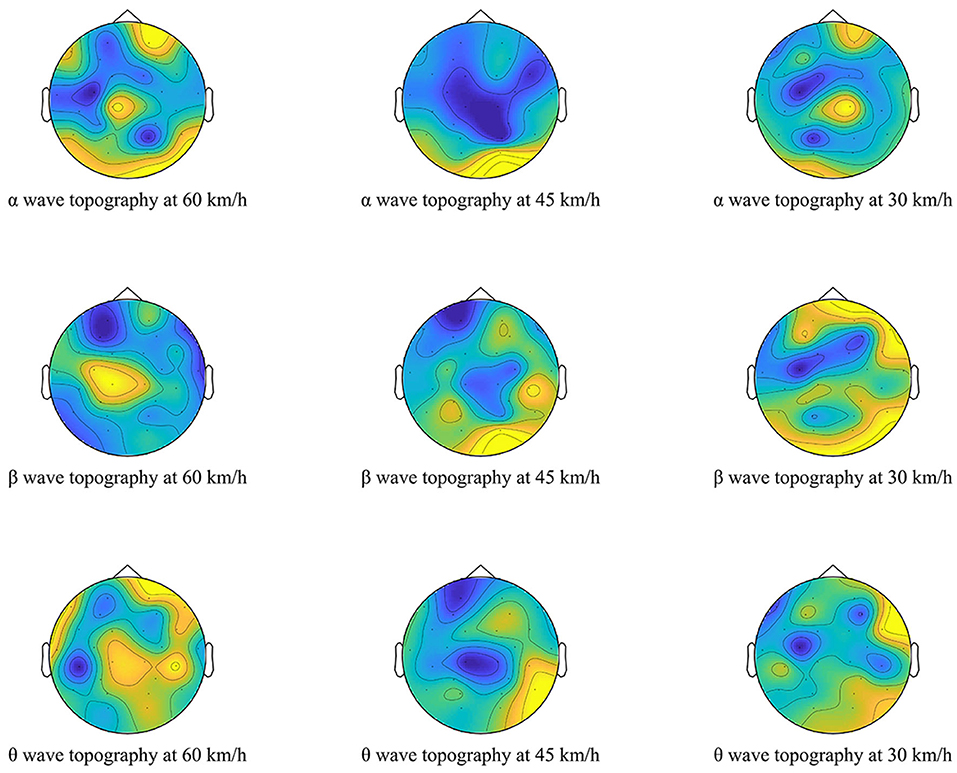
Figure 5. EEG topographic maps of the three waves of drivers for different speeds.
Change in EEG Energy During Driving
The statistical analysis of the change in EEG shows the significance of the β-wave energy and the wave ratio. The second measurements are 0.037 and 0.031, respectively, with p-value < 0.05. These results indicate that driving psychology varies for different vehicle-following conditions in the tunnel. The changes of the four EEG indicators during the driving process are described in the following. The unit of EEG wave energy is μv2, which represents the intensity of the three brain waves.
α-Wave Energy in the Frontal Lobe
The change in the α-wave energy in the frontal lobe for different driving speeds is shown in Figure 6. The X-axis is the distance the driver reached in the tunnel, and the Y-axis is the magnitude of the α-wave energy. As noted, as the driver drives in the tunnel, the energy value of the α-wave of the EEG decreases when the driver enters the first 100 m. When the α-wave energy decreases, the drowsiness of the driver is reduced, and the cognitive resources increase (Schier, 2000). This corresponds to the concentration of attention when entering the tunnel (Klimesch et al., 1998; Wang et al., 2015). As the driving distance increases, the α-wave energy increases two times and also decreases two times. The first increase occurs when the driver enters the middle of the tunnel, reaching the highest point at 400 m, and during 600–800 m, the α-wave energy fell rapidly. This trend indicates the distracted and concentrated process of drivers (from distraction to concentration). Then, during the driving process, the α-wave energy increases, but it does not recover to the level at 400 m. This trend might be due to that the driver is reaching the exit of the tunnel, where the driver is relieved when driving out of the tunnel without the tension of following other cars in the tunnel. However, the driver is still concentrating along with the highway driving conditions. After the driver enters the tunnel environment, the adaptation to the tunnel environment and the process of focusing attention have kept his level of drowsiness at a low level. As the driver enters the exit of the tunnel at 1,800 m, the driving task ends. The attention level of drivers drops rapidly.
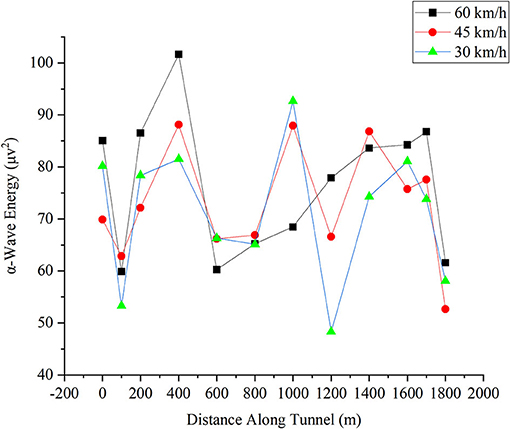
Figure 6. Change in α-wave energy in the frontal lobe for different driving speeds.
β-Wave Energy in the Frontal Lobe
The change in the β-wave energy in the frontal lobe for different driving speeds is shown in Figure 7. The X-axis is the distance the driver reached in the tunnel, and the Y-axis is the magnitude of the β-wave energy. As noted, the β-wave energy still shows the same effect as the participants drove in the first 0–400 m, i.e., the decline-increasing process when entering the tunnel. The increase in the β-wave represents an increase in the alertness level (Eoh et al., 2005). When the driver enters the tunnel, the alertness level first decreases and then increases. This reveals a distractive pattern of the drivers who enter the tunnel. In the first 100 m, drivers are distracted (due to the pressure of the tunnel, the environment, or the changing environment). However, in the next 100 m, the drivers regain their alertness when they adapt to the tunnel environment. After 400 m, the β-wave energy (i.e., the alertness level of drivers) is the lowest at 45 km/h. Then, from 800 to 1,600 m, the β-wave energy at 45 km/h is decreased steadily in contrast to the oscillation of the other two brain wave energies at the other speeds. This indicates that after adapting to the tunnel environment, the driver is more comfortable at 45 km/h.
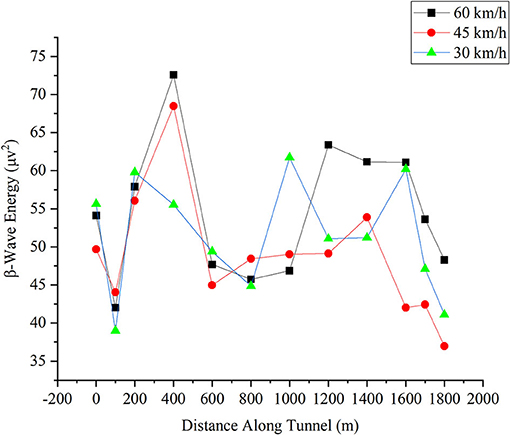
Figure 7. Change in β-wave energy in the frontal lobe for different driving speeds.
θ-Wave Energy in the Frontal Lobe
Figure 8 shows the change in the θ-wave energy in the frontal lobe for different driving. The θ-wave energy does not show significance in the repeated measures ANOVA. The X-axis is the distance the driver reached in the tunnel. The Y-axis is the magnitude of θ-wave energy. Its unit is μv2. In the contrast tests, compared with the energy of the other two speeds, the θ-wave energy value at 30 km/h had changed significantly between most of the distances. At the three speeds, the θ-wave energy value of drivers still maintained a descent-rise at 400 m at the tunnel entrance, but at 45 km/h, the fall is not apparent. At 400 m, the θ-wave energy is higher than the other two speeds. Because the driver alertness level decreased when the θ-wave energy increased (Åkerstedt et al., 1991), the driver alertness decreased at the entrance. As noted, the θ-wave energy for 30 km/h is higher than that for the other two speeds during the distance from 800 to 1,400 m, but after that, the θ-wave energy is less than that for the other speeds. This trend is similar to the α-wave energy where the θ-wave energy at 45 km/h does not recover to the level of 400 m. This might also be due to the relief of drivers, as noted in the analysis of the α-wave energy. At 60 km/h, the θ-wave energy also has a descent-rise, presumably indicating that the driver is attentive to the tunnel entrance.
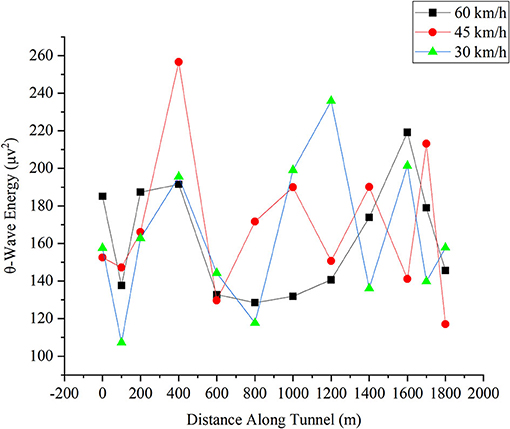
Figure 8. Change in θ-wave energy in the frontal lobe for different driving speeds.
Wave Ratio in the Frontal Lobe
The wave ratio has been demonstrated in the repeated measures ANOVA to illustrate the significance of change with speed. Figure 9 shows the change in the wave ratio in the frontal lobe for different driving speeds. The X-axis is the distance the driver reached in the tunnel, and the Y-axis is the magnitude of the wave ratio. As noted, the drop-rise effect occurred during 0–200 m. From 0 to 600 m, the ratio of the three following car speeds is almost the same, but at 600 m, the ratio at 45 km/h started to rise, drops at a distance between 1,200 and 1,600 m, and then sharply rises at 1,700 m. After the jump, the ratio decreases again. After 1,200 m, the ratio for 45 km/h is in the neutral position relative to the other two speeds (although a sudden jump occurs at 1,700 m) and then returns to around 5 at the exit. The increase in the wave ratio as driver fatigue increases (Cao et al., 2014) indicates that the fatigue value for 45 km/h is generally in the neutral position during tunnel driving. The ratio is not much different from that of the other two speeds.
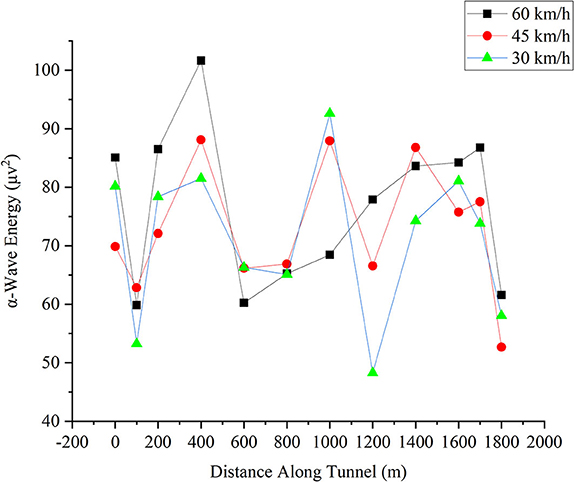
Figure 9. Change in the wave ratio in the frontal lobe for different driving speeds.
Conclusion
This study has evaluated three simulated driving scenarios in a long highway tunnel with different speeds of the front vehicle. The EEG technology was used to provide information about the dynamics and simulated electrical brain activity of subjects. Based on this study, the following comments are offered:
1. The analysis of the EEG energy data showed that the driver had the lowest alertness level and the best driving experience at 45 km/h. The wave ratio showed that the fatigue value for 45 km/h was generally in the middle and was not much different from the other two speeds. The study experiments involved a specific two-lane tunnel (i.e., one lane in each direction), which is 1,800 m long, and participants with an age range of 20–30 years. Since the tunnel length and the age of participants would affect the optimum speed of the tunnel, the preliminary finding that the 45 km/h is an appropriate speed applies only to the two-lane highway tunnels with lighting/sound and participants similar to those used in this study. Also, this finding is likely to apply to the tunnels in China, which exhibit similar conditions and may not be transferrable to other countries.
2. The results showed that the EEG energy of drivers had a falling–rising effect during tunnel driving. Since the environmental illuminance of the experiment was controlled, there was no interference in the dark adaptation process in vision. The analysis of the α, β, and θ waves revealed a similar effect in the EEG index when driving in the middle and the rear end of the tunnel. Researchers have recently studied the sustained attention and the attention behavior in distracted driving (Wang et al., 2013; Pallavi and Harish, 2016; Ding et al., 2019; Karran et al., 2019), especially the reduction and oscillations of the α-wave energy and the increase in the θ-wave energy (Klimesch et al., 1998; Wang et al., 2015). It could be speculated that the trends of these wave energies were related to the attention–concentration behavior of drivers during tunnel driving.
3. The results of the study showed different psychological reactions of drivers at different speeds. For the three speeds of 60, 45, and 30 km/h, the drivers had a better driving experience at a moderate speed (i.e., 45 km/h) when following the front car. A falling-rising effect on the three brain waves was also found. This finding might contribute to the analysis of driving behavior in the tunnel using physiological indicators. Furthermore, the conclusion of this study may help set the index weight when modeling the car-following behavior from the psychological state of drivers. Also, the finding might strengthen the inference and analysis of the motivation and mechanism of lousy behavior of drivers and might provide a theoretical basis for the prevention of tunnel traffic accidents.
4. This study has some limitations. The error of the EEG data process was relatively large, and the test scene was too restrictive. In addition, it was necessary to study the speed variable only due to the experimental conditions. Future studies might consider more complex driving scenarios involving a broader selection of speeds and various physiological indicators, such as ECG and skin electricity, which can be combined to study driver behavior more comprehensively. In addition, the effect of different tunnel lighting and noise levels can be explored.
Data Availability Statement
The original contributions presented in the study are included in the article/supplementary material, further inquiries can be directed to the corresponding author/s.
Ethics Statement
The studies involving human participants were reviewed and approved by Committee of Department of Civil Engineering, Fuzhou University. The patients/participants provided their written informed consent to participate in this study. Written informed consent was obtained from the individual(s) for the publication of any potentially identifiable images or data included in this article.
Author Contributions
YY and YF contributed to the study conception and design. YF performed the data collection. YY, YF, XZ, and SE contributed to the analysis and interpretation of results. YF, XZ, and SE prepared and drafted the manuscript. All authors reviewed the results and approved the final version of the manuscript.
Funding
This study was financially supported by the Traffic Research Center and College of Civil Engineering of Fuzhou University, the Fujian Provincial Department of Transportation, the Hebei Provincial Department of Transportation, and the Fujian Province Young and Middle-aged Teacher Education and Research Project (JT180852), China.
Conflict of Interest
The authors declare that the research was conducted in the absence of any commercial or financial relationships that could be construed as a potential conflict of interest.
Publisher's Note
All claims expressed in this article are solely those of the authors and do not necessarily represent those of their affiliated organizations, or those of the publisher, the editors and the reviewers. Any product that may be evaluated in this article, or claim that may be made by its manufacturer, is not guaranteed or endorsed by the publisher.
Acknowledgments
The authors are grateful to three reviewers for their thorough and most helpful comments.
References
Åkerstedt, T., Kecklund, G., and Knutsson, A. (1991). Manifest sleepiness and the spectral content of the EEG during shift work. Sleep 14, 221–225. doi: 10.1093/sleep/14.3.221
Amundsen, F. H., and Ranes, G. (2000). Studies on traffic accidents in Norwegian road tunnels. Tunnel. Undergr. Space Technol. Incorporat. Trenchless Technol. Res. 15, 3–11. doi: 10.1016/S0886-7798(00)00024-9
Arakawa, T., Hibi, R., and Fujishiro, T. A. (2019). Psychophysical assessment of a driver's mental state in autonomous vehicles. Transport. Res. A Pol. Pract. ce 124, 587–610. doi: 10.1016/j.tra.2018.05.003
Barua, S., Ahmed, M. U., and Begum, S. (2017). Classifying drivers' cognitive load using EEG signals. Stud. Health Technol. Inform. 237, 99–106.
Bashivan, P., Rish, I., and Heisig, S. (2016). Mental State Recognition via Wearable EEG. Available online at: https://export.arxiv.org/abs/1602.00985 (accessed June 05, 2016).
Bassan, S. (2016). Overview of traffic safety aspects and design in road tunnels. IATSS Res. 40, 35–46. doi: 10.1016/j.iatssr.2016.02.002
Borghini, G., Vecchiato, G., Toppi, J., Astolfi, L., Maglione, A., Isabella, R., et al. (2012). “Assessment of mental fatigue during car driving by using high resolution EEG activity and neurophysiologic indices,” in 2012 Annual International Conference of the IEEE Engineering in Medicine and Biology Society, (San Diego, CA: IEEE), 6442–6445. doi: 10.1109/EMBC.2012.6347469
Caliendo, C., and De Guglielmo, M. L. (2012). Accident rates in road tunnels and social cost evaluation. Proc. Soc. Behav. Sci. 53, 166–177. doi: 10.1016/j.sbspro.2012.09.870
Calvi, A., and D'amico, F. (2013). A study of the effects of road tunnel on driver behavior and road safety using driving simulator. Adv. Transport. Stud. 30, 59–76.
Cao, T., Wan, F., Wong, C., da Cruz, J., and Hu, Y. (2014). Objective evaluation of fatigue by EEG spectral analysis in steady-state visual evoked potential-based brain-computer interfaces. Biomed. Eng. Onl. 13:28. doi: 10.1186/1475-925X-13-28
Ding, S., Yuan, Z., An, P., Xue, G., Sun, W., and Zhao, J. (2019). “Cascaded convolutional neural network with attention mechanism for mobile EEG-based driver drowsiness detection system,” in 2019 IEEE International Conference on Bioinformatics and Biomedicine (BIBM) (San Diego, CA: IEEE), 1457–1464. doi: 10.1109/BIBM47256.2019.8982938
Doschoris, M., and Kariotou, F. (2017). “Mathematical foundation of electroencephalography,” in Electroencephalography, ed P. Sittiprapaporn (London: IntechOpen). Available online at: https://www.intechopen.com/chapters/54651
Eoh, H. J., Chung, M. K., and Kim, S.-H. (2005). Electroencephalographic study of drowsiness in simulated driving with sleep deprivation. Int. J. Indus. Ergon. 35, 307–320. doi: 10.1016/j.ergon.2004.09.006
Fan, X.-A., Bi, L.-Z., and Chen, Z.-L. (2010). “Using EEG to detect drivers' emotion with Bayesian Networks,” in 2010 International Conference on Machine Learning and Cybernetics (Qingdao: IEEE), 1177–1181. doi: 10.1109/ICMLC.2010.5580919
Godley, S. T., Triggs, T. J., and Fildes, B. N. (2002). Driving simulator validation for speed research. Accid. Anal. Prev. 34, 589–600. doi: 10.1016/S0001-4575(01)00056-2
Haak, M., Bos, S., Panic, S., and Rothkrantz, L. (2008). “Detecting stress using eye blinks and brain activity from EEG signals,” in Proceeding of the 1st Driver Car Interaction and Interface (DCII 2008). Prague.
Ingre, M., Åkerstedt, T., Peters, B., Anund, A., and Kecklund, G. (2006). Subjective sleepiness, simulated driving performance and blink duration: examining individual differences. J. Sleep Res. 15, 47–53. doi: 10.1111/j.1365-2869.2006.00504.x
Jap, B. T., Lal, S., Fischer, P., and Bekiaris, E. (2009). Using EEG spectral components to assess algorithms for detecting fatigue. Expert Syst. Appl. 36, 2352–2359. doi: 10.1016/j.eswa.2007.12.043
Karran, A. J., Demazure, T., Leger, P.-M., Labonte-LeMoyne, E., Senecal, S., Fredette, M., et al. (2019). Toward a hybrid passive BCI for the modulation of sustained attention using EEG and fNIRS. Front. Hum. Neurosci. 13:393. doi: 10.3389/fnhum.2019.00393
Kim, H. S., Yoon, D., Shin, H. S., and Park, C. H. (2018). Predicting the EEG level of a driver based on driving information. IEEE Trans. Intell. Transport. Syst. 20, 1215–1225. doi: 10.1109/TITS.2018.2848300
Kinateder, M., Pauli, P., Müller, M., Krieger, J., Heimbecher, F., Rönnau, I., et al. (2013). Human behaviour in severe tunnel accidents: effects of information and behavioural training. Transport. Res. F Traffic Psychol. Behav. 17, 20–32. doi: 10.1016/j.trf.2012.09.001
Kiymik, M. K., Akin, M., and Subasi, A. (2004). Automatic recognition of alertness level by using wavelet transform and artificial neural network. J. Neurosci. Methods 139, 231–240. doi: 10.1016/j.jneumeth.2004.04.027
Klimesch, W., Doppelmayr, M., Russegger, H., Pachinger, T., and Schwaiger, J. (1998). Induced alpha band power changes in the human EEG and attention. Neurosci. Lett. 244, 73–76. doi: 10.1016/S0304-3940(98)00122-0
Lemke, M. (1982). Correlation between EEG and driver's actions during prolonged driving under monotonous conditions. Accid. Anal. Prev. 14, 7–17. doi: 10.1016/0001-4575(82)90003-3
Li, M.-a., Zhang, C., and Yang, J.-F. (2010). “An EEG-based method for detecting drowsy driving state,” in 2010 Seventh International Conference on Fuzzy Systems and Knowledge Discovery (Yantai: IEEE), 2164–2167. doi: 10.1109/FSKD.2010.5569757
Lin, C.-T., Chuang, C.-H., Huang, C.-S., Tsai, S.-F., Lu, S.-W., Chen, Y.-H., et al. (2014). Wireless and wearable EEG system for evaluating driver vigilance. IEEE Trans. Biomed. Circ. Syst. 8, 165–176. doi: 10.1109/TBCAS.2014.2316224
Lin, C.-T., Wu, R.-C., Liang, S.-F., Chao, W.-H., Chen, Y.-J., and Jung, T.-P. (2005). EEG-based drowsiness estimation for safety driving using independent component analysis. IEEE Trans. Circ. Syst. I Reg. Pap. 52, 2726–2738. doi: 10.1109/TCSI.2005.857555
Liu, N.-H., Chiang, C.-Y., and Hsu, H.-M. (2013). Improving driver alertness through music selection using a mobile EEG to detect brainwaves. Sensors 13, 8199–8221. doi: 10.3390/s130708199
Ma, Z.-l., Shao, C.-f., and Zhang, S.-r. (2009). Characteristics of traffic accidents in Chinese freeway tunnels. Tunnel. Undergr. Space Technol. 24, 350–355. doi: 10.1016/j.tust.2008.08.004
Miyake, K., Ota, S., Shigematsu, D., Ohkusa, K., Ikeda, Y., and Jinno, M. (2019). Visibility improvement in expressway tunnels by optimizing the color temperature and light distribution of the pulse-operated LED luminaires. J. Sci. Technol. Light. 42, 22–28. doi: 10.2150/jstl.IEIJ170000620
Pallavi, T., and Harish, G. (2016). “Implementation of EEG based driver's attention tracking and habitats monitoring system,” in 2016 International Conference on Communication and Electronics Systems (ICCES) (Coimbatore: IEEE), 1–4. doi: 10.1109/CESYS.2016.7889852
Philip, P., Sagaspe, P., Taillard, J., Valtat, C., Moore, N., Åkerstedt, T., et al. (2005). Fatigue, sleepiness, and performance in simulated versus real driving conditions. Sleep 28, 1511–1516. doi: 10.1093/sleep/28.12.1511
Reed, M. P., and Green, P. A. (1999). Comparison of driving performance on-road and in a low-cost simulator using a concurrent telephone dialling task. Ergonomics 42, 1015–1037. doi: 10.1080/001401399185117
Resalat, S. N., and Saba, V. (2015). A practical method for driver sleepiness detection by processing the EEG signals stimulated with external flickering light. Sign. Image Video Proces. 9, 1751–1757. doi: 10.1007/s11760-015-0760-x
Risser, M. R., Catesby, W. J., and Freeman, F. G. (2000). Driving simulation with EEG monitoring in normal and obstructive sleep apnea patients. Sleep 3:393.
Schier, M. A. (2000). Changes in EEG alpha power during simulated driving: a demonstration. Int. J. Psychophysiol. 37, 155–162. doi: 10.1016/S0167-8760(00)00079-9
Standardization Administration of the People's Republic of China (2014). China Highway & Transportation Standards: Technical Standard of Highway Engineering JTG-B01-2014. Beijing.
Torsvall, L. (1987). Sleepiness on the job: continuously measured EEG changes in train drivers. Electroencephal. Clin. Neurophysiol. 66, 502–511. doi: 10.1016/0013-4694(87)90096-4
Transportation Research Board (2010). Highway Capacity Manual 2010. Washington, DC: TRB, National Research Council.
Wang, Y.-K., Jung, T.-P., Chen, S.-A., Huang, C.-S., and Lin, C.-T. (2013). “Tracking attention based on EEG spectrum,” in HCI International 2013 - Posters' Extended Abstracts. HCI 2013. Communications in Computer and Information Science, vol 373, ed. S. C. (Berlin, Heidelberg: Springer), 450–454. doi: 10.1007/978-3-642-39473-7_90
Wang, Y. K., Jung, T. P., and Lin, C. T. (2015). EEG-based attention tracking during distracted driving. IEEE Trans. Neural Syst. Rehabil. Eng. 23, 1085–1094. doi: 10.1109/TNSRE.2015.2415520
Yan, Y., Dai, Y., Li, X., Tang, J., and Zhongyin, G. (2019). Driving risk assessment using driving behavior data under continuous tunnel environment. Traffic Injury Prev. 20, 807–812. doi: 10.1080/15389588.2019.1675154
Yang, L., Guan, W., Ma, R., and Li, X. (2019a). Comparison among driving state prediction models for car-following condition based on EEG and driving features. Accid. Anal. Prev. 133:105296. doi: 10.1016/j.aap.2019.105296
Yang, L., Ma, R., Zhang, H. M., Guan, W., and Jiang, S. (2018). Driving behavior recognition using EEG data from a simulated car-following experiment. Accid. Anal. Prev. 116, 30–40. doi: 10.1016/j.aap.2017.11.010
Yang, Y., Chen, J., Easa, S., Yu, S., and Zheng, X. (2020a). Effectiveness of yellow color guardrail belt at freeway exits. Accid. Anal. Prev. 146:105737. doi: 10.1016/j.aap.2020.105737
Yang, Y., Chen, M., Wu, C., Easa, S. M., and Zheng, X. (2020b). Structural equation modeling of drivers' situation awareness considering road and driver factors. Front. Psychol. 11:1601. doi: 10.3389/fpsyg.2020.01601
Yang, Y., Chen, Y., Wu, C., Easa, S. M., Lin, W., and Zheng, X. (2020c). Effect of highway directional signs on driver mental workload and behavior using eye movement and brain wave. Accid. Anal. Prev. 146:105705. doi: 10.1016/j.aap.2020.105705
Yang, Y., Easa, S. M., Zheng, X., Hu, A., and Liu, F. (2019b). Evaluation effects of two types of freeway deceleration markings in China. PLoS ONE 14:e0220811. doi: 10.1371/journal.pone.0220811
Yang, Y., Jianying, C., Said, M., Easa Xinyi, Z., Wei, L., and Yichuan, P. (2020d). Driving simulator study of the comparative effectiveness of monolingual and bilingual guide signs on Chinese highways. Transport. Res. F Traffic Psychol. Behav. 68, 67–78. doi: 10.1016/j.trf.2019.11.008
Keywords: driver mental state, driving simulator, electroencephalogram, highway tunnel, car following
Citation: Yang Y, Feng Y, Easa SM and Zheng X (2021) Evaluation of Mental Load of Drivers in Long Highway Tunnel Based on Electroencephalograph. Front. Psychol. 12:646406. doi: 10.3389/fpsyg.2021.646406
Received: 04 January 2021; Accepted: 03 September 2021;
Published: 04 October 2021.
Edited by:
Varun Dutt, Indian Institute of Technology Mandi, IndiaReviewed by:
Shruti Kaushik, Indian Institute of Technology Mandi, IndiaAbhinav Choudhury, Indian Institute of Technology Mandi, India
Copyright © 2021 Yang, Feng, Easa and Zheng. This is an open-access article distributed under the terms of the Creative Commons Attribution License (CC BY). The use, distribution or reproduction in other forums is permitted, provided the original author(s) and the copyright owner(s) are credited and that the original publication in this journal is cited, in accordance with accepted academic practice. No use, distribution or reproduction is permitted which does not comply with these terms.
*Correspondence: Xinyi Zheng, emhlbmd4aW55aUBmenUuZWR1LmNu