 María de la Cruz Del Río-Rama1
 José Álvarez-García
- 1Business Management and Marketing Department, Faculty of Business Sciences and Tourism, University of Vigo, Ourense, Spain
- 2Financial Economy and Accounting Department, Faculty of Business, Finance and Tourism, University of Extremadura, Cáceres, Spain
- 3Department of Latin American Studies, Graduate School of International and Area Studies (GSIAS), Hankuk University of Foreign Studies, Seoul, South Korea
The aim of this research is to validate the explanatory model of how the quality of service perceived by students of a higher education center influences their loyalty (retaining and attracting new students) through mediating variables: perceived value, expectations, and satisfaction. The methodology used to validate the measurement scales is exploratory, and confirmatory factor analysis and the structural equation modeling (SEM) technique are applied to analyze the causal relationships proposed in the model. The results show that the key variables to improve student's loyalty to the center are the quality of the service provided and the satisfaction perceived by the students. Both variables are postulated as a major source of competitive advantages. It is also observed that service quality is one of the three key variables to achieve student's satisfaction together with expectations and perceived value. This research and its results allow us to understand the relationship between quality and satisfaction with loyalty and to identify the background variables of satisfaction (perceived service quality, perceived value, and expectations), as well as to obtain evidence of the importance that expectations have within the model for the formation of both perceived quality and satisfaction.
Introduction
In recent years, the university has undergone major changes, including, in general terms, globalization (Maringe and Gibbs, 2009; Altbach et al., 2010), the internationalization level that allows for free movement of students (Altbach, 2004), increased competition from the private sector, reduced funding (Hemsley-Brown et al., 2016; Verčič et al., 2016), and demographic causes, such as low birth rates experienced by many countries (Maringe and Gibbs, 2009). These changes lead to the university being immersed in highly competitive, global, and highly changing markets, competing for students, resources (human and financial), and reputation/image. In this context, the student becomes the focus of attention of universities, and strengthening the relationship with their students is the key for future success (Fernández et al., 2007), thus retaining current students and attracting new students.
In this regard, there are many studies that show that proper management of the intangible assets owned by organizations (university) leads to achieving a better competitive position (Lev and Zarowin, 1999; Hand and Lev, 2003) and achieving both their social and economic objectives in the medium and long term (Farrugia and Lane, 2013; Hemsley-Brown et al., 2016; Plewa et al., 2016; Christensen and Gornitzka, 2017). Thus, these intangible assets become key elements for survival. In this context, universities must be concerned about aspects that are closely linked to their survival, such as the background dimensions of loyalty, service quality, perceived value, expectations, and satisfaction, among others.
Service quality is a key intangible asset for achieving student's loyalty that must be managed to create a competitive advantage and differentiate itself from the competition in current markets (Paramewaran and Glowacka, 1995), in order to attract and retain/loyalty from the best students (Helgesen and Nesset, 2007; Stevens et al., 2008; Polat, 2011). It is clear that what currently determines the competitive position of a company or organization, as well as its long-term survival “is customers' opinion regarding the product or service they receive” (Aquino and Vogel, 2009, p. 1), that is, the quality perceived.
The literature on perceived service quality is very extensive; empirical studies focused on how to measure service quality in organizations, as well as studies that seek to understand the relationships between service quality, satisfaction, and loyalty (Parasuraman et al., 1985, 1988; Cronin and Taylor, 1992; Fornell, 1992; Iacobucci et al., 1995; Oliver, 1999; Cronin et al., 2000; Dabholkar et al., 2000; Mahamad and Ramayah, 2010). However, few studies show the consequences of quality education (Chua, 2004; Blass and Weight, 2005; Cornuel, 2005; De Oliveira and Ferreira, 2009) and study the relationship between service quality and loyalty in the higher education sector (Rowley, 1996; Peng and Samah, 2006; Tsuji et al., 2007; Yunus et al., 2010). This research specifically considers the direct relationship between both constructs, as well as the indirect relationship through variables, such as satisfaction, expectations, and perceived value. This research contributes to the existing knowledge by providing empirical evidence of how the antecedents considered in the proposed model have an influence, and in particular, quality on student's loyalty in the higher education sector, enabling to strengthen the relationship between the university and the student.
Following this line of work, the objective is to contrast an explanatory model of how the quality of the service perceived by the students of a university center influences their loyalty to the center through variables, such as perceived value, expectations, and satisfaction. The methodology used to validate the proposed model is the structural equation modeling (SEM) technique. The target population is students of a university faculty in Spain, and 224 valid surveys were obtained through a structured questionnaire.
It is important to analyze the structure of relationships between loyalty and service quality since “it will allow university managers to know what dimension/s of quality to focus their efforts on, such as increasing the perceived value of students, how to manage expectations to improve their students' satisfaction and consequently to increase their loyalty to the center. This knowledge will allow them to implement appropriate programs that promote, establish, develop and maintain successful long-term relationships with current and former students” (Annamdevula and Bellamkonda, 2016, p. 446).
This paper is structured into five sections. In the introduction, the subject under study is contextualized and the research is presented together with the objective. The theoretical framework that supports the research is explained in the following section, and the working hypotheses are presented. In section Methodology, the methodology is described; sample, questionnaire, and data analysis and the empirical results are presented in section Results. Finally, the results are discussed, the main conclusions are drawn, and the limitations of the research are explained.
Literature Review and Hypotheses
Perceived Service Quality
The concept of perceived service quality arises when considering quality from an approach focused on technical aspects (objective quality focused on the service provider perspective); it evolves toward a more subjective approach based on customer perceptions (external or provision dimension). It is a more appropriate approach in the context of services. Its representatives are the North American School led by Parasuraman, Zeithaml, and Berry, who propose that perceived service quality should be defined from the customer perception perspective, focusing on the delivery phase of quality service (Parasuraman et al., 1985).
On the other hand, this concept is very complex and vague due to the intrinsic characteristics of services (intangibility, separability, expiration, etc.): (1) it is difficult to evaluate service quality, as it is necessary to evaluate intangible aspects that are difficult to identify and quantify (Parasuraman et al., 1985) and (2) the aspects are liable to different evaluations by their clients (Zeithaml, 1988; Rosenbloom, 1991). According to Parasuraman et al. (1985, p. 36), “the difference between the evaluation of the quality of a service and that of a good by a consumer is not in the process, but in the nature of the characteristics on which the evaluation is made.” In the higher education context, it becomes even more complex, according to Annamdevula and Bellamkonda (2016, p. 447), due to some unique characteristics, such as (1) the cognitive participation of students in the service process, (2) students' needs that are satisfied by different parties, (3) continuous services, and (4) long-term services.
All this leads to numerous definitions being proposed by experts in the field (see Grönroos, 1982, p. 33; Zeithaml, 1988; Carman, 1990, p. 33; Koelemeijer et al., 1993). As in the case of the service sector, in the educational context, Harvey and Green (1993) state that it is a multitasked concept and lacks a correct definition. Therefore, there is also a lack of consensus in this sector on how to define and measure service quality (Clewes, 2003; Sultan and Wong, 2012). However, there is consensus that students are the priority clients of educational activities (Gremler and McCollough, 2002; Marzo-Navarro et al., 2005). This research considers the proposal by O'Neil and Palmer (2004, p. 40) for the university education sector, “the difference between what a student expects to receive and his/her perceptions of the actual delivery.” To propose it, these authors reviewed the current literature and support the ideas proposed by Parasuraman et al. (1988), who define it as a global judgment of the consumer regarding the superiority of a service, which results from the comparison made by clients between the expectations regarding the service they are going to receive and the perceptions of the performance of the organizations providing the service (Parasuraman et al., 1985; Grönroos, 1994). Therefore, a service can be said to be of quality when it meets or exceeds the client's expectations (Grönroos, 1990; Zeithaml, 1990).
As it has been revealed, to assess the perceived quality of a service by a client, it is necessary to identify which dimensions are considered for its assessment. Currently, there is a consensus about the multidimensional nature of the concept, but not in the number or content of the dimensions that make up perceived quality (Parasuraman et al., 1991). Specifically, in the university education sector, LeBlanc and Nguyen (1997) consider seven dimensions (personal contact with teachers, reputation, physical evidence, personal contact with administrative staff, curriculum, responsiveness, ease of access). Li and Kaye (1998) use the five dimensions proposed by Parasuraman et al. (1988) for the service sector (tangibility, reliability, security, empathy, and responsiveness). Owlia and Aspinwall (1996) propose four dimensions (attitude, content, academic resources, and competence). Kwan and Ng (1999) consider seven dimensions (course content, facilities, assessment, advisory service, communication with the university, teachers' concern about students, and social activities). Oldfield and Baron propose to use essential elements (requirements), desirable elements (aspects), and functional elements. In this research, the scale of De la Fuente Mella et al. (2010), which was created based on an extensive literature review (Cuthbert, 1996; LeBlanc and Nguyen, 1997; Owlia and Aspinwall, 1998; Kwan and Ng, 1999; Alves, 2000; Oldfield and Baron, 2000; Cardone et al., 2003; Alves and Raposo, 2004; Marzo-Navarro et al., 2005), is considered and adapted. It is made up of five dimensions (facilities, service staff, teachers' attitudes and behavior, competence of teachers, and career opportunity).
In this context, the following hypothesis is proposed:
H1: The perceived service quality of the Faculty is a multidimensional construct made up of the facilities, service staff, teachers' attitudes and behavior, competence of teachers, and career opportunity dimensions.
Consequences of Perceived Service Quality
Relationship of Perceived Quality With Loyalty
Oliver (1997, p. 392) define loyalty as “… a deeply held commitment to rebuy or repatrionize a preferred product or service consistently in the future, despite situational influences and marketing efforts having the potential to cause switching behavior.” This same author affirms that there are four loyalty phases and suggests that customers can become loyal in any of these phases: (1) cognitive loyalty, attitude toward the brand based on the information provided; (2) affective loyalty, attitude toward the brand due to its successful repeated use; (3) conative loyalty, related to the customer's behavioral intention toward a repeat purchase; and (4) loyalty, additional desire to overcome obstacles that could prevent a repeat purchase. Along these same lines, Dick and Basu (1994) and Lam et al. (2004) consider that loyalty is made up of two interrelated components, namely, the relative attitude (linked to components 1, 2, and 3) and the repeat purchase pattern (retention of repeated client sponsorship). Hennig-Thurau et al. (2001) and Navarro et al. (2005) take this vision into account to define student's loyalty in the higher education context. Therefore, they consider that student's loyalty has an attitudinal component and a behavioral component. This loyalty is configured as the establishment of long-term relationships between the university and its current and former students.
In the university education context, there are studies that corroborate the positive relationship between perceived quality (high quality) and the loyalty of its students (Boulding et al., 1993; Zeithaml et al., 1996; Helgesen and Nesset, 2007). According to Hennig-Thurau et al. (2001), the latter is considered both before and after the completion of student's studies. Other studies also corroborate that there is not only a direct but also an indirect relationship through other variables, such as satisfaction (Bloemer et al., 1999; Caruana, 2002; Huili and Jing, 2012). Therefore, the following hypothesis can be proposed:
H2: The perceived quality of the Faculty influences loyalty toward it directly and positively.
Relationship of Perceived Quality With Satisfaction Antecedents: Perceived Value and Expectations
There are many studies carried out in the service sector in which the concepts of service quality, satisfaction, and loyalty are related (Nguyen, 2009), with a consensus in their interrelations, in the sense that if service quality is improved, as a determining/background element of satisfaction (Ahmed et al., 2010; Clemes et al., 2013), satisfaction also improves (Bloemer et al., 1999; Gronholdt et al., 2000; Caruana, 2002; Mahamad and Ramayah, 2010; Huili and Jing, 2012; Olsen et al., 2012), and in compensation, loyalty increases (Annamdevula and Bellamkonda, 2016). However, at present, although the mediating role of satisfaction in service quality and loyalty relationship was corroborated in numerous studies (Huili and Jing, 2012; Jiewanto et al., 2012; Clemes et al., 2013), there is no consensus on what the satisfaction antecedents are and their relationship with quality. Three types of satisfaction antecedents are considered in this research: perceived quality, perceived value, and students' expectations.
Perceived Value
Perceived value is a key element in the management of services (Cronin et al., 2000), by enabling to create a competitive advantage (Woodruff, 1997), based on its ability to analyze and predict consumer behavior (Huber et al., 2007). There are many approaches followed to conceptualize this concept, as it is very ambiguous and subjective (a different perception for each client) (Flint et al., 2002; Wang et al., 2004). One of the first definitions was the one proposed by Zeithaml (1988, p. 13), “the global assessment that the consumer makes of the usefulness of a product based on the perceptions of what is delivered and received.” Therefore, it implies reaching a balance between the benefits that the client obtains and the sacrifices made to acquire the service (Zeithaml, 1988; McDougall and Levesque, 2000; Hermawan, 2001; Ledden et al., 2007). In the higher education field, Hermawan (2001), LeBlanc and Nguyen (1999), and Ledden et al. (2007) follow Zeithaml's perspective and consider that it is the general assessment made of the usefulness of the service, based on the perception of what is received and what is given.
In the higher education context, there is little research that focuses on the analysis of value creation toward students (LeBlanc and Nguyen, 1999; Ledden et al., 2007; Suki et al., 2008; Brown and Mazzarol, 2009; Floyd et al., 2009; Yeop et al., 2009; Alves, 2010; Lai et al., 2012). However, in the literature on services, it is analyzed confirming a direct impact of perceived quality on perceived value (Brady and Robertson, 1999; Teas and Agarwal, 2000; Tam, 2004), and this, in turn, influences the client's satisfaction positively (Heskett et al., 1997; Tam, 2004). In this regard, when students perceive that the quality of the service exceeds the costs of obtaining the service, the greater the perception of the value of the service, and in turn, the greater their satisfaction (Tam, 2004).
This leads to the following hypotheses:
H3: The perceived quality of the Faculty influences the value perceived by the student directly and positively.
H4: The perceived value of the Faculty influences student's satisfaction directly and positively.
Expectations
They are defined by Parasuraman et al. (1988) as clients' desires or needs. In this regard, it is important for service providers to identify them in order to meet their clients' expectations. In the educational context, students' expectations are the result of previous experiences with similar services, the information received from the education center itself, and friends and family's opinions.
Research carried out in the service sector (Anderson, 1994; Coye, 2004; Hsieh et al., 2011; Gures et al., 2014) confirms that there is a direct relationship with customer satisfaction due to its role as a determinant in the satisfaction assessment process (Parasuraman et al., 1985, 1988; Grönroos, 1994; O'Connor et al., 2000; Pham and Simpson, 2006). Although there are fewer studies in the education sector, this relationship is also corroborated (Alves and Raposo, 2007; Shahsavar and Sudzina, 2017; Marimon et al., 2020). In addition, the relationship between expectations and perceived value and perceived quality is corroborated (Alves and Raposo, 2007; Shahsavar and Sudzina, 2017).
It is expected to have a direct relationship with student's satisfaction.
H5: The student's expectations influence perceived quality directly and positively.
H6: The student's expectations influence perceived value directly and positively.
H7: The student's expectations influence student's satisfaction directly and positively.
Relationship of Satisfaction With Loyalty
One of the first definitions of the concept of satisfaction was provided by Oliver (1981, p. 28) for the service sector “as the consumer's value judgment regarding pleasure derived from the utilization of level fulfillment.” In the educational field, a context that is of interest to us, although there is not much literature on this issue (Annamdevula and Bellamkonda, 2016), there is in fact a consensus that considers this concept as complex, which depends on the context of analysis (Giese and Cote, 2000; Navarro et al., 2005).
One of the first definitions is the one proposed by Elliot and Healy (2001), “it is a short-term attitude that results from the assessment of their experience with the educational service received.” Subsequently, it is explained by Elliott and Shin (2002, p. 197) “. the favorability of a student's subjective evaluation of the various outcomes and experiences associated with education” and they further clarify that satisfaction is continuously formed from the student's repeated experiences in the center.
There are many studies that study student's satisfaction with the quality services of educational institutions (Douglas et al., 2006; Sigala et al., 2006; Alves and Raposo, 2007), as well as those that support the relationship between satisfaction and loyalty (Gronholdt et al., 2000; Chaudhuri and Holbrook, 2001). In these studies, satisfaction acts as an antecedent to loyalty (Bitner, 1990), so greater satisfaction causes an increase in loyalty (Fornell, 1992), which results in attracting new students caused by word-of-mouth communication (Clemes et al., 2008, 2013) and in retaining current students (Mavondo et al., 2000; Wiers-Jenssen et al., 2002; Schertzer and Schertzer, 2004; Marzo-Navarro et al., 2005; Helgesen and Nesset, 2007).
H8: The satisfaction perceived by the students of the Faculty influences their loyalty to the Faculty directly and positively.
To summarize, in Figure 1, the “path diagram” is shown.

Figure 1. Theoretical model and hypothesis.
Methodology
Universe Study, Questionnaire, and Measurement
The target population for the study is students enrolled at a Higher Education Centre in Spain, with a total population of 1,486 undergraduate students studying in the area of knowledge of Tourism, Finance, Accounting, and Business Administration. The means used to collect the data was through an online structured questionnaire (Google Forms), which was active on the platform for 1 month, obtaining a sample of 224 valid questionnaires. The response rate was 15.07%, and the sampling error was 6% for a confidence level of 95% (Z = 1.96, p = q = 0.50). The common method bias (CMB) was verified through the Harman single-factor test (Podsakoff and Organ, 1986); the non-existence of the common method problem in this research was confirmed.
To form the structured questionnaire, the literature was reviewed to identify the measurement scales of the constructs included in the model used by other studies. Specifically, the scale to measure service quality with 40 items was adapted from De la Fuente Mella et al. (2010), while the scale of Schlesinger et al. (2014) was used to measure perceived value, adapted from Dodds et al. (1991). The expectation scale (three items) was obtained from Schlesinger et al. (2014), adapted from Morgan and Hunt (1994), and satisfaction was measured by using the three-item scale by Schlesinger et al. (2014), adapted from Fornell (1992). Finally, the loyalty scale (four items) was from Cervera et al. (2012), adapted from the scale of Martensen et al. (1999) and Hennig-Thurau et al. (2001) (see Appendix). A Likert scale ranging from 1 “totally disagree” to 5 “totally agree” was used.
Data Analysis
The methodologies used were exploratory factor analysis (EFA) and confirmatory factor analysis (CFA) to validate the measurement scales. The statistical program SPSS 19.0 (Statistical Package for the Social Sciences) was used for the exploratory analysis, and AMOS 20.0 (Analysis of Moment Structures) software was used for the confirmatory analysis.
Validation of the Measurement Model
The psychometric properties of the scales (Anderson and Gerbing, 1988), reliability and unidimensionality, were analyzed first by means of an exploratory analysis as a prior phase to the application of a CFA.
First, the reliability of the scales or the degree to which a measurement is free of random errors was analyzed. It is measured through two indicators (Kunder–Richardson method): (1) item–total correlation >0.3 (Nurosis, 1993) and Cronbach's alpha >0.7. The latter evaluates the internal consistency of the scale through the correlation of each of the variables with the rest of the scale. Once contrasted, unidimensionality is analyzed, which allows us to obtain the explained variance percentage, the factor loading of each indicator, and to observe if they load on more than one factor, loadings >0.05 (Hair et al., 1999), and the percentage of the explained variance >50%. First, the EFA of principal components with varimax rotation (Bagozzi and Baumgartner, 1994) is applied, and based on these results, the CFA allowed us to examine the measurement model (reliability and validity of measures), the structural model, and the global model of each of the scales. To examine the fit of the structural measurement model, it is confirmed that the critical ratio for regression weight must exceed ±1.96 and the standard regression weight (β) >0.5 (Jöreskog and Sörbom, 1993). To examine the global model, the goodness-of-fit indices (GFIs) of the model are observed (Lévy-Mangin and Varela-Mallou, 2006): (1) absolute fit indices [GFI > 09, root mean square error of approximation (RMSEA) <0.08], incremental adjustment indices [normed fit index (NFI), comparative fit index (CFI), adjusted goodness-of-fit index (AGFI), they must all be >0.9], parsimony indices [parsimonious goodness-of-fit index (PGFI)], the higher the value, the greater the parsimony of the model. Values between 2 and 3 are recommended (Jöreskog and Sörbom, 1993) for normalized χ2 (χ2/df). To finish, the reliability is estimated again through composite reliability (CR) >0.7: The higher the reliability, the greater the internal consistency of its indicators and variance extracted (AVE) >0.5; this measures the total amount of variance of the indicators that is taken into account by the latent construct.
Estimation of Structural Equation Modeling (SEM)
The SEM technique or covariance structure model was used to test the proposed structural model. The statistical program AMOS 20.0 allowed us to test the causal relationships proposed in the theoretical model (β standard regression weight and critical coefficient > ±1.96). Taking into account the sample size and the infringement of the assumption of normal distribution of the observable variables (Kolmogorov–Smirnov test and analysis of multivariate kurtosis and critical ratio), the method of maximum likelihood (ML) (bootstrap 500 samples) was chosen for the estimation of the model. Lévy-Mangin and Varela-Mallou (2006, p. 163–166) propose four stages “parameter estimation, adjustment evaluation, re-specification of the model, and interpretation of results.” The structural and global model was evaluated through the GFIs already discussed. The coefficient of determination for each structural equation is represented by R2, which indicates the proportion of variance explained by the exogenous factor in each of the endogenous factors (Lévy-Mangin and Varela-Mallou, 2006, p. 245).
Results
Measurement Model
First, the reliability analysis of the measurement scales (item–total correlation and Cronbach's α estimation) is performed in order to examine the internal consistency of each of the measurement instruments and to determine if it is necessary to eliminate any item. At the same time, it is evaluated whether the items that measure each construct do so in a consistent and stable manner, as well as whether they are free from systematic and random errors. An adequate internal consistency of them is corroborated: total-item correlation >0.3, except IC6, being necessary to eliminate this item; Cronbach's α is higher than the recommended minimum of 0.7 (Table 1).
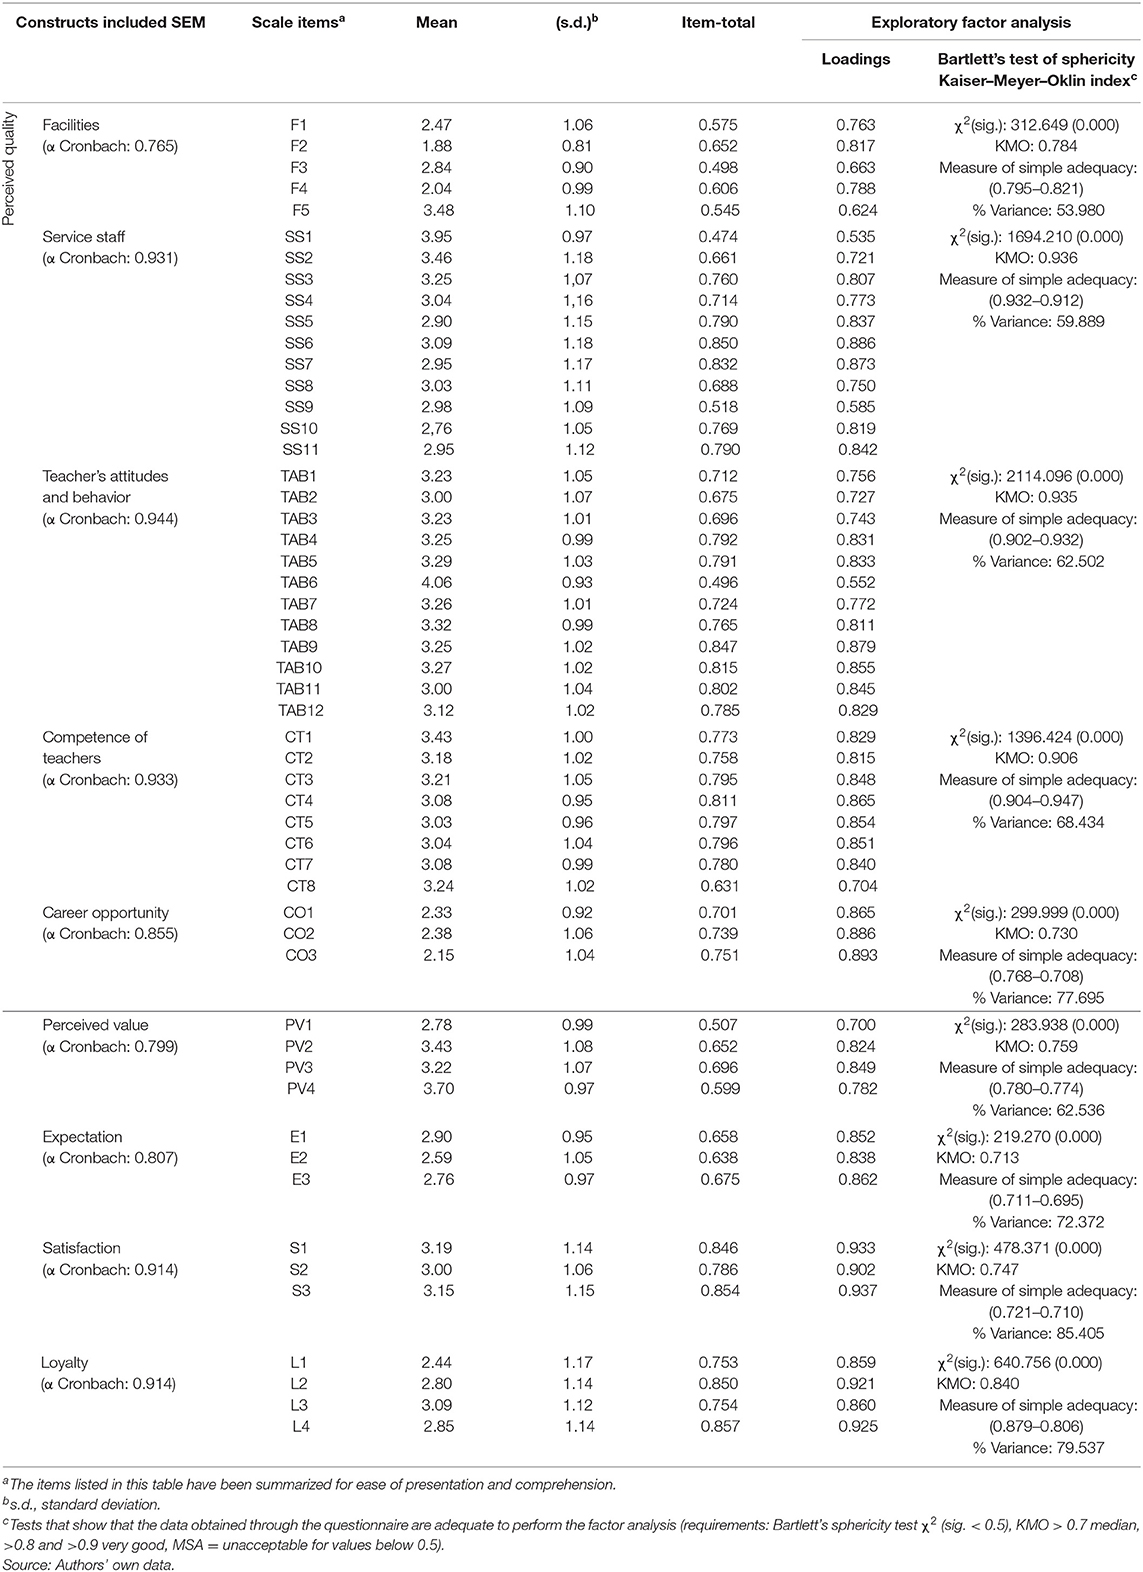
Table 1. Descriptive findings and exploratory factor analysis (reliability and validity of scales).
Second, unidimensionality is confirmed by applying EFA, in order to determine the percentage of explained variance and the factor loading of each indicator. The method used is principal axis analysis with varimax rotation (Bagozzi and Baumgartner, 1994), and those indicators with factor loadings <0.5 (Hair et al., 1999) are eliminated. All measurement scales are checked to be unidimensional.
As a last step, CFA is applied to confirm the unidimensionality results. In the specific case of the perceived quality scale, the EFA finds that the items that measure each construct (they are considered taking into account the previous literature) do so appropriately. In addition, taking into account that the perceived quality was treated as a multidimensional construct or as independent measurement constructs of this concept in the previous literature, in this research, by following Hair et al. (1999), the strategy of rival models (Table 2) is developed, in order to check for multidimensionality. Model 1 is proposed, in which all items load on a single variable (perceived quality), which is compared to two first-order Model 2 with five quality dimensions (oblique and orthogonal). Model 2 (oblique) of the first order is shown to have a better fit than Models 1 and 2 (orthogonal), which is re-specified to improve the fit (Model 3), and is compared to a second-order model (Model 4). The results confirm that the optimal measurement model is Model 4 of the second-order (items CI3, CI5, CA3, CA4, and CPS1 are eliminated, as they do not have significant β). The model has good measures of absolute, incremental, and parsimony adjustment.
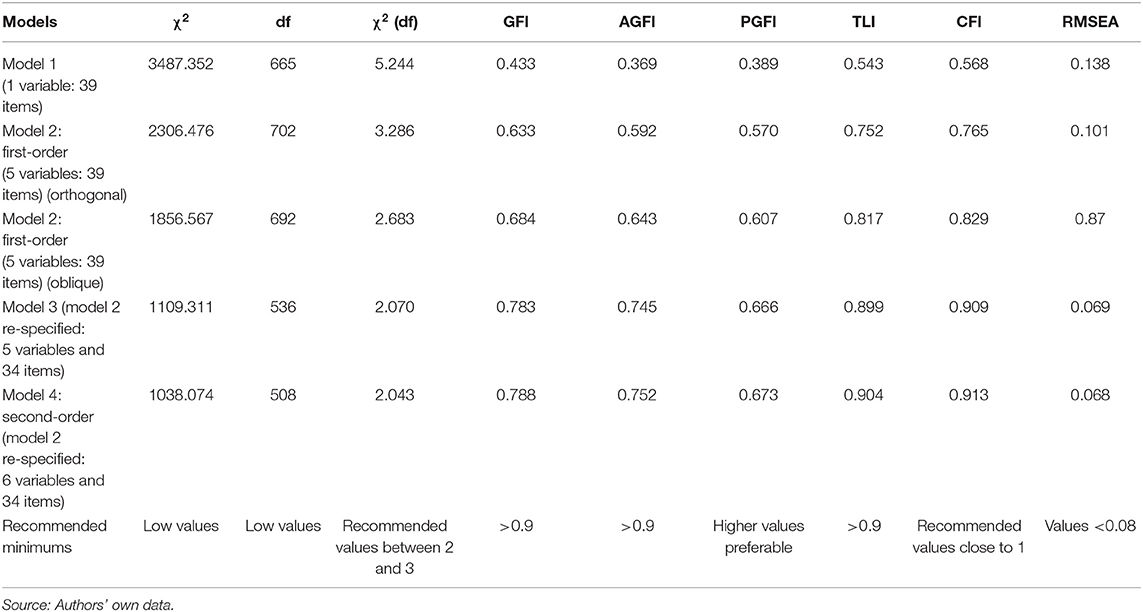
Table 2. Fit indices for quality perceived scale.
Table 3 shows the results of the CFA of the scales of the optimal measurement model (perceived quality and joint scale of satisfaction, perceived value, expectations, and loyalty). All items have β > 0.50 and are significant (critical coefficient > ±1.96). The two models presented show good measures of absolute, incremental, and parsimony adjustment.
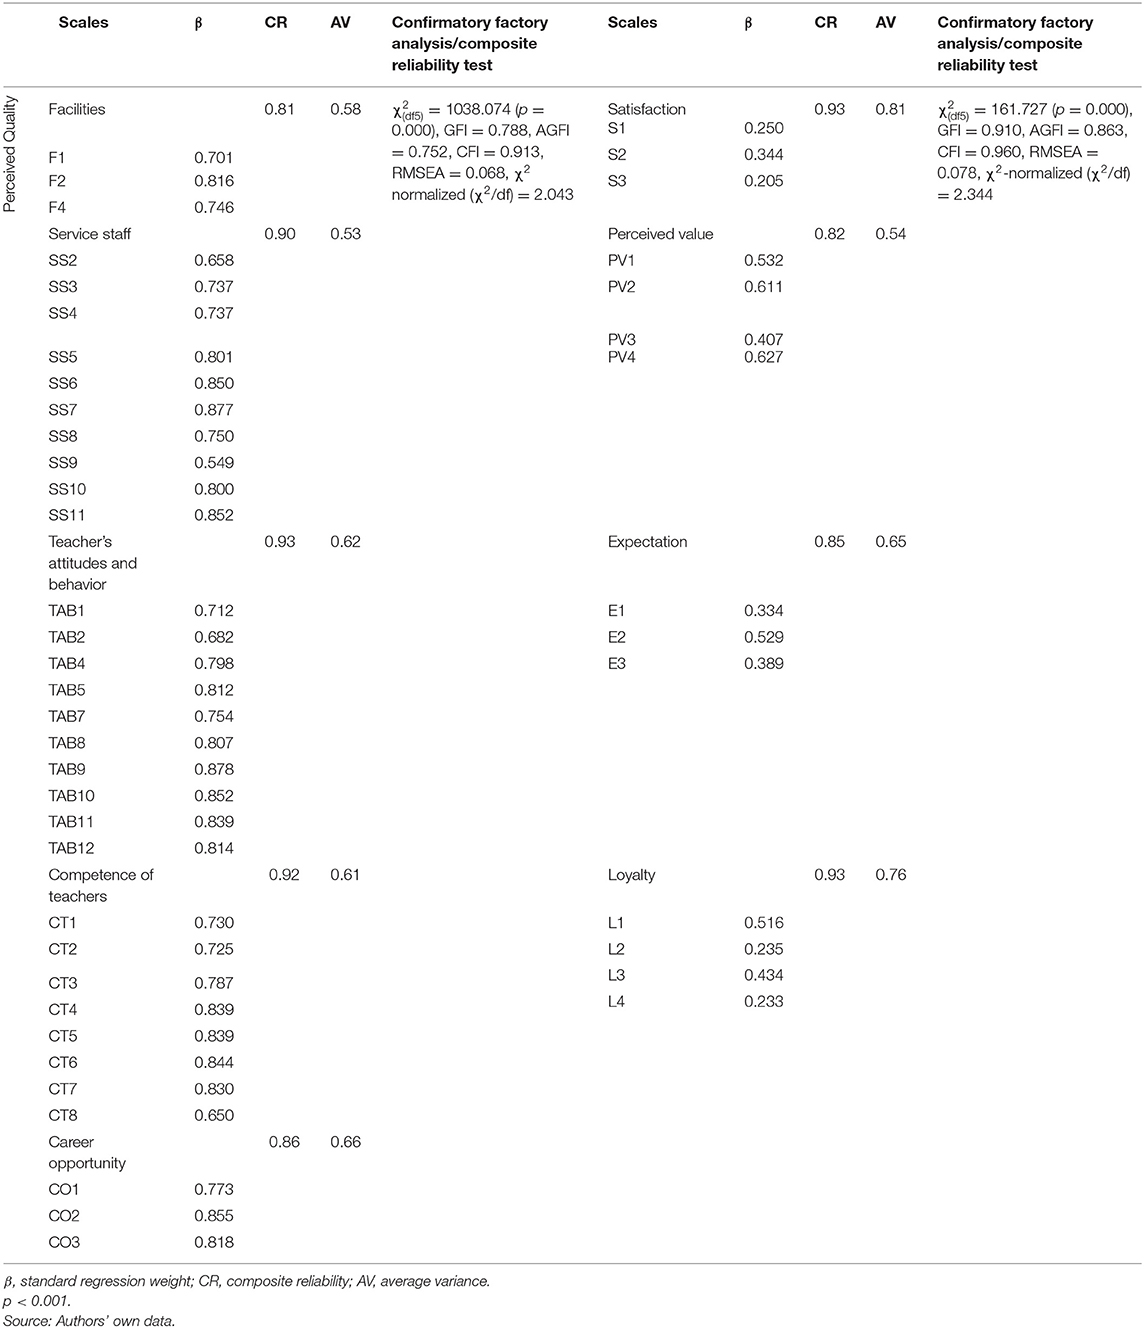
Table 3. Reliability and confirmatory factor analysis.
At this point, it is necessary to check the reliability of the measurement scales again. It is measured through average variance (AV) and CR, which must be >0.5 and >0.7, respectively (Table 4) (Bagozzi and Yi, 1988; Hair et al., 1999), and it is corroborated. The content validity was ensured by the literature review carried out, as well as by the pretest carried out, and convergent validity is corroborated as β > 0.5 and statistically significant (Student's t-test > ±1.96) and AVE > 0.5 (Table 4).
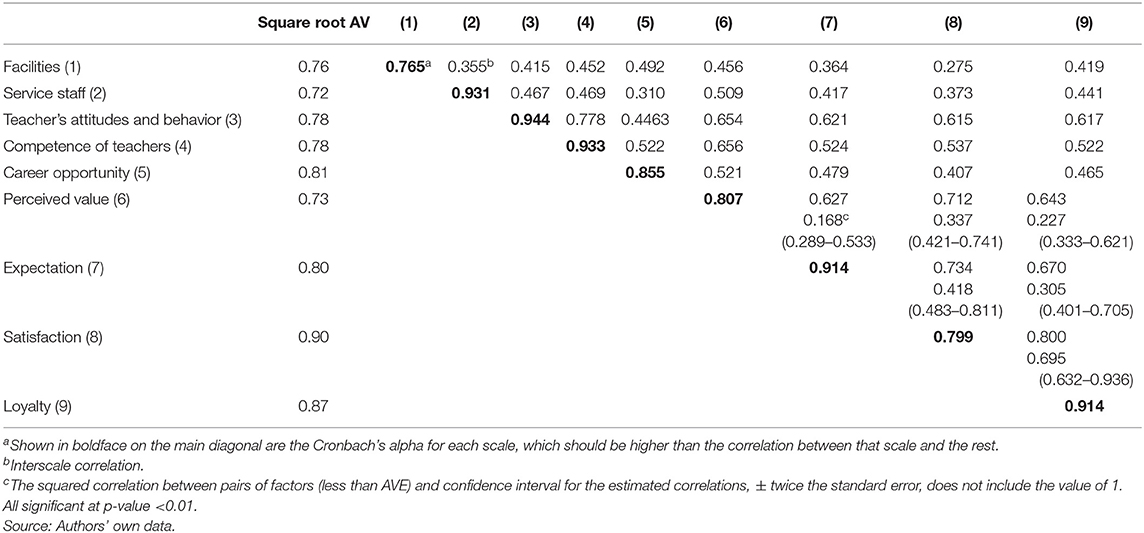
Table 4. Correlation matrix and discriminant validity.
To conclude, discriminant validity was analyzed by examining three indicators: (1) confirmed if Cronbach's alpha of each scale is higher than any of the correlations between that scale and the rest, which was proven, and (2) whether interfactor correlations are less than the square root of the AV extracted (Fornell and Larcker, 1981; Chin, 1998), and (3) none of the confidence intervals contains the unit (Bagozzi and Yi, 1988). Taking into account the results, discriminant validity is confirmed.
Analysis of the Structural Models
The research hypotheses in the proposed theoretical model were tested (Figure 2). The standardized coefficients (β) that show the weights of the direct effects of one variable on another and the direction (hypothesis) are all significant at the p < 0.001, 0.01 level, and therefore, all the hypotheses proposed are corroborated. The structural model has good adjustment measures, and all the indices have values within the recommended limits. The model explains 67.6% (R2) of loyalty.
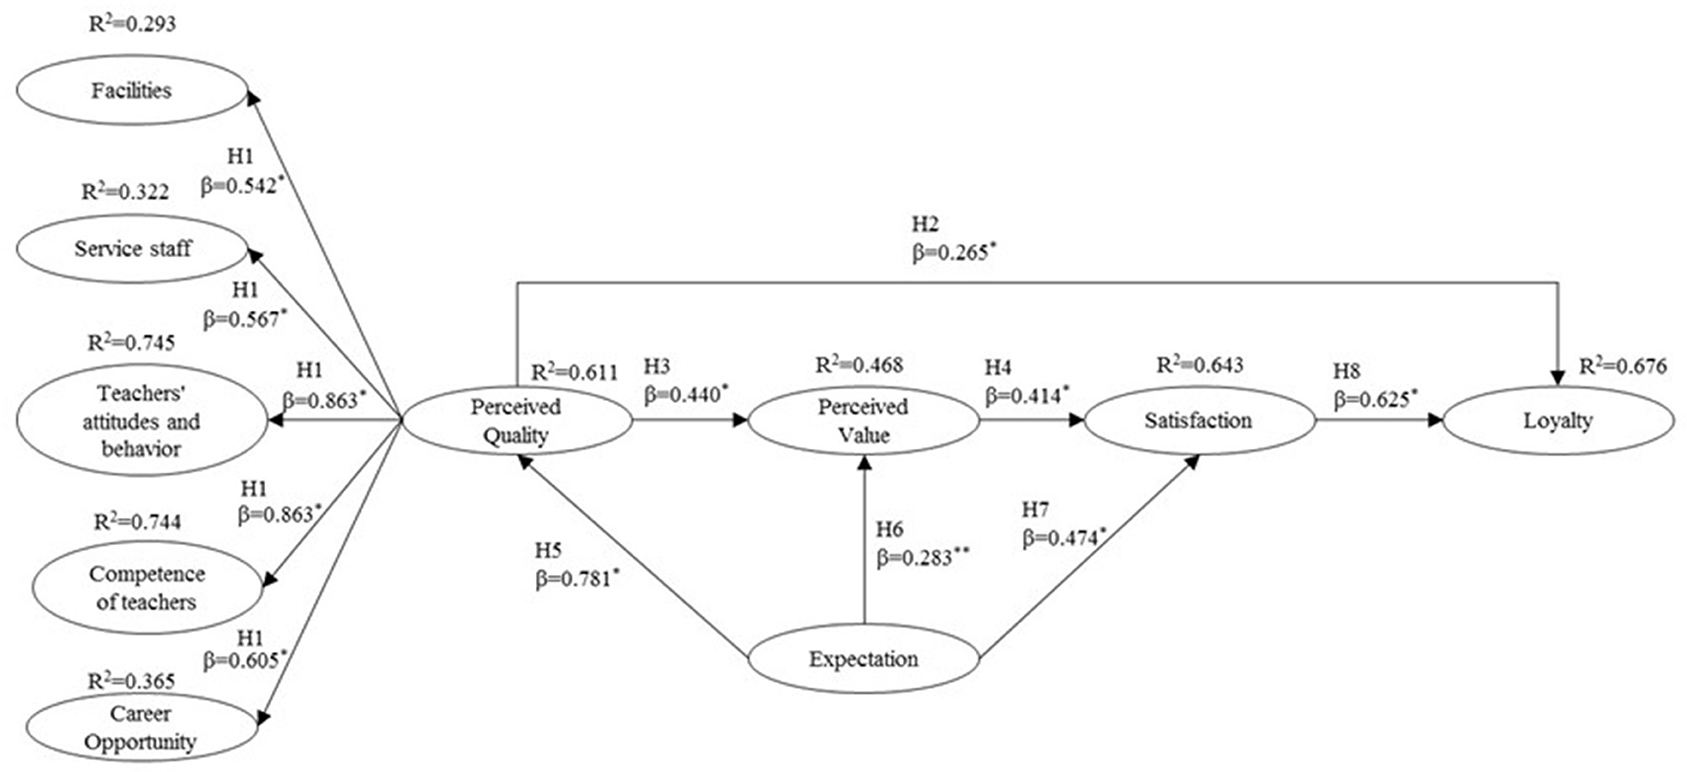
Figure 2. Structural model. *p < 0.001;**p < 0.01. = 65.807 (p = 0.000), GFI = 0.940, AGFI = 0.887, CFI = 0.966, RMSEA = 0.088, χ2-normalized (χ2/df) = 2.742.
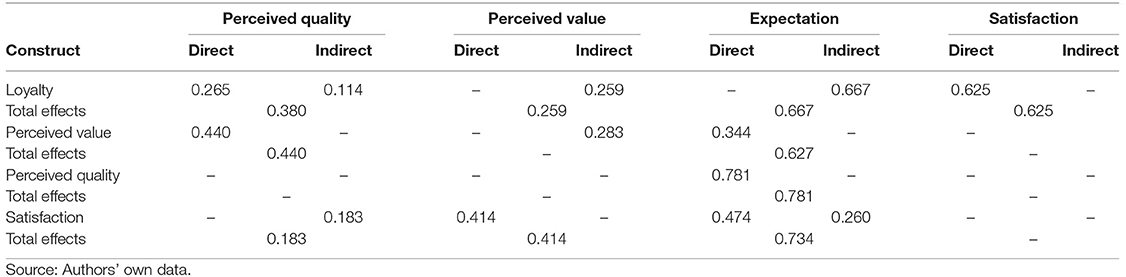
Direct, indirect, and total effects.
Discussion
The results of the structural model (Figure 2), which studies the direct influence of perceived quality on loyalty and indirectly through perceived value and satisfaction, support the explanatory capacity of the proposed theoretical model. The student's loyalty dimension with R2 = 0.676 > 0.67 (criteria proposed by Hu and Bentler, 1997) allows us to confirm that its explanatory capacity is strong, and the model explains 67.7% of loyalty. Regarding the proposed hypotheses, they are corroborated with significant β (p > 0.001 and 0.01). β indicates the relative importance of the dependent variable.
Hypothesis H1, which proposes that perceived service quality is a reflective and multidimensional construct with five dimensions, is corroborated. The dimensions of teachers' attitudes and behavior and competence of teachers show a high explanatory capacity in the model (R2 = 0.745 and 0.744, respectively). The explanatory capacity of the facilities (R2 = 0.293), service staff (R2 = 0.322), and career opportunity (R2 = 0.365) dimensions is weaker. These results are partially corroborated by the study of De la Fuente Mella et al. (2010), from which the scale was obtained. These authors consider seven dimensions, including reputation and other services, which in this research are included in the five dimensions considered. The main difference is that these authors considered the constructs separately as indicators of perceived service quality, and in this study, they are presented and validated as reflective indicators of the perceived quality construct. Taking into account that currently there is no consensus on the dimensions (Sultan and Wong, 2012) or on the best way to define and measure service quality (Clewes, 2003), the comparison of the results of this research regarding this construct is complex. However, there are many investigations that consider that the perceived quality construct is multidimensional and reflective. Among them, Subrahmanyam and Shekhar (2014) and Annamdevula and Bellamkonda (2016), that considered six dimensions (teaching, administrative services, academic facilities, campus infrastructure, support services, and internationalization) and Huili and Jing (2012), that took into account four (material resources, teacher resources, campus environment and quality of the results).
Regarding causal relationships, perceived service quality influences directly (β = 0.265, p < 0.001) (Hypothesis H2) and indirectly in building student's loyalty. The mediating variables between perceived quality and loyalty are perceived value (Hypothesis H3) with β = 0.440, p < 0.001, and satisfaction, as it is influenced by perceived value (Hypothesis H4) (β = 0.414, p < 0.001). Finally, satisfaction influences loyalty directly (H8) (β = 0.625, p < 0.001). The causal relationship proposed by Hypothesis H2 (perceived quality → loyalty) is also corroborated by the research carried out by Chandra et al. (2019) and Hassan et al. (2019). The relationship between perceived quality → perceived value (H3) is corroborated by LeBlanc and Nguyen (1997); Alves and Raposo (2007); Clemes et al. (2008, 2013); Huili and Jing (2012); Kwok et al. (2017), and de Oliveira Silva et al. (2020). The relationship between perceived value → satisfaction (H4) is corroborated by LeBlanc and Nguyen (1997), Alves and Raposo (2007), Clemes et al. (2008), Huili and Jing (2012), Clemes et al. (2013), Kwok et al. (2017), and de Oliveira Silva et al. (2020). Finally, the relationship between satisfaction → loyalty (H8) is also corroborated among others by Chen et al. (2005), Alves and Raposo (2007), Tsuji et al. (2007), Clemes et al. (2008), Huili and Jing (2012), Clemes et al. (2013), Sultana and Momen (2017), and de Oliveira Silva et al. (2020).
Regarding students' expectations, these influence perceived quality (H5), perceived value (H6), and satisfaction (H7). The relationship between expectations and perceived quality (β = 0.781, p < 0.001) is strong, as well as with satisfaction (β = 0.474, p < 0.001), being weaker with perceived value (β = 0.283, p < 0.01). These results are corroborated by the investigations of Alves and Raposo (2007) and Huili and Jing (2012).
Considering the direct and indirect effects, the key variables to increase loyalty are expectations and satisfaction with a total effect of 0.667 and 0.625, respectively. Regarding expectations, its influence is indirect through perceived quality (0.781), perceived value (0.627), and satisfaction (0.734). Perceived value is the construct that least affects loyalty with a total effect of 0.259, but its effect is very important in the formation of satisfaction (with a total effect of 0.414). Perceived quality affects loyalty moderately (0.380). Regarding satisfaction, it is formed from the effect of the indirect effect of quality (0.183), the direct effect of perceived value (0.414), and the direct effect (0.474) and indirect effect (0.260) with a total effect of 0.734 of expectations.
Conclusions and Implications
The structural model proposed and empirically validated in this research confirms that the key variables to improve student's loyalty and influence their behavior regarding continuing to study (Master's) in the center or recommending it to other people are expectations and the satisfaction perceived by students; both variables constitute an important source of competitive advantage. It is also observed that expectations are one of the three key variables to achieve satisfaction, together with service quality and perceived value. This research and its results allow us to understand the relationship between expectations and satisfaction with loyalty and to identify the antecedent variables of satisfaction (perceived service quality, perceived value, and expectations), as well as to obtain evidence of the importance of expectations within the model, for the formation of both perceived quality and satisfaction.
These results are highly useful for higher education center managers, always taking into account the characteristics of each center since they allow them to observe which variables are the most important to achieve their objective of retaining current students and that these students serve as positive communication channels for attracting new students. In this regard, they must focus their efforts and implement the necessary strategies to adapt expectations to the service quality offered by the center, especially regarding the attitude and behavior of their teachers, as well as improving their skills, and it is also very important to convey information to their students about their career opportunities, once they have graduated. They should also focus on improving the satisfaction perceived by the students, without forgetting that the expectations that the center has conveyed to its current or potential students are very important since they affect both the perceived quality of the students and their satisfaction in a highly significant way and in return for the loyalty of their students.
The limitations of the study are as follows: The research is carried out at a specific point in time (cross-sectional), and the population and the sample refer to a single higher education center located in a specific country, namely, Spain. This limits the generalizability of the results to a certain extent. The third limitation is related to the use of a structured questionnaire that limits the responses of the respondents to the questions asked, a limitation that has been overcome by considering the results of the CMB test. These limitations can be overcome by expanding the study to a greater number of university centers, as well as opening the geographical area to other countries, allowing the behavior of the model to be compared in environments with different structural characteristics.
Data Availability Statement
The raw data supporting the conclusions of this article will be made available by the authors, without undue reservation.
Ethics Statement
Ethical review and approval was not required for the study on human participants in accordance with the local legislation and institutional requirements. Written informed consent from the participants was not required to participate in this study in accordance with the national legislation and the institutional requirements.
Author Contributions
MdR-R, JÁ-G, NKM, and AD-S: conceptualization, investigation, methodology, formal analysis, writing-original draft, preparation, and writing-review & editing. All authors have read and agreed to the published version of the manuscript.
Funding
This work was supported by Hankuk University of Foreign Studies Research Fund of 2020.
Conflict of Interest
The authors declare that the research was conducted in the absence of any commercial or financial relationships that could be construed as a potential conflict of interest.
Supplementary Material
The Supplementary Material for this article can be found online at: https://www.frontiersin.org/articles/10.3389/fpsyg.2021.671407/full#supplementary-material
References
Ahmed, I., Nawaz, M. M., Usman, A., Shaukat, M. Z., and Ahmed, N. (2010). A mediation of customer satisfaction relationship between service quality and repurchase intentions for the telecom sector in Pakistan: a case study of university students. Afr. J. Bus. Manag. 4, 3457–3462.
Altbach, P. G. (2004). Globalisation and the university: myths and realities in an unequal world. Tert. Educ. Manag. 10, 3–25. doi: 10.1080/13583883.2004.9967114
Altbach, P. G., Reisberg, L., and Rumbley, L. E. (2010). Tracking a global academic evolution. Change Mag. High. Learn. 42, 30–39. doi: 10.1080/00091381003590845
Alves, H. (2000). As dimensiones qualidades no serviçio educaçao: a percepcao dos alunos da Universidades da Beira Interior. Rev. Portuguesa Gestao 15, 78–89.
Alves, H. (2010). The measurement of perceived value in higher education: a unidimensional approach. Serv. Ind. J. 31, 1943–1960. doi: 10.1080/02642069.2011.550042
Alves, H., and Raposo, M. (2004). La medición de la satisfacción en la enseóanza universitaria: El ejemplo de la universidade da beira interior. Int. Rev. Public Nonprofit Market. 1, 73–88. doi: 10.1007/BF02896618
Alves, H., and Raposo, M. (2007). Conceptual model of student satisfaction in higher education. Total Qual. Manag. 18, 571–588. doi: 10.1080/14783360601074315
Anderson, E. W. (1994). Cross-category variation in customer satisfaction and retention. Market. Lett. 5, 19–30. doi: 10.1007/BF00993955
Anderson, J., and Gerbing, D. W. (1988). Structural equation modelling in practice: a review and recommended two-step approach. Psychol. Bull. 103, 411–423. doi: 10.1037/0033-2909.103.3.411
Annamdevula, S., and Bellamkonda, R. S. (2016). The effects of service quality on student loyalty: the mediating role of student satisfaction. J. Modell. Manag. 11, 446–462. doi: 10.1108/JM2-04-2014-0031
Bagozzi, R. P., and Baumgartner, H. (1994). The evaluation of structural equation models and hypothesis testing. Principl. Market. Res. 1, 386–422.
Bagozzi, R. P., and Yi, Y. (1988). On the evaluation of structural equation models. J. Acad. Market. Sci. 16, 74–94. doi: 10.1007/BF02723327
Bitner, M. J. (1990). Servicescapes: the impact of physical surroundings and employee response. J. Market. 54, 69–82. doi: 10.1177/002224299005400206
Blass, E., and Weight, P. (2005). The MBA is dead–part 1: god save the MBA. Horizon 13, 229–240. doi: 10.1108/10748120510627358
Bloemer, J. M. M., de Ruyter, J. C., and Wetzels, M. G. M. (1999). Linking perceived service quality and behavioral intentions: a multi-dimensional perspective using structural equation modelling. Eur. J. Market. 33, 1082–1106. doi: 10.1108/03090569910292285
Boulding, W., Kalra, A., Staelin, R., and Zeithaml, V. A. (1993). A dynamic process model of service quality: from expectations to behavioral intentions. J. Market. Res. 30, 7–27. doi: 10.1177/002224379303000102
Brady, M. K., and Robertson, C. J. (1999). An exploratory study of service value in the USA and Ecuador. Int. J. Serv. Ind. Manag. 10, 469–486. doi: 10.1108/09564239910289003
Brown, R., and Mazzarol, T. (2009). The importance of institutional image to student satisfaction and loyalty within higher education. High. Educ. 58, 81–95. doi: 10.1007/s10734-008-9183-8
Cardone, C., Lado, N., and Rivera, P. (2003). Measurement and effects of teaching quality: an empirical model applied to master programs. J. Acad. Bus. Educ. 4, 28–40.
Carman, J. M. (1990). Consumer perceptions of service quality: an assessment of T. J. Retail. 66, 33–55.
Cervera, A., Schlesinger, W., Mesta, M. Á., and Sánchez, R. (2012). Medición de la imagen de la universidad y sus efectos sobre la identificación y lealtad del egresado: una aproximación desde el modelo de Beerli y Díaz (2003). Rev. Españ. Invest. Market. ESIC 16, 7–29. doi: 10.1016/S1138-1442(14)60012-7
Chandra, T., Hafni, L., Chandra, S., Purwati, A. A., and Chandra, J. (2019). The influence of service quality, university image on student satisfaction and student loyalty. Benchmarking 26, 1533–1549. doi: 10.1108/BIJ-07-2018-0212
Chaudhuri, A., and Holbrook, M. B. (2001). The chain of effects from brand trust and brand affect to brand performance: the role of brand loyalty. J. Market. 65, 81–93. doi: 10.1509/jmkg.65.2.81.18255
Chen, Y., Hsiao, C. H., and Lee, W. C. (2005). “How does student satisfaction influence student loyalty-From the relationship marketing perspective,” in The Seventh National Educational Conference, Taiwan.
Chin, W. W. (1998). The partial least squares approach to structural equation modeling. Modern Methods Bus. Res. 295, 295–336.
Christensen, T., and Gornitzka, Å. (2017). Reputation management in complex environments—a comparative study of university organizations. High. Educ. Policy 30, 123–140. doi: 10.1057/s41307-016-0010-z
Chua, C. (2004). “Perception of quality in higher education,” in Proceedings of the Australian Universities Quality Forum 2004, Adelaide.
Clemes, M. D., Cohen, D. A., and Wang, Y. (2013). Understanding Chinese university students' experiences: an empirical analysis. Asia Pac. J. Market. Logist. 25, 391–427. doi: 10.1108/APJML-07-2012-0068
Clemes, M. D., Gan, C. E., and Kao, T. H. (2008). University student satisfaction: An empirical analysis. J. Market. High. Educ. 17, 292–325. doi: 10.1080/08841240801912831
Clewes, D. (2003). A student-centred conceptual model of service quality in higher education. Qual. High. Educ. 9, 69–85. doi: 10.1080/13538320308163
Cornuel, E. (2005). The role of business schools in society. J. Manag. Dev. 24, 819–829. doi: 10.1108/02621710510621321
Coye, R. W. (2004). Managing customer expectations in the service encounter. Int. J. Serv. Ind. Manag. 15, 54–71. doi: 10.1108/09564230410523330
Cronin, J. J. Jr., Brady, M. K., and Hult, G. T. M. (2000). Assessing the effects of quality, value, and customer satisfaction on consumer behavioral intentions in service environments. J. Retail. 76, 193–218. doi: 10.1016/S0022-4359(00)00028-2
Cronin, J. J. Jr., and Taylor, S. A. (1992). Measuring service quality: a reexamination and extension. J. Market. 56, 55–68. doi: 10.1177/002224299205600304
Cuthbert, P. F. (1996). Managing service quality in HE: is SERVQUAL the answer? Part 1. Manag. Serv. Qual. 6, 11–16. doi: 10.1108/09604529610109701
Dabholkar, P. A., Shepherd, C. D., and Thorpe, D. I. (2000). A comprehensive framework for service quality: an investigation of critical conceptual and measurement issues through a longitudinal study. J. Retail. 76, 139–173. doi: 10.1016/S0022-4359(00)00029-4
De la Fuente Mella, H., Marzo Navarro, M., and Reyes Riquelme, M. J. (2010). Análisis de la satisfacción universitaria en la Facultad de Ingeniería de la Universidad de Talca. Ingen. Rev. Chil. Ingen. 18, 350–363. doi: 10.4067/S0718-33052010000300009
de Oliveira Silva, J. H., de Sousa Mendes, G. H., Ganga, G. M. D., Mergulhão, R. C., and Lizarelli, F. L. (2020). Antecedents and consequents of student satisfaction in higher technical-vocational education: evidence from Brazil. Int. J. Educ. Vocat. Guid. 20, 351–373. doi: 10.1007/s10775-019-09407-1
De Oliveira, O. J., and Ferreira, E. C. (2009). “Adaptation and application of the SERVQUAL scale in higher education,” in Proceedings of POMS 20th Annual Conference (Orlando, FL).
Dick, A. S., and Basu, K. (1994). Customer loyalty: toward an integrated conceptual framework. J. Acad. Market. Sci. 22, 99–113. doi: 10.1177/0092070394222001
Dodds, W. B., Monroe, K. B., and Grewal, D. (1991). Effects of price, brand, and store information on buyers' product evaluations. J. Market. Res. 28, 307–319. doi: 10.1177/002224379102800305
Douglas, J., Douglas, A., and Barnes, B. (2006). Measuring student satisfaction at a UK University. Qual. Assur. Educ. 14, 251–267. doi: 10.1108/09684880610678568
Elliot, K. M., and Healy, M. A. (2001). Key factors influencing student satisfaction related to recruitment and retention. J. Market. High. Educ. 10, 1–11. doi: 10.1300/J050v10n04_01
Elliott, K. M., and Shin, D. (2002). Student satisfaction: an alternative approach to assessing this important concept. J. High. Educ. Policy Manag. 24, 197–209. doi: 10.1080/1360080022000013518
Farrugia, C. A., and Lane, J. E. (2013). Legitimacy in cross-border higher education: identifying stakeholders of international branch campuses. J. Stud. Int. Educ. 17, 414–432. doi: 10.1177/1028315312464379
Fernández, G. C., Vázquez, J. M. G., and Corredoira, M. D. L. Á. Q. (2007). La importancia de los stakeholders de la organización: un análisis empírico aplicado a la empleabilidad del alumnado de la universidad española. Invest. Eur. Direc. Econ. Empresa 13, 13–32.
Flint, D. J., Woodruff, R. B., and Gardial, S. F. (2002). Exploring the phenomenon of customers' desired value change in a business-to-business context. J. Market. 66, 102–117. doi: 10.1509/jmkg.66.4.102.18517
Floyd, K. S., Harrington, S. J., and Santiago, J. (2009). The effect of engagement and perceived course value on deep and surface learning strategies. Inform. Sci. Int. J. Emerg. Transdiscipl. 12, 181–190. doi: 10.28945/435
Fornell, C. (1992). A national customer satisfaction barometer: the Swedish experience. J. Market. 58, 6–21. doi: 10.1177/002224299205600103
Fornell, C., and Larcker, D. F. (1981). Evaluating structural equation models with unobservable variables and measurement error. J. Market. Res. 18, 39–50. doi: 10.1177/002224378101800104
Giese, J. L., and Cote, J. A. (2000). Defining consumer satisfaction. Acad. Market. Sci. Rev. 1, 1–22.
Gremler, D. D., and McCollough, M. A. (2002). Student satisfaction guarantees: an empirical examination of attitudes, antecedents, and consequences. J. Market. Educ. 24, 150–160. doi: 10.1177/027753024002008
Gronholdt, L., Martensen, A., and Kristensen, K. (2000). The relationship between customer satisfaction and loyalty: cross-industry differences. Total Qual. Manag. 11, 509–514. doi: 10.1080/09544120050007823
Grönroos, C. (1982). An applied service marketing theory. Eur. J. Market. 16, 30–41. doi: 10.1108/EUM0000000004859
Grönroos, C. (1990). Service Management and Marketing. Managing the Moments of Truth in Service Competition. Lexington, MA: Lexington Books.
Grönroos, C. (1994). Marketing y gestión de servicios: la gestión de los momentos de la verdad y la competencia en los servicios. Madrid: Ediciones Díaz de Santos.
Gures, N., Arslan, S., and Tun, S. Y. (2014). Customer expectation, satisfaction and loyalty relationship in Turkish airline industry. Int. J. Market. Stud. 6, 66–74. doi: 10.5539/ijms.v6n1p66
Hair, J. F., Anderson, R. E., Tatham, R. L., and Black, W. C. (1999). Análisis Multivariante, 5th Edn. Madrid: Prentice Hall.
Hand, J. R., and Lev, B. (2003). Intangible Assets: Values, Measures, and Risks: Values, Measures, and Risks. London: OUP Oxford.
Hassan, S., Shamsudin, M. F., Hasim, M. A., Mustapha, I., Jaafar, J., Adruthdin, K. F., et al. (2019). Mediating effect of corporate image and students' satisfaction on the relationship between service quality and students' loyalty in TVET HLIs. Asian Acad. Manag. J. 24, 93–105. doi: 10.21315/aamj2019.24.s1.7
Helgesen, O., and Nesset, E. (2007). Images, satisfaction and antecedents: drivers of student loyalty? A case study of a Norwegian University College. Corp. Reput. Rev. 10, 38–59. doi: 10.1057/palgrave.crr.1550037
Hemsley-Brown, J., Melewar, T. C., Nguyen, B., and Wilson, E. J. (2016). Exploring brand identity, meaning, image, and reputation (BIMIR) in higher education: a special section. J. Bus. Res. 69, 3019–3022. doi: 10.1016/j.jbusres.2016.01.016
Hennig-Thurau, T., Langer, M. F., and Hansen, U. (2001). Modeling and managing student loyalty: an approach based on the concept of relationship quality. J. Serv. Res. 3, 331–344. doi: 10.1177/109467050134006
Hermawan, A. (2001). The effects of service cues on perceived service quality, value, satisfaction and word of mouth recommendations in Indonesian university settings (Doctoral dissertation), Wayne Huizenga Graduate School of Business and Entrepreneurship, Nova Southeastern University, Fort Lauderdale, FL, United States.
Heskett, J., Sasser, E., and Schlesinger, L. (1997). The Service Profit Chain: How Leading Companies Link Profit and Growth to Loyalty, Satisfaction and Value. New York, NY: The Free Press.
Hsieh, Y., Yuan, S., and Kuo, R. (2011). A PSO-based intelligent service dispatching mechanism for customer expectation management. Expert Syst. Appl. 38, 12128–12141. doi: 10.1016/j.eswa.2011.03.007
Hu, L. T., and Bentler, P. M. (1997). Selecting Cutoff Criteria for Fit Indexes for Model Evaluation: Conventional versus New Alternatives. Santa Cruz, CA: University of California, Santa Cruz.
Huber, F., Herrmann, A., and Henneberg, S. C. (2007). Measuring customer value and satisfaction in services transactions, scale development, validation and cross-cultural comparison. Int. J. Consum. Stud. 31, 554–564. doi: 10.1111/j.1470-6431.2007.00596.x
Huili, Y. A. O., and Jing, Y. U. (2012). Empirical research and model building about customer satisfaction index on postgraduate education service quality. Can. Soc. Sci. 8, 108–113. doi: 10.3968/j.css.1923669720120801.1500
Iacobucci, D., Ostrom, A., and Grayson, K. (1995). Distinguishing service quality and customer satisfaction: the voice of the consumer. J. Consum. Psychol. 4, 277–303. doi: 10.1207/s15327663jcp0403_04
Jiewanto, A., Laurens, C., and Nelloh, L. (2012). Influence of service quality, university image, and student satisfaction toward WOM intention: a case study on Universitas Pelita Harapan Surabaya. Proc. Soc. Behav. Sci. 40, 16–23. doi: 10.1016/j.sbspro.2012.03.155
Jöreskog, K. G., and Sörbom, D. (1993). LISREL 8: Structural Equation Modeling With the SIMPLIS Command Language. Lincolnwood, IL: Scientific Software International.
Koelemeijer, K., Roest, H., and Verhallen, T. (1993). “An integrative framework of perceived service quality and its relations to satisfaction/dissatisfaction, attitude, and repurchase intentions,” in The 22nd Annual Conference of the European Marketing Agency (Barcelona), 683–699.
Kwan, P. Y., and Ng, P. W. (1999). Quality indicators in higher education-comparing Hong Kong and China's students. Manag. Audit. J. 14, 20–27. doi: 10.1108/02686909910245964
Kwok, S. Y., Jusoh, A., and Khalifah, Z. (2017). The mediating effects of value on service quality-satisfaction relationship in Malaysian tourism industry. Int. J. Bus. Soc. 18, 363–372. doi: 10.33736/ijbs.546.2017
Lai, L. S., To, W. M., Lung, J. W., and Lai, T. M. (2012). The perceived value of higher education: the voice of Chinese students. High. Educ. 63, 271–287. doi: 10.1007/s10734-011-9439-6
Lam, S. Y., Shankar, V., Erramilli, M. K., and Murthy, B. (2004). Customer value, satisfaction, loyalty, and switching costs: an illustration from a business-to-business service context. J. Acad. Market. Sci. 32, 293–311. doi: 10.1177/0092070304263330
LeBlanc, G., and Nguyen, N. (1997). Searching for excellence in business education: an exploratory study of customer impressions of service quality. Int. J. Educ. Manag. 11, 72–79. doi: 10.1108/09513549710163961
LeBlanc, G., and Nguyen, N. (1999). Listening to the customer's voice: examining perceived service value among business college students. Int. J. Educ. Manag. 13, 187–198. doi: 10.1108/09513549910278106
Ledden, L., Kalafatis, S. P., and Samouel, P. (2007). The relationship between personal values and perceived value of education. J. Bus. Res. 60, 965–974. doi: 10.1016/j.jbusres.2007.01.021
Lev, B., and Zarowin, P. (1999). The boundaries of financial reporting and how to extend them. J. Acc. Res. 37, 325–385. doi: 10.2307/2491413
Lévy-Mangin, J. P., and Varela-Mallou, J. (2006). Modelización con Estructuras de Covarianzas en Ciencias Sociales. A Coruña: Netbiblo S.L.
Li, R. Y., and Kaye, M. (1998). A case study for comparing two service quality measurement approaches in the context of teaching in higher education. Qual. High. Educ. 4, 103–113. doi: 10.1080/1353832980040202
Mahamad, O., and Ramayah, T. (2010). Service quality, customer satisfaction and loyalty: a test of mediation. Int. Bus. Res. 3:72.
Marimon, F., Mas-Machuca, M., and Berbegal-Mirabent, J. (2020). Fulfilment of expectations on students' perceived quality in the Catalan higher education system. Total Qual. Manag. Bus. Excell. 31, 483–502. doi: 10.1080/14783363.2018.1433027
Maringe, F., and Gibbs, P. (2009). Marketing Higher Education: Theory and Practice. New York, NY: McGraw-Hill.
Martensen, A., Gronholdt, L., and Eskildsen, J. y Kristensen, K. (1999). “Measuring student oriented quality in higher education: Application of the ECSI methodology,” in Conference Proceedings from TQM for Higher Education Institutions. Higher Education Institutions and the Issue of Total Quality (Verona).
Marzo-Navarro, M., Pedraja-Iglesias, M., and Rivera-Torres, M. P. (2005). Measuring customer satisfaction in summer courses. Qual. Assur. Educ. 13:53. doi: 10.1108/09684880510578650
Mavondo, F. T., Zaman, M., and Abubakar, B. (2000). “Student satisfaction with tertiary institution and recommending it to prospective students,” in Australian and New Zealand Marketing Academy Conference (ANZMAC 2000): Visionary Marketing for the 21st Century: Facing the Challenge (Queenland: Griffith University), 787–792.
McDougall, G H., and Levesque, T. (2000). Customer satisfaction with services: putting perceived value into the equation. J. Serv. Market. 14, 392–410. doi: 10.1108/08876040010340937
Morgan, R. M., and Hunt, S. D. (1994). The commitment-trust theory of relationship marketing. J. Market. 58, 20–38. doi: 10.1177/002224299405800302
Navarro, M. M., Iglesias, M. P., and Torres, P. R. (2005). A new management element for universities: satisfaction with the offered courses. Int. J. Educ. Manag. 19, 505–526. doi: 10.1108/09513540510617454
Nguyen, T. D. (2009). Signal quality and service quality: a study of local and international MBA programs in Vietnam. Qual. Assur. Educ. Int. Perspect. 17, 364–376. doi: 10.1108/09684880910992331
O'Connor, S. J., Trinh, H. Q., and Shewchuk, R. M. (2000). Perceptual gaps in understanding patient expectations for health care service quality. Health Care Manag. Rev. 25, 7–23. doi: 10.1097/00004010-200004000-00002
Oldfield, B. M., and Baron, S. (2000). Student perceptions of service quality in a UK university business and management faculty. Qual. Assur. Educ. 8, 85–95. doi: 10.1108/09684880010325600
Oliver, R. L. (1981). Measurement and evaluation of satisfaction processes in retail settings. J. Retail. 57, 25–48.
Oliver, R. L. (1997). Satisfaction: A Behavioral Perspective on the Consumer. New York, NY: McGraw-Hill.
Oliver, R. L. (1999). Whence consumer loyalty? J. Market. 63, 33–44. doi: 10.1177/00222429990634s105
Olsen, J., Thach, L., and Hemphill, L. (2012). The impact of environmental protection and hedonistic values on organic wine purchases in the US. Int. J. Wine Bus. Res. 24, 47–67.doi: 10.1108/17511061211213783
O'Neil, M., and Palmer, A. (2004). Importance-performance analysis: a useful tool for directing continuous quality improvements in higher education. Qual. Assur. Educ. 12, 39–52. doi: 10.1108/09684880410517423
Owlia, M. S., and Aspinwall, E. M. (1996). A framework for the dimensions of quality in higher education. Qual. Assur. Educ. 4, 12–20.
Owlia, M. S., and Aspinwall, E. M. (1998). A framework for measuring quality in engineering education. Total Qual. Manag. 9, 501–518.
Paramewaran R. Glowacka A. E. (1995): University image: an information processing perspective. J. Market. High. Educ. 6, 41–56. 10.1300/J050v06n02_04
Parasuraman, A., Berry, L., and Zeithaml, V. A. (1991). Refinement and reassessment of the SERVQUAL scale. J. Retail. 67, 420–450.
Parasuraman, A., Zeithaml, V. A., and Berry, L. L. (1985). A conceptual model of service quality and its implications for future research. J. Market. 49, 41–50. doi: 10.1177/002224298504900403
Parasuraman, A., Zeithaml, V. A., and Berry, L. L. (1988). Servqual: a multiple-item scale for measuring consumer perc. J. Retail. 64, 12–40.
Peng, P. J., and Samah, A. (2006). Measuring students' satisfaction for quality education in e-learning university. Unitar. E. J. 2, 11–21.
Pham, K. Q. V., and Simpson, M. (2006). The impact of frequency of use on service quality expectations: an empirical study of trans-Atlantic airline passengers. J. Am. Acad. Bus. 10, 1–7.
Plewa, C., Ho, J., Conduit, J., and Karpen, I. O. (2016). Reputation in higher education: a fuzzy set analysis of resource configurations. J. Bus. Res. 69, 3087–3095. doi: 10.1016/j.jbusres.2016.01.024
Podsakoff, P. M., and Organ, D. W. (1986). Self-reports in organizational research: Problems and prospects. J. Manag. 12, 531–544. doi: 10.1177/014920638601200408
Polat, S. (2011). The relationship between university students' academic achievement and perceived organizational image. Educ. Sci. Theory Pract. 11, 257–262.
Rosenbloom, B. (1991). Marketing Channels. A Management View, 4th Edn. Orlando, FL: The Dryden Press.
Rowley, J. (1996). Motivation and academic staff in higher education. Qual. Assur. Educ. 4, 11–16. doi: 10.1108/09684889610125814
Schertzer, C. B., and Schertzer, S. M. (2004). Student satisfaction and retention: a conceptual model. J. Market. High. Educ. 14, 79–91. doi: 10.1300/J050v14n01_05
Schlesinger, W., Cervera, C., and Calderón, H. (2014). El papel de la confianza, la imagen y los valores compartidos en la creación de valor y lealtad: aplicación a la relación egresado-universidad. Rev. Españ. Invest. Market. ESIC, 18, 126–139. doi: 10.1016/j.reimke.2014.06.001
Shahsavar, T., and Sudzina, F. (2017). Student satisfaction and loyalty in Denmark: application of EPSI methodology. PLoS ONE 12:e0189576. doi: 10.1371/journal.pone.0189576
Sigala, M., Christou, E., Petruzzellis, L., D'Uggento, A. M., and Romanazzi, S. (2006). Student satisfaction and quality of service in Italian universities. Manag. Serv. Qual. 16, 349–364. doi: 10.1108/09604520610675694
Stevens, R., McConkey, W., Cole, H., and Clow, K. (2008). College image: a strategy marketing dilemma. Serv. Market. Q. 29, 99–113. doi: 10.1080/15332960802126005
Subrahmanyam, A., and Shekhar, B. R. (2014). HiEduQual: an instrument for measuring the critical factors of students' perceived service quality. Manag. Sci. Eng. 8, 102–108. doi: 10.3968/4424
Suki, N. M., Sharif, S., and Suki, N. M. (2008). Measuring students' satisfaction towards the co-curricular trainers: an application of structural equation modeling technique. Labuan e-J. Muamalat Soc. 2, 36–45.
Sultan, P., and Wong, H. Y. (2012). “Cultures' consequences in the assessment of higher education service quality: the case of CQU, Australia,” in Sharing the Cup of Knowledge, Australian and New Zealand Marketing Academy Conference (ANZMAC) (Adelaide, SA).
Sultana, S., and Momen, A. (2017). International student satisfaction and loyalty: a comparative study of Malaysian and Australian higher learning institutions. J. Intercult. Manag. 9, 101–142. doi: 10.1515/joim-2017-0005
Tam, J. L. (2004). Customer satisfaction, service quality and perceived value: an integrative model. J. Market. Manag. 20, 897–917. doi: 10.1362/0267257041838719
Teas, R. K., and Agarwal, S. (2000). The effects of extrinsic product cues on consumers' perceptions of quality, sacrifice, and value. J. Acad. Market. Sci. 28, 278–290. doi: 10.1177/0092070300282008
Tsuji, Y., Bennett, G., and Zhang, J. (2007). Consumer satisfaction with an action sports event. Sport Market. Q. 16, 199–208.
Verčič, A. T., Verčič, D., and Žnidar, K. (2016). Exploring academic reputation–is it a multidimensional construct? Corp. Commun. Int. J. 21, 160–176. doi: 10.1108/CCIJ-01-2015-0003
Wang, Y., Lo, H. P., Chi, R., and Yang, Y. (2004). An integrated framework for customer value and customer-relationship-management performance: a customer-based perspective from China. Manag. Serv. Qual. 14, 169–182. doi: 10.1108/09604520410528590
Wiers-Jenssen, J., Stensaker, B. R., and Grögaard, J. B. (2002). Student satisfaction: towards an empirical deconstruction of the concept. Qual. High. Educ. 8, 183–195. doi: 10.1080/1353832022000004377
Woodruff, R. B. (1997). Customer value: the next source of competitive advantage. J. Acad. Market. Sci. 25, 139–53. doi: 10.1007/BF02894350
Yeop, N. K. Y., Ismail, A., Juga, Z. R., and Ishak, S. (2009). Service quality dimensions, perceive value and customer satisfaction: ABC relationship model testing. Int. Bus. Educ. J. 2, 67–80.
Yunus, N. K. Y., Ishak, S., and Razak, A. Z. A. A. (2010). Motivation, empowerment, service quality and polytechnic students' level of satisfaction in Malaysia. Int. J. Bus. Soc. Sci. 1, 120–128.
Zeithaml, V. A. (1988). Consumer perceptions of price, quality, and value: a means-end model and synthesis of evidence. J. Market. 52, 2–22. doi: 10.1177/002224298805200302
Zeithaml, V. A., Berry, L. L., and Parasuraman, A. (1996). The behavioral consequences of service quality. J. Market. 60, 31–46. doi: 10.1177/002224299606000203
Zeithaml, V. A., Parasuraman, A., and Berry, L. L. (1990): Delivering Quality Service. Balancing Perceptions Expectations. Edición española: Calidad total en la gestión de servicios. Cómo lograr el equilibrio entre las percepciones y las expectativas de los consumidores. New York, NY; Madrid: The Free Press; Díaz de Santos.
Keywords: perceived quality, perceived value, satisfaction, loyalty, higher education
Citation: Del Río-Rama MdlC, Álvarez-García J, Mun NK and Durán-Sánchez A (2021) Influence of the Quality Perceived of Service of a Higher Education Center on the Loyalty of Students. Front. Psychol. 12:671407. doi: 10.3389/fpsyg.2021.671407
Received: 23 February 2021; Accepted: 05 May 2021;
Published: 07 June 2021.
Edited by:
Antonio Baena Extremera, University of Granada, SpainReviewed by:
David Aguilera, University of Granada, SpainLili Adi Wibowo, Universitas Pendidikan Indonesia, Indonesia
Copyright © 2021 Del Río-Rama, Álvarez-García, Mun and Durán-Sánchez. This is an open-access article distributed under the terms of the Creative Commons Attribution License (CC BY). The use, distribution or reproduction in other forums is permitted, provided the original author(s) and the copyright owner(s) are credited and that the original publication in this journal is cited, in accordance with accepted academic practice. No use, distribution or reproduction is permitted which does not comply with these terms.
*Correspondence: Nam Kwon Mun, bmFta3dvbkBob3RtYWlsLmNvbQ==