 Xiaoyan Zhu
 Yunqi Zhang
 Weizhi Yang
- School of Economics and Management, Sichuan Normal University, Chengdu, China
This paper uses panel OLS, IV, and system GMM methods to empirically study the effects of manufacturing and producer service corporate co-agglomeration on green economy efficiency (GEE) in China. Chinese panel data from 2000 to 2019 are collected to assess the GEE and co-agglomeration degrees. The regression results show that there is an “inverted U-shaped” relationship between co-agglomeration and GEE. However, regional heterogeneity is found in the effects of corporate co-agglomeration on GEE. The mediating analysis indicates that corporate co-agglomeration could increase GEE through business entrepreneurship and innovation entrepreneurship. Variables such as transportation infrastructure, human capital, foreign direct investment, and environmental regulations are also found to have an elevating effect on GEE, whereas local fiscal expenditure on environmental protection has little effect. The findings in this paper indicate that entrepreneurship plays an important role in the process of co-agglomeration impacting GEE which differs in different regions and thus provide references for corporate and regional sustainable development.
Introduction
Agglomeration refers to the corporate geographical proximity, that is, the co-location of corporations (Marshall, 1916). Manufacturing enterprises that produce the same products and upstream and downstream enterprises that produce related products tend to be geographically co-located, which is known as co-agglomeration (Ellison and Glaeser, 1997). Studies have shown that the location of a producer services sector is a function of the manufacturing sector location, that is manufacturing and associated producer service corporations are more likely to be closely located because producer services is an important input sector in manufacturing (Andersson, 2006). Producer services are intermediate industries that can be used in the further production of goods and services (Greenfield, 1966). Unlike the traditional service industries, which are consumer-oriented, producer services are producer-oriented. It includes finance, insurance, business services, and other knowledge-intensive industries (Browning and Singelmann, 1975). Producer services can directly or indirectly provide intermediate services to the manufacturing production process and link the various stages of production.
Therefore, manufacturing and producer service corporate co-agglomeration can enhance the core competitiveness of the manufacturing industries, cultivate a modern industrial organization system, and achieve a high level of development (Wang et al., 2022a). Accordingly, the co-agglomeration in this paper refers to the corporate co-agglomeration of producer services and manufacturing.
Co-agglomeration generates externalities, such as lower production costs (Fan and Scott, 2003), improved infrastructure, the promotion of competition, knowledge spillovers, and technological innovation (Marshall, 1916; Jacobs, 1969; Krugman, 1991; Porter, 1998). Co-agglomeration, through the above-mentioned externalities, can lead to higher productivity, which can drive economic growth (Lanaspa et al., 2016; Klein and Crafts, 2020), enhance the emissions reduction effects, and reduce environmental pollution (Zhuang et al., 2021; Wang et al., 2022b).
However, the co-location of many firms in a region can also lead to problems, such as traffic congestion, rising production factor prices, and insufficient market carrying capacities (Henderson, 1986; Brakman et al., 1996), all of which might inhibit productivity (Paci and Usai, 2000; Sbergami, 2002). Co-agglomeration can also result in high resource consumption and emissions, which could pollute the environment (Pandey and Seto, 2015; Lu et al., 2021).
Entrepreneurship, one of the externalities of co-agglomeration (Kemper et al., 2011; Wu et al., 2021), can also influence economic growth and the ecological environment (Glaeser and Kerr, 2009). Entrepreneurs can make better use of social capital, build corporate social relationships and mobilize employees, improve corporate productivity, and drive economic growth (Dastourian et al., 2017; Lafuente et al., 2020). Entrepreneurs also encourage firms to take greater social responsibility (Ahmad et al., 2021; Wei et al., 2021). Consequently, when regulated by social responsibility, companies will seek to achieve advances in clean energy technologies, which in turn can reduce environmental pollution (Zeng and Zhao, 2009; Otsuka et al., 2014).
Overall, co-agglomeration has been found to be highly correlated with economic growth and ecological environment (Rosenthal and Strange, 2020); however, in China, the effects of co-agglomeration on the two are not clear and widely debated (Lin and Tan, 2019). Therefore, this paper uses green economy efficiency (GEE) to represent the economic and environmental outputs (Qian and Liu, 2013; Naseer et al., 2021) to empirically verify the relationship between co-agglomeration and GEE in China and whether entrepreneurship plays a role in it.
This paper makes two main contributions. First, in the process of co-agglomeration affecting GEE, the role of entrepreneurship is studied. We verify that co-agglomeration enhances entrepreneurship, which boosts GEE by deploying social capital and assuming social responsibility. This provides a supplement to the study of regional green economy development. Second, geographic heterogeneity is taken into consideration in this paper. We find that the effects of co-agglomeration on GEE differ in different regions, which provides practical implications for regions to adjust the level of co-agglomeration and enhance GEE according to local conditions.
The remainder of this paper is organized as follows. Section Literature Review reviews the relevant literature on the impacts of manufacturing and producer service co-agglomeration on GEE, Section Empirical Analysis details the empirical study and variables, data and models are introduced, Section Empirical Results discusses the empirical results, assesses the regional heterogeneity, and analyzes the effects and mechanisms of co-agglomeration on GEE, and Section Conclusion gives the main conclusions.
Literature Review
Corporate Co-Agglomeration
Agglomeration, which is closely related to the development and evolution of industrial organizations, has been an important characteristic of economic development (Ellison et al., 2010; Chen and Chen, 2014). The essence of corporate co-agglomeration is the coordination of spatial locations and a geographic and spatial dimensional “synergetic clustering” (Jacobs et al., 2013; Gaubert, 2018). The co-agglomeration of corporates in manufacturing and producer services compresses the spatial industrial integration distances and allows for more interactive relationships between the two through mutual interaction and integration (Mansour and Kanso, 2017; Taghizadeh-Hesary et al., 2020).
Even though they have strong mutual needs, manufacturing and producer services can gradually become divided (Marshall, 1982). However, because producer services provide intermediate input factors, they have been increasingly integrated into manufacturing industries and all aspects of the manufacturing production chain (Lanaspa et al., 2016; Yang et al., 2018). This manufacturing and producer service co-agglomeration engenders closer cooperation and the product production process smoother. The industrial organization structure is also improved with the co-agglomeration of the two (Ganvir and Jain, 2021). Therefore, the corporate co-agglomeration between industries is a good way to build a new system of modern industrial organization, which benefits both economy and environment.
Green Economy Efficiency
Whereas, rapid economic growth has led to increased regional spatial agglomeration, it has also resulted in more severe urban environmental problems (Zhang and Qin, 2018). Therefore, to establish a better ecological civilization and ensure a harmonious coexistence between people and nature, economic development needs to shift to a growth pattern that integrates economic growth, environmental protection, and resource conservation, that is, the “green economy” (Lin and Tan, 2019). The term “green economy” was first proposed by Pearce (1996) and is defined as an “affordable economy” in which the pursuit of economic growth does not lead to ecological crises.
The green economy is an economy that considers both the needs of society and the needs of the environment. However, a suitable index is required to effectively study the “green economy.” Many methods have been suggested to express the green economy, with the GEE being one of the most popular, and have been widely used, as it considers both the desirable and undesirable production outputs (Sahoo and Tone, 2008; Mendelová, 2022) and comprehensively considers both the resource and environmental costs. Therefore, the GEE is chosen to assess the state of the green economy.
Co-Agglomeration and Green Economy Efficiency
The impact of co-agglomeration on GEE has been widely examined, but its exact effects remain controversial. There are three types of opinions on the co-agglomeration GEE relationship.
Some studies have found that manufacturing and producer service co-agglomeration can improve GEE (Ehrenfeld, 2003) in four main areas: economic growth efficiency, economic growth stability, economic structure optimization, and green development (Guo and Huang, 2020; Liu, 2021; Ren et al., 2021). Some scholars, however, have disagreed with these conclusions. They argue that industries sometimes agglomerate inefficiently and create problems such as insufficient resources and environmental carrying capacity, which have negative effects on GEE (Virkanen, 1998; Helsley and Strange, 2014; Huang, 2021). The third opinion type holds that the agglomeration impact on environmental pollution is diverse. Some studies have found that the impact of co-agglomeration on GEE has an “inverted U” curve (Wang and Sun, 2020; Ren et al., 2021), whereas others have found that the relationship between agglomeration and GEE was “U-shaped” (Yue et al., 2015; Zeng et al., 2021).
If the positive externality of co-agglomeration is greater than the negative externality, co-agglomeration behaves as promoting GEE, and vice versa, it behaves as inhibiting GEE. That is, the effect of co-agglomeration on GEE is related to the level of co-agglomeration, based on which, this study proposes the following hypothesis:
Hypothesis 1: The impact of corporate co-agglomeration on GEE is inverted U-shaped in China.
Co-agglomeration affects GEE through externalities, and one of the important externalities is that co-agglomeration promotes entrepreneurship, which influences economic growth and ecological environment by deploying social capital and assuming social responsibility (Omrane, 2015; Silvestri and Veltri, 2020).
Entrepreneurship is the sum of the entrepreneurs' abilities to identify potential opportunities, acquire resources, innovate, and implement actions that can drive enterprise development (Wennekers and Thurik, 1999). Agglomeration can promote entrepreneurship (Mason and Gos, 2014) because it provides entrepreneurs with the information needed to identify opportunities and establish social relationships (Audia and Rider, 2005; Kemper et al., 2011). Entrepreneurship enables companies to better deploy social capital, including trust, team effectiveness, and social relationships (Becchetti et al., 2022; Schlak, 2022). Entrepreneurial actions can improve mutual trust between members of the organization, the organizational actions become more efficient (Kacperska and Łukasiewicz, 2020; Sedrine et al., 2020). In addition, through their social network relationships, entrepreneurs can also overcome resource constraints and gain access to more resources and information (Bauernschuster et al., 2010), which leads to knowledge spillovers and collective learning between the agglomerated enterprises (Crespo et al., 2022), reduces the cost of technological innovation, and further improves productivity and boosts economic growth (Xu et al., 2021). Entrepreneurship also enables enterprises to take greater social responsibility (Chen et al., 2021; Biggeri et al., 2022). Entrepreneurs are the shapers of corporate culture and the leaders of corporate development (Mudrack, 2007). A great entrepreneur can lead by, for example, influence corporate culture, guide enterprises to achieve sustainable development, raise awareness of environmental protection, and contribute to economic transformation and social development (Branco and Rodrigues, 2006). A rising sense of social responsibility influences corporate decisions and disciplines company behavior, which in turn can motivate clean energy technology innovation, reduce pollution emissions, and protect the environment (Agudelo et al., 2020). Based on this logic, the second hypothesis is proposed to analyze the role of entrepreneurship in the impact process of co-agglomeration on GEE.
Hypothesis 2: Co-agglomeration can promote GEE through its spillover effects on entrepreneurship.
Empirical Analysis
Data Description
This paper selects 2000 to 2019 Chinese panel data1 as the research samples. The original data for the variables are extracted from the National Bureau of Statistics of China, China Statistical Yearbooks, China Labor Statistical Yearbooks, Provincial statistical Yearbooks, CEIC China Premium Database. To ensure the accuracy of the empirical results and weaken the dimensional differences, foreign direct investment (fdi), environmental regulations (er), and local fiscal expenditure on environmental protection (efe) are logarithmized.
Variables Descriptions
Explained Variable: GEE
The GEE measures the overall output for both the economy and the environment and reflects green output environmental pollution costs. Specifically, the GEE measures the desirable output efficiency per unit of input costs and the environmental production process costs (Qian and Liu, 2013; Ohene-Asare and Turkson, 2019). This paper measures the GEE under constant scale conditions using the super-efficient SBM model (Tone, 2004; Lee, 2020), a method that appraises the relative efficiencies of multiple inputs and outputs (Kutty et al., 2022).
The measurement indicators are inputs, desirable outputs, and undesirable outputs, with the desirable outputs representing the desirable economic efficiencies, and the undesirable outputs representing the undesirable environmental efficiencies. The input factors are capital, labor, and energy inputs. The fixed asset investments, which are determined using the perpetual deposit method, are used to evaluate the capital stock and represent capital investment (Xie and Pan, 2011). The number of employees at the end of the year represents the labor, and the total energy consumption in each region is adopted to represent the energy input. The desirable output is the GDP in each region, and the undesirable output is the waste emissions. As most environmental pollution comes from the manufacturing sector, the undesirable outputs are represented by industrial wastewater, waste gas, and solid waste discharges, with the SO2 industry emissions being used to indicate the industrial waste gas discharges.
Explanatory Variable: Co-Agglomeration Index for the Corporations in Manufacturing and Producer Services2 Sector (Coaggl)
The co-agglomeration concept was proposed by Glaeser and Eillson. Based on an industrial geographic concentration measurement, Glaeser and Eillson constructed an E-G modified index to formulate a co-agglomeration index for two industries, which has consequently been widely used to assess co-agglomeration levels. In reference to the ideas proposed in Devereux et al. (2003) and Jiang and Xi (2014), this paper adopted the E-G correction index, which is calculated by incorporating the Herfindahl index and assigning weights, the formula for which is as follows:
where wi and wj are the weight index, which is the proportion of employees in a single industry to the sum of employees in two industries, Hi, Hj, and Hij, respectively, represent the geographic concentration formed by industry i, industry j, and two industries; the larger the value of rij, the higher the agglomeration degree between the industries.
The geographic concentration is generally expressed using the Herfindahl index, for which the employment data from the various regions are adopted for the calculation, the formula for which is as follows:
where Sk is the proportion of industrial employees in the entire region k, and n is the number of regions.
Control Variables
The first control variable is transportation infrastructure (tinfr) as convenient transportation can ease factor production constraints and increase productivity (Cedillo-Campos et al., 2022), for which the ratio of road kilometers to city area is used.
The second control variable is the industrial structure (is), which is measured based on the share of secondary sector output in total output. Generally speaking, the higher the secondary industry share, the more serious the pollution, and the greater the adverse effect on GEE (Muhammad et al., 2022).
The third control variable is the human capital level (hc). The greater the human capital improvement, the more efficient the knowledge dissemination, which is conducive to GEE improvements (Aljuboori et al., 2021; Martinidis et al., 2021). Therefore, the average education per capita is chosen to represent the labor quality in each region.
The fourth control variable is foreign direct investment (fdi) as this can affect regional innovative development and improve environmental quality (He, 2005; Ali et al., 2022) or can have a “pollution haven” effect [it refers to the tendency of companies in the industry to establish themselves in countries or regions where environmental standards are relatively low] (List and Co, 1999; Nguyen, 2021).
The fifth control variable is environmental regulations (er). Implemented government policies and regulations affect the environmental impacts on GEE. Moderate regulations can stimulate innovation and increase GEE (Lanoie et al., 2008; Thiel et al., 2016); however, excessive regulations can increase enterprise costs, which is not conducive to GEE improvement (Leiter and Winner, 2010; Saltari and Travaglini, 2011). Therefore, the proportion of corporate investment in pollution treatment to GDP is selected to represent the environmental regulations indicator.
The sixth control variable is the local fiscal expenditure on environmental protection (efe). The government can improve the environment by increasing its fiscal expenditure on corporations, which may lower corporate costs and motivate enterprises to improve their GEE.
Research Design
To analyze the relationships between corporate co-agglomeration and GEE, a regression model with quadratic terms is established, as follows:
where GEEit is the GEE in province i in year t, Coagglit is the co-agglomeration index in province i in year t, Coaggl is the quadratic term for the co-agglomeration index, Controlit represents the control variables, and εit is a random error term.
Empirical Results
Basic Regression
Descriptive Statistics
The descriptive data statistics for the regression analysis for the models in this paper are shown in Table 1.
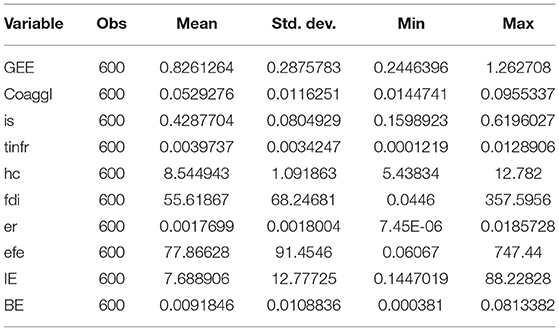
Table 1. Descriptive statistics.
Main Results
This paper first uses the panel OLS method to determine the impact of the manufacturing and producer service co-agglomeration on GEE in China, the results for which are shown in Table 2. The Hausman test find that the Prob>chi2 for the four models are 0.0007, 0.0055, 0.0000, and 0.0000, respectively. As they all strongly reject the original hypothesis, the fixed effects model is chosen. The regression results in Table 2 show that the manufacturing and producer service co-agglomeration is conducive to the regional GEE improvements, and there is an “inverted U-shaped” relationship between the co-agglomeration and GEE. That is, the above empirical results indicate that hypothesis 1 of this paper is tested.
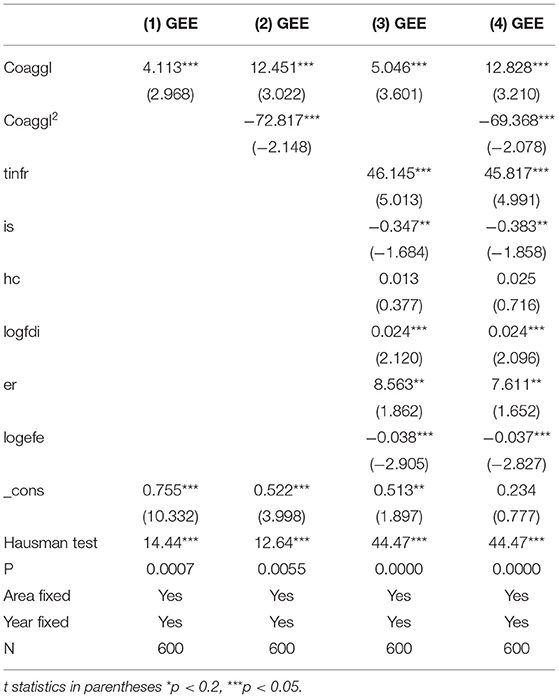
Table 2. Main results.
When the co-agglomeration level is within a proper range, competition and cooperation coexist, and agglomeration will generate externalities, such as increased cross-industry talent exchange, expanded knowledge, and technological spillover dissemination, and the innovative vitality of the enterprises is enhanced, thus leading to the enhancement of GEE (Chen and Hu, 2008; Liu and Rui, 2012). When the co-agglomeration level exceeds the range, its increase has an adverse impact on GEE because at this point, the market is overcrowded and threatens the carrying capacity of the region. The negative externalities outweigh the positive ones, and the economic aggregates are expressed as an increase in resource consumption and environmental pollution (Dou and Liu, 2016; Lin and Tan, 2019).
After adding the control variables, the co-agglomeration coefficient becomes larger, which indicates that the control variable selections are valid. Transportation infrastructure (tinfr) facilitates GEE as it can reduce circulation costs, optimize resource allocations, and promote talent and technology spillovers (Ghosh and Dinda, 2022). The secondary sector share depresses GEE because it generates greater pollution. Human capital (hc) can boost GEE, and industrial co-agglomeration provides conditions for the accumulation of human capital (Ji et al., 2021). As high-quality human capital represents knowledge, technology, and experience, it is more beneficial to knowledge and innovation spillovers (Yuan and Gao, 2020), which can elevate GEE. The foreign direct investment (fdi) coefficient is positive, which is inconsistent with the “pollution haven” hypothesis (Zeng and Zhao, 2009), and indicates that the benefits of foreign direct investment are greater than the drawbacks in China and can offer a better environment and conditions for regional GEE improvements. The environmental regulation coefficient is also positive, indicating that environmental regulations can have a positive adjustment effect on GEE, that is, environmental regulations regulate corporate behavior, reduce pollution emissions, and promote green technology innovation (Hamamoto, 2005; Telle and Larsson, 2006). The local government's fiscal expenditure on environmental protection significantly inhibits GEE improvements, which indicates that fiscal expenditure is an inefficient way to protect the environment as it weakens the incentive for enterprises to regulate themselves and improve the environment.
Endogeneity Test
However, as there may have been an endogenous relationship between the co-agglomeration and the GEE, to deal with the endogeneity and ensure greater results reliability, this paper selects the instrumental variable method and redoes the estimation for which a lag of 1 is added to the co-agglomeration and a lag of 1 is added to the squared term as the instrumental variables. As shown in Table 3, the instrumental variables pass both the weak instrumental variable test and the non-identification test (Stock and Yogo, 2005); therefore, as the relationship between the co-agglomeration and GEE is still in an “inverted U-shape,” the instrumental variables are valid and the regression results are proven to be reliable.
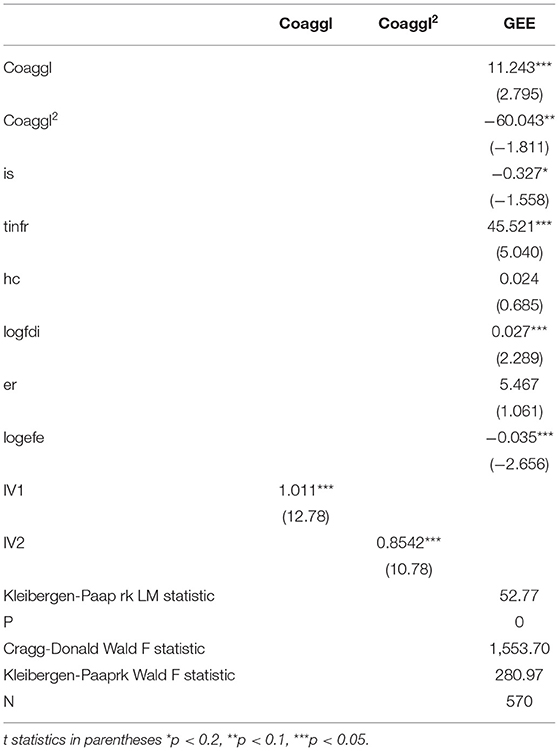
Table 3. Instrumental variable regression.
Heterogeneity Analysis
A heterogeneity analysis is conducted using group regression (Li and Song, 2008; Yang and Wang, 2014), the results for which are shown in Table 4. The suest test p-values show that the coefficients of variation between the regions are significant, indicating that there is heterogeneity between the regions3.
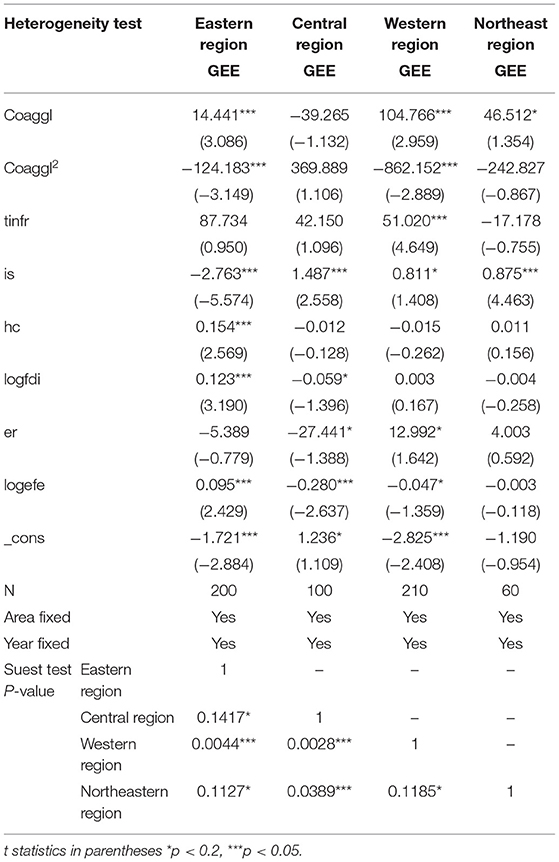
Table 4. Heterogeneity test.
As shown in Table 4, the influence of co-agglomeration on GEE in the eastern, western, and northeastern regions has an “inverted U-shaped” curve. The difference is that the influence of co-agglomeration on GEE in the central region has a “U-shaped” curve, which is because in the central region, when the co-agglomeration is at a lower level, the negative externality generated by agglomeration is greater than the positive externality, resulting in lower GEE. However, as the level of co-agglomeration continues to rise, the GEE will increase.
Currently, individual provinces in the eastern region have had excessively high co-agglomeration in the recent years, which has inhibited the GEE. The corporate co-agglomeration in most other provinces and cities is still promoting GEE. The industrial co-agglomeration in the central regions is at the bottom of the “U-shaped” curve and indicates that the current co-agglomeration does not adequately contribute to the GEE. The industrial co-agglomeration in the western region has crossed to the left side of the “inverted U-shaped” curve, which is not conducive to GEE improvements. In the northeastern region, the co-agglomeration level is at the top of the “inverted U” curve, which will inhibit GEE if it continues to grow.
In addition, the co-agglomeration in the central, western, and northeastern regions has a greater impact on GEE than in the eastern region. In other words, for every 1% point change in the co-agglomeration index, the degree of change in the GEE in the central, western, and northeastern regions is greater than in the eastern region. This is because the eastern region has a better economic and industrial structure than the central, western, and northeastern regions, which weakens the marginal promotion effect of co-agglomeration on GEE. However, the central, western, and northeastern regions have a larger marginal effect because of the larger optimization space.
Robust Test
To verify the robustness of the above results, the sample is changed and another method is adopted to re-estimate the model. First, system GMM is chosen as the new estimation method because system GMM can deal with heteroscedasticity problems and weaken endogeneity. Second, to lessen the effects of the sample time span and extreme data, the 2019 sample was excluded4 and the explanatory variables are cut by 1% up and down. As shown in Table 5: (1) the conclusion that industry co-agglomeration promotes regional GEE is still proven; (2) the “inverted U-shaped” curve is still significant; and (3) the coefficients for the other variables remain unchanged. Therefore, the above conclusions are proven to be robust.
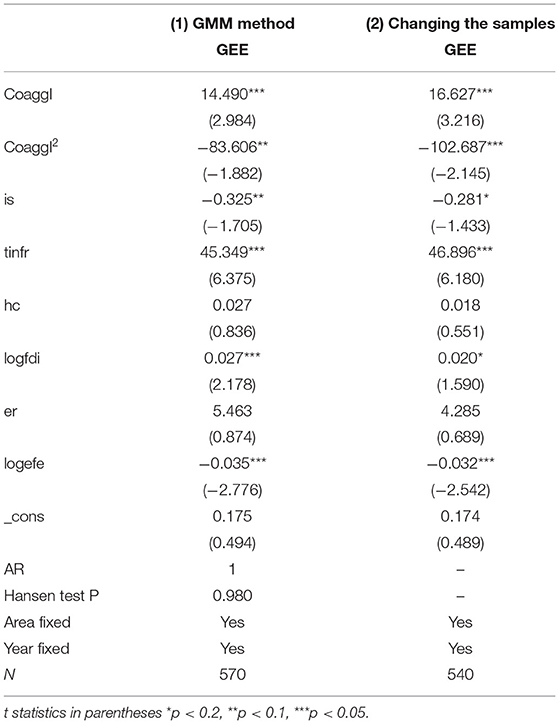
Table 5. Robust test.
Mechanism Test
To further investigate whether entrepreneurship is the transmission mechanism for co-agglomeration on GEE, the mediating effect model proposed by Baron and Kenny (1986) is consulted to test. Considering the importance of the many connotations of entrepreneurship and the availability of data, this paper draws on the approach of Hébert and Link (1989) to classify entrepreneurship into business entrepreneurship (BE) and innovation entrepreneurship (IE).
The total number of manufacturing and producer service patents granted in each region is divided by the annual population of the region to obtain the number of granted patents per 10,000 people, which is then used to represent the innovation entrepreneurship (IE) (Wong et al., 2005; Li et al., 2009; Song and Chen, 2020). The number of private firms in manufacturing and producer services per 10,000 people is taken to represent business entrepreneurship (BE) (Beugelsdijk and Noorderhaven, 2004; Glaeser, 2007; Ovaska and Takashima, 2021).
Referring to the mediating effects test model (Wen et al., 2004), Table 6 is generated, which shows the results of the mechanism test for innovation entrepreneurship and business entrepreneurship.
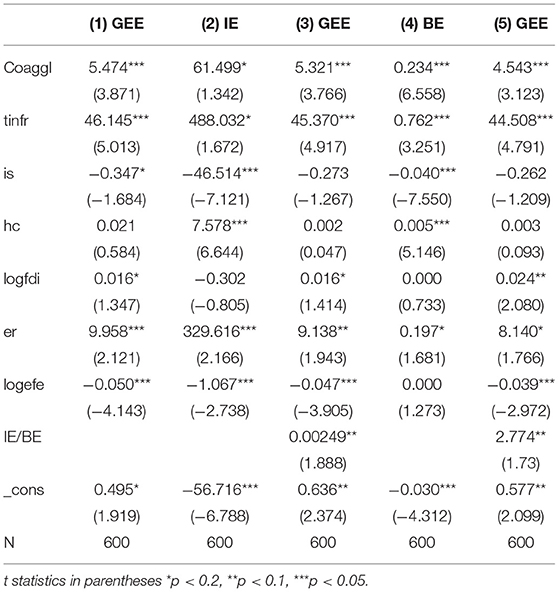
Table 6. Mechanism test.
In Table 6, it can be seen that the test results of columns (2) and (4) are significantly positive, indicating that the positive contribution of co-agglomeration to entrepreneurship is significant. The test results of columns (3) and (5) are also significantly positive, indicating that the mediating effect of entrepreneurship is significant. Among them, the mediating effect of IE is 2.8% and the mediating effect of BE is 11.9%. That is, co-agglomeration can spill over to entrepreneurship, and entrepreneurship promotes GEE. Entrepreneurship, as one of the externalities of co-agglomeration, optimizes the efficiency of resource allocation within enterprises and strengthens knowledge spillover and technological innovation. Meanwhile, excellent entrepreneurs guide enterprises to pursue efficient and sustainable development by enhancing their sense of responsibility and mission. Therefore, co-agglomeration can promote GEE through its spillover effects on entrepreneurship, and hypothesis 2 of this paper is tested.
Conclusion
Using 2000–2019 panel data from China, this paper measures GEE and corporate co-agglomeration level and empirically investigates the effects of co-agglomeration on GEE, from which the following are discovered. First, the manufacturing and producer service corporate co-agglomeration is significantly conducive to enhancing GEE in China, with the corporate co-agglomeration showing an “inverted U-shaped” relationship with the GEE. Second, there is regional heterogeneity in the effects of corporate co-agglomeration on GEE. In the central region, the corporate co-agglomeration does not contribute sufficiently to the GEE. The co-agglomeration in the western and northeastern regions and some developed eastern provinces is found to be too high. Finally, entrepreneurship plays a mediating role in the effect of corporate co-agglomeration on GEE.
The findings in this paper indicate that the level of co-agglomeration needs to be controlled to better promote GEE and entrepreneurship is an important factor in this process. Therefore, local policies should be carefully designed to have a guiding effect on corporate location decisions. Green industrial parks and tax incentive policies should be established to support the co-agglomeration of corporates. Meanwhile, by taking the carrying capacity of local infrastructure and resources into consideration, focusing on the quality of FDI, and exerting the constraining effect of environmental regulations, the local government could avoid the negative effects of excessive co-agglomeration. In addition, institutions and policies that facilitate the exercise of entrepreneurship should be formulated. Practical measures such as improving the financial system, providing funding support, and lowering the threshold for business startups could be taken to encourage the exertion of entrepreneurship.
Data Availability Statement
The datasets presented in this study can be found in online repositories. The names of the repository/repositories and accession number(s) can be found in the article/supplementary material.
Author Contributions
XZ, YZ, and WY contributed to the conception and design of the study. YZ organized the database and performed the statistical analysis. All authors wrote the first draft of the manuscript together, contributed to manuscript revision, read, and approved the submitted version.
Conflict of Interest
The authors declare that the research was conducted in the absence of any commercial or financial relationships that could be construed as a potential conflict of interest.
Publisher's Note
All claims expressed in this article are solely those of the authors and do not necessarily represent those of their affiliated organizations, or those of the publisher, the editors and the reviewers. Any product that may be evaluated in this article, or claim that may be made by its manufacturer, is not guaranteed or endorsed by the publisher.
Footnotes
1. ^Tibet is not included because of the lack of data. Taiwan, Hong Kong, and Macao are excluded because their statistical systems differ from the mainland's.
2. ^There is no specific statistical data for producer services. We refer to the Statistical Classification of producer services (2019) and the categories of Statistical Yearbook, and select transportation, warehousing and postal services, information transmission, software and information technology services, financial services, leasing and business services, scientific research and technical services, and real estate to represent producer services sector.
3. ^Eastern region, central region, western region and northeastern region in the Yearbook are divided as following:
Eastern 10 provinces (municipalities) include: Beijing, Tianjin, Hebei, Shanghai, Jiangsu, Zhejiang, Fujian, Shandong, Guangdong and Hainan; Central 6 provinces include: Shanxi, Anhui, Jiangxi, Henan, Hubei and Hunan; Western 12 provinces (autonomous regions and municipalities) include: Inner Mongolia, Guangxi, Chongqing, Sichuan, Guizhou, Yunnan, Tibet(Not included in this article due to missing data), Shaanxi, Gansu, Qinghai, Ningxia and Xinjiang; Northeastern 3 provinces include: Liaoning, Jilin and Heilongjiang.
4. ^In 2019, the National Development and Reform Commission issued a directory of industrial restructuring, guiding the focus on promoting a new development concept and promoting the high-quality transformation of the manufacturing industry; therefore, these data were removed for the robustness to reduce the impact of the sample time span.
References
Agudelo, M. A. L., Johannsdottir, L., and Davidsdottir, B. (2020). Drivers that motivate energy companies to be responsible. A systematic literature review of corporate social responsibility in the energy sector. J. Clean. Prod. 247, 119094. doi: 10.1016/j.jclepro.2019.119094
Ahmad, Z., Liu, C., Wang, C., Iqbal, W., Muhammad, S., and Ahmed, S. (2021). Assessing the performance of sustainable entrepreneurship and environmental corporate social responsibility: revisited environmental nexus from business firms. Environ. Sci. Pollut. Res. Int. 29, 426–439. doi: 10.1007/s11356-021-17163-5
Ali, N., Phoungthong, K., Techato, K., Ali, W., Abbas, S., Dhanraj, J. A., et al. (2022). FDI, green innovation and environmental quality nexus: new insights from BRICS economies. Sustainability 14, 2181. doi: 10.3390/su14042181
Aljuboori, Z. M., Singh, H., Haddad, H., Al-Ramahi, N. M., and Ali, M. A. (2021). Intellectual capital and firm performance correlation: the mediation role of innovation capability in malaysian manufacturing SMEs perspective. Sustainability 14, 154. doi: 10.3390/su14010154
Andersson, M. (2006). Co-Location of Manufacturing and Producer Services: A Simultaneous Equations Approach. New York, NY: Routledge.
Audia, P. G., and Rider, C. I. (2005). A garage and an idea: what more does an entrepreneur need? Calif. Manage. Rev. 48, 6–28. doi: 10.2307/41166325
Baron, R. M., and Kenny, D. A. (1986). The moderator-mediator variable distinction in social psychological research: conceptual, strategic, and statistical considerations. J. Person. Soc. Psychol. 51, 1173–1182. doi: 10.1037/0022-3514.51.6.1173
Bauernschuster, S., Falck, O., and Heblich, S. (2010). Social capital access and entrepreneurship. J. Econ. Behav. Org. 76, 821–833. doi: 10.1016/j.jebo.2010.09.014
Becchetti, L., Manfredonia, S., and Pisani, F. (2022). Social capital and loan cost: the role of interpersonal trust. Sustainability 14, 1238. doi: 10.3390/su14031238
Beugelsdijk, S., and Noorderhaven, N. (2004). Entrepreneurial attitude and economic growth: a cross-section of 54 regions. Ann. Reg. Sci. 38, 199–218. doi: 10.1007/s00168-004-0192-y
Biggeri, M., Colucci, D., Doni, N., and Valori, V. (2022). Sustainable entrepreneurship: good deeds, business, social and environmental responsibility in a market experiment. Sustainability 14, 3577. doi: 10.3390/su14063577
Brakman, S., Garretsen, H., Gigengack, R., Marrewijk, C. V., and Wagenvoort, R. (1996). Negative feedbacks in the economy and industrial location. J. Reg. Sci. 36, 631–651. doi: 10.1111/j.1467-9787.1996.tb01122.x
Branco, M. C., and Rodrigues, L. L. (2006). Corporate social responsibility and resource-based perspectives. J. Bus. Ethics 69, 111–132. doi: 10.1007/s10551-006-9071-z
Browning, H. L., and Singelmann, J. (1975). The Emergence of a Service Society: Demographic and Sociological Aspects of the Sectoral Transformation of the Labor Force in the USA. Springfield: National Technical Information Service.
Cedillo-Campos, M. G., Piña-Barcenas, J., Pérez-González, C. M., and Mora-Vargas, J. (2022). How to measure and monitor the transportation infrastructure contribution to logistics value of supply chains? Transport Policy 120, 120–129. doi: 10.1016/j.tranpol.2022.03.001
Chen, J., Chen, N., Yu, K., and Michael, H. C. (2021). Does entrepreneurs' Darwinian social identity contribute to business performance via corporate social responsibility in China? The role of entrepreneurs' well-being. Front. Psychol. 12, 781399. doi: 10.3389/fpsyg.2021.781399
Chen, J., and Hu, C. (2008). The agglomeration effect of industrial agglomeration—A theoretical and empirical analysis of the Yangtze River Delta sub-region. Manage. World 2008, 68–83 (in Chinese). doi: 10.19337/j.cnki.34-1093/f.2014.02.007
Chen, X., and Chen, S. (2014). Level and effect on co-agglomeration of producer services and manufacturing industry: empirical evidence from the Eastern Area of China. Finance Trade Res. 25, 49–57 (in Chinese). doi: 10.19744/j.cnki.11-1235/f.2008.06.009
Crespo, C. F., Crespo, N. F., and Curado, C. (2022). The effects of subsidiary's leadership and entrepreneurship on international marketing knowledge transfer and new product development. Int. Bus. Rev. 31, 101928. doi: 10.1016/j.ibusrev.2021.101928
Dastourian, B., Kesim, H. K., Amiri, N. S., and Moradi, S. (2017). Women entrepreneurship: effect of social capital, innovation and market knowledge. AD Minister 30, 115–130. doi: 10.17230/ad-minister.30.6
Devereux, M. P., Griffith, R., and Simpson, H. (2003). The geographic distribution of production activity in the UK. Reg. Sci. Urban Econ. 34, 533–564. doi: 10.1016/S0166-0462(03)00073-5
Dou, J., and Liu, Y. (2016). Can co-agglomeration between producer services and manufactures promote the urban economic growth? ——Based on the panel data of China's 285 cities. Modern Finance Econ. 36, 92–102 (in Chinese). doi: 10.19559/j.cnki.12-1387.2016.04.009
Ehrenfeld, J. (2003). Putting the spotlight on metaphors and analogies in industrial ecology. J. Indus. Ecol. 7, 1–4. doi: 10.1162/108819803766729131
Ellison, G., and Glaeser, E. L. (1997). Geographic concentration in U.S. manufacturing industries: A dartboard approach. J. Political Econ. 105, 889–927. doi: 10.1086/262098
Ellison, G., Glaeser, E. L., and Kerr, W. R. (2010). What causes industry agglomeration? Evidence from coagglomeration patterns. Am. Econ. Rev. 100, 1195–1213. doi: 10.1257/aer.100.3.1195
Fan, C. C., and Scott, A. J. (2003). Industrial agglomeration and development: a survey of spatial economic issues in East Asia and a statistical analysis of Chinese regions. Econ. Geogr. 79, 295–319. doi: 10.1111/j.1944-8287.2003.tb00213.x
Ganvir, K., and Jain, R. (2021). Implementation of strategic structure by integrating flexible manufacturing system with green technology for enhancement of productivity and quality of product. J. Phys. Conf. Series 2115, 012045. doi: 10.1088/1742-6596/2115/1/012045
Gaubert, C. (2018). Firm sorting and agglomeration. Am. Econ. Rev. 108, 3117–3153. doi: 10.1257/aer.20150361
Ghosh, P. K., and Dinda, S. (2022). Revisited the relationship between economic growth and transport infrastructure in India: an empirical study. Indian Econ. J. 70, 34–52. doi: 10.1177/00194662211063535
Glaeser, E. L. (2007). Entrepreneurship and the City. National Bureau of Economic Research Working Paper Series, No. 13551. doi: 10.3386/w13551
Glaeser, E. L., and Kerr, W. R. (2009). Local industrial conditions and entrepreneurship: how much of the spatial distribution can we explain? J. Econ. Manage. Strategy 18, 623–663. doi: 10.1111/j.1530-9134.2009.00225.x
Greenfield, H. I. (1966). Man Power and the Growth of Producer Services. New York, NY; London: Columbia University Press
Guo, W., and Huang, F. (2020). How does the co-agglomeration of high-tech industries and producer services affect the quality of economic growth? Indus. Econ. Res. 2020, 128–142 (in Chinese). doi: 10.13269/j.cnki.ier.2020.06.010
Hamamoto, M. (2005). Environmental regulation and the productivity of japanese manufacturing industries. Resource Energy Econ. 28, 299–312. doi: 10.1016/j.reseneeco.2005.11.001
He, J. (2005). Pollution haven hypothesis and environmental impacts of foreign direct investment: the case of industrial emission of sulfur dioxide (SO2) in Chinese provinces. Ecol. Econ. 60, 228–245. doi: 10.1016/j.ecolecon.2005.12.008
Hébert, R. F., and Link, A. N. (1989). In search of the meaning of entrepreneurship. Small Bus. Econ. 1, 39–49. doi: 10.1007/BF00389915
Helsley, R. W., and Strange, W. C. (2014). Coagglomeration, clusters, and the scale and composition of cities. J. Polit. Econ. 122, 1064–1093. doi: 10.1086/676557
Henderson, J. V. (1986). Efficiency of resource usage and city size. J. Urban Econ. 19, 47–70. doi: 10.1016/0094-1190(86)90030-6
Huang, L. (2021). Can Industrial agglomeration promote green development efficiency of urban industries of the Yangtze river economic belt? J. Hubei Univ. 48, 115–125 (in Chinese). doi: 10.21203/rs.3.rs-1123875/v1
Jacobs, W., Koster, H. R. A., and van Oort, F. (2013). Co-agglomeration of knowledge-intensive business services and multinational enterprises. J. Econ. Geogr. 14, 433–475. doi: 10.1093/jeg/lbs055
Ji, Y., Liang, Y., and Zhang, C. (2021). The influence of collaborative agglomeration of producer services and manufacturing industry on ecological effect: an empirical test based on dynamic SDM and panel threshold model in five provinces of Northwest China. Chongqing Soc. Sci. 2021, 91–110 (in Chinese). doi: 10.19631/j.cnki.css.2021.009.007
Jiang, M., and Xi, Q. (2014). The industrial relationship and congregation between productive services and manufacture. Nankai J. 1, 153–160 (in Chinese). Available online at: https://kns.cnki.net/kcms/detail/detail.aspx?dbcode=CJFD&dbname=CJFD2014&filename=LKXB201401018&uniplatform=NZKPT&v=HaAUixVcARlja21fcaGN_z3NXzlS-1vsf7Ra4nbnjQt5wwF2sgtVPRXtwhISXi91
Kacperska, E., and Łukasiewicz, K. (2020). The importance of trust in knowledge sharing and the efficiency of doing business on the example of tourism. Information 11, 311. doi: 10.3390/info11060311
Kemper, J., Engélen, A., and Brettel, M. (2011). How top management's social capital fosters the development of specialized marketing capabilities: a cross-cultural comparison. J. Int. Mark. 19, 87–112. doi: 10.1509/jimk.19.3.87
Klein, A., and Crafts, N. (2020). Agglomeration externalities and productivity growth: US cities, 1880–1930. Econ. Hist. Rev. 73, 209–232. doi: 10.1111/ehr.12786
Krugman, P. (1991). Increasing returns and economic geography. J. Political Econ. 99, 483–99. doi: 10.1086/261763
Kutty, A. A., Kucukvar, M., Abdella, G. M., Bulak, M. E., and Onat, N. C. (2022). Sustainability performance of european smart cities: a novel DEA approach with double Frontiers. Sustain. Cities Soc. 81, 103777. doi: 10.1016/j.scs.2022.103777
Lafuente, E., Acs, Z. J., Sanders, M., and Szerb, L. (2020). The global technology frontier: productivity growth and the relevance of Kirznerian and Schumpeterian entrepreneurship. Small Bus. Econ. Entrep. J. 55, 153–178. doi: 10.1007/s11187-019-00140-1
Lanaspa, L., Sanz-Gracia, F., and Vera-Cabello, M. (2016). The (strong) interdependence between intermediate producer services' attributes and manufacturing location. Econ. Model. 57, 1–12. doi: 10.1016/j.econmod.2016.04.010
Lanoie, P., Patry, M., and Lajeunesse, R. (2008). Environmental regulation and productivity: testing the porter hypothesis. J. Prod. Anal. 30, 121–128. doi: 10.1007/s11123-008-0108-4
Lee, H. S. (2020). An integrated model for SBM and Super-SBM DEA models. J. Operat. Res. Soc. 72, 1–9. doi: 10.1080/01605682.2020.1755900
Leiter, A.M, Parolini, A., and Winner, H. (2010). Environmental regulation and investment: evidence from European industry data. Ecol. Econ. 70, 759–770. doi: 10.1016/j.ecolecon.2010.11.013
Li, H., Li, X., Yao, X., Zhang, H., and Zhang, J. (2009). Examining the impact of business entrepreneurship and innovation entrepreneurship on economic growth in China. Econ. Res. J. 44, 99–108 (in Chinese). Available online at: https://kns.cnki.net/kcms/detail/detail.aspx?dbcode=CJFD&dbname=CJFD2009&filename=JJYJ200910009&uniplatform=NZKPT&v=QtMYMFVRhCxtDtK2xZpSpcbBEQ-lMX6rAfd3Q8sychSv1eoZ4wlAuaNZovA01VGx
Li, J., and Song, D. (2008). Specialization, diversification and urban agglomeration economy—an empirical study based on panel data of Chinese prefectural units. Manage. World 2, 25–34 (in Chinese). doi: 10.19744/j.cnki.11-1235/f.2008.02.004
Lin, B., and Tan, R. (2019). Economic agglomeration and green economy efficiency in China. Econ. Res. J. 54, 119–132 (in Chinese). Available online at: https://kns.cnki.net/kcms/detail/detail.aspx?dbcode=CJFD&dbname=CJFDLAST2019&filename=JJYJ201902009&uniplatform=NZKPT&v=ffsbFCXZ-XEBMYvOL7Ww3k-8-9NpV6QfgKwdCm-NpHaPfvAOKocOpN0ekSpd7pQX
List, J. A., and Co, C. Y. (1999). The effects of environmental regulations on foreign direct investment. J. Environ. Econ. Manage. 40, 1–20. doi: 10.1006/jeem.1999.1095
Liu, M. (2021). The influence of collaborative agglomeration of logistics industry and manufacturing industry on high-quality economic development. China Bus. Mark. 35, 22–31 (in Chinese). doi: 10.14089/j.cnki.cn11-3664/f.2021.09.003
Liu, M., and Rui, M. (2012). Reconstruction of value network, the evolution of division and the industrial structure optimization. China Indus. Econ. 2012, 148–160 (in Chinese). doi: 10.19581/j.cnki.ciejournal.2012.05.012
Lu, W., Tam, V. W. Y., Du, L., and Chen, H. (2021). Impact of industrial agglomeration on haze pollution: new evidence from Bohai Sea Economic Region in China. J. Clean. Prod. 280, 124414. doi: 10.1016/j.jclepro.2020.124414
Mansour, A. M. H., and Kanso, L. (2017). Science park implementation – a proposal for merging research and industry in developing Arab countries. HBRC J. 14, 357–367. doi: 10.1016/j.hbrcj.2017.06.002
Marshall, J. N. (1982). Linkages between manufacturing industry and business services. Environ. Plan. A 14, 1523–1540. doi: 10.1068/a141523
Martinidis, G., Komninos, N., Dyjakon, A., Minta, S., and Hejna, M. (2021). How intellectual capital predicts innovation output in EU regions: implications for sustainable development. Sustainability 13, 14036. doi: 10.3390/su132414036
Mason, M. C., and Gos, L. (2014). The role of agglomeration in entrepreneurship: empirical evidence from Italy. Int. J. Entrep. Small Bus. 21, 33–54. doi: 10.1504/IJESB.2014.057914
Mendelová, V. (2022). Technical efficiency decomposition in DEA: a review and improvement with an application in Slovak urban transport. Appl. Econ. 54, 880–896. doi: 10.1080/00036846.2021.1969003
Mudrack, P. (2007). Individual personality factors that affect normative beliefs about the rightness of corporate social responsibility. Bus. Soc. 46, 33–62. doi: 10.1177/0007650306290312
Muhammad, S., Pan, Y., Agha, M. H., Umar, M., and Chen, S. (2022). Industrial structure, energy intensity and environmental efficiency across developed and developing economies: the intermediary role of primary, secondary and tertiary industry. Energy 247, 123576. doi: 10.1016/j.energy.2022.123576
Naseer, S., Song, H., Aslam, M. S., Abdul, D., and Tanveer, A. (2021). Assessment of green economic efficiency in China using analytical hierarchical process (AHP). Soft Comput. 26, 2489–2499. doi: 10.1007/s00500-021-06507-5
Nguyen, V. B. (2021). The difference in the FDI-CO2 emissions relationship between developed and developing countries. Hitotsubashi J. Econ. 62, 124–140. Available online at: https://www.jstor.org/stable/27084655.
Ohene-Asare, K., and Turkson, C. (2019). Total-factor energy efficiency and productivity of ECOWAS states: a slacks-based measure with undesirable outputs. J. Afr. Bus. 20, 91–111. doi: 10.1080/15228916.2018.1480248
Omrane, A. (2015). Entrepreneurs' social capital and access to external resources: the effects of social skills. Int. J. Entrep. Small Bus. 24, 357–382. doi: 10.1504/IJESB.2015.067463
Otsuka, A., Goto,M., and Sueyoshi, T. (2014). Energy efficiency and agglomeration economies: the case of Japanese manufacturing industries. Region. Sci. Policy Pract. 6, 195–212. doi: 10.1111/rsp3.12039
Ovaska, T., and Takashima, R. (2021). The robustness of trust, institutions and entrepreneurship regressions, revisited. Appl. Econ. Lett. 28, 1578–1581. doi: 10.1080/13504851.2020.1834495
Paci, R., and Usai, S. (2000). Technological enclaves and industrial districts: an analysis of the regional distribution of innovative activity in Europe. Reg. Stud. 34, 97–114. doi: 10.1080/00343400050006032
Pandey, B., and Seto, K. C. (2015). Urbanization and agricultural land loss in India: comparing satellite estimates with census data. J. Environ. Manage. 148, 53–66. doi: 10.1016/j.jenvman.2014.05.014
Qian, Z., and Liu, X. (2013). Regional differences in China's green economic efficiency and their determinants. China Populat. Resources Environ. 23, 104–109 (in Chinese). Available online at: https://kns.cnki.net/kcms/detail/detail.aspx?dbcode=CJFD&dbname=CJFD2013&filename=ZGRZ201307016&uniplatform=NZKPT&v=N_YIgx026Ijxhq1NUOuMooHRuH5jIPuKu6zNvHA0MulmUJ3J-Al10K4FhHmi3jbd
Ren, Y., Tian, Z., Liang, D., and Zhang, X. (2021). The spatial effect of industrial co-agglomeration on green total factor productivity. J. Tech. Econ. Manage. 2021, 124–128 (in Chinese). Available online at: https://kns.cnki.net/kcms/detail/detail.aspx?dbcode=CJFD&dbname=CJFDLAST2021&filename=JXJG202109023&uniplatform=NZKPT&v=KszRPQvzOob4KBqc8AV-2DqK2hQQbRz5LHbXQ-PH3yPcWyFGoCI5gqaSt7Ca0k96
Rosenthal, S. S., and Strange, W. C. (2020). How close is close? The spatial reach of agglomeration economies. J. Econ. Perspect. 34, 27–49. doi: 10.1257/jep.34.3.27
Sahoo, B.K., and Tone, K. (2008). Radial and non-radial decompositions of profit change: with an application to Indian banking. Eur. J. Operat. Res. 196, 1130–1146. doi: 10.1016/j.ejor.2008.04.036
Saltari, E., and Travaglini, G. (2011). The effects of environmental policies on the abatement investment decisions of a green firm. Resource Energy Econ. 33, 666–685. doi: 10.1016/j.reseneeco.2011.02.001
Sbergami, F. (2002). “Agglomeration and economic growth some puzzles,” in HEI Working Paper, No, 02/2002.
Schlak, T. (2022). Leadership and social capital: what library leaders need to know about trust, values, and bridge building. J. Libr. Adm. 62, 235–242. doi: 10.1080/01930826.2022.2026122
Sedrine, S. B., Bouderbala, A., and Nasraoui, H. (2020). Leadership style effect on virtual team efficiency: trust, operational cohesion and media richness roles. J. Manage. Dev. 40, 365–388. doi: 10.1108/JMD-10-2018-0289
Silvestri, A., and Veltri, S. (2020). Exploring the relationships between corporate social responsibility, leadership, and sustainable entrepreneurship theories: a conceptual framework. Corp. Soc. Respons. Environ. Manage. 27, 585–594. doi: 10.1002/csr.1822
Song, Y., and Chen, X. (2020). Entrepreneurship and enterprise value in the new era: based on strategic decision-making and efficiency improvement. East China Econ. Manage. 34, 108–119. doi: 10.19629/j.cnki.34-1014/f.191219004
Stock, J.H., and Yogo, M. (2005). “Testing for weak instruments in linear IV regression,” in Identification and Inference for Econometric Models: Essays in Honor of Thomas Rothenberg (Cambridge: Cambridge University Press).
Taghizadeh-Hesary, F., Yoshino, N., Kim, C. J., and Morgan, P. J. (2020). Regional economic integration in Asia: challenges and recommended policies. J. Econ. Integrat. 35, 1–9. doi: 10.11130/jei.2020.35.1.1
Telle, K., and Larsson, J. (2006). Do environmental regulations hamper productivity growth? How accounting for improvements of plants' environmental performance can change the conclusion. Ecol. Econ. 61, 438–445. doi: 10.1016/j.ecolecon.2006.03.015
Thiel, C., Nijs, W., Simoes, S., Schmidt, J., van Zyl, A., and Schmid, E. (2016). The impact of the EU car Co2 regulation on the energy system and the role of electro-mobility to achieve transport decarbon- isation. Energy Policy 96, 153–166. doi: 10.1016/j.enpol.2016.05.043
Tone, K. (2004). Dealing with Undesirable Outputs in DEA: A Slacks-based Measure (SBM) Approach. The Operations Research Society of Janpan, 44–45.
Virkanen, J. (1998). Effect of urbanization on metal deposition in the Bay of Southern Finland. Mar. Pollut. Bull. 12, 39–49. doi: 10.1016/S0025-326X(98)00053-8
Wang, C., Li, A., and Cai, Y. (2022a). Industry convergence and the rising of industrial GVC value potential——empirical study based on the convergence of china's high-end equipment manufacturing and producer services. Soft Sci. (in Chinese). Available online at: https://kns.cnki.net/kcms/detail/detail.aspx?dbcode=CAPJ&dbname=CAPJLAST&filename=XUXI20220228001&uniplatform=NZKPT&v=hF7Q-oHNw7rpoQN0F7qnIzOMgV-dX4lfHnRASKTvQ73XWP-VzICmiecBFd62BR3K
Wang, Y., and Sun, C. (2020). Research on the Impact of industrial coagglomeration on green total factor productivity. Econ. Rev. J. 2020, 67–77. doi: 10.16528/j.cnki.22-1054/f.202003067
Wang, Y., Yin, S., Fang, X., and Chen, W. (2022b). Interaction of economic agglomeration, energy conservation and emission reduction: evidence from three major urban agglomerations in China. Energy 241, 122519. doi: 10.1016/j.energy.2021.122519
Wei, J., Xiong, R., Hassan, M., Shoukry, A. M., Aldeek, F. F., and Khader, J. A. (2021). Entrepreneurship, corporate social responsibilities, and innovation impact on banks' financial performance. Front. Psychol. 12, 2393. doi: 10.3389/fpsyg.2021.680661
Wen, Z., Zhang, L., Hou, J., and Liu, H. (2004). Testing and application of the mediating effects. Acta Psychol. Sinica 36, 614–620 (in Chinese). Available online at: https://kns.cnki.net/kcms/detail/detail.aspx?dbcode=CJFD&dbname=CJFD2004&filename=XLXB200405016&uniplatform=NZKPT&v=GGk9XNmNo1dw4TRIgFlxTE-Ac17FfvUVLdH80yB-WdTLSVwYYifV7lweOCQcviYh
Wennekers, S., and Thurik, R. (1999). Linking entrepreneurship and economic growth. Small Bus. Econ. 13, 27–55. doi: 10.1023/A:1008063200484
Wong, P. K., Ho, Y. P., and Autio, E. (2005). Entrepreneurship, innovation and economic growth: evidence from GEM data. Small Bus. Econ. 24, 335–350. doi: 10.1007/s11187-005-2000-1
Wu, J., Chen, S., and Geng, X. (2021). The effect of entrepreneurial social capital on dynamic capability: the moderating role of the entrepreneurial spirit. Int. J. Wireless Mobile Comput. 19, 367–375. doi: 10.1504/IJWMC.2020.112550
Xie, Q., and Pan, Y. (2011). Estimation of provincial physical capital stock in the Chinese mainland from 1952 to 2009. Contemp. Econ. 2011, 122–128 (in Chinese). Available online at: https://kns.cnki.net/kcms/detail/detail.aspx?dbcode=CJFD&dbname=CJFD2011&filename=DAJJ201101056&uniplatform=NZKPT&v=Rzb--1cXyhxgMjlSzZ1qpIL50fy0ubBVbKeNP-kSyb6yNqwlJPBoHDONkQjwcsIC
Xu, Y., Dong, B., and Chen, Z. (2021). Can foreign trade and technological innovation affect green development: evidence from countries along the Belt and Road. Econ. Change Restruct. 55, 1–28. doi: 10.1007/s10644-021-09337-5
Yang, F., Yeh, A. G. O., and Wang, J. (2018). Regional effects of producer services on manufacturing productivity in China. Appl. Geograp. 97, 263–274. doi: 10.1016/j.apgeog.2018.04.014
Yang, L., and Wang, D. (2014). The impacts of top management team characteristics on entrepreneurial strategic orientation. Manag. Decis. 378–409. doi: 10.1108/MD-03-2013-0140
Yuan, Y., and Gao, K. (2020). The synergetic agglomeration of industries, spatial knowledge spillovers and regional innovation efficiency. Stud. Sci. Sci. 38, 1966–1975+2007 (in Chinese). doi: 10.16192/j.cnki.1003-2053.2020.11.006
Yue, S., Zou, Y., and Hu, Y. (2015). The impact of industrial agglomeration on the efficiency of green development in Chinese cities. Urban Prob. 2015, 49–54 (in Chinese). doi: 10.13239/j.bjsshkxy.cswt.151008
Zeng, D. Z., and Zhao, L. (2009). Pollution havens and industrial agglomeration. J. Environ. Econ. Manage. 58, 141–153. doi: 10.1016/j.jeem.2008.09.003
Zeng, W., Li, L., and Huang, Y. (2021). Industrial collaborative agglomeration, marketization, and green innovation: evidence from China's provincial panel data. J. Clean. Prod. 279, 123598. doi: 10.1016/j.jclepro.2020.123598
Zhang, Z., and Qin, S. (2018). Can the collaborative agglomeration of internet and manufacturing industry improve the urban green efficiency: based on the experience of 283 cities in China. Urban Prob. 2018, 48–54 (in Chinese). doi: 10.13239/j.bjsshkxy.cswt.180707
Keywords: corporate, co-agglomeration, green economy efficiency, manufacturing, producer services
Citation: Zhu X, Zhang Y and Yang W (2022) Corporate Co-Agglomeration and Green Economy Efficiency in China. Front. Psychol. 13:890214. doi: 10.3389/fpsyg.2022.890214
Received: 05 March 2022; Accepted: 18 May 2022;
Published: 08 July 2022.
Edited by:
Rui Xue, Macquarie University, AustraliaReviewed by:
Longguang Yu, Shandong University of Finance and Economics, ChinaXiaotong Yang, Shandong University of Finance and Economics, China
Copyright © 2022 Zhu, Zhang and Yang. This is an open-access article distributed under the terms of the Creative Commons Attribution License (CC BY). The use, distribution or reproduction in other forums is permitted, provided the original author(s) and the copyright owner(s) are credited and that the original publication in this journal is cited, in accordance with accepted academic practice. No use, distribution or reproduction is permitted which does not comply with these terms.
*Correspondence: Yunqi Zhang, MjAyMTE0MDEwMTFAc3R1LnNpY251LmVkdS5jbg==