 Luis Pueyo
 Víctor Murillo
 Javier Álvarez
 Alberto Sarmiento
 Mario Amatria
- 1Department of Physiatry and Nursing, University of Zaragoza, Zaragoza, Spain
- 2Faculty of Educational Science, Pontifical University of Salamanca, Salamanca, Spain
Introduction: Analysis in football seeks to find the performance factors that bring teams closer to success.
Methods: This study aims to analyze the playing styles of two teams managed by Pep Guardiola (F.C. Barcelona and Manchester City) based on match location (home or away). Two methods of analysis were used: descriptive statistics through chi-square tests to evaluate game characteristics and the polar coordinates technique to analyze the relationships between the different lines of each team (goalkeeper, defenders, midfielders, and forwards).
Results: The results showed that F.C. Barcelona maintained a consistent playing style regardless of location, exhibiting significant differences only in actions that involved shots or header (p = 0.035), with better performance at home. In contrast, Manchester City displayed significantly different performance in action success (p < 0.001), level of play elaboration (p = 0.004), density (p = 0.033), duration (p = 0.036), and actions that included a shot (p = 0.001) depending on the location. Additionally, qualitative analyses revealed differences in the relationships among the team lines according to match location, with Manchester City displaying more variability in these interactions than F.C. Barcelona.
Discussion: The study concludes that although Guardiola applies a consistent set of strategies, match location has a greater influence on Manchester City’s performance, suggesting that this team adjusts its playing style on the basis of contextual conditions. These findings highlight the importance of considering factors such as location when preparing tactics to increase the probability of success in elite football.
1 Introduction
Football, in its evolution as a sport and cultural phenomenon, underwent significant changes in playing style throughout the 20th and early 21st centuries. Initially, focused on defensive tactics and counterattacks, modern strategies have evolved toward a more balanced approach that values ball possession, progressive buildup from the defense, and complex offensive plays (Barreira et al., 2015). The transformation of football dynamics is due not only to advancements in player technique and performance but also to adaptations to contextual variables such as match location, tournament category, match timing, and the level of the opposing team (Diana et al., 2017; Fernández-Navarro et al., 2018; González-Rodenas et al., 2020). Consequently, today’s elite football players must develop high versatility and motor competence, as well as the ability to process information and make decisions quickly and effectively to successfully overcome these challenges (Wallace and Norton, 2014).
Observational methodology (Anguera, 1979) has proven effective for conducting studies of sports behaviors that occur in their natural contexts (Anguera et al., 2017). Thanks to its non-intrusive nature and respect for behavioral spontaneity, it allows for the evaluation and analysis of interaction relationships among different players, as well as the behaviors that emerge from them at both individual and collective levels. Through this methodology, it is possible to identify various analytical techniques applicable in the sports world (Anguera and Hernández-Mendo, 2015), which have led to significant findings. These techniques have already been applied in previous football studies (Castañer et al., 2013; Pic, 2018) with meaningful applied results, enabling important contributions regarding team performance indicators (Mićović et al., 2023) and the playing styles developed according to different contexts (Castellano and Pic, 2019), thus aiding in the search for strategies that lead to success in elite football.
One of the most studied variables in this regard has been match location (Brito de Souza et al., 2019; Kong et al., 2022) and how it affects team performance. Playing a home match impacts various factors that involve different ways of playing. For example, Almeida et al. (2014) reported that home teams, compared with away teams, tend to defend in more advanced areas of the field, and this approach is more effective when analyzing higher-ranked teams versus those whose standing is lower. Similarly, Diana et al. (2017) identified more complex and elaborate attacking patterns in home matches than in away games. Lago-Peñas and Lago-Ballesteros (2011) even showed that home teams exhibit superior performance in terms of technical and tactical execution. In general, playing at home provides an advantage, and teams may severely alter their playing style on the basis of location (Sarmento et al., 2014).
La Liga and the Premier League offer paradigmatic examples of contexts that, despite sharing certain similarities, present distinctive characteristics and playing styles (Cooper and Pulling, 2020; Nagy et al., 2023). While La Liga has traditionally been known for its technical, possession-based football, the Premier League is noted for its fast pace and emphasis on physicality. Comparisons between these two competitions have been conducted on numerous occasions (Fernández-Navarro et al., 2016; González-Rodenas et al., 2021; Gouveia et al., 2023).
Within this framework, the figure of Pep Guardiola stands out as a unique case study. Having coached teams in both leagues and achieved success in each provides an ideal context to explore how a consistent set of strategies and tactical philosophies can manifest and adapt in leagues with such different characteristics. Previous studies (Immler et al., 2021) have compared playing styles among elite coaches, but few works have examined the evolution or transformation of a coach’s team playing characteristics over time across different competitions, with match location as the object of study.
The purpose of the present research was to evaluate the playing styles of two teams coached by Pep Guardiola (F.C. Barcelona and Manchester City) based on match location (home or away). Descriptive statistics, through chi-square tests, were used to understand their playing characteristics, and qualitative analysis, using the technique of polar coordinates, was applied to discover the interline relationships they produced (goalkeeper -GK-, defenders -DEF-, midfielders -MID-, and forwards -FW-) within each team’s formations. Thus, the aim was to determine whether these teams maintained a stable playing style regardless of where they played their matches or if they were compelled to adapt their match tactics.
2 Materials and methods
The present study corresponded to an observational design of the nomothetic, punctual, and multidimensional type (N/P/M): nomothetic because the two teams were observed as different observational units; punctual because a count of the players’ actions with the ball was made without aiming to conduct a global follow-up of the teams; and multidimensional due to the sequential heterogeneity of possibilities in the different game situations (Anguera et al., 2011).
2.1 Participants
An observational sampling with an intentional or convenience character was carried out (Otzen and Manterola, 2017) involving the two teams under study: F.C. Barcelona and Manchester City. The seasons in which both teams scored the highest number of league goals under Pep Guardiola’s management. At the start of the study these were the 2011/2012 season for F.C. Barcelona (114 goals) and the 2018/2019 season for Manchester City (95 goals). To enhance the validity of the sample, matches played against the top six teams at the end of the season in their national regular competitions were selected (Castellano et al., 2013), including both home and away games (Table 1).
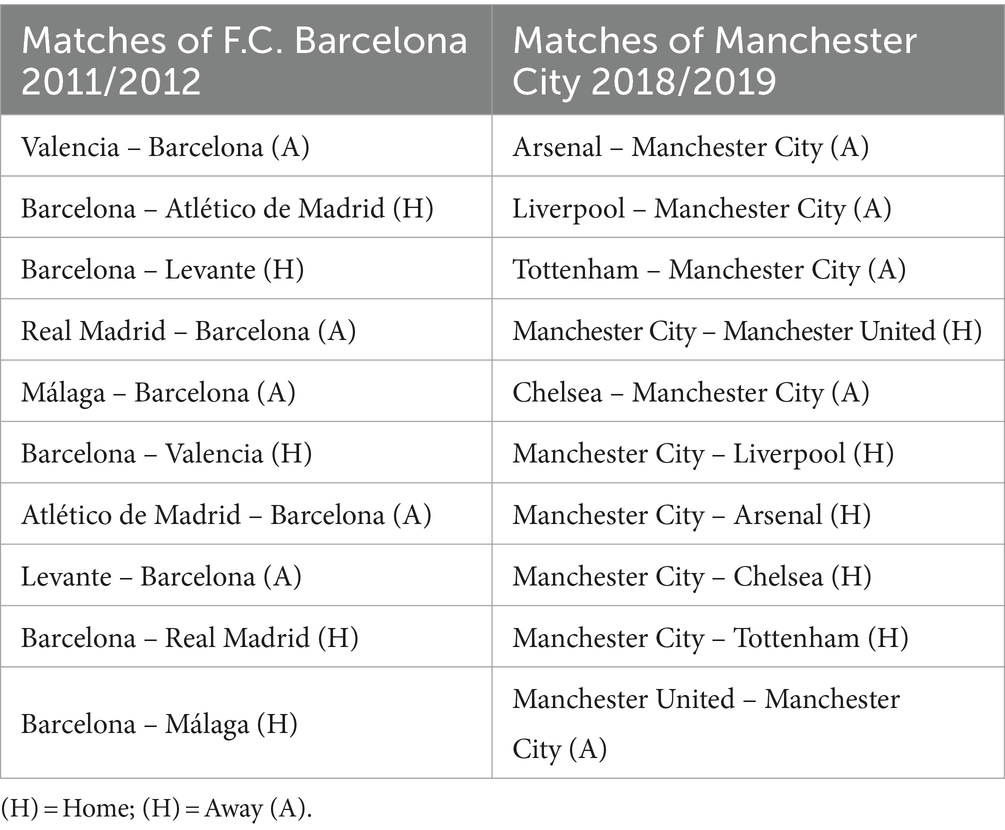
Table 1. Observed matches of each team.
The preparation of this manuscript did not require informed consent or the approval of any ethics committee, complying with the requirements of the National Commission for the Protection of Human Subjects of Biomedical and Behavioral Research (1979), as it involves observation of public footage where the subjects have no reasonable expectation of privacy and do not involve any staged intervention by the researcher or direct interaction with individuals. Similarly, notably, the fundamental ethical principles for research with human beings have been followed in accordance with the Declaration of Helsinki (World Medical Association, 2021; Bošnjak, 2001; Tyebkhan, 2003).
2.2 Observational instrument
The observation instrument used in this study is the one designed by Maneiro and Amatria (2018), developed as an ‘ad hoc’ instrument at its creation. It was based on a field format combined with category systems (Anguera et al., 2020) because the design is multidimensional and each of the criteria unfolds a list of categories, fulfilling the requirements of exhaustiveness and mutual exclusivity (Anguera and Hernández-Mendo, 2013).
Subsequently, once all ball-in-play actions were recorded, variables related to the developed playing style were examined, focusing on the success of the technical actions performed, the level of elaboration and density of the plays, duration, and the volume of shots or attempts (Table 2; Pueyo et al., 2024).
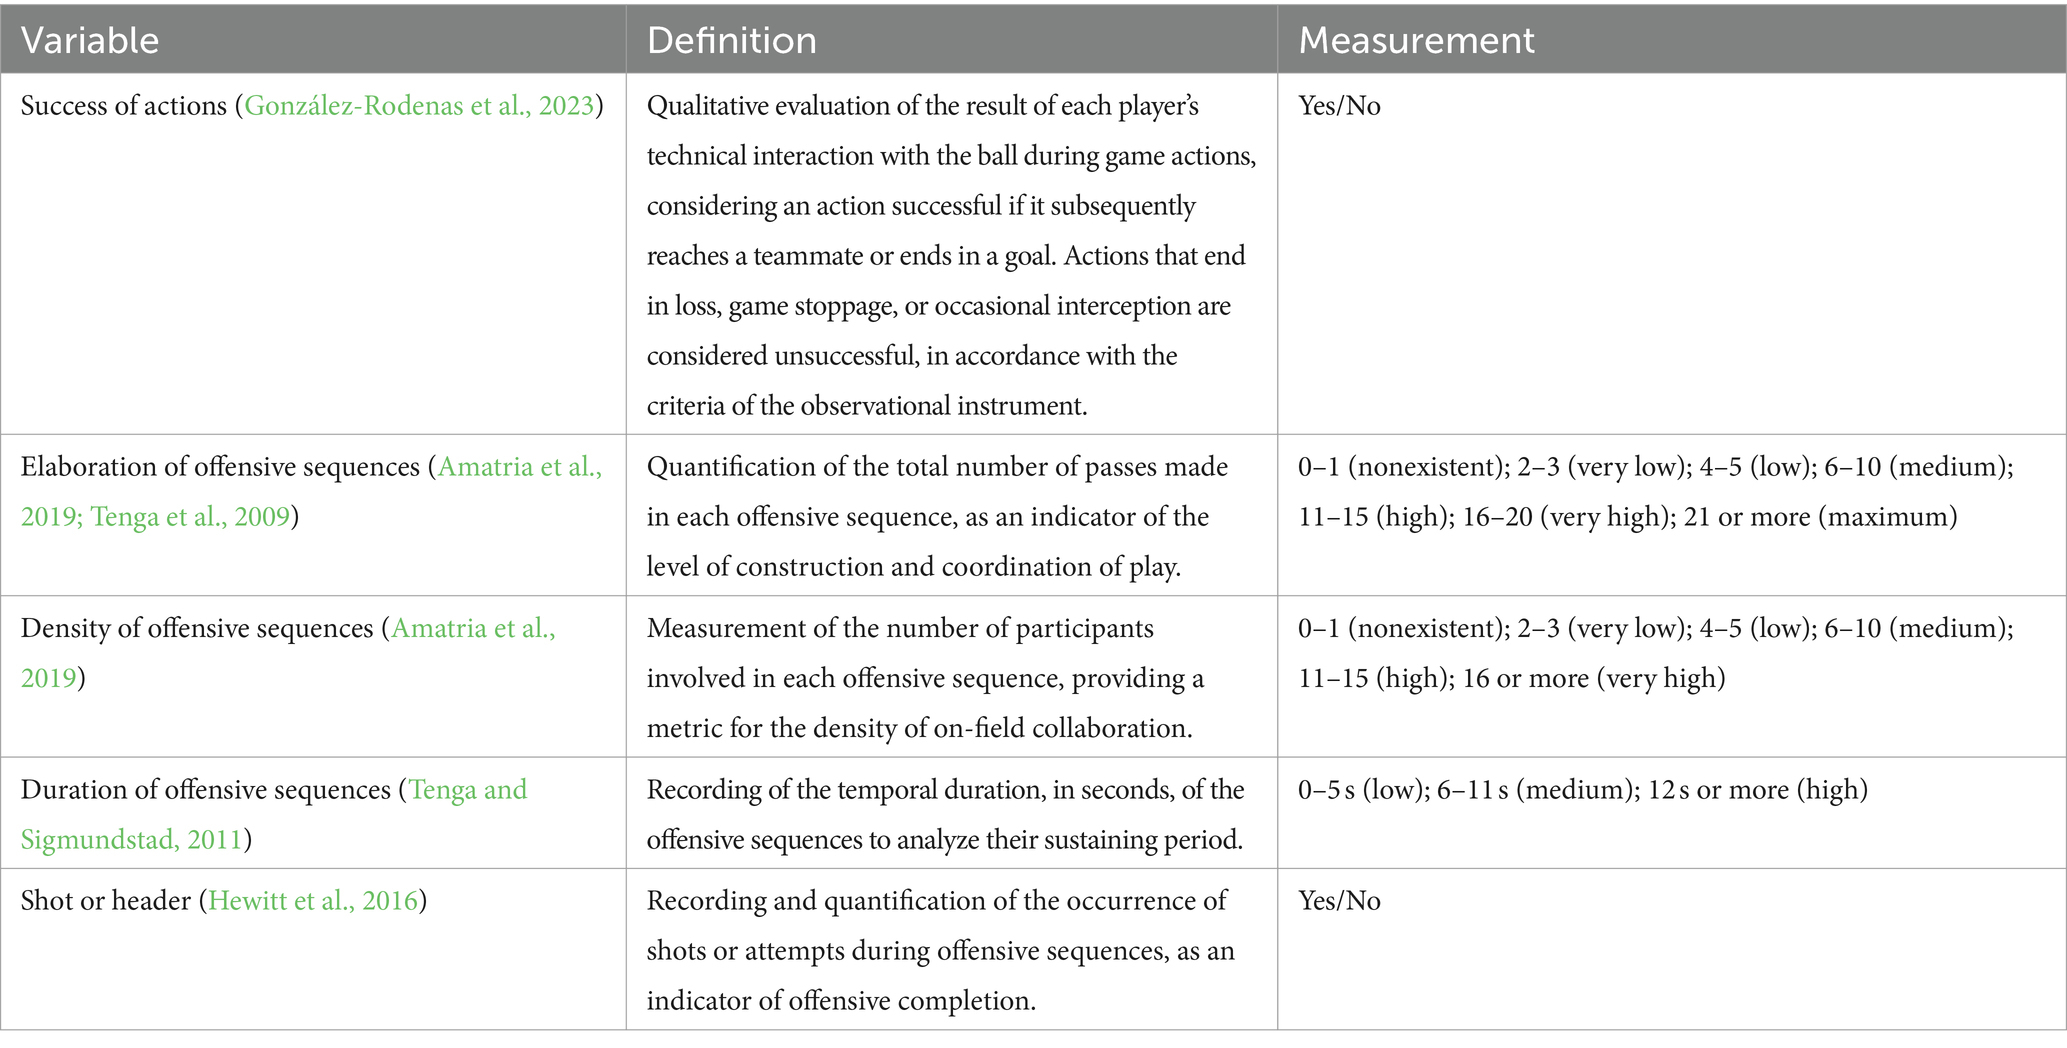
Table 2. Variables evaluated.
2.3 Recording and coding
Data recording (Hernández-Mendo et al., 2014) was performed via the software Lince version 1.4 (Gabin et al., 2012). This software was used for recording and collecting all data, and multievents occurred, understanding the latter as each unit of record within the program. The data obtained are time-based and concurrent, that is, type IV (Bakeman, 1978). Subsequently, the GSEQ software version 5.1 (Bakeman and Quera, 2011) was used to perform sequential lag analysis. The data were introduced into a second program called Hoisan version 1.2 (Hernández-Mendo et al., 2012), with which the corresponding results of the polar coordinate analysis were obtained.
2.4 Data quality control
The researchers who participated in the observations of this study were both graduates in physical activity and sports sciences, with extensive experience as coaches in the context of football and in the development and application of observational methodology in this sport. Evidence of this is the previously published works by the manuscript’s authors (Álvarez Medina et al., 2020; Amatria et al., 2021; Pueyo et al., 2024).
To increase the quality of the data for this work, the principal investigator received specific training in the methodology and handling of the recording instrument, aligning with the guidelines proposed by Losada and Manolov (2015) as well as Anguera (2003). This emphasizes the importance of adequate training for the observer in studies of this nature, ensuring an appropriate level of competence and understanding in the research context.
To guarantee the validity of the data obtained through the observational instrument, the GSEQ software version 5.1 (Bakeman and Quera, 2011) was used. Through this software, Cohen’s Kappa coefficient (Cohen, 1960) was calculated a statistical measure that allowed for an intra-observer analysis in which the data records made at two distant time periods (1 week apart) were compared. Block 1 of the data evaluated corresponds to all the actions that make up the sample, whereas Block 2 comprises 15% of the recorded sequences (Arroyo et al., 2023). The concordance between these two blocks yielded a coefficient of 0.95 in the overall computation of the evaluated dimensions. Likewise, to provide greater robustness and achieve a higher degree of reliability, consultative concordance was carried out (Arana et al., 2016). This qualitative method eliminates the confusion generated by two different interpretations and consists of presenting to a second observer only the discrepant observations between both blocks of records without knowing to which one the recording error corresponds, generating a new data block (Block 3). The observer decides on the basis of their judgment, which of the records constitutes the definitive observation, thus overcoming any limitations inherent to intra-observer concordance. The levels of reliability obtained are within the range classified as “almost perfect” according to the criteria established by Landis and Koch (1977), thereby reinforcing the solidity of the results obtained in the research.
2.5 Data analysis
Two types of analyses were carried out in this study. On the one hand, a quantitative analysis was performed via Pearson’s chi-square statistic (χ2), following the formula: . The level of significance in the data treatment was set at (ρ < 0.05). For this purpose, SPSS v.27 software was used.
On the other hand, to perform the qualitative analysis, the technique of polar coordinates was used. This analytical methodology is grounded in the Zsum proposed by Cochran (1954). This principle is based on the notion that the sum of a series of N independent z scores follows a normal distribution characterized by a mean Z = 0 and a standard deviation s = √N. Thus, the Zsum statistic is defined as (where n is the number of lags involved). This statistic is crucial, as it facilitates the quantification of the associative strength between different behaviors, as noted by Sackett (1980).
Anguera (1997) subsequently proposed an evolution of this technique by introducing the retrospective perspective into the analysis. Polar coordinate analysis allows the elucidation of the relationships of excitation or inhibition between the focal behavior -that is, the behavior under analysis- and the other behaviors that make up the taxonomic system, referred to as conditioned behaviors. This analysis is carried out both from a prospective approach (from +1 to +5) and from a retrospective perspective (from −1 to −5), resulting in a specific vector for each behavior associated with the focal behavior, each characterized by a particular angle and radius. According to these angular premises, the vector can be located in four sectors or quadrants (Figure 1). If it is in quadrant I, there is mutual excitation between the focal behavior and the conditioned behavior. In quadrant II, the focal behavior inhibits the conditioned behavior, and the conditioned behavior excites the focal behavior. If it is located in quadrant III, there is mutual inhibition of the behaviors. Moreover, if the vector falls into quadrant IV, the focal behavior excites the conditioned behavior, and the conditioned behavior inhibits the focal behavior.
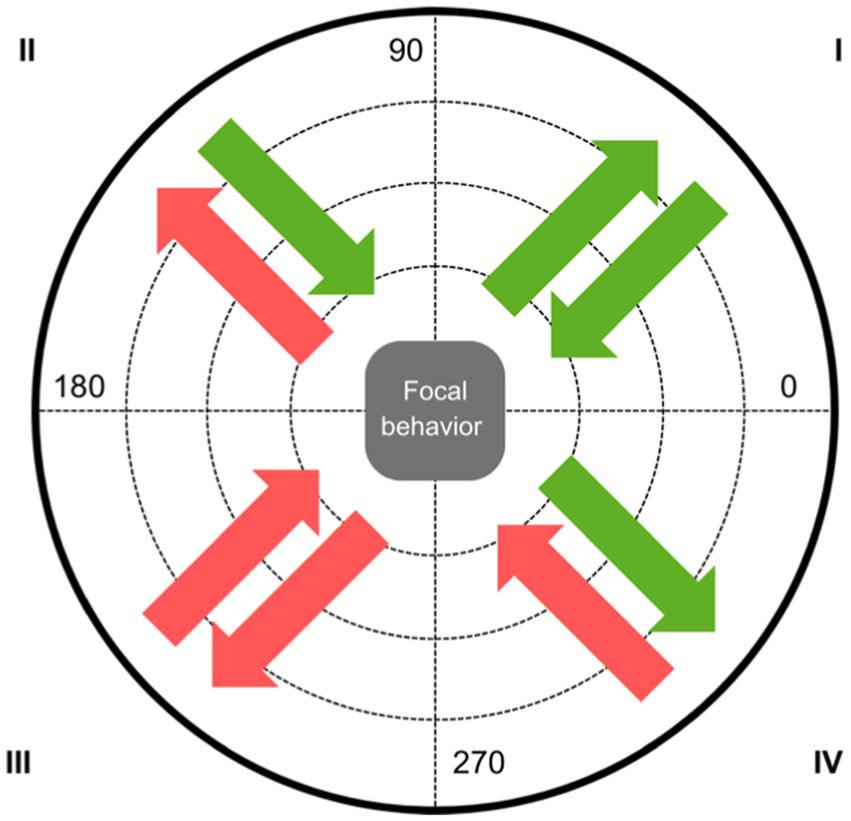
Figure 1. Graphical representation of the excitation or inhibition relationships between the focal behavior and the conditioned behaviors according to the quadrant in which they are located. In green, when it is an excitatory behavior. In red, when it is an inhibitory behavior.
3 Results
A total of 21,377 multievents were recorded, understood as each unit of recording performed. This resulted in 2,356 offensive sequences: 630 and 623 from F.C. Barcelona as home and away teams and 526 and 577 from Manchester City, respectively.
Table 3 shows the results of the variables evaluated for each team based on location. The success of actions indicates that there are no significant differences in the Spanish team, with even a slight increase in success when playing away. In contrast, the English team shows a significant decrease in success when playing away matches (ρ < 0.001).

Table 3. Summary of results based on home and away matches.
With respect to the level of elaboration, density, and duration, F.C. Barcelona shows similar results regardless of location, with a tendency toward slightly higher values when playing at home. On the other hand, Manchester City presents significant differences in elaboration (ρ = 0.004), density (ρ = 0.033), and duration of their play (ρ = 0.036), with much higher values in home matches than in away matches, where their offensive actions are less elaborate, dense, and enduring.
Finally, concerning the volume of plays with shots or headers on goal, significant differences are observed in both teams. Both F.C. Barcelona (ρ = 0.035) and Manchester City (ρ = 0.001) have higher levels of action completion when matches are played at home compared to when they play as visitors.
The results obtained through the polar coordinates analysis of the relationships established between the different lines that compose each team’s structure are shown in Table 4 (F.C. Barcelona) and Table 5 (Manchester City). Each line acting as a focal behavior concerning the rest of the team is presented.
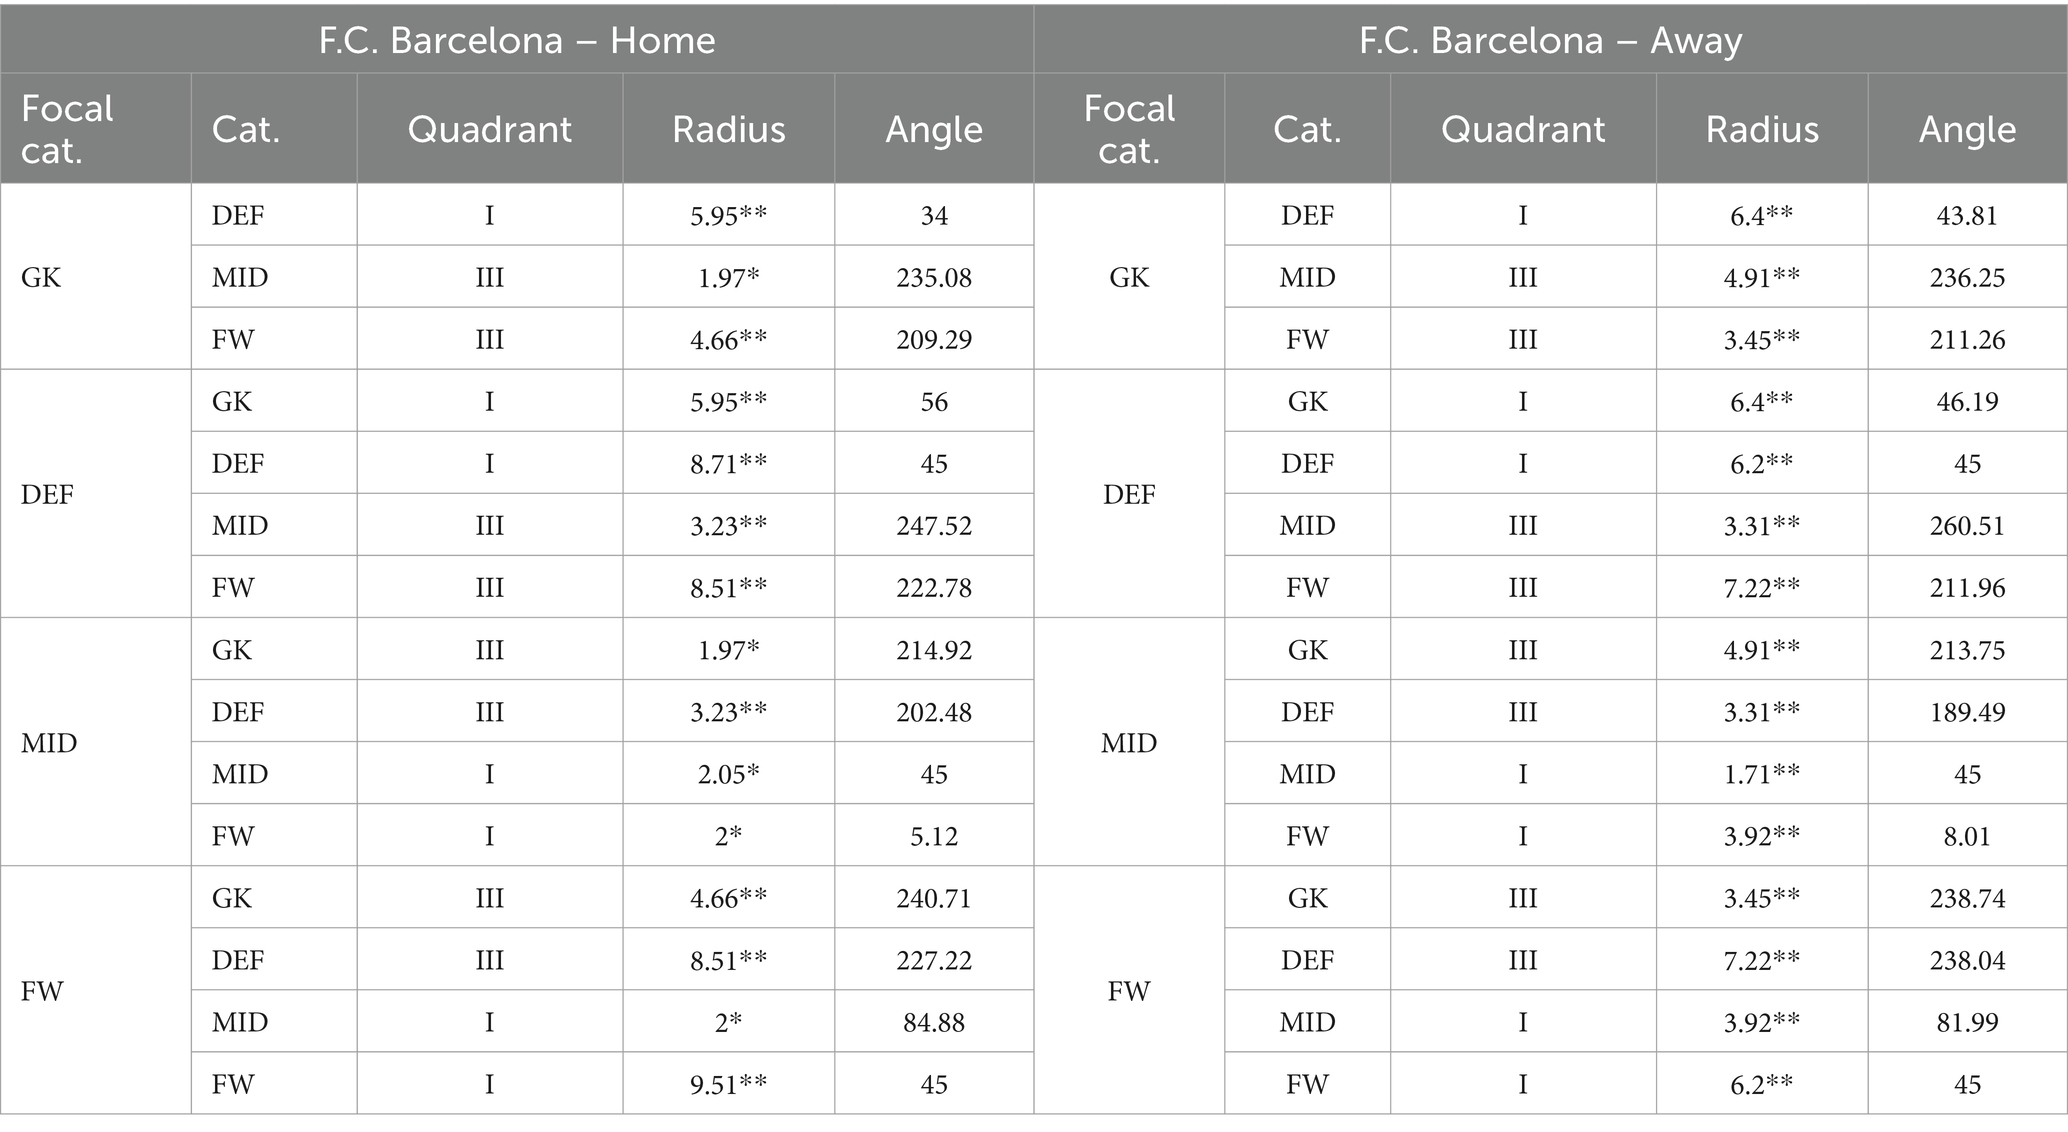
Table 4. Results of the polar coordinates analysis for different focal categories in relation to the rest of the lines forming FC Barcelona’s structure both home and away.
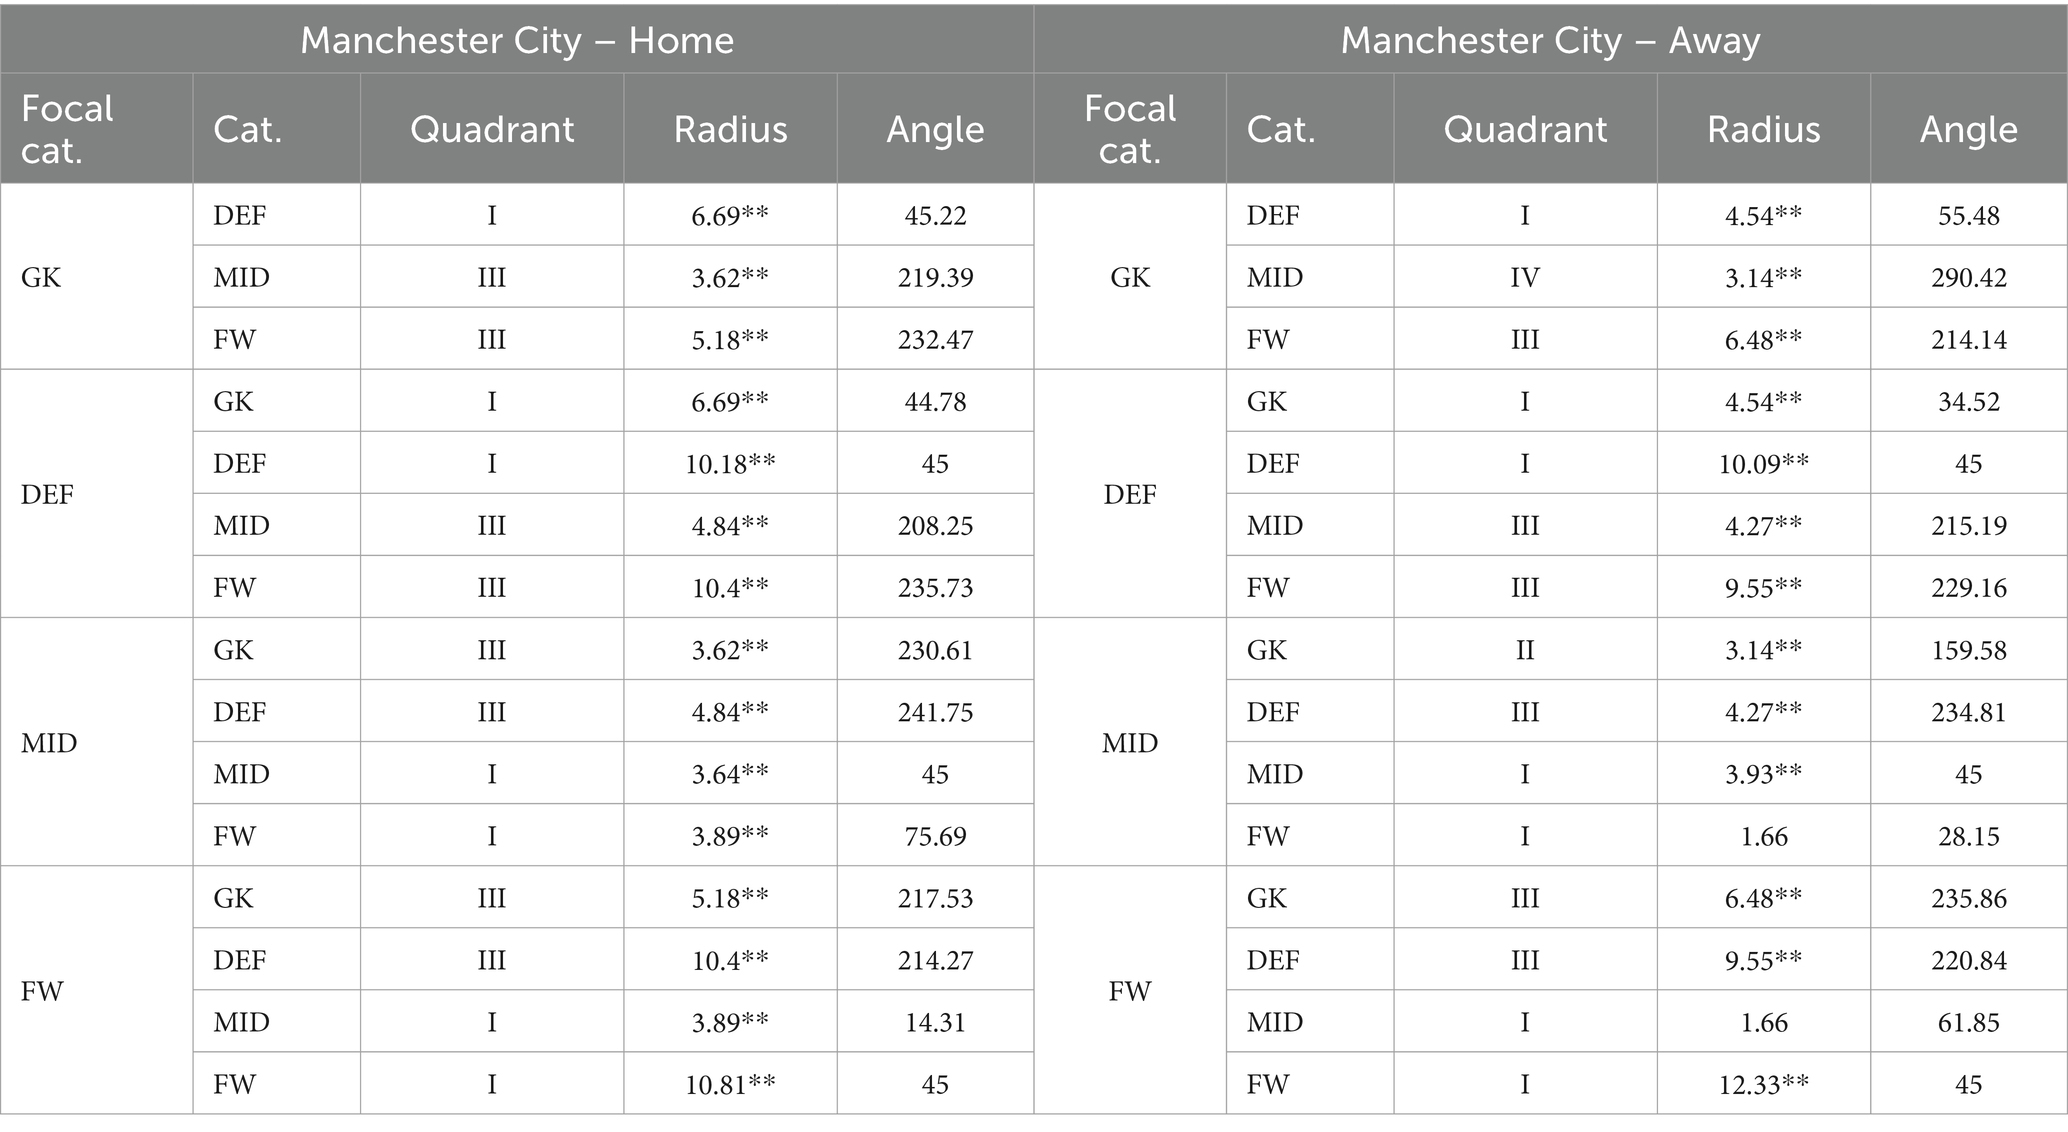
Table 5. Results of the polar coordinates analysis for different focal categories in relation to the rest of the lines forming Manchester City’s structure both home and away.
First, the ‘GK’ (Goalkeeper) category as the focal behavior in both teams, in contrast to the ‘DEF’ (Defenders), ‘MID’ (Midfielders), and ‘FW’ (Forwards) categories identified as conditioned behaviors. This approach was designed to examine the goalkeeper’s predisposition to play in relation to the other lines that compose the game structure during matches.
With respect to the results (Table 4 and Figure 2), in the case of F.C. Barcelona, the conditioned category ‘DEF’ is located in quadrant I, with a radius length of 5.95 and angle of 34° when playing at home and a radius of 6.4 and angle of 43.81° when playing away. This finding indicates that focal behavior activates the presence of conditioned behavior in both the prospective and retrospective planes. The ‘MID’ and ‘FW’ categories are located in quadrant III in both locations, indicating that the focal behavior inhibits the presence of the conditioned behavior in both planes. The values associated with these categories are radii of 1.97 and 4.66 and angles of 235.08° and 209.29°, respectively, when playing at home and radii of 4.91 and 3.45, with angles of 236.25° and 211.26°, respectively, when playing away.
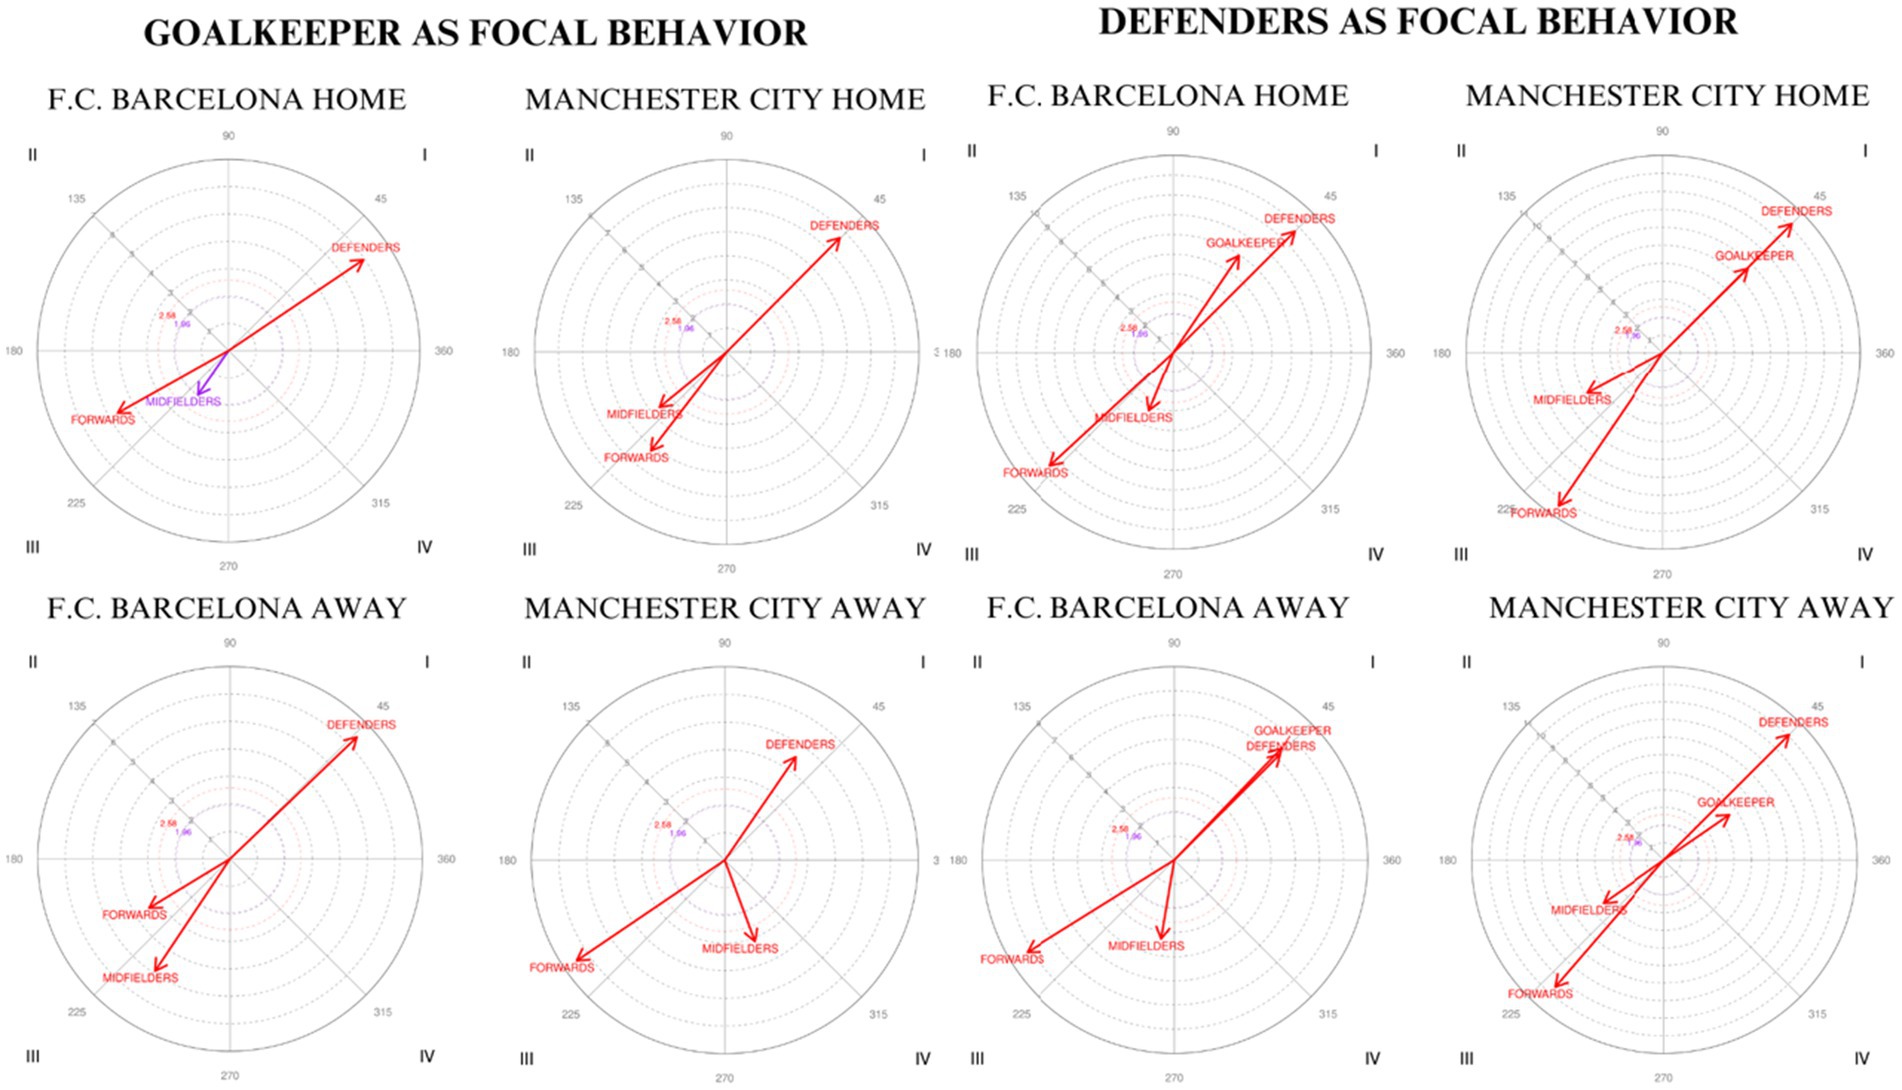
Figure 2. Behavioral map representation establishing the goalkeeper and defense categories as focal behaviors in relation to the lines structuring the team.
In the case of Manchester City (Table 5 and Figure 2), when the match is at home, the ‘DEF’ category is located in quadrant I, with a radius of 6.69 and an angle of 45.22°, and the ‘MID’ and ‘FW’ categories are positioned in quadrant III, with radii of 3.62 and 5.18 and angles of 219.39° and 232.47°, respectively. Conversely, when playing away, the ‘DEF’ and ‘FW’ categories remain in the same quadrants (radii of 4.54 and 6.48 and angles of 55.48° and 214.14°), but the ‘MID’ category is in quadrant IV with a radius of 3.14 and an angle of 290.42°. This implies that focal behavior activates the presence of conditioned behavior in the prospective plane but not in the retrospective plane.
Second, the focal behavior was set as ‘DEF’ (Defenders) and related to the remaining categories that configure the team’s structure, including the defensive line itself: ‘GK’, ‘DEF’, ‘MID’, and ‘FW’. The objective of this approach is to investigate the playing predisposition exhibited by the defensive line in relation to the other lines that make up the team’s tactical structure during matches.
The results obtained (Table 4 and Figure 2) for F.C. Barcelona show that the categories ‘GK’ and ‘DEF’ are located in quadrant I for both home and away matches, indicating that focal behavior activates the presence of conditioned behavior in both the prospective and retrospective planes. The corresponding values are radii of 5.95 and 8.71 with angles of 56° and 45°, respectively, for home matches and radii of 6.4 and 6.2 with angles of 46.10° and 45° when playing away. In contrast, the categories ‘MID’ and ‘FW’ are situated in both cases in quadrant III, where the focal behavior inhibits the presence of the conditioned behavior in both planes. The values associated with these categories are radii of 3.23 for midfielders and 8.51 for forwards, with angles of 247.52° and 222.78° at home, and radii of 3.31 and 7.22, with angles of 260.51° and 211.96° away, respectively.
In the case of Manchester City (Table 5 and Figure 2), the categories ‘GK’ and ‘DEF’ are located in quadrant I, with radii of 6.69 and 10.18 and angles of 44.78° and 45° at home and radii of 4.54 and 10.09 with angles of 34.52° and 45° when playing away. The categories ‘MID’ and ‘FW’, on the other hand, are found in quadrant III, with radii of 4.84 and 10.4 and angles of 208.25° and 235.73° at home and radii of 4.27 and 9.55 with angles of 215.19° and 229.16° when playing away.
In the third segment of the analysis, the midfielders (MID) were established as the focal behavior, both in relation to themselves and to the other lines on the field: ‘GK’, ‘DEF’, ‘MID’, and ‘FW’. This approach aims to evaluate how the midfield line interacts with the other positions that compose the tactical structure throughout the match.
The results obtained (Table 4 and Figure 3) for F.C. Barcelona indicate that the categories ‘GK’ and ‘DEF’ are located in quadrant III, both at home and away, with radii of 1.97 and 4.91 and angles of 214.92° and 213.75°, respectively, for the ‘GK’ category, and radii of 3.23 and 3.31, with angles of 202.48° and 189.49°, respectively, for the ‘DEF’ category. In this context, focal behavior inhibits the presence of conditioned behavior in both the prospective and retrospective planes. On the other hand, the categories ‘MID’ and ‘FW’ are in quadrant I, activating the conditioned behavior in both planes. The corresponding values are a radius of 2.05 and an angle of 45° for the midfielders, a radius of 2 and an angle of 5.12° for the forwards in home matches, and radii of 1.71 and 3.92 with angles of 45° and 8.01° for the ‘MID’ and ‘FW’ when playing away.
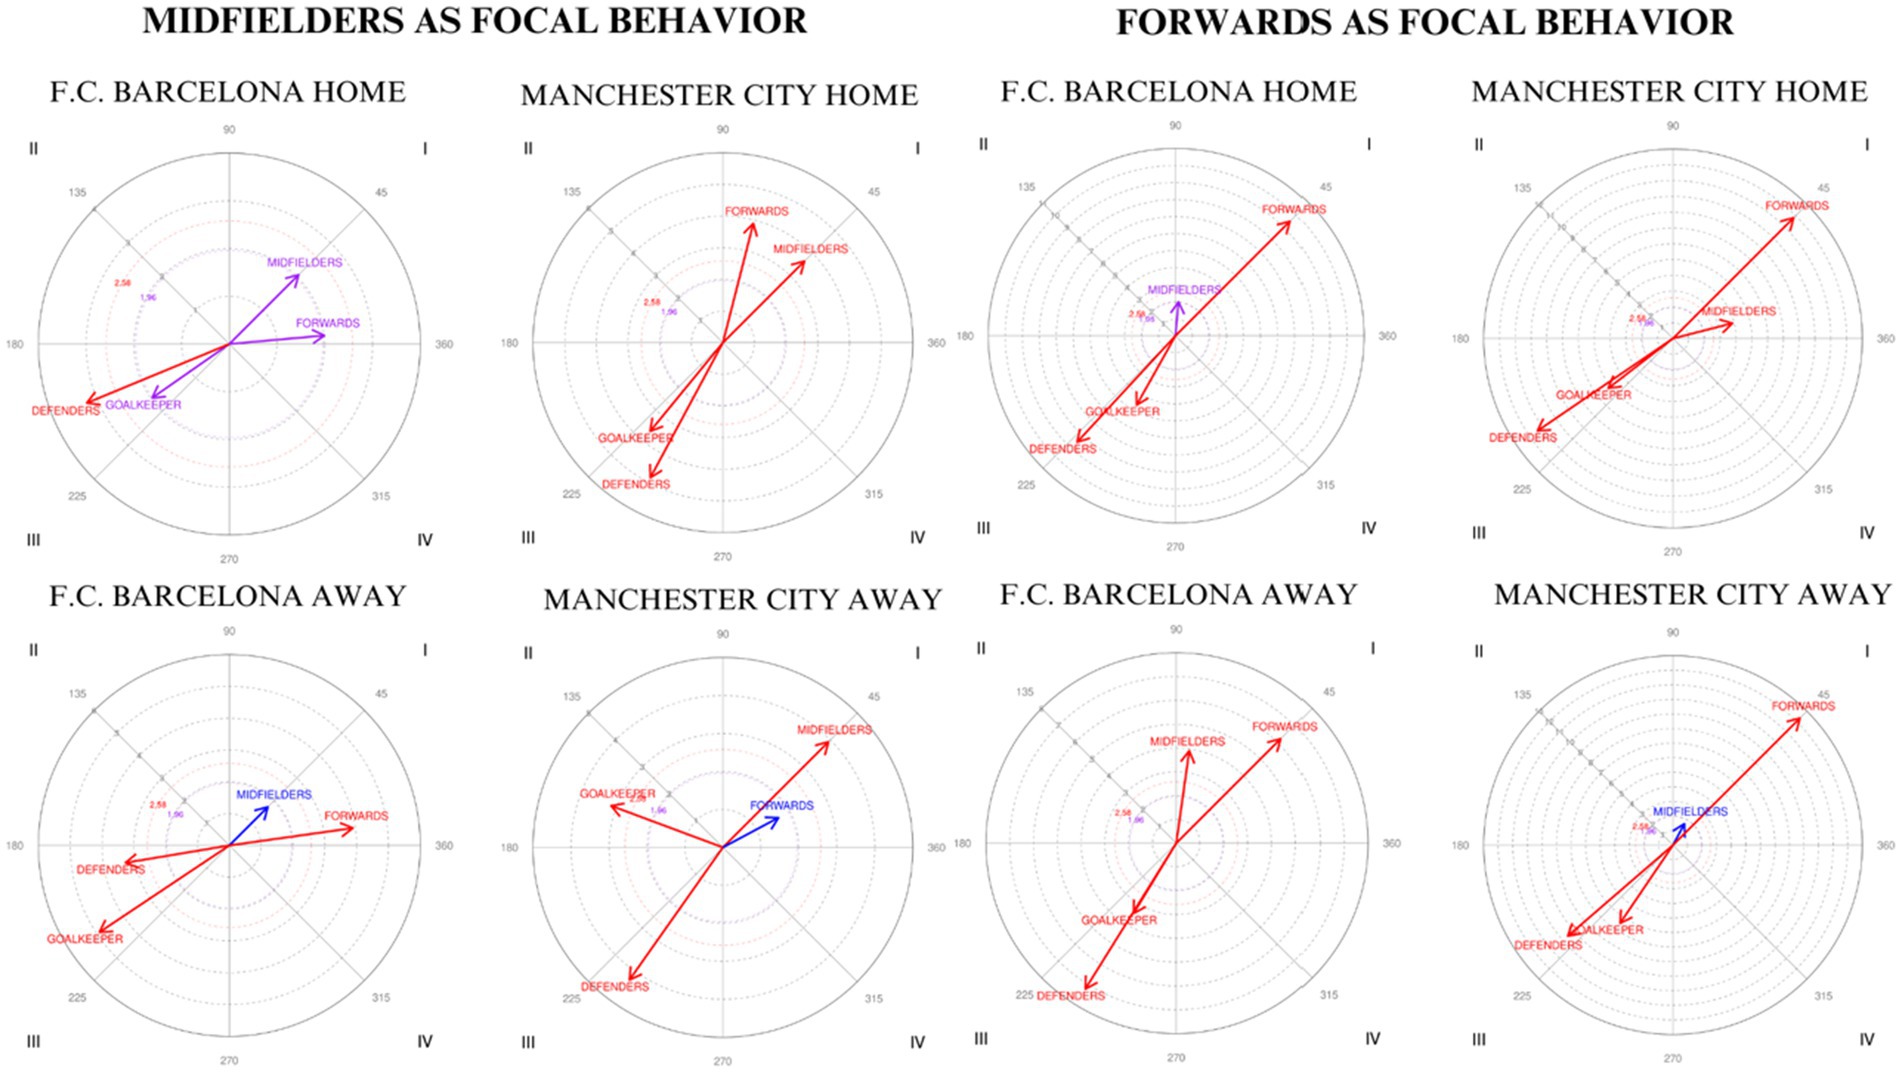
Figure 3. Behavioral map representation establishing the midfielder and forward categories as focal behaviors in relation to the lines structuring the team.
With respect to Manchester City (Table 5 and Figure 3), the categories ‘GK’ and ‘DEF’ are situated in quadrant III, with radii of 3.62 and 4.84 and angles of 230.61° and 241.75°, respectively, when playing at home and radii of 3.14 and 4.27, with angles of 159.58° and 234.81°, respectively, when playing away. The categories ‘MID’ and ‘FW’, in contrast, appear in quadrant I in both locations, with a radius of 3.64 and an angle of 45° for the former, a radius of 3.89 and an angle of 75.69° for the latter at home, and radii of 3.93 and 1.66 with angles of 45° and 28.15°, respectively, when playing away.
In the fourth and final segment of the study, the forwards (FW) category was adopted as the focal behavior to analyze its interaction with the other team lines along with itself: ‘GK’, ‘DEF’, ‘MID’, and ‘FW’. This approach aims to explore the tactical predisposition of the forward line in relation to the other positions that compose the team’s structure throughout the match.
In the case of F.C. Barcelona, as represented in Table 4 and Figure 3, the categories ‘GK’ and ‘DEF’ are located in quadrant III both at home and away. This finding indicates that focal behavior, represented by the forwards, inhibits the presence of conditioned behavior in both the prospective and retrospective planes. The specific values reflect radius lengths of 4.66 and 8.51 and angles of 240.71° and 227.22°, respectively, when playing at home and 3.45 and 7.22 with angles of 238.74° and 238.04°, respectively, when playing away. On the other hand, the categories ‘MID’ and ‘FW’ are found in quadrant I, which means that the focal behavior activates the presence of the conditioned behavior in both planes. With respect to the midfield line, values of 2 in length and an angle of 84.88° are observed, whereas for the forwards, the values are 9.51 in length and 45° in angle at home. Conversely, when playing as visitors, the radii are 3.92 and 6.2, with angles of 81.99° and 45°, respectively, for these two conditioned categories.
Regarding Manchester City, the categories ‘GK’ and ‘DEF’ are also positioned in quadrant III, with radius lengths of 5.18 and 10.4 and angles of 217.53° and 214.27° when playing at home and radii of 6.48 and 9.55 with angles of 235.86° and 220.84°, respectively, when playing away. Moreover, the categories ‘MID’ and ‘FW’ are located in quadrant I, with radius lengths of 3.89 and 10.81, angles of 14.31° and 45° at home, and lengths of 1.66 and 12.33 along with angles of 61.85° and 45° when playing away from their own stadium.
4 Discussion
The objective of the present research is to determine whether the playing style developed by teams coached by Pep Guardiola remains stable regardless of the match location or if it is influenced by contextual variables that alter its game dynamics. The study reveals notable differences in the playing methodology of F.C. Barcelona and Manchester City under Guardiola’s leadership: the Spanish team’s playing style appears to be stable despite changes in setting, whereas the English team’s tactics show significant adaptability depending on whether they play at home or away.
With respect to the descriptive results, Manchester City’s evaluated parameters exhibit significant variations on the basis of match location, in stark contrast to F.C. Barcelona, whose comparative analysis shows remarkable consistency, except in the aspect of shots on goal, where a significant difference is identified. The variability in the playing styles between both teams can be attributed to multiple factors.
Initially, it was worth highlighting the divergence in the rosters of both clubs. F.C. Barcelona, during a period when its playing style and dominance were the subject of extensive academic analysis (Buldú et al., 2019; Chassy, 2013), had players ranked among the best in European football, whose skills have been the subject of various investigations (Castañer et al., 2016; Lapresa et al., 2020; Maneiro et al., 2019). These teams have already been studied in previous research (Pueyo et al., 2024), confirming the difference in playing style between the two teams. On the other hand, considering the competitive context of each team is essential. Spain’s Primera División is distinguished by more combinative play and prolonged ball possession (González-Rodenas et al., 2023), while the English Premier League leans toward a more direct and vertical style, influenced by the intense pressing that characterizes teams in this league (Mitrotasios et al., 2019). The differences between these competitions have been extensively examined in the literature (Cooper and Pulling, 2020; Nagy et al., 2023), providing a basis for understanding the discrepancies in the methods used by teams participating in both competitions.
Moreover, the idea that playing at home confers an advantage in football is well accepted in the literature, with evident differences in the number of goals scored, the effectiveness of technical actions, and the probability of victory at the end of the match (Almeida et al., 2014; Diana et al., 2017; Sarmento et al., 2014). In the case of F.C. Barcelona, indicators of success in actions performed, the elaboration of plays, as well as their density and duration, maintain notable consistency both in matches at their stadium and those played away. In contrast, Manchester City’s analysis reveals a significant increase in the effectiveness, elaboration, density, and durability of plays when they compete on their own ground. This pattern suggests that playing at home enhances the team’s ability to generate more complex and sustained sequences of play that culminate more successfully. Additionally, the last parameter examined, referring to the percentage of offensive flow generated, corroborates that both teams, when playing at home, increase their ability to finish play, which is essential for achieving the ultimate goal in football: scoring.
The exploration of interline relationships through polar coordinate analysis -a technique previously applied in this context (Maneiro et al., 2018) corroborates the observed trends. A notable consistency is highlighted in the defensive line of both teams, which, despite experiencing variations in intensity, maintains a uniform vectorial distribution, suggesting that the function of these players with the ball remains unaltered, regardless of match location. However, a more detailed examination of the other lines constituting the teams reveals significant contrasts, especially in Manchester City. This analysis reveals that, in away game situations, the team’s goalkeeper establishes connections with midfielders predominantly in quadrant IV, unlike quadrant III, which is observed when playing at home, where their relationships are mutually inhibited. This condition may indicate that, under high-pressure situations, the goalkeeper plays with the midfield line that drops back to receive the ball or opts to bypass the defensive line, facilitating forward ball movement through direct links with midfielders as a strategy to overcome opposing pressure lines.
Focusing on the midfield line, similar vectorial trends are observed in F.C. Barcelona, whereas notable differences are detected in Manchester City. The midfielders of the Catalan team maintain interactions mainly with their own midfield line and with the forwards, showing a greater preference for the latter in away matches, suggesting a tendency toward greater verticality in play. In contrast, the English team, although exhibiting behavior similar to that of F.C. Barcelona in home matches, shows a different relationship when playing away, with the goalkeeper positioning in quadrant II, reflecting the reception of the ball directly from the goalkeeper as a tactical resource. Although there is a tendency toward interaction with the forward line in quadrant I, it does not reach statistical significance, indicating that, while present, the relationship between these two lines is not predominantly strong.
Regarding the forward line as the focal behavior, the vectors consistently occupy the same quadrants under all circumstances, differing only in the intensity of their interactions. The relationship between forwards and midfielders, situated in quadrant I, reflects mutual excitation with the focal behavior. However, the intensity of this interaction with F.C. Barcelona’s midfielders in home matches, although significant, is less pronounced than that in away matches. In contrast, Manchester City demonstrates significant connections both with forwards and midfielders in quadrant I and with defenders and the goalkeeper in quadrant III in home matches. However, in away game contexts, the significant relationship with the midfielders diminishes, with the interaction among forwards predominating when they are in possession of the ball.
The study is not without limitations in adequately contextualizing the findings. One relates to the sample size employed. The analysis focused on ten matches of each team, played against the top teams in their respective competitions, suggesting that the results obtained should be interpreted with caution and considered preliminary until they can be complemented and validated by future studies with larger samples against rivals of various standings and in different competitions, thereby expanding the scope of analysis and corroborating the observed findings. Additionally, this study did not explicitly examine the impact that the opponent team’s behavior, particularly their ball pressure at each moment, may have on the playing style. Lastly, this manuscript lacks other analyses that could have been of interest, such as T-Patterns (Pic and Jonsson, 2021), which might have yielded clearer results regarding the objective of the study. Future research may focus on exploring how the location and characteristics of different competitions affect teams’ tactical approaches, as well as comparing the strategies adopted by Pep Guardiola with those of other coaches of similar styles to assess adaptability in different contexts.
5 Conclusion
The aim of this research was to analyze the variations in the playing styles of two teams coached by Pep Guardiola to determine differences in their performance on the basis of whether they played their matches at home or away. The results indicate that F.C. Barcelona’s playing methodology remains consistent, highlighting greater completion of plays in their own stadium and notable stability in the interrelations among the various positional lines that compose their formation, regardless of match location. In contrast, Manchester City shows significant variability in all evaluated aspects, offering a higher percentage of success in their actions, as well as more elaborate, dense, and prolonged offensive sequences when playing at home. Furthermore, with the exception of the defensive line, the other positional lines of the team show variations in their interrelations depending on the match location. Therefore, the coach under study does not always maintain a singular playing style, and, depending on different competitive variables—such as the type of competition, the squad, or match location—it becomes necessary to adapt the playing style to the demands of the situation.
The practical applications arising from this study involve equipping teams with tactical alternatives on the basis of the match context. Playing at home or away can constitute a contextual factor that affects the development and style of play; therefore, preparing players to confront these performance constraints will be important for increasing the chances of victory.
Data availability statement
The raw data supporting the conclusions of this article will be made available by the authors, without undue reservation.
Ethics statement
Ethical review and approval was not required for the study on human participants in accordance with the local legislation and institutional requirements. Written informed consent from the patients/participants or patients/participants’ legal guardian/next of kin was not required to participate in this study in accordance with the national legislation and the institutional requirements.
Author contributions
LP: Conceptualization, Data curation, Formal analysis, Investigation, Methodology, Writing – original draft, Writing – review & editing. VM: Conceptualization, Investigation, Visualization, Writing – review & editing. JÁ: Conceptualization, Project administration, Supervision, Validation, Writing – review & editing. AS: Supervision, Writing – review & editing. MA: Conceptualization, Data curation, Formal analysis, Investigation, Methodology, Writing – original draft, Writing – review & editing.
Funding
The author(s) declare financial support was received for the research, authorship, and/or publication of this article. This research was funded by a grant from the Government of Aragón (Grant Number S25_23R).
Conflict of interest
The authors declare that the research was conducted in the absence of any commercial or financial relationships that could be construed as a potential conflict of interest.
Generative AI statement
The author(s) declare that Gen AI was used in the creation of this manuscript. To improve the structure and clarity of the text.
Publisher’s note
All claims expressed in this article are solely those of the authors and do not necessarily represent those of their affiliated organizations, or those of the publisher, the editors and the reviewers. Any product that may be evaluated in this article, or claim that may be made by its manufacturer, is not guaranteed or endorsed by the publisher.
References
Almeida, C. H., Ferreira, A. P., and Volossovitch, A. (2014). Effects of match location, match status and quality of opposition on regaining possession in UEFA champions league. J. Hum. Kinet. 41, 203–214. doi: 10.2478/hukin-2014-0048
Álvarez Medina, J., Murillo Lorente, V., Ramírez San José, J., and Amatria Jiménez, M. (2020). Momentos críticos del partido en las mejores ligas europeas de fútbol sala [Critical moments of the match in the best European futsal leagues]. Retos, 38, 77–82. doi: 10.47197/retos.v38i38.73001
Amatria, M., Maneiro, R., and Anguera, M. T. (2019). Analysis of the success of the Spanish national football team in the UEFA euro 2012. Apunts Educación Física y Deportes 137, 85–102. doi: 10.5672/apunts.2014-0983.es.(2019/3).137.07
Amatria, M., Maneiro, R., Casal, C. A., Papadopoulou, S., Sarmento, H., Ardá, A., et al. (2021). Differences in Technical Development and Playing Space in Three UEFA Champions Leagues. Frontiers in Psychology, 12:695853. doi: 10.3389/fpsyg.2021.695853
Anguera, M. T. (1997). “From prospective patterns in behavior to joins analysis with retrospective perspective” in Colloque sur invitation “Méthodologie Analyse des Interactions Sociales” (Sorbonne, Paris: Université de la Sorbonne).
Anguera, M. T. (2003). “La observación [Observation]” in Evaluación psicológica: Concepto, proceso y aplicación en las áreas del desarrollo y de la inteligencia [Psychological assessment: Concept, process, and application in the areas of development and intelligence]. ed. C. Moreno Rosset (Madrid: Sanz y Torres), 271–308.
Anguera, M. T., Blanco, A., Hernández, A., and Losada, J. L. (2011). Diseños observacionales: Ajuste y aplicación en psicología del deporte [Observational designs: Adjustment and application in sport psychology]. Cuadernos de Psicología del Deporte 11, 63–76.
Anguera, M. T., Blanco-Villaseñor, Á., Losada, J. L., and Sánchez-Algarra, P. (2020). Integración de elementos cualitativos y cuantitativos en metodología observacional [Integration of qualitative and quantitative elements in observational methodology]. Ámbitos Revista Internacional de Comunicación 49, 49–70. doi: 10.12795/Ambitos.2020.i49.04
Anguera, M. T., Camerino, O., Castañer, M., Sánchez-Algarra, P., and Onwuegbuzie, A. J. (2017). The specificity of observational studies in physical activity and sports sciences: moving forward in mixed methods research and proposals for achieving quantitative and qualitative symmetry. Front. Psychol. 8:2196. doi: 10.3389/fpsyg.2017.02196
Anguera, M. T., and Hernández-Mendo, A. (2013). La metodología observacional en el ámbito del deporte [Observational methodology in the field of sport]. E-balonmano.com. Revista de Ciencias del Deporte 9, 135–160.
Anguera, M. T., and Hernández-Mendo, A. (2015). Data analysis techniques in observational studies in sport sciences. Cuadernos de Psicología del Deporte 15, 13–30. doi: 10.4321/S1578-84232015000100002
Arana, J., Lapresa, D., Anguera, M. T., and Garzón, B. (2016). Ad hoc procedure for optimising agreement between observational records. Anales de Psicología 32, 589–595. doi: 10.6018/analesps.32.2.213551
Arroyo, R., Alsasua, R., Arana, J., Lapresa, D., and Anguera, M. T. (2023). Match analysis in wheelchair basketball: an observational analysis of the best team in the world (USA) in the 2020 Paralympic games. Int. J. Sports Sci. Coach. 19, 1112–1122. doi: 10.1177/17479541231181616
Bakeman, R. (1978). “Untangling streams of behavior: sequential analysis of observational data” in Observing behavior. Data collection and analysis. ed. G. P. Sackett, vol. 2 (Baltimore: University Park Press), 63–78.
Bakeman, R., and Quera, V. (2011). Sequential analysis and observational methods for the behavioral sciences. Cambridge: Cambridge University Press.
Barreira, D., Garganta, J., Castellano, J., Machado, J., and Anguera, M. T. (2015). How elite-level soccer dynamics has evolved over the last three decades: input from generalizability theory. Cuadernos de Psicología del Deporte 15, 51–62. doi: 10.4321/S1578-84232015000100005
Bošnjak, S. (2001). The Declaration of Helsinki: The cornerstone of research ethics. Archives of Oncology, 9, 179–184.
Brito de Souza, D., López-Del Campo, R., Blanco-Pita, H., Resta, R., and Del Coso, J. (2019). An extensive comparative analysis of successful and unsuccessful football teams in LaLiga. Front. Psychol. 10:2566. doi: 10.3389/fpsyg.2019.02566
Buldú, J. M., Busquets, J., Echegoyen, I., and Seirullo, F. (2019). Defining a historic football team: using network science to analyze Guardiola’s F.C. Barcelona. Sci. Rep. 9, 1–14. doi: 10.1038/s41598-019-49969-2
Castañer, M., Barreira, D., Camerino, O., Anguera, M. T., Cantón, A., and Hileno, R. (2016). Goal scoring in soccer: a polar coordinate analysis of motor skills used by Lionel Messi. Front. Psychol. 7:806. doi: 10.3389/fpsyg.2016.00806
Castañer, M., Camerino, O., and Anguera, M. T. (2013). Mixed methods in the research of sciences of physical activity and sport. Apunts Educación Física y Deportes 112, 31–36. doi: 10.5672/apunts.2014-0983.es.(2013/2).112.01
Castellano, J., Álvarez, D., Figueira, B., Coutinho, D., and Sampaio, J. (2013). Identifying the effects from the quality of opposition in a football team positioning strategy. Int. J. Perform. Anal. Sport 13, 822–832. doi: 10.1080/24748668.2013.11868691
Castellano, J., and Pic, M. (2019). Identification and preference of game styles in LaLiga associated with match outcomes. Int. J. Environ. Res. Public Health 16:5090. doi: 10.3390/ijerph16245090
Chassy, P. (2013). Team play in football: how science supports F.C. Barcelona’s training strategy. Psychology 4, 7–12. doi: 10.4236/psych.2013.49A2002
Cochran, W. G. (1954). Some methods for strengthening the common χ2 tests. Biometrics 10, 417–451. doi: 10.2307/3001616
Cohen, J. (1960). A coefficient of agreement for nominal scales. Educ. Psychol. Meas. 20, 37–46. doi: 10.1177/001316446002000104
Cooper, D., and Pulling, C. (2020). The impact of ball recovery type, location of ball recovery and duration of possession on the outcomes of possessions in the English premier league and the Spanish La Liga. Sci. Med. Footb. 4, 196–202. doi: 10.1080/24733938.2020.1722319
Diana, B., Zurloni, V., Elia, M., Cavalera, C. M., Jonsson, G. K., and Anguera, M. T. (2017). How game location affects soccer performance: T-pattern analysis of attack actions in home and away matches. Front. Psychol. 8:1415. doi: 10.3389/fpsyg.2017.01415
Fernández-Navarro, J., Fradua, L., Zubillaga, A., Ford, P. R., and McRobert, A. P. (2016). Attacking and defensive styles of play in soccer: analysis of Spanish and English elite teams. J. Sports Sci. 34, 2195–2204. doi: 10.1080/02640414.2016.1169309
Fernández-Navarro, J., Fradua, L., Zubillaga, A., and McRobert, A. P. (2018). Influence of contextual variables on styles of play in soccer. Int. J. Perform. Anal. Sport 18, 423–436. doi: 10.1080/24748668.2018.1479925
Gabin, B., Camerino, O., Anguera, M. T., and Castañer, M. (2012). Lince: multiplatform sport analysis software. Procedia. Soc. Behav. Sci. 46, 4692–4694. doi: 10.1016/j.sbspro.2012.06.320
González-Rodenas, J., Aranda, R., and Aranda-Malavés, R. (2021). The effect of contextual variables on the attacking style of play in professional soccer. J. Hum. Sport Exerc. 16, 399–410. doi: 10.14198/jhse.2021.162.14
González-Rodenas, J., Ferrandis, J., Moreno-Pérez, V., López-Del Campo, R., Resta, R., and Del Coso, J. (2023). Differences in playing style and technical performance according to the team ranking in the Spanish football LaLiga: a thirteen seasons study. PLoS One 18:e0293095. doi: 10.1371/journal.pone.0293095
González-Rodenas, J., López-Bondia, I., Aranda-Malavés, R., Tárrega, A., Sanz-Ramírez, E., and Aranda, R. (2020). Technical, tactical and spatial indicators related to goal scoring in European elite soccer. J. Hum. Sport Exerc. 15, 186–201. doi: 10.14198/jhse.2020.151.17
Gouveia, V., Duarte, J. P., Nóbrega, A., Sarmento, H., Pimenta, E., Domingos, F., et al. (2023). Notational analysis on goal scoring and comparison in two of the most important soccer leagues: Spanish La Liga and English premier league. Appl. Sci. 13:6903. doi: 10.3390/app13126903
Hernández-Mendo, A., Castellano, J., Camerino, O., Jonsson, G. K., Blanco-Villaseñor, Á., Lopes, A., et al. (2014). Observational software, data quality control and data analysis. Revista de Psicología del Deporte 23, 111–121.
Hernández-Mendo, A., López López, J. A., Castellano Paulis, J., Morales Sánchez, V., and Brincones Pastrana, J. L. (2012). HOISAN 1.2: Programa informático Para uso en metodología observacional [HOISAN 1.2: software for use in observational methodology]. Cuadernos de Psicología del Deporte 12, 55–78. doi: 10.4321/S1578-84232012000100006
Hewitt, A., Greenham, G., and Norton, K. (2016). Game style in soccer: what is it and can we quantify it? Int. J. Perform. Anal. Sport 16, 355–372. doi: 10.1080/24748668.2016.11868892
Immler, S., Rappelsberger, P., Baca, A., and Exel, J. (2021). Guardiola, Klopp, and Pochettino: the purveyors of what? The use of passing network analysis to identify and compare coaching styles in professional football. Front. Sports Active Living 3:725554. doi: 10.3389/fspor.2021.725554
Kong, L., Zhang, T., Zhou, C., Gómez, M. A., Hu, Y., and Zhang, S. (2022). The evaluation of playing styles integrating with contextual variables in professional soccer. Front. Psychol. 13:1002566. doi: 10.3389/fpsyg.2022.1002566
Lago-Peñas, C., and Lago-Ballesteros, J. (2011). Game location and team quality effects on performance profiles in professional soccer. J. Sports Sci. Med. 10, 465–471
Landis, J. R., and Koch, G. G. (1977). The measurement of observer agreement for categorical data. Biometrics 33, 159–174. doi: 10.2307/2529310
Lapresa, D., Blanco, F., Amatria, M., Arana, J., and Anguera, M. T. (2020). Observational analysis of the execution of the “control” core technical/tactical concept by Sergio Busquets. Apunts Educación Física y Deportes 140, 52–62. doi: 10.5672/apunts.2014-0983.es.(2020/2).140.08
Losada, J. L., and Manolov, R. (2015). The process of basic training, applied training, maintaining the performance of an observer. Qual. Quant. 49, 339–347. doi: 10.1007/s11135-014-9989-7
Maneiro, R., and Amatria, M. (2018). Polar coordinate analysis of relationships with teammates, areas of the pitch, and dynamic play in soccer: a study of Xabi Alonso. Front. Psychol. 9:389. doi: 10.3389/fpsyg.2018.00389
Maneiro, R., Amatria, M., and Anguera, M. T. (2019). Dynamics of Xavi Hernández’s game: a vectorial study through polar coordinate analysis. Proc. Inst. Mechan. Eng. Part P 233, 389–401. doi: 10.1177/1754337119830472
Maneiro, R., Amatria, M., Moral, J. E., and López, S. (2018). Observational analysis of the interline relationships of the Spanish soccer team using polar coordinates. Cuadernos de Psicología del Deporte 18, 18–32. doi: 10.6018/cpd.340671
Mićović, B., Leontijević, B., Dopsaj, M., Janković, A., Milanović, Z., and Garcia Ramos, A. (2023). The Qatar 2022 World Cup warm-up: Football goal-scoring evolution in the last 14 FIFA World Cups (1966–2018). Front. Psychol. 13:954876. doi: 10.3389/fpsyg.2022.954876
Mitrotasios, M., González-Rodenas, J., Armatas, V., and Aranda, R. (2019). The creation of goal scoring opportunities in professional soccer: tactical differences between Spanish La Liga, English premier league, German Bundesliga and Italian Serie A. Int. J. Perform. Anal. Sport 19, 452–465. doi: 10.1080/24748668.2019.1618568
National Commission for the Protection of Human Subjects of Biomedical and Behavioral Research. (1979). The Belmont Report: Ethical principles and guidelines for the protection of human subjects of research. United States Department of Health, Education, and Welfare. Available at: https://www.hhs.gov/ohrp/regulations-and-policy/belmont-report/index.html
Nagy, K., Bács, B. A., and Bába, É. B. (2023). A comparative study of the competitive balance of the Spanish and English top football leagues on the basis of sport performance during the four last seasons before the COVID-19 pandemic. Int. Rev. Appl. Sci. Eng. 14, 293–301. doi: 10.1556/1848.2022.00590
Otzen, T., and Manterola, C. (2017). Sampling techniques on a population study. Int. J. Morphol. 35, 227–232. doi: 10.4067/S0717-95022017000100037
Pic, M. (2018). Temporal consistencies in two champion teams of European football? Retos 34, 94–99. doi: 10.47197/retos.v0i34.58805
Pic, M., and Jonsson, G. K. (2021). Professional boxing analysis with T-patterns. Physiol. Behav. 232:113329. doi: 10.1016/j.physbeh.2021.113329
Pueyo, L., Murillo, V., Álvarez, J., and Amatria, M. (2024). Analysis of the playing style of two teams coached by ‘pep’ Guardiola. Retos 56, 179–187. doi: 10.47197/retos.v56.104182
Sackett, G. P. (1980). “Lag sequential analysis as a data reduction technique in social interaction research” in Exceptional infant: psychosocial risks in infant-environment transactions. eds. D. B. Sawin, L. O. Walker, K. H. Penticuff, and M. H. Hockenberry, vol. 4 (New York: Brunner/Mazel), 300–340.
Sarmento, H., Marcelino, R., Anguera, M. T., Campaniço, J., Matos, N., and Leitão, J. C. (2014). Match analysis in football: a systematic review. J. Sports Sci. 32, 1831–1843. doi: 10.1080/02640414.2014.898852
Tenga, A., Kanstad, D., Ronglan, L. T., and Bahr, R. (2009). Developing a new method for team match performance analysis in professional soccer and testing its reliability. Int. J. Perform. Anal. Sport 9, 8–25. doi: 10.1080/24748668.2009.11868461
Tenga, A., and Sigmundstad, E. (2011). Characteristics of goal-scoring possessions in open play: comparing the top, in-between and bottom teams from professional soccer league. Int. J. Perform. Anal. Sport 11, 545–552. doi: 10.1080/24748668.2011.11868572
Tyebkhan, G. (2003). Declaration of Helsinki: The ethical cornerstone of human clinical research. Indian J Dermatol Venereol Leprol, 69, 245–247.
Wallace, J. L., and Norton, K. I. (2014). Evolution of world cup soccer final games 1966–2010: game structure, speed and play patterns. J. Sci. Med. Sport 17, 223–228. doi: 10.1016/j.jsams.2013.03.016
World Medical Association. (2021). WMA Declaration of Helsinki: Ethical principles for medical research involving human subjects. Available at: https://www.wma.net/policies-post/wma-declaration-of-helsinki-ethical-principles-for-medical-research-involving-human-subjects/
Keywords: football, performance analysis, observational methodology, polar coordinates, team sport, playing style
Citation: Pueyo L, Murillo V, Álvarez J, Sarmiento A and Amatria M (2024) Effect of match location on the playing style of teams coached by ‘Pep’ Guardiola. Front. Psychol. 15:1502199. doi: 10.3389/fpsyg.2024.1502199
Edited by:
Yixiong Cui, Beijing Sport University, ChinaCopyright © 2024 Pueyo, Murillo, Álvarez, Sarmiento and Amatria. This is an open-access article distributed under the terms of the Creative Commons Attribution License (CC BY). The use, distribution or reproduction in other forums is permitted, provided the original author(s) and the copyright owner(s) are credited and that the original publication in this journal is cited, in accordance with accepted academic practice. No use, distribution or reproduction is permitted which does not comply with these terms.
*Correspondence: Luis Pueyo, bHB1ZXlvQHVuaXphci5lcw==