 Leo Van Hove
- FIRE Research Group and Department of Applied Economics (APEC), Vrije Universiteit Brussel, Brussels, Belgium
A Commentary on
Family life in lockdown
by Biroli, P., Bosworth, S., Della Giusta, M., Di Girolamo, A., Jaworska, S., and Vollen, J. (2021). Front. Psychol. 12:687570. doi: 10.3389/fpsyg.2021.687570
1 Introduction
Biroli et al. (2021) analyze how COVID-19 lockdowns affected patterns of activity within households in Italy, the UK, and the US. They do so based on data from self-administered surveys among adults who indicated that they were cohabiting with their partner. Biroli et al. find that sharing of most duties increased, in particular for childcare.
As the authors report on their results in terms of which gender does more, or less, of a certain task, the reader gets the impression that their samples consist solely of different-sex couples. However, upon analyzing the questionnaire and inquiring with the authors, it became clear that they only asked respondents about their own gender. In the analysis, the authors simply attributed the opposite gender to the partner.
Biroli et al. thus risk having the gender of partners wrong, as their samples may contain same-sex couples. Given that 5.6% of US adults identified as lesbian, gay, bisexual or transgender (LGBT) in 2020 (Gallup, 2021a), at first sight the potential bias resulting from not filtering out same-sex couples would seem substantial. Below I try to come up with more precise estimates. But first I briefly discuss the set-up of Biroli et al.'s research.
2 Biroli et al.'s data collection
Biroli et al. ran their surveys in April 2020, during the first COVID-19 wave. For the surveys in the UK and the US, they used an online tool that stratifies samples across age, sex, and ethnicity. The Italian sample is less representative, as participants were recruited mainly through social media.
Crucially, only one member of each couple filled out the questionnaire (Biroli et al., 2021, p. 4, footnote 10), and reported both about their own situation as well as that of their partner. The problem is that, as indicated in the Introduction, respondents were not asked about their partner's gender. This was confirmed to me by the corresponding author, who explained that when they did the analysis, they attributed the opposite gender to the respondent's partner.
3 The resulting bias
This said, on closer scrutiny, it would appear that the bias resulting from the inclusion of same-sex couples is, all in all, limited. To start with the US, as mentioned, according to Gallup data based on more than 15,000 interviews, 5.6% of US adults (aged 18 and older) identified as LGBT in 2020 (Gallup, 2021a). This tallies almost perfectly with the 5.5% estimate proffered by the Williams Institute for 2020–2021 (Flores and Conron, 2023, p. 1).
As can be seen in Table 1, of the LGBT individuals in the Gallup data 16.7% were married to a same-sex spouse or were living with a same-sex partner. Hence, Biroli et al.'s approach risks getting the gender of the respondent's partner wrong in (only) 0.94% of their US households.
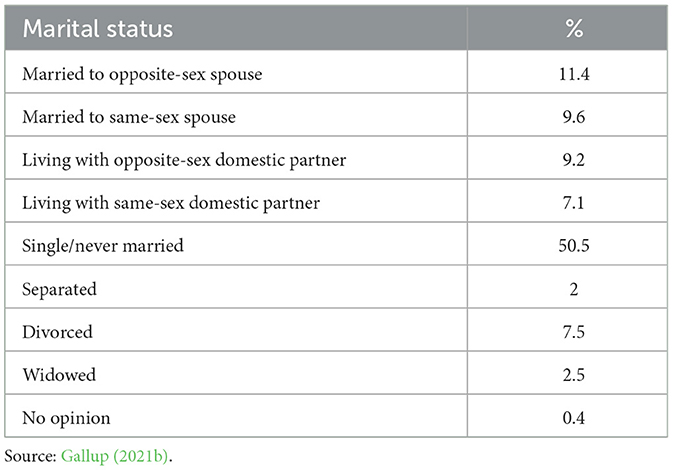
Table 1. Marital status of US LGBT adults.
However, one could argue that since Biroli et al. (2021, p. 1) refer to “gendered patterns of intra-household cooperation norms,” they should have concentrated fully on heterosexual couples. In other words, it could be argued that they should also have left out of their analysis LGBT individuals who are living with an opposite-sex partner (as is the case for a fair share of bisexuals). Indeed, gender norms might be more flexible in such couples. From this perspective, the share of US couples that are potentially problematic amounts to 2.09%—if Biroli et al.'s sample is representative of the general population (the sum of the first four categories in Table 1 is 37.3%; to be multiplied by 5.6%.).
For the UK, the available statistics are less detailed. According to the Annual Population Survey 2020, overall 3.1% of the population aged 16 years and over identified as lesbian, gay or bisexual in 2020 (Office of National Statistics, 2022). An additional 0.7% indicated “other” (Office of National Statistics, 2023a).
The data also show that 23.7% of LGB individuals were either married or in a civil partnership. Adding the “other” category increases the share to 24.6%. Unfortunately, the survey does not contain data on LGB(T) individuals who are cohabiting with a same-sex partner without being married or being in a civil partnership. Hence, when it comes to the measurement error in Biroli et al.'s assessment of the gender of the partners of their UK respondents, one can calculate only a lower limit; namely 0.73%−0.92% (23.7% times 3.1%−24.6% times 2.7%).
The Census 2021 for England and Wales (Office of National Statistics, 2023b) does specify how many individuals are cohabiting with a same-sex partner without being married or being in a civil partnership. This source (thus) yields a slightly higher estimate than the 0.73% of the Annual Population Survey 2020, namely 1.00% (0.33% married or in a civil partnership + 0.67% cohabiting) [the censuses for Scotland and Northern Ireland do not distinguish between same- and opposite-sex marriages; Scotland's Census, 2023; Northern Ireland Statistics and Research Agency (NISRA), 2023].
Finally, for Italy there would appear to be even fewer statistics (ISTAT, 2022, 2023). But an international survey by IPSOS (2021, p. 9) suggests lower measurement errors: in Italy 6% of adults identified as non-heterosexual in 2021, compared to 10% in the UK and 11% in the US.
4 Conclusion
Upon scrutiny, it would appear that the bias resulting from the non-exclusion of same-sex couples is, all in all, contained. I show that Biroli et al.'s heteronormative approach risks getting the gender of the respondent's partner wrong in 0.94% of their US households, in upwards of 0.73%−1.00% of their UK couples, and in probably a lower proportion of their Italian sample. If one argues that Biroli et al. should have left out of their analysis not only LGBT individuals who are living with a same-sex partner but also those who are cohabiting with a partner of the opposite sex, then the share of US couples that are potentially problematic amounts to 2.09%.
Biases of this magnitude are unlikely to substantially alter Biroli et al.'s conclusions. Still, it is a limitation of the data that readers should be (made) aware of.
Author contributions
LV: Conceptualization, Data curation, Formal analysis, Methodology, Writing – original draft, Writing – review & editing.
Funding
The author(s) declare that no financial support was received for the research and/or publication of this article.
Acknowledgments
I am indebted to Steven Bosworth for answering my questions, and to Lesley Powell of the Office for National Statistics and Eugenia De Rosa of the Instituto Nazionale di Statistica for their help with data for, respectively, the UK and Italy.
Conflict of interest
The author declares that the research was conducted in the absence of any commercial or financial relationships that could be construed as a potential conflict of interest.
Publisher's note
All claims expressed in this article are solely those of the authors and do not necessarily represent those of their affiliated organizations, or those of the publisher, the editors and the reviewers. Any product that may be evaluated in this article, or claim that may be made by its manufacturer, is not guaranteed or endorsed by the publisher.
References
Biroli, P., Bosworth, S., Della Giusta, M., Di Girolamo, A., Jaworska, S., and Vollen, J. (2021). Family life in lockdown. Front. Psychol. 12:687570. doi: 10.3389/fpsyg.2021.687570
Flores, A. R., and Conron, K. J. (2023). Adult LGBT Population in the United States. Los Angeles, CA: Williams Institute, UCLA School of Law.
Gallup (2021a). LGBT Identification Rises to 5.6% in Latest U.S. Estimate. Available online at: https://news.gallup.com/poll/329708/lgbt-identification-rises-latest-estimate.aspx (accessed June 1, 2024).
Gallup (2021b). One in 10 LGBT Americans Married to Same-sex Spouse. Available online at: https://news.gallup.com/poll/329975/one-lgbt-americans-married-sex-spouse.aspx (accessed June 1, 2024).
IPSOS (2021). LGBT+ Pride 2021 Global Survey. Available online at: https://www.ipsos.com/sites/default/files/ct/news/documents/2021-06/LGBT%20Pride%202021%20Global%20Survey%20Report.pdf (accessed June 1, 2024).
ISTAT (2022). ISTAT-UNAR Survey on Labour Discrimination Towards LGBT+ People (in civil Union or Formerly in Union). Year 2020-2021. Available online at: https://www.istat.it/it/files//2022/05/REPORTDISCRIMINAZIONILGBT_2022_en.pdf (accessed June 1, 2024).
ISTAT (2023). L'indagine ISTAT-UNAR Sulle Discriminazioni Lavorative nei Confronti delle Persone LGBT+ (non in unione civile o già in unione). Anno 2022. Available online at: https://www.istat.it/it/files//2023/05/report-discriminazioni-15maggio.pdf (accessed June 1, 2024).
Northern Ireland Statistics and Research Agency (NISRA) (2023). Data from: Census. Available online at: https://www.nisra.gov.uk/statistics/census (accessed June 1, 2024).
Office of National Statistics (2022). Sexual Orientation, UK: 2020. Available online at: https://www.ons.gov.uk/peoplepopulationandcommunity/culturalidentity/sexuality/bulletins/sexualidentityuk/2020 (accessed June 1, 2024).
Office of National Statistics (2023a). Data from: Sexual Orientation, UK. Available online at: https://www.ons.gov.uk/peoplepopulationandcommunity/culturalidentity/sexuality/bulletins/sexualidentityuk/2020 (accessed June 1, 2024).
Office of National Statistics (2023b). Data from: Census. Available online at: https://www.ons.gov.uk/census (accessed June 1, 2024).
Scotland's Census (2023). Data from: Census. Available online at: https://www.scotlandscensus.gov.uk/search-the-census#/ (accessed June 1, 2024).
Keywords: household division of labor, gender, gender identity, LGBT, same-sex couples, lockdown, COVID-19
Citation: Van Hove L (2025) Commentary: Family life in lockdown. Front. Psychol. 16:1454643. doi: 10.3389/fpsyg.2025.1454643
Received: 30 July 2024; Accepted: 04 June 2025;
Published: 19 June 2025.
Edited by:
Sónia Vladimira Correia, Lusofona University, PortugalReviewed by:
Maria Rosa Buxarrais, University of Barcelona, SpainCopyright © 2025 Van Hove. This is an open-access article distributed under the terms of the Creative Commons Attribution License (CC BY). The use, distribution or reproduction in other forums is permitted, provided the original author(s) and the copyright owner(s) are credited and that the original publication in this journal is cited, in accordance with accepted academic practice. No use, distribution or reproduction is permitted which does not comply with these terms.
*Correspondence: Leo Van Hove, TGVvLlZhbi5Ib3ZlQHZ1Yi5iZQ==