Abstract
Introduction:
Ample evidence indicates that assessing children’s early literacy skills is crucial for later academic success. This assessment enables the provision of necessary support and materials while engaging them in the culture of print and books before school entry. However, relatively few assessment tools are available to identify early literacy skills, such as concepts of print, print awareness, phonological awareness, word awareness, alphabet knowledge, and early reading. The digital landscape presents new opportunities to enhance these assessments and provide enriching early literacy experiences. This study examines the psychometric properties of an adaptive assessment tool, EuLeApp©, focusing on its reliability and concurrent validity.
Methods:
Data involved 307 German kindergarten children (Mage = 64 months old, range = 45–91). A Computerized Adaptive Testing (CAT) method, grounded in Item Response Theory (IRT), was employed to develop an adaptive digital tool for assessing early literacy competencies. We utilized an automatic item selection procedure based on item difficulty and discrimination parameters for the 183-item pool to ensure a precise and efficient assessment tailored to each child’s ability level.
Results:
The 4-parameter Logistic (4PL) model was identified as the best-fitting model for adaptive assessment, providing the highest precision in estimating children’s abilities within this framework.
Discussions:
The findings support the idea that the adaptive digital-based assessment tool EuLeApp© can be used to assess early literacy skills. It also provides a foundation for offering individualized and adaptable learning opportunities embedded in daily routines in daycare centers.
1 Introduction
Many studies have highlighted significant differences in reading and writing outcomes between strong and weak readers from early years through high school (Buckingham et al., 2013; McArthur et al., 2020). For instance, in Germany, recent investigations reveal that almost two in five fourth graders score “below basic” in their reading and writing skills, indicating they struggle to read and understand simple texts (European Commission, 2023; McElvany et al., 2023). This finding underscores a broader issue in educational systems worldwide: the failure to identify children at risk of reading difficulties early enough to provide timely and adequate interventions (Adams, 1994; Catts et al., 2001; Justice and Ezell, 2001). This disparity also ties into the dyslexia paradox, where the most effective interventions occur before a child experiences academic failure (Shaywitz, 1998). Addressing this issue requires reliable, efficient, and adaptive diagnostic tools capable of predicting early literacy skills from preschool onward. Such tools would enable educators to detect literacy difficulties early, providing the foundation for timely and targeted interventions (Care et al., 2018; Gonski et al., 2018). This approach also aligns with ecological and sociocultural approaches to assessment, which emphasize a child’s “readiness to learn” and the zone of proximal development, where scaffolding by teachers supports learning from the familiar to the unfamiliar (Vygotsky, 1978). Through these approaches, assessment becomes a means to monitor a child’s progress over time, fostering an adaptive learning environment. The app’s computerized adaptive testing (CAT) framework dynamically adjusts to each child’s ability level, making it possible to identify literacy difficulties, including dyslexia, early on. This approach is critical for reducing the gap between strong and weak readers by tailoring assessments and providing opportunities for interventions to each child’s unique needs, thus preventing the long-term consequences of untreated literacy deficits.
The accurate and timely assessment of early literacy skills is essential for early identification of learning gaps, customizing daily literacy activities, monitoring progress, and making data-driven adjustments to narrow achievement disparities. Thus, this project aimed to develop an adaptive assessment tool and to demonstrate the reliability and concurrent validity of EuLeApp© in a German sample of children aged 4–7 years. The adaptive approach is essential because it allows for precise performance estimates by adjusting the difficulty and number of items based on each child’s ability level (Weiss, 2004). By leveraging CAT, EuLeApp© maximizes both efficiency and accuracy, making it a valuable tool for early literacy assessment. Technology-based solutions, such as the EuLeApp©, hold great potential in this area.
1.1 The importance of individualized assessment of early literacy skills
Early literacy encompasses a range of skills related to oral language, phonological awareness, word awareness, print awareness, concepts of print, alphabet knowledge, and narrative abilities that develop before children formally learn to read and write. Phonological awareness refers to the ability to detect the smallest sound units within words. When children develop this skill, they understand that language can be analyzed and manipulated, a key milestone in their literacy journey toward understanding the concept of words (Gee, 2012; Snow and Dickinson, 1991). Word awareness involves recognizing that words, as elements of language, have properties independent of their meaning. For example, children learn to connect printed words in their oral vocabulary while learning to read. This awareness also includes understanding word boundaries and what constitutes a word (Justice and Ezell, 2001). The term print awareness refers to the knowledge that print carries meaning, and differs structurally from other sign systems (e.g., numbers). To develop print awareness, it is crucial for young children to be exposed to letters and written text in their environment. Familiarity with books and print culture also involves understanding the characteristics of books and how they are read, which relates to concepts of print (Meindl and Jungmann, 2019; Piasta et al., 2012). Alphabet knowledge entails recognizing the characteristics of different graphemes and associating them with their corresponding phonemes. Early reading skills include understanding that words are made up of graphemes (Elimelech and Aram, 2020; Morrow, 2007). Narrative skills reflect children’s ability to produce a fictional or real account of a temporally sequenced experience or event (Engel, 1995). All these aspects represent crucial milestones in the successful development of reading and writing (Justice and Ezell, 2001).
Early literacy tasks such as phonological awareness, print awareness, and word awareness reflect how children process and integrate the relationships between various linguistic rule systems on the metacognitive level. Nagy and Anderson (1995) documented that metalinguistic awareness helps young children to become aware of the structure of their writing system and its relationship to their spoken language. For instance, children with higher metalinguistic awareness perform better on tasks related to concepts of print and phonological awareness, both of which are strong predictors of reading success (Chaney, 1994). Without proper assessments, children in need of additional support may be overlooked, leading to long-term consequences such as ongoing academic difficulties, low self-esteem, and limited future opportunities (Brassard and Boehm, 2007; Justice et al., 2002; OECD, 2013). Screening early literacy skills with standardized assessments has gained significant attention in early childhood for various reasons: (a) to evaluate a child’s strengths and weaknesses in specific areas, (b) to identify key target skills and provide tailored support, (c) to structure educational programs, (d) to monitor children’s progress over time, and (e) to improve educational outcomes by facilitating a smoother transition to school. Assessment tools also offer significant benefits at different stages of assessment, from testing to linking appropriate interventions, by collaborating with children’s parents and other stakeholders to help overcome disadvantages. Despite the benefits of standardized testing, research shows that data-driven decision-making remains significantly underutilized in early education. Children enter kindergarten with a wide range of literacy and language abilities (Catts et al., 2002), making individualized feedback essential (Brassard and Boehm, 2007; McLachlan et al., 2018; Snow and van Hemel, 2008). To address these needs, computerized adaptive testing (CAT) provides an innovative solution for assessing children’s literacy skills. By dynamically adjusting to each child’s ability level, CAT improves measurement precision while reducing the required test items. As a cutting-edge tool, EuLeApp© leverages CAT to streamline the assessment process, ensuring both accuracy and efficiency. This adaptability allows practitioners to deliver individualized feedback, enabling more targeted interventions and improving educational outcomes.
1.2 The importance of innovative assessment tools
Given the ongoing expansion of digital media in educational settings (OECD, 2015) and the demand for more effective assessment methods, researchers have increasingly focused on the potential of digital tools for enhancing educational processes. These tools offer greater efficiency (Marsh et al., 2020) and provide visually engaging reports for tracking learning progress (Neumann et al., 2019). The use of digital assessment tools is increasing for numerous reasons, such as technological portability and ease, the touchscreen’s tremendous potential to reach young children, and the need for mobile, adaptable, and accessible assessment tools (Neumann et al., 2019). Furthermore, online assessment tools have become widespread and are actively used. For example, Ho et al. (2024) developed a short-term online test to assess word reading. This test, which covers a wide age range, is primarily designed for individuals who can read to some degree at a basic level (ages 7 and above). Tablet-based assessments, on the other hand, allow for greater control over the evaluation process for younger children and may be a more suitable alternative. Additionally, app-based assessments offer the advantage of functioning offline, making them more accessible in diverse settings such as homes, preschools, and clinics, where stable internet access is not always available.
App-based assessments can be administered anywhere with a suitable device, making it easier for educators and researchers to assess children in various settings, including homes, classrooms, and clinics. Another benefit of mobile media devices is that they can help advance the goal of reaching many children for educational opportunities and equity because of their low costs and good accessibility (Hirsh-Pasek et al., 2015). Additionally, traditional paper-pencil assessments usually require considerable time, effort, and expertise, such as organizing, rewriting, and preparing children for the test in person (Schildkamp and Kuiper, 2010). Also, some assessment procedures rely on contextual factors such as observation, making it challenging to maintain strict objectivity (Hindman et al., 2020). Moreover, children may not be able to show their best performance when assessed by someone they do not know (Halliday et al., 2018). In contrast, computerized assessments offer the potential to gain insights into children’s responses, such as disengagement, rapid guessing, or unexpected answers (Bulut and Cormier, 2018; Lee and Jia, 2014; Wise and Kong, 2005). Thus, app-based assessments enable teachers to receive prompt feedback, facilitating more effective support and remediation. However, technology-based assessments also raise concerns regarding developmental appropriateness, item development, psychometric validity, and teacher training (Bulut and Cormier, 2018; Neumann et al., 2019). Tablet-based assessments are common in many schools across the United States, where they are used to assess and monitor students’ performance in mathematics, reading, and science throughout the school year (Davey, 2005; Sharkey and Murnane, 2006). Despite the increasing integration of technology in education, the development of digital tools specifically for early literacy assessment remains limited, underscoring the need for further innovation. Emerging research shows that only a few app-based tools are available to assess children’s language and literacy skills in the early years. One such tool is Logometro®, a reliable app-based test that evaluates children’s phonological awareness, listening comprehension, vocabulary, narrative skills, speech, morphological awareness, and pragmatic skills (Antoniou et al., 2022). Administered through a specially developed Android app, Logometro® allows for accurate directional vocalization and easy capture of children’s responses via touchscreens and direct recordings (Antoniou et al., 2022). Another innovative app, QUILS (Golinkoff et al., 2017) focuses on assessing children’s language-learning processes, offering insights into how they acquire new words and grammatical structures. Golinkoff et al. (2017) demonstrated that a technology-based assessment tool measuring children’s phonological awareness and letter knowledge was efficient in terms of time usage and effectively differentiated these skills. One app was also developed by Neumann (2018) to assess children’s letter knowledge and vocabulary using both expressive and receptive response formats. The valuable insights gained from such innovative assessment tools can make them more attractive, accurate, and accessible for educators and parents.
1.3 Computerized adaptive testing (CAT)
Computerized Adaptive Tests (CAT) dynamically adjust to a child’s ability by selecting test items based on their responses. Unlike traditional fixed-form tests, CAT tailors the difficulty of each item to match the child’s performance, selecting more challenging questions after correct answers and easier ones after incorrect responses (Meijer and Nering, 1999; Weiss and Kingsbury, 1984). This individualized approach helps maintain engagement and ensure a more accurate assessment of abilities (Tomasik et al., 2018; Wise, 2014). CAT relies on an Item Response Theory (IRT) calibrated item bank, selecting items sequentially to estimate a child’s ability (θ) more precisely with fewer items than conventional tests (Chalmers, 2015; Keuning and Verhoeven, 2008). The efficiency of CAT is enhanced by large item banks, allowing the test to adapt to individual performance effectively (Nelson et al., 2017). IRT provides a robust framework for interpreting test scores, as it allows for accurate item selection and predicts the likelihood that a child will respond correctly based on their skill level (Bjorner et al., 2007; Baker, 2001). One key advantage of IRT is that item parameters remain stable across different samples, meaning they are not dependent on the specific group being tested (Magis and Barrada, 2017). Additionally, IRT offers a precision measure or standard error for each skill estimate (He and Min, 2017), providing insight into the accuracy of the assessment across varying levels of ability (Weiss, 1982).
1.4 Present study
The quality of assessment tools is important for educators to understand what children are expected to learn before formal school readiness. A primary aim of the current study is to adapt a digital assessment tool from the paper-pencil-based EuLe 4–5 assessment (Meindl and Jungmann, 2019), a standardized tool designed to assess narrative and early literacy skills in German children aged 4;0 to 5;11 years. Based on this goal, the study also aims to validate the EuLeApp© as a digital, adaptive assessment tool for children aged between 4;0 and 7;11 years. For this, a Multidimensional Computerized Adaptive Test (MCAT) was used based on Item Response Theory (IRT), allowing for individualized and precise measurement of children’s early literacy skills across multiple dimensions. An item pool was constructed through calibration based on the content of the items, and model fit was estimated and established using an IRT model.
These research questions will be addressed as follows:
Does the EuLeApp© screening tool accurately assess early literacy skills in children aged 4 to 7 years?
How can item response theory (IRT) be used to optimize item difficulty in computerized adaptive testing (CAT) for assessing children’s early literacy skills?
2 Materials and method
2.1 Sample
The sample consisted of N = 307 kindergarten children (Mage = 64 months, range = 45–91) before entering formal schooling in Mecklenburg-West Pomerania and Lower Saxony in Germany. The sample distribution of boys (n = 170, 55.4%) and girls (n = 137, 44.6%) was approximately equal. In terms of the distribution of children’s ages, 31.3% were 4 years old, 47.2% were 5 years old, 13.0% were 6 years old, and 8.5% were 7 years old. Data were primarily collected from kindergartens in middle- and high-socioeconomic regions. All parents were informed about the study, and written consent was obtained. Table 1 provides an overview of the participant demographics, including age distribution, gender, and other key characteristics.
Table 1
| Variable | Category | N | Frequency (%) |
|---|---|---|---|
| State | Mecklenburg-West Pomerania | 171 | 55.7 |
| Lower Saxony | 136 | 44.3 | |
| Gender | Boys | 170 | 55.4 |
| Girls | 137 | 44.6 | |
| Age group | 4 years | 96 | 31.3 |
| 5 years | 145 | 47.2 | |
| 6 years | 40 | 13.0 | |
| 7 years | 26 | 8.5 | |
| Parental education | Secondary education | 123 | 40.1 |
| Vocational training | 53 | 17.3 | |
| Higher education | 131 | 42.6 | |
| Linguistic diversity | Monolingual (German) | 253 | 82.4 |
| Bilingual | 24 | 7.8 | |
| Missing data | 30 | 9.8 |
Participant demographics (N = 307).
2.2 Measures
2.2.1 Early literacy assessment app (EuLeApp©)
To assess early literacy between the ages of 4 and 7 years, we administered the EuLeApp©, a digital multiple-choice test developed to measure key early literacy content areas, including the following: (a) the concepts of print, (b) print awareness, (c) word awareness, (d) phonological awareness, (e) alphabet knowledge, and (f) early reading (g) narrative skills (Figure 1).
Figure 1
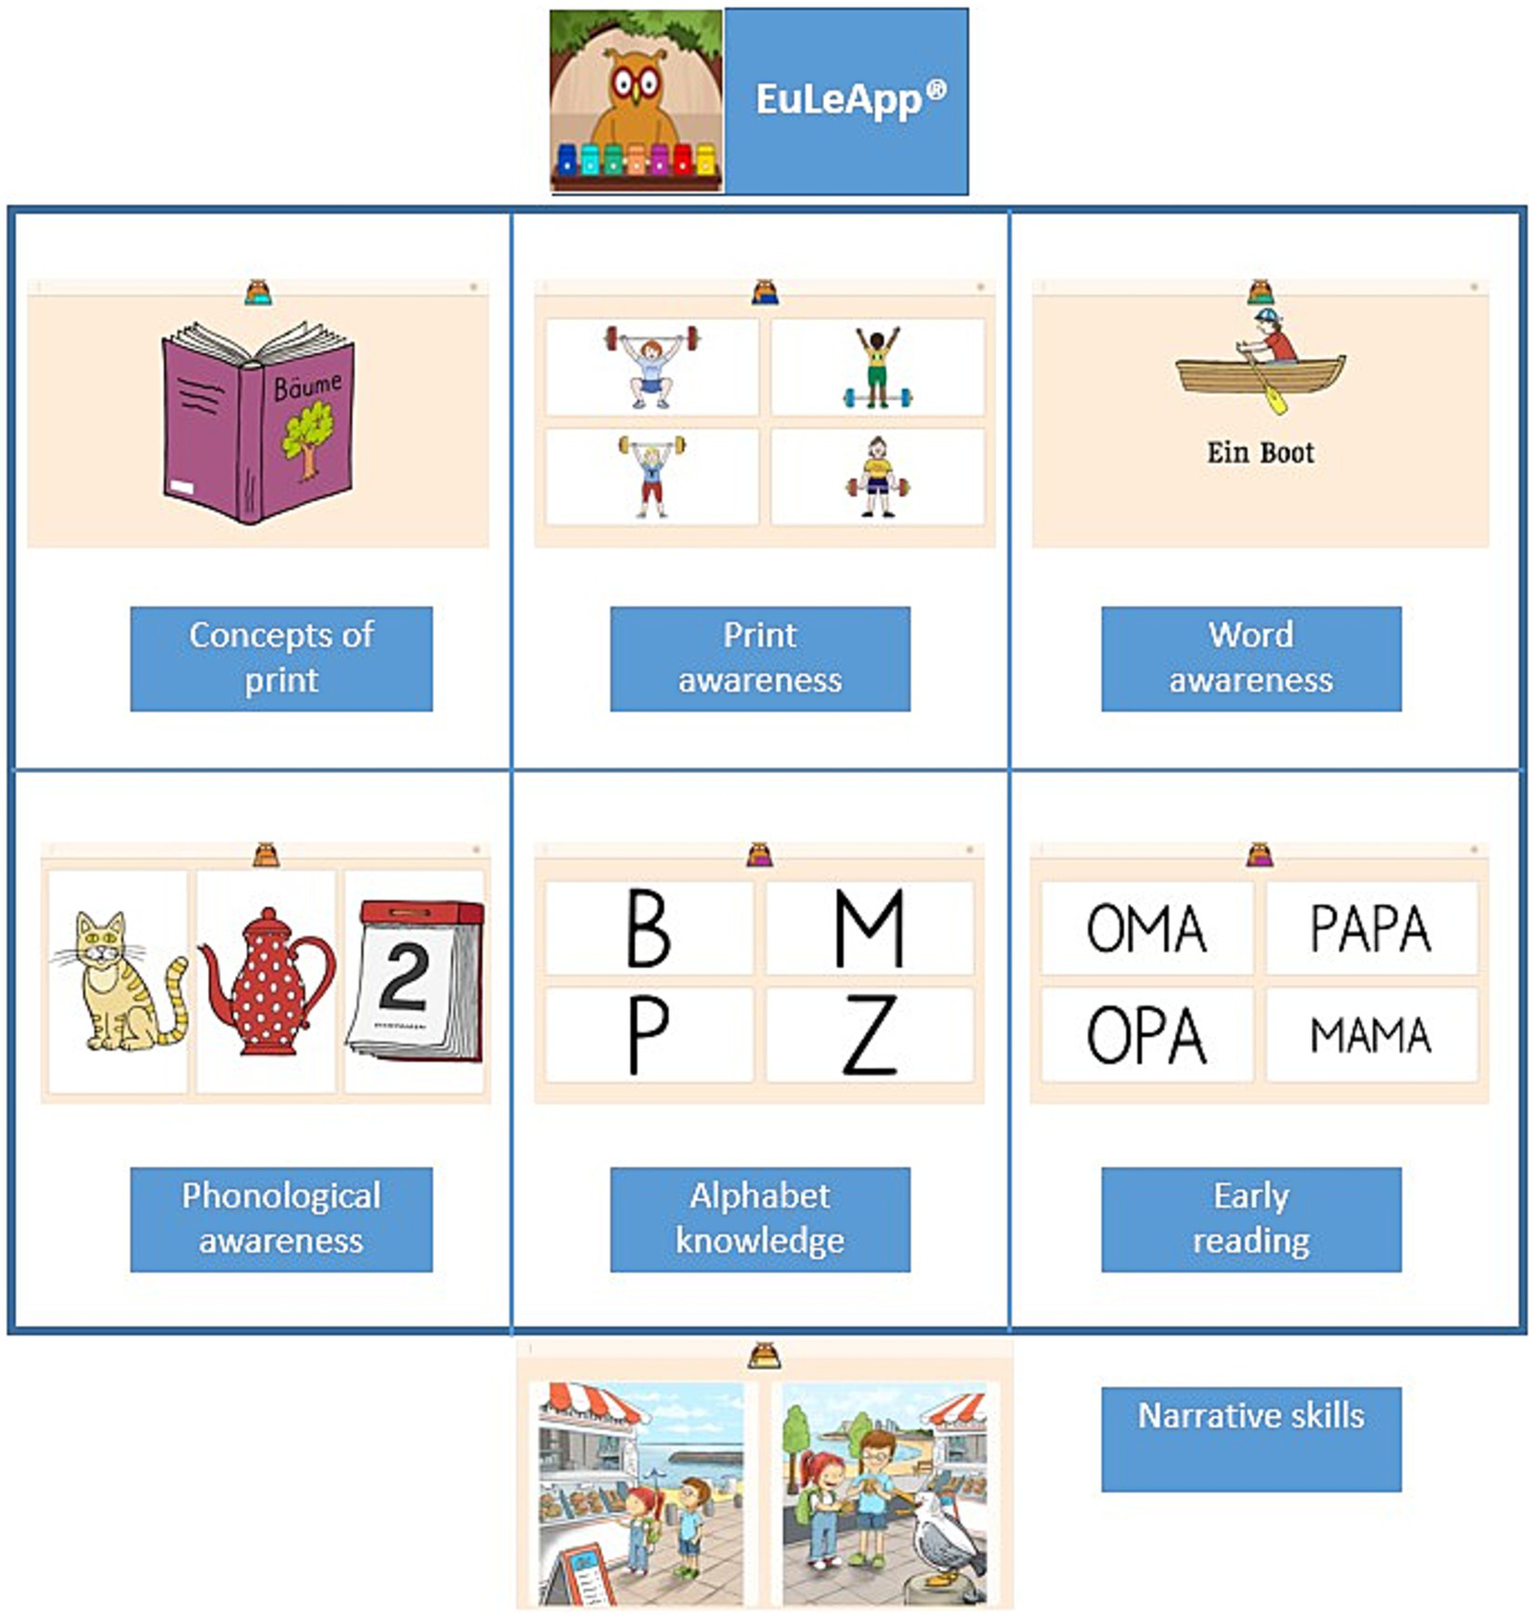
EuLeApp© subtests with sample test items.
2.2.2 EuLeApp© features
During the development of the EuLeApp© prototype, four key design features were incorporated to support the self-assessment process: definition, modeling, practice, and motivation (Carson et al., 2015). The “definition” feature provides a brief explanation of what the child will do and how the task works. While the “modeling” feature demonstrates how to use the system and what is expected of the child (e.g., how to interact with the tool and respond to questions), the “practice” feature allows the child to practice how the system works before the actual assessment. The goal of the “motivation” feature is to motivate and encourage children to keep them engaged in completing the test.
This digital assessment tool can be completed in a single session (∼20 min). It requires no formal training and can be automatically administered and scored using its software program, except for the picture story for the narrative part “Seagull Marius.” For only this narrative part, the pedagogical professionals have to analyze the realized macrostructure of the child’s narration with the help of a protocol sheet.
The EuLeApp©’s subscales, each tapping into different and overlapping skills, were developed to provide teachers, pedagogic staff, researchers, and parents with sufficient information to interpret children’s early literacy performance. The assessment follows a multiple-choice format, which is widely recognized as an effective method for direct measurement (Haladyna, 2013; Raymond et al., 2019). Accordingly, each child is shown with a picture or figure with four response options on the screen (one target response, three distractors). Within these six subscales (Figure 1), we presented children with 175 items in total. Item indicators are equivalent to items in a conventional test. Item selection considered linguistic (e.g., bilingual, multilingual), socioeconomic, and cultural diversity (Levine et al., 2020). In this context, we used short and clear instructions. Besides being more effective than open-ended questions, another important reason for structuring the test in a multiple-choice format is considering equity for children from different backgrounds (Bruder, 1993; Neumann et al., 2019).
Concepts of print: This task comprises 40 items, and children need to identify print-related tasks such as reading directions from left to right or where to start reading (Cronbach’s α = 0.93). Based on the questions, children are required to tap on the correct part of the screen.
Print awareness: The assessment of print awareness comprises a 19-item subtest (Cronbach’s α = 0.76). The task of the children is to distinguish between words, icons, and symbols (“Tap on the letter”; “Tap on writing”). Each child is presented with four pictures, one of which is the target and the other three serving as distractors, and is expected to tap either on the word or the letter corresponding to the target.
Words awareness: This task consists of 11 items that increase in difficulty gradually (Cronbach’s α = 0.79). During this assessment, children encounter short texts and are directed to tap on specific elements, such as the first, second, or space between two words (“Tap on the space between two words”).
Phonological awareness: The phonological awareness subtest comprises 29 items (Cronbach’s α = 0.72) and assesses the ability of two key components: synthesizing syllables and phonemes to form words and analyzing words’ syllabic and phonemic structure. For example, tasks include identifying the initial sounds of words (e.g., “Here you can see three pictures: Grandma, Mum, Apple. Touch the picture that starts with /m/”).
Alphabet knowledge: This subtest consists of 45 items (Cronbach’s α = 0.89). To evaluate children’s alphabet knowledge, they are presented with phonetic realizations of letters and are asked to select the corresponding letter from a set of four options (e.g., “Tap the /m/”).
Early reading: In the early reading segment, children are asked to name the 36 letters of the alphabet (Cronbach’s α = 0.96). Items such as “Tap on /am/,” “Tap on /mama/” (receptive segment), and “What is written here?” (productive segment) assess children’s first receptive and productive reading abilities on the syllable and word level.
Table 2 provides descriptive statistics, reliability estimates, and distribution metrics (skewness and kurtosis) for each subscale. While Cronbach’s α values indicate good internal consistency across the EuLeApp© scales, particularly for Concepts of Print, Alphabet Knowledge, and Early Reading, the inter-item correlation values were comparatively lower. Additionally, skewness and kurtosis values indicate that most subscales exhibit approximately normal distributions, with no extreme deviations from normality, supporting the reliability and usability of the scales.
Table 2
| Scale | M | SD | M IIC | SD IIC | Cronbach’s | Skewness | Kurtosis |
|---|---|---|---|---|---|---|---|
| Concept of prints | 23.7 | 10.4 | 0.277 | 0.156 | 0.939 | −0.065 | −0.891 |
| Print awareness | 11.8 | 3.7 | 0.157 | 0.117 | 0.769 | −0.437 | −0.058 |
| Word awareness | 5.3 | 3.2 | 0.244 | 0.106 | 0.796 | 0.294 | −0.678 |
| Phon. Awareness | 18.9 | 4.3 | 0.082 | 0.083 | 0.729 | 0.821 | 0.373 |
| Alphabet knowledge | 19.3 | 9.0 | 0.152 | 0.083 | 0.892 | 0.782 | 0.274 |
| Early reading | 6.9 | 8.9 | 0.427 | 0.113 | 0.962 | 0.14 | −0.372 |
Descriptive statistics and internal consistency of the scores in each subscale (N = 307).
M IIC, Mean of Inter-Item Correlation; SD IIC, Standard Deviation of Inter-Item Correlation.
In addition, the EuLeApp© includes a narrative measure in which children retell the story of Seagull Marius after viewing seven pictures. Therefore, this section of the assessment follows a different methodological approach, and its reliability evaluation is still ongoing.
The EuLeApp© was designed with the understanding that children can comfortably engage with tablets. The test begins with a short, child-friendly explanation and an example of how they will conduct it, and it provides a short practice. After an item and its audio are presented, children respond to the question by touching one of the options on the screen. The test then continues with children viewing items one by one. The software is configured so that children can respond flexibly.
The test automatically moves through subtests, and children view short, fun, animated scenes throughout the assessment as a break from the tasks. According to Campbell and Jane (2012), motivation is considered one way to stimulate children’s engagement. Therefore, children are regularly given positive feedback (e.g., “Well done!” or “Excellent!”) and visual, colorful gift boxes after each subtest.
2.2.2.1 Scoring and coding
To describe the child’s strengths and weaknesses, a specialized database architecture was used to record the child’s interactions with each task on the tablet. An automated scoring system provides real-time feedback by evaluating whether each response is correct or incorrect. Most indicators are binary, designed to detect the presence or absence of a correct answer for each item. By automating this process, the system can quickly and accurately generate feedback highlighting the child’s strengths and identifying areas needing improvement. In other words, each early literacy domain is scored across a different number of items, and assessments of the children’s answers, false (0) or true (1) scores, are determined by their success or failure on the task. The coded items are considered the primary data source for the scoring process. Evaluation indicators are classified based on the child’s answers for each scale. Each assessment includes the child’s total response time, item counts, and each child is coded with a unique ID code. To capture the required data, once the indicators are determined for items in every subscale, difficulty differences based on these item indicators are (automatically) determined.
Children’s performance is reported as a score for each scale, allowing researchers and practitioners to monitor children’s progress. Furthermore, to facilitate the classification of early literacy skill levels, the assessment results in a color-coded ranking list with “traffic light” analogy (Templin and Henson, 2010). Children are categorized as “red” (at risk), “orange” (monitoring needed), or “green” (on track) based on their performance in key components of early literacy. This feature provides a viable way to identify children needing additional support, reinforcing the tool’s ability to differentiate between skill levels and guide targeted interventions. The reports are also displayed on the children’s profile pages and include short demographic information such as the child’s age, gender, and kindergarten/school. The App’s user-friendly interface allows for straightforward administration and scoring, making it a valuable resource for educators and researchers in early childhood education.
2.2.3 Language competence
Children’s language competence was assessed using standardized German language tests, selected based on age: (a) “Language level test for children aged 3–5 years” (Sprachentwicklungstest für Kinder 3–5 [SET 3–5]; Petermann et al., 2016), (b) “Language level test for children aged 5–10 years” (Sprachentwicklungstest für Kinder 5–10 [SET 5–10]; Petermann, 2018). The SET 3–5 consists of 12 subtests that measure a child’s receptive language processing skills (understanding, recording), productive language processing skills (own speech acts), and auditory memory skills (language memory). The internal consistency for administered subtests from the SET 3–5 ranged between α = 0.70 and α = 0.93 (Petermann et al., 2016). The SET 5–10 consists of 8 subtests to measure a child’s vocabulary, semantic relations, processing speed, language comprehension, language production, grammar/ morphology, and auditory memory. The internal consistency for administered subtests ranges between α = 0.71 and α = 0.91 for the SET 5–10 (Petermann, 2018).
2.3 Procedures
Prior to the start of the study, university ethics approval was received, and permission to assess children was obtained from the head educators of a total of 15 kindergartens. Before administering the EuLeApp©, children’s language skills were evaluated to ensure that they possessed sufficient language comprehension. This step was essential in preventing the misinterpretation of literacy test results due to underlying language receptive problems and ensuring that literacy performance was accurately measured. Then, we assessed early literacy skills in the daycare centers using the prototype of the EuLeApp© on a tablet. The test practitioners were master’s students, PhD candidates, and postdoctoral fellows, all of whom completed two training sessions: one on understanding the assessment tool and its usage, and another on practical test implementation. All assessments were conducted individually. Before the test began, practitioners informed the children about the goal of the test and how it would help them, reassuring them that the test would not show everything they knew and could do and that they had plenty of time to answer the questions. Sitting beside the child, the test practitioners asked the child to practice tapping on the screen before beginning the assessment. Once the evaluation began, the practitioners did not answer the children’s questions or provide any tips to ensure standardized administration. During the EuleApp© assessment procedure, standard administration and scoring procedures were followed.
2.4 Data analysis strategy
Figure 2 outlines the structured process used for the CAT analysis in EuLeApp©: (a) Developing a calibrated item bank: Relevant items from the EuLe 4–5 paper-based assessment tool were selected, categorized, and visualized to ensure consistency between the paper and digital formats. (b) Selection of starting items: A prototype was developed, and data were collected for item calibration, with model fit tested for accuracy. (c) Continuous estimation of a child’s ability: A child’s ability was continuously estimated during CAT simulation studies, applying a stop rule based on predefined precision criteria. (d) A final item pool was established based on simulations, integrated into EuLeApp©, and validated through reliable retest processes.
Figure 2
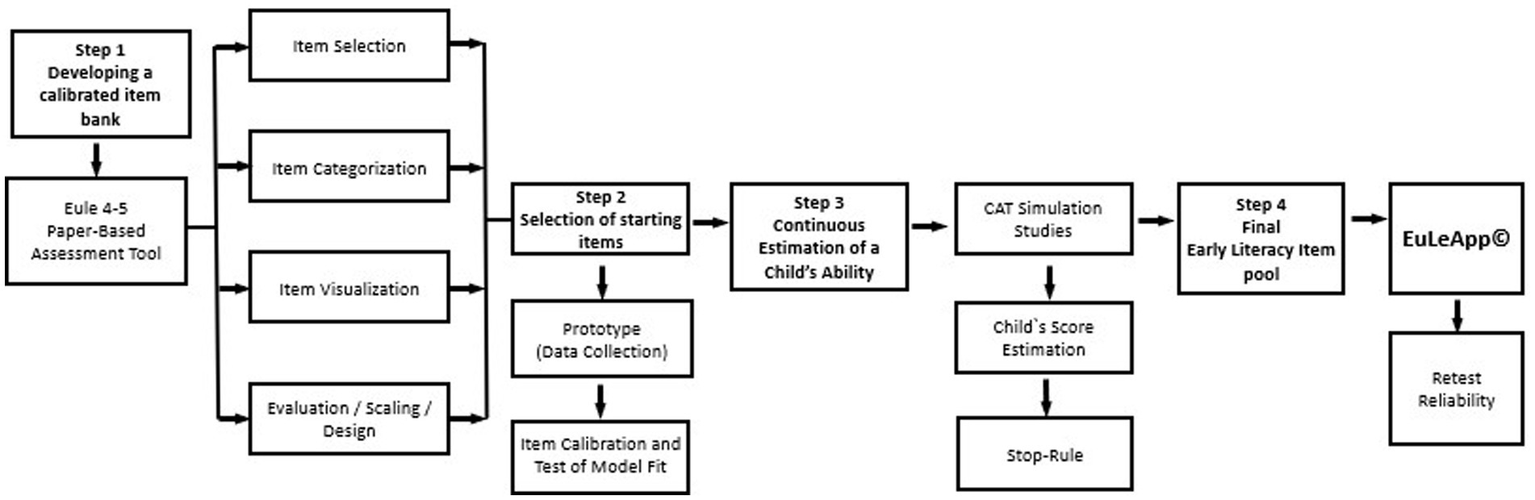
The development of an adaptive app-based early literacy assessment tool.
The R package mirtCAT was used for psychometric development of the app’s multidimensional computerized adaptive test (MCAT) based on Item Response Theory (IRT). Initially, items were adapted from the EuLe 4–5 test, whose content and construct validity had been previously established (Meindl and Jungmann, 2019). A digital platform was then created to deliver the assessment, incorporating multimedia features (vocal instructions, touch interactions, and graphics) to enhance children’s engagement and navigation. In the next step, data collection marked the first calibration phase of item pool development. A series of confirmatory IRT models were used to estimate item parameters and assess the effectiveness of the MCAT in providing individualized early literacy assessments. Both exploratory and confirmatory Item Factor Analysis (IFA) were conducted to validate the item structure, removing items misaligned with the identified factors to improve accuracy and reliability. Fit indices, including the Comparative Fit Index (CFI), Tucker–Lewis Index (TLI), Root Mean Square Error of Approximation (RMSEA), and Standardized Root Mean Square Residual (SRMR), were applied to evaluate the calibration data against the proposed six-factor model (Brown, 2015).
To address potential estimation challenges and improve model convergence, the model was divided to reduce the number of estimated parameters: the first submodel included scales 1–4, while the second submodel included scales 5–6. Using these submodels, exploratory and confirmatory IFA models were developed. Structural analysis indicated that items 9–40 exhibited a bifactor structure (Chen et al., 2006; Dunn and McCray, 2020). This meant that the “Concepts of Print” scale could only be derived if the model incorporated two additional dimensions related to the item-specific use of numbers and images, which did not correlate with other dimensions. These were defined as “Numerical Writing Awareness” and “Iconic Writing Awareness.” Items 1–8 were also deemed usable when assigned to new dimensions, further strengthening the bifactor structure of this scale. Based on these findings, the structural analysis was refined using a model with six dimensions for the EuLeApp© scales and two item-specific dimensions for numbers and images. Six items were removed due to poor model fit, as they could not be assigned to any specific dimension.
As shown in Figure 3, the IRT curve of the 4-Parameter Logistic (4PL) model is compressed in the y-direction, ensuring that it remains within the probability range defined by the lower bound and the upper bound (Yen et al., 2012). This structure sets minimum () and maximum probabilities for the correct response to each item , independent of the test-taker’s ability level. This allows the model to account for guessing (lower asymptote) and disengagement (upper asymptote), providing a more accurate representation of performance.
Figure 3
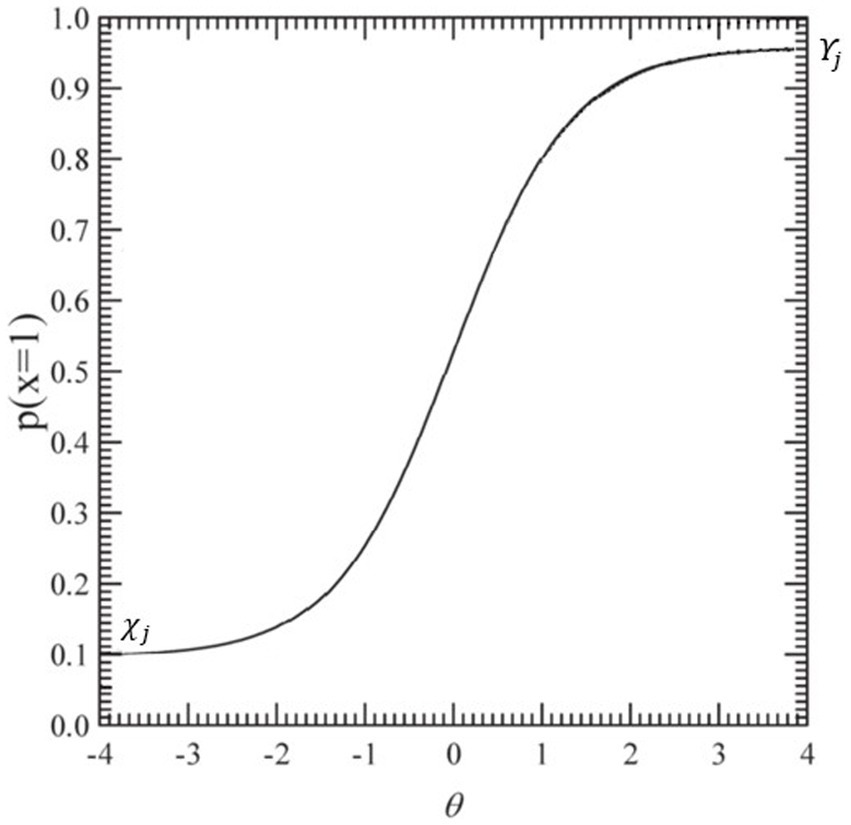
A typical item characteristic curve for the 4PL IRT model. P(θ) represents the probability of a correct response given the ability level. (ability). This represents the ability level of the individual, typically ranging from very low to very high values. (probability of correct response). This represents the probability of answering the item correctly, ranging from 0 to 1. 4PL = four-parameter logistic.
While the lower asymptote captures the probability of randomly guessing an item correctly, it is also crucial to consider factors that might cause young children to respond incorrectly to easy items despite possessing the required knowledge. Issues such as inattention, attention deficits, socially desirable responding, external distractions, or a lack of motivation to engage with simple tasks may contribute to this variability (Liao et al., 2012). To better accommodate these influences, the 4PL model incorporates an upper asymptote, which accounts for the possibility that even highly skilled individuals may not always respond correctly due to carelessness, disengagement, or momentary lapses in concentration (Antoniou et al., 2022; Barton and Lord, 1981).
From a developmental perspective, the 4PL model provides a more precise estimate of young children’s abilities. By accounting for cognitive and behavioral fluctuations common in early development, this model offers improved sensitivity to response patterns that may be influenced by variability in attention, motivation, and task engagement (Anderson et al., 2002). These features make the 4PL model particularly useful in assessing young learners, where performance is not solely determined by ability but also by contextual and developmental factors.
Specific item selection criteria and stopping rules were defined for the item bank used in the Computerized Adaptive Test (CAT) analysis process to enhance testing efficiency and precision (Ebenbeck and Gebhardt, 2022). Standard techniques, including the selection of starting items, regression analysis, and stopping rules, were implemented to optimize these goals (Roberts et al., 2000). In EuLeApp©, item difficulty is adjusted based on children’s responses. To identify age-appropriate starting items, 24 of the 183 available items were selected based on content considerations, ensuring that the MCAT process began with items that were neither too easy nor too difficult for each age group. A regression analysis was then conducted to analyze the influence of these starting items on the standard error of measurement for determining personal abilities. The stopping rule was set based on test precision, where the CAT algorithm assesses whether the confidence interval falls within specified limits. When this criterion is met, the algorithm concludes the assessment for that construct. SEM (standard error of measurement) was chosen for the stopping rule because it offers a flexible framework for modeling relationships between observed data (test items) and latent traits (ability levels), evaluating measurement precision, and enhancing testing efficiency (Sideridis et al., 2018). During the assessment process, the stopping rule can be applied to end the test when SEM falls below a specified threshold, indicating sufficient precision:
The formula 𝑆𝐸𝑀 = ⇔ 𝑅𝑒𝑙 = 1 − 𝑆𝐸𝑀2 allows for calculating standard measurement errors corresponding to reliabilities of 0.75, 0.80, 0.85, and 0.90, resulting in SEM values of 0.500, 0.447, 0.387, and 0.316, respectively. When the stopping rule SEM < 0.316 is applied, the procedure maintains a minimum reliability of 0.90 for the estimates of personal abilities, with the flexibility to specify different minimum reliabilities for each dimension (Bjorner et al., 2007; Chalmers, 2016). Using this approach, SEM ensures that the adaptive assessment is accurate and efficient, balancing the number of test items with the need for reliable measurement of a child’s ability. Simulation studies were conducted to evaluate the performance of the CAT algorithm, generating response patterns from simulated test subjects with fixed parameters (Magis and Raîche, 2012). The ability of IRT models to fit depends on the match between the items and the sample (skewed items require larger sample sizes, such as 500–1,000), with larger sample sizes providing better results. Given our smaller sample, we repeated parameter estimates multiple times to enhance their stability. We also conducted simulation studies to evaluate item functionality, establishing factor models based on the intended content during the data generation. The EuLeApp© was built on measuring information on the interrelationships among various early literacy dimensions. MIRT models can estimate skills with the categorical factor structure of early literacy components (Ackerman et al., 2003). Thus, the analysis process was carried out with multidimensional CAT, which is based on Multidimensional IRT (MIRT) models and allows the simultaneous measurement of more than one dimension (Segall, 2009).
3 Results
3.1 Multidimensional IRT model comparisons
A confirmatory IRT model was developed by assigning the items to six latent dimensions based on intended measurement purposes: concepts of print (Items 1–40), print awareness (Items 41–59), word awareness (Items 60–71), phonological awareness (Items 71–100), alphabet knowledge (Items 101–146), and early reading (Items 147–183).
Next, a covariance matrix was defined for a model with correlated dimensions. The number of parameters was 408 for the M2PL model, 585 for the M3PL model, and 762 for the M4PL model (Table 3). While statistical model fit is important, it should not be the only criterion for model selection; theoretical assumptions about the underlying model should also be considered (Robitzsch, 2022). Since we can theoretically substantiate that the IRT model has four parameters, we compared M2PL, M3PL and M4PL models. However, given the relatively small sample size (n = 307), it was anticipated that the model estimates of the M4PL models might lack stability (Wolf et al., 2013). When parameter estimates are unstable, this suggests the possibility of alternative models with improved parameter estimations (Robitzsch, 2022). Therefore, the M2PL, M3PL, and M4PL models were estimated multiple times using the same item allocations to further address stability concerns (e.g., the M4PL model was estimated 17 times).
Table 3
| Confidence interval | Items in MCAT SEM < 0.447 |
||||||||||||||
|---|---|---|---|---|---|---|---|---|---|---|---|---|---|---|---|
| Model | Nr. | Number of parameters | M2 | dF | p | RMSEA | 5% LB | 95% UB | SRMSR | TLI | CFI | M | Mdn | SD | % |
| M2PL | 1 | 408 | 16495.4 | 15,345 | 0.000 | 0.0157 | 0.0134 | 0.0176 | 0.0641 | 0.9929 | 0.9930 | 93.4 | 77 | 44.9 | 19 |
| 2 | 408 | 16520.7 | 15,345 | 0.000 | 0.0158 | 0.0136 | 0.0178 | 0.0641 | 0.9928 | 0.9929 | 92.8 | 76 | 45.2 | 19 | |
| 3 | 408 | 16529.9 | 15,345 | 0.000 | 0.0159 | 0.0137 | 0.0178 | 0.0641 | 0.9927 | 0.9928 | 92.2 | 76 | 44.4 | 18 | |
| 4 | 408 | 16549.0 | 15,345 | 0.000 | 0.0160 | 0.0138 | 0.0180 | 0.0640 | 0.9926 | 0.9927 | 92.8 | 76 | 45.0 | 19 | |
| M3PL | 1 | 585 | 16352.0 | 15,168 | 0.000 | 0.0160 | 0.0137 | 0.0179 | 0.0679 | 0.9926 | 0.9928 | 71.5 | 36 | 62.9 | 25 |
| 2 | 585 | 16454.5 | 15,168 | 0.000 | 0.0166 | 0.0145 | 0.0185 | 0.0667 | 0.9920 | 0.9922 | 67.5 | 36 | 59.7 | 21 | |
| 3 | 585 | 16792.0 | 15,168 | 0.000 | 0.0187 | 0.0168 | 0.0204 | 0.0614 | 0.9899 | 0.9902 | 86.2 | 48 | 66.2 | 33 | |
| 4 | 585 | 16946.4 | 15,168 | 0.000 | 0.0196 | 0.0177 | 0.0212 | 0.0594 | 0.9889 | 0.9892 | 72.4 | 34 | 63.9 | 25 | |
| M4PL | 1 | 762 | 15902.6 | 14,991 | 0.000 | 0.0141 | 0.0116 | 0.0163 | 0.0559 | 0.9943 | 0.9945 | 62.6 | 28 | 63.9 | 23 |
| 2 | 762 | 16000.5 | 14,991 | 0.000 | 0.0148 | 0.0124 | 0.0169 | 0.0609 | 0.9936 | 0.9939 | 55.3 | 26 | 58.5 | 18 | |
| 3 | 762 | 16086.4 | 14,991 | 0.000 | 0.0155 | 0.0131 | 0.0175 | 0.0690 | 0.9931 | 0.9934 | 48.3 | 25 | 55.7 | 15 | |
| 4 | 762 | 16106.5 | 14,991 | 0.000 | 0.0156 | 0.0133 | 0.0176 | 0.0677 | 0.9930 | 0.9932 | 83.7 | 34 | 71.1 | 36 | |
| 5 | 762 | 16169.9 | 14,991 | 0.000 | 0.0160 | 0.0138 | 0.0180 | 0.0578 | 0.9926 | 0.9929 | 91.6 | 51 | 73.7 | 42 | |
| 6 | 762 | 16215.1 | 14,991 | 0.000 | 0.0163 | 0.0141 | 0.0183 | 0.0600 | 0.9923 | 0.9926 | 50.4 | 26 | 55.8 | 16 | |
| 7 | 762 | 16249.1 | 14,991 | 0.000 | 0.0166 | 0.0144 | 0.0185 | 0.0594 | 0.9921 | 0.9924 | 78.5 | 40 | 64.7 | 29 | |
| 8 | 762 | 16255.9 | 14,991 | 0.000 | 0.0166 | 0.0145 | 0.0185 | 0.0615 | 0.9920 | 0.9923 | 50.6 | 23 | 59.6 | 18 | |
| 9 | 762 | 16394.1 | 14,991 | 0.000 | 0.0175 | 0.0154 | 0.0193 | 0.0595 | 0.9912 | 0.9915 | 67.1 | 29 | 66.4 | 26 | |
| 10 | 762 | 16515.6 | 14,991 | 0.000 | 0.0182 | 0.0163 | 0.0200 | 0.0563 | 0.9904 | 0.9908 | 36.5 | 21 | 45.4 | 9 | |
| 11 | 762 | 16541.2 | 14,991 | 0.000 | 0.0184 | 0.0164 | 0.0201 | 0.0759 | 0.9902 | 0.9906 | 63.9 | 30 | 63.8 | 23 | |
| 12 | 762 | 16544.2 | 14,991 | 0.000 | 0.0184 | 0.0164 | 0.0202 | 0.0690 | 0.9902 | 0.9906 | 47.8 | 20 | 59.8 | 17 | |
| 13 | 762 | 16594.4 | 14,991 | 0.000 | 0.0187 | 0.0168 | 0.0204 | 0.0694 | 0.9899 | 0.9903 | 47.8 | 24 | 55.8 | 15 | |
| 14 | 762 | 16659.3 | 14,991 | 0.000 | 0.0191 | 0.0172 | 0.0208 | 0.0626 | 0.9895 | 0.9899 | 53.4 | 28 | 56.0 | 15 | |
| 15 | 762 | 16672.3 | 14,991 | 0.000 | 0.0191 | 0.0173 | 0.0208 | 0.0786 | 0.9894 | 0.9898 | 32.0 | 20 | 40.9 | 7 | |
| 16 | 762 | 16676.2 | 14,991 | 0.000 | 0.0192 | 0.0173 | 0.0209 | 0.0592 | 0.9894 | 0.9898 | 72.9 | 36 | 68.2 | 29 | |
| 17 | 762 | 16917.5 | 14,991 | 0.000 | 0.0205 | 0.0187 | 0.0221 | 0.0796 | 0.9879 | 0.9883 | 32.0 | 20 | 40.9 | 7 | |
Model comparison in search of the optimal structure of EuLeApp©.
M₂, Deviance; dF, Degrees of Freedom; RMSEA, Root Mean Square Error of Approximation; 5% LB, %5 Lower Bound; 95% UB, 95% Upper Bound; SRMSR, Standardized Root Mean Square Residual; TLI & CFI, Tucker-Lewis Index & Comparative Fit Index; M, Mean Number of Items in MCAT; Mdn, Median Number of Items in MCAT; SD, Standard Deviation; %, Percentage of individuals required to answer all 177 items.
Table 3 presents the model fit indices for the M2PL, M3PL, and M4PL models, with all estimates using the final item assignments.
The results consistently indicated that M4PL models provided a superior data fit compared to M2PL and M3PL models. Specifically, M4PL models No. 1 and 2 demonstrated superior RMSEA values, while models No. 1 and 10 stood out in terms of their SRMSR values. Based on the literature by Maydeu-Olivares (2013) to prioritize SRMSR as a model fit criterion, M4PL model No. 10 was ultimately selected. Additionally, the performance of model No. 10 in the multidimensional CAT framework played a decisive role in its selection. The favored M4PL model is superior to the M2PL and M3PL models not only in terms of fit indices, but also in terms of the number of answered items required to achieve a reliability of 0.80 on the MCAT. This iterative estimation process was essential for ensuring parameter stability and validating the reliability of the adaptive testing framework, reinforcing the robustness of the final model.
Table 3 shows that M4PL-Model No. 10, based on the M4PL model, demonstrates a very strong model fit, as indicated by the following fit indices: RMSEA = 0.0182 [0.0163; 0.0200], which suggests a close fit to the data; SRMR = 0.0563, indicating a small standardized residual; TLI = 0.9904, and CFI = 0.9908, both of which suggest an excellent fit to the model.
These values collectively confirm that the model fits the observed data well, providing reliable estimates.
3.2 MCAT calibration of the item pool
An optimally calibrated item pool for CAT should include a broad distribution of items covering the difficulty parameter range , from −2 to +2. This range ensures that the item pool can assess abilities across a wide spectrum of test-takers. In addition to a well-distributed difficulty range, the discrimination parameter , plays a critical role in item selection. Higher values of indicate items that are more effective in distinguishing between individuals of different ability levels, thus contributing to the overall reliability of the test. Figure 4 presents the distribution of the difficulty parameters (MDIFF on the x-axis) and the discrimination parameters (MDISC on the y-axis) for the 177 items in the item bank.
Figure 4
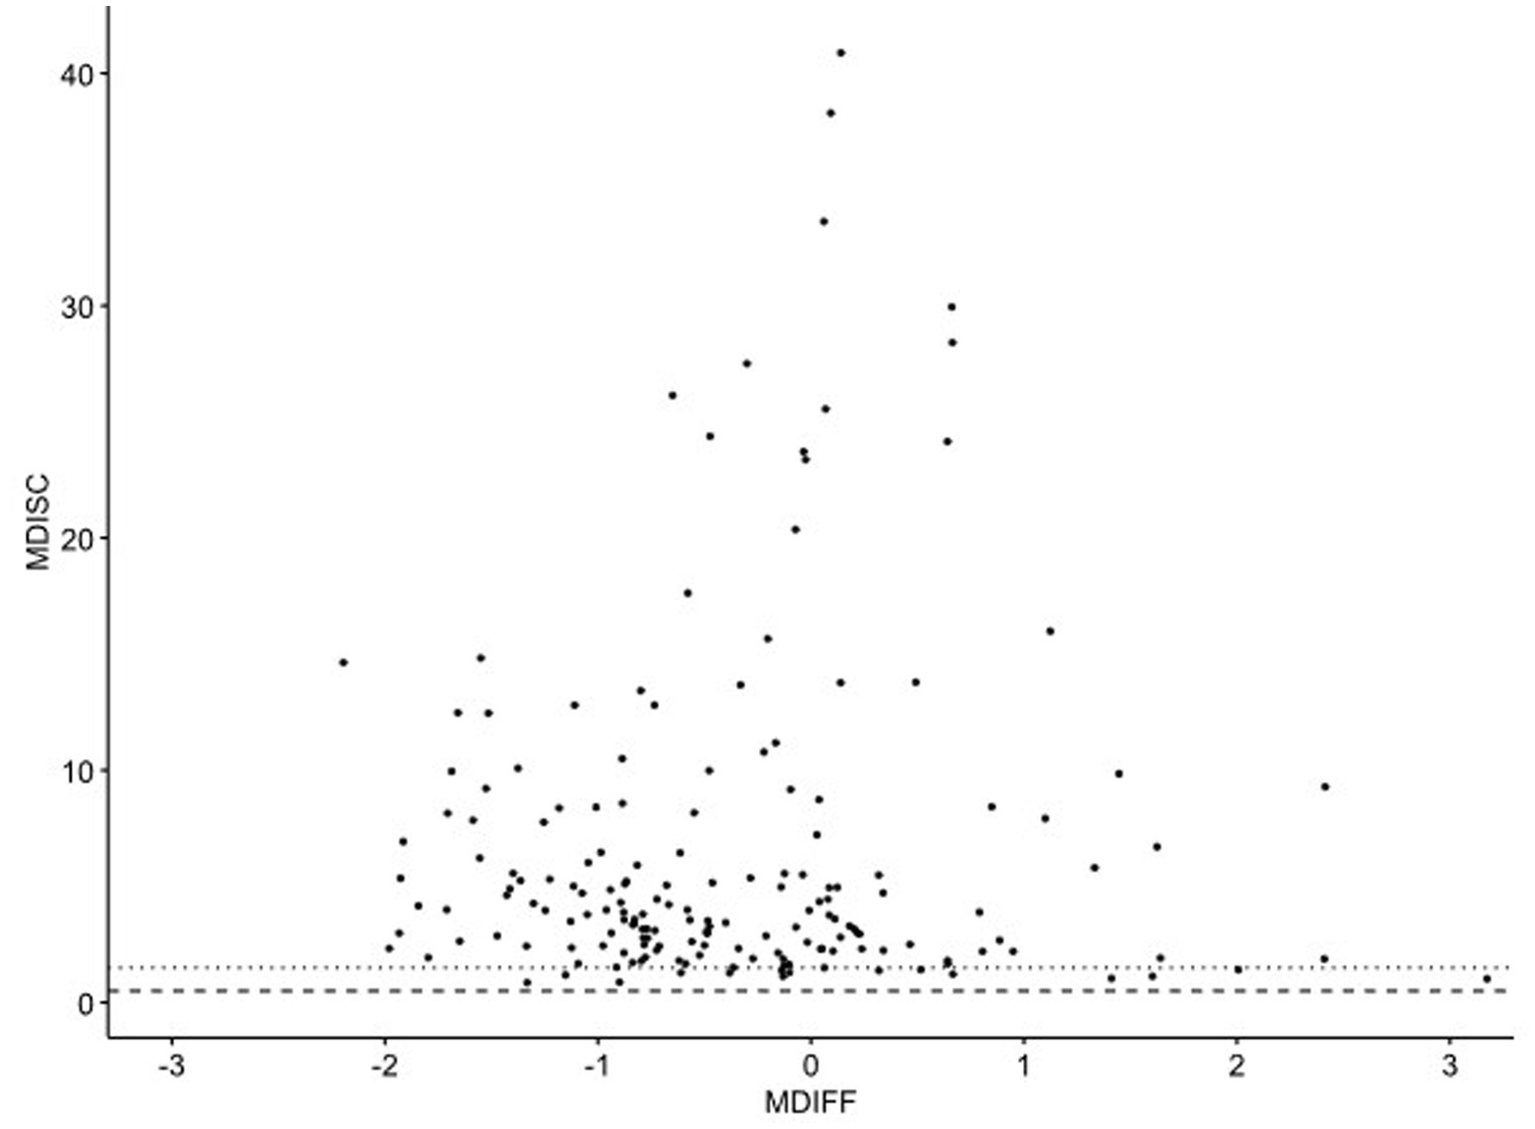
Item difficulties in the calibrated item bank. MDISC: Item Discrimination Index, MDIFF: Item Difficulty Index. The MDIFF values were multiplied by −1 so that the difficulty of the items increases from left to right in the diagram.
Regarding discrimination , items in the calibrated bank exhibit varying levels of effectiveness in distinguishing between children with different abilities. The majority of the items falls within the range of high discriminatory power (> 1.5, dashed line), indicating that they are very effective in distinguishing between different levels of ability. Only a small subset of 16 items shows an acceptable discriminatory power of 0.5 < < 1.5 (area between the dotted and dashed line). In the area of average abilities (−1 < Δj < 1), there is a subset of 15 items that stand out with an excellent selectivity of >15. These items are especially valuable in increasing the precision of the ability estimates for individuals whose abilities lie near the population mean. The calibrated item pool reveals that items with the highest discriminatory power are concentrated in the range of average abilities, specifically between −1 and +1 on the ability scale. The item bank is concentrated with highly discriminating items from below-average to average abilities (−2 to +1), ensuring accurate assessment in this range. A dozen items adequately cover the above-average range (+1 to +3). This distribution ensures the test maintains precision and reliability across a broad spectrum of abilities.
3.2.1 Results from the simulation study
Given the developmental range of the target sample (ages 4 to 7), it was important to examine whether differential item functioning occurs as a result of age. To determine optimal starting items, easy items were selected based on average items and relevant literature per scale for each of the three age groups (4 years and younger, 5 years, and 6 years and older). Approximate Posterior (AP) rule for item selection and the Maximum A Posteriori (MAP) method for estimating a person’s ability. Each age group was assigned a single starting item, resulting in a total of three starting items. The simulation was conducted twice, applying different stopping rules: SEM < 0.447 for the first and SEM < 0.387 for the second. The MCAT simulation with 307 complete cases from the training sample provided standard errors of measurement (SEM) for the estimates of the six early literacy components. The sum of squared SEM values was used as the target variable to be minimized. Then, a linear regression analysis was conducted to assess the influence of the two variables: starting item and stop rule. Table 4 shows that age-appropriate starting items significantly improved the ability to estimate precision, with significant reductions in the sum of squared errors per age group: for four-year-olds by 6.92 (−1.07 per dimension) (t = −3.52, p < 0.001), for 5-year-olds by 11.05 (−1.36 per dimension) (t = −5.00, p < 0.001), and for 6-year-olds by 10.83 (−1.34 per dimension) (t = −4.03, p < 0.001). These findings align with psychometric principles, which emphasize the importance of accounting in assessments covering a broad age range (Best and Miller, 2010; Snow, 2020).
Table 4
| Age groups | Items | b | SE | t | p | |
|---|---|---|---|---|---|---|
| (Intercept) | 57.91 | 1.74 | 33.20 | 0.000 | 0.164 | |
| SEM < 0.447 | 6.19 | 0.64 | 9.68 | 0.000 | 0.257 | |
| 4;0–4;11 | SK01_25boot | −6.92 | 1.96 | −3.52 | 0.000 | −0.288 |
| SK06_05mo | −3.23 | 2.42 | −1.33 | 0.184 | −0.134 | |
| SK06_01buchstaben1s | −2.93 | 2.42 | −1.21 | 0.226 | −0.122 | |
| SK05_27am | −1.85 | 2.42 | −0.76 | 0.445 | −0.077 | |
| SK04_16e | −0.91 | 2.42 | −0.38 | 0.708 | −0.038 | |
| SK01_01einbahnstraße | −0.55 | 2.42 | −0.23 | 0.820 | −0.023 | |
| SK02_09buchstabe1 | −0.48 | 2.10 | −0.23 | 0.819 | −0.020 | |
| 5;0–5;11 | SK05_28im | −11.05 | 2.21 | −5.00 | 0.000 | −0.459 |
| SK05_12r | −9.08 | 2.21 | −4.11 | 0.000 | −0.378 | |
| SK03_06luecke | −8.50 | 2.21 | −3.85 | 0.000 | −0.353 | |
| SK01_03friseur | −8.29 | 2.21 | −3.75 | 0.000 | −0.345 | |
| SK05_04u | −8.11 | 2.21 | −3.67 | 0.000 | −0.337 | |
| SK06_06am | −8.02 | 2.21 | −3.63 | 0.000 | −0.333 | |
| SK04_15f | −7.40 | 2.21 | −3.35 | 0.001 | −0.308 | |
| SK06_01buchstaben1i | −7.24 | 2.21 | −3.28 | 0.001 | −0.301 | |
| 6;0–6;11 | SK05_29po | −10.83 | 2.69 | −4.03 | 0.000 | −0.450 |
| SK05_19y | −10.18 | 2.69 | −3.79 | 0.000 | −0.423 | |
| SK02_07seite1 | −9.35 | 2.69 | −3.48 | 0.001 | −0.389 | |
| SK04_29kuh2 | −9.00 | 2.69 | −3.35 | 0.001 | −0.374 | |
| SK06_04buchstaben4q | −8.97 | 2.69 | −3.34 | 0.001 | −0.373 | |
| SK06_08pa | −8.72 | 2.69 | −3.25 | 0.001 | −0.363 | |
| SK06_02buchstaben2r | −6.79 | 2.69 | −2.53 | 0.011 | −0.282 | |
| SK03_11woerteranzahl3 | −6.65 | 2.69 | −2.47 | 0.013 | −0.276 |
Regression analysis for identifying optimal starting items by age group.
SK01, concepts of prints; SK02, print awareness; SK03, word awareness; SK04, phonological awareness; SK05, alphabet knowledge; SK06, early reading; b, Regression Coefficient; SE, Standard Error; β, Standardized Coefficient.
The reference group for the dummy-coded regression analysis is the start item SK05_05i, with a stop rule of SEM < 0.387. Since R2 is not meaningful in a dummy-coded regression analysis, it is not reported in this table.
Building on this precision improvement, the next phase focused on determining the most effective item selection method through systematic simulation studies comparing parameter estimates using the 4PL model in mirtCAT (Chalmers, 2016) across different item selection rules.
IRT-based CATs employ various rules to estimate children’s abilities (Yao, 2013). During the assessment process, each response continuously refines the ability estimate, allowing the system to adjust dynamically. The algorithm selects the most appropriate items to optimize ability estimation. In addition, the system adapts based on whether a response is correct or incorrect, adjusting the difficulty level of subsequent items accordingly. Typically, a correct response leads to the selection of a more difficult item, while an incorrect response results in an easier one (Ebenbeck and Gebhardt, 2024). Table 5 summarizes the results from simulation studies comparing different item selection methods (D-rule, T-rule, A-rule, W-rule, E-rule, TP-rule, AP-rule, WP-rule, and EP-rule) using predetermined start items and applying two different stop-rules: SEM < 0.447 and SEM < 0.387.
Table 5
| Stop rule | Method | D-rule | T-rule | A-rule | W-rule | E-rule | TP-rule | AP-rule | WP-rule | EP-rule |
|---|---|---|---|---|---|---|---|---|---|---|
| SEM < 0.447 | M | 94.7 | 54.1 | 127.5 | 55.1 | 89.3 | 54.1 | 36.5 | 55.1 | 47.4 |
| SD | 37.4 | 50.5 | 40.4 | 50.8 | 55.2 | 50.5 | 45.4 | 50.8 | 54.7 | |
| Min | 71 | 10 | 31 | 11 | 20 | 10 | 9 | 11 | 10 | |
| Median | 79 | 31 | 138 | 32 | 70 | 31 | 21 | 32 | 25 | |
| 75. Per. | 83 | 66 | 157 | 62 | 139 | 66 | 29 | 62 | 35 | |
| 80. Per. | 86 | 81 | 161 | 74 | 144 | 81 | 31 | 74 | 42 | |
| 85. Per. | 177 | 110 | 177 | 111 | 177 | 110 | 37 | 111 | 81 | |
| 90. Per. | 177 | 177 | 177 | 177 | 177 | 177 | 54 | 177 | 177 | |
| 95. Per. | 177 | 177 | 177 | 177 | 177 | 177 | 177 | 177 | 177 | |
| Max | 177 | 177 | 177 | 177 | 177 | 177 | 177 | 177 | 177 | |
| Total 177 items | 17% | 11% | 18% | 12% | 16% | 11% | 9% | 12% | 15% | |
| SEM < 0.387 | M | 112.1 | 86.6 | 144.9 | 87.9 | 117.7 | 86.6 | 60.4 | 87.9 | 77.3 |
| SD | 46.7 | 64.8 | 36.4 | 64.2 | 54.4 | 64.8 | 62.3 | 64.2 | 67.4 | |
| Min. | 71 | 14 | 31 | 15 | 23 | 14 | 9 | 15 | 12 | |
| Median | 81 | 56 | 154 | 56 | 132 | 56 | 29 | 56 | 40 | |
| 75. Per | 177 | 177 | 177 | 177 | 177 | 177 | 57 | 177 | 177 | |
| 80. Per | 177 | 177 | 177 | 177 | 177 | 177 | 177 | 177 | 177 | |
| 85. Per | 177 | 177 | 177 | 177 | 177 | 177 | 177 | 177 | 177 | |
| 90. Per | 177 | 177 | 177 | 177 | 177 | 177 | 177 | 177 | 177 | |
| 95. Per | 177 | 177 | 177 | 177 | 177 | 177 | 177 | 177 | 177 | |
| Max | 177 | 177 | 177 | 177 | 177 | 177 | 177 | 177 | 177 | |
| Total 177 items | 34% | 30% | 39% | 30% | 34% | 30% | 21% | 30% | 31% |
Simulation studies with different item selection methods.
SEM, Standard Error of Measurement; M, Mean; SD, Standard Deviation; D-rule, Discrimination Rule; T-rule, Theta Rule; A-rule, A-optimality Rule; W-rule, Weighted Information Rule; E-rule, Entropy Rule; TP-rule, Targeting Precision Rule; WP-rule, Weighted Posterior Rule; EP-rule, Expected Posterior Rule.
When applying the stop-rule SEM < 0.447, which corresponds to a minimum reliability of 0.80, the analysis revealed that a minimum of 9 items was required, with a mean of 36.5 items and a median of 21 items for the calibration sample; notably, 90% of the tests were completed within 54 items. With a stricter stopping criterion SEM < 0.387 (reliability = 0.85), the AP rule again performed best, resulting in 75% of tests being completed within 57 items. The AP-rule showed the most optimal item selection method, requiring fewer items to achieve the desired level of precision, as demonstrated by both stopping rules (SEM < 0.447 and SEM < 0.387). Based on these findings, the following stop-rule strategy was developed: (a) the first 49 items are evaluated using SEM < 0.387, ensuring that approximately 75% of cases are tested with a minimum reliability of 0.85. From the 50th item, the stop rule switches to SEM < 0.447, covering an additional 15% of cases with a minimum reliability of 0.80. Beyond the 60th item, the remaining 10% of cases—those requiring all 177 items—are addressed. In these cases, the procedure calculates the sum of squares of the standard error ranges for the six dimensions over the last 10 items, terminating when the sum falls below 0.0005. An overview of the stop rules applied across the six Early Literacy dimensions is presented below:
Stop rule for items 1–49: SEM < 0.387298334620742
Stop rule from item 50 onwards: SEM < 0.447213595499958
Additional stop rule from item 60:
If the threshold of 0.0005 is met, it indicates that the standard errors of measurement over the last 10 items differ by less than 0.01 per dimension. This shows that the standard errors are stable, and cannot be significantly reduced by additional items. According to the stopping rules developed using the calibrated data (Table 6), 75% of children are tested with up to 50 items at a minimum reliability of 0.85, while the remaining cases are tested with up to approximately 75 items at a minimum reliability of 0.80.
Table 6
| Sample | Items | Rel. CP | Rel. PAW | Rel. WA | Rel. PA | Rel. AK | Rel. FR | |
|---|---|---|---|---|---|---|---|---|
| N = 307 | Mean | 35.0 | 0.897 | 0.929 | 0.944 | 0.920 | 0.939 | 0.869 |
| SD | 18.8 | 0.064 | 0.051 | 0.037 | 0.045 | 0.059 | 0.065 | |
| Min | 9 | 0.558 | 0.619 | 0.682 | 0.659 | 0.578 | 0.522 | |
| 5. Per. | 15 | 0.804 | 0.862 | 0.899 | 0.855 | 0.804 | 0.751 | |
| 25. Per. | 21 | 0.863 | 0.899 | 0.925 | 0.894 | 0.938 | 0.853 | |
| 50. Per. | 29 | 0.913 | 0.928 | 0.945 | 0.924 | 0.960 | 0.864 | |
| 75. Per. | 50 | 0.942 | 0.973 | 0.973 | 0.958 | 0.973 | 0.893 | |
| 95. Per. | 73 | 0.965 | 0.988 | 0.984 | 0.974 | 0.981 | 0.980 | |
| Max | 118 | 0.979 | 0.989 | 0.989 | 0.982 | 0.993 | 0.989 |
Results of MCAT simulations for the number of items per test and the reliability obtained for each dimension.
According to the stopping rules developed with the calibrated data, 75% of cases are tested with up to 50 items at a minimum reliability of 0.85, and the remainder are tested with up to approximately 75 items at a minimum reliability of 0.80. For the EuLeApp© dimensions of concepts of print (CP), print awareness (PAW), word awareness (WA), phonological awareness (PA), alphabet knowledge (AK), and first reading (FR), the actual reliabilities are between 0.804 (5th percentile) and 0.988 (95th percentile). It is noticeable that the reliability of the first EuLeApp© dimension of concepts of prints does not reach the reliability of the other five dimensions.
Figure 5 shows the effectiveness of the stop rules and item selection methods, where most participants did not need to complete the maximum number of items. Accordingly, in the distribution of the number of items per early literacy scale, it is evident that tests with up to 50 items form a distinct population.
Figure 5
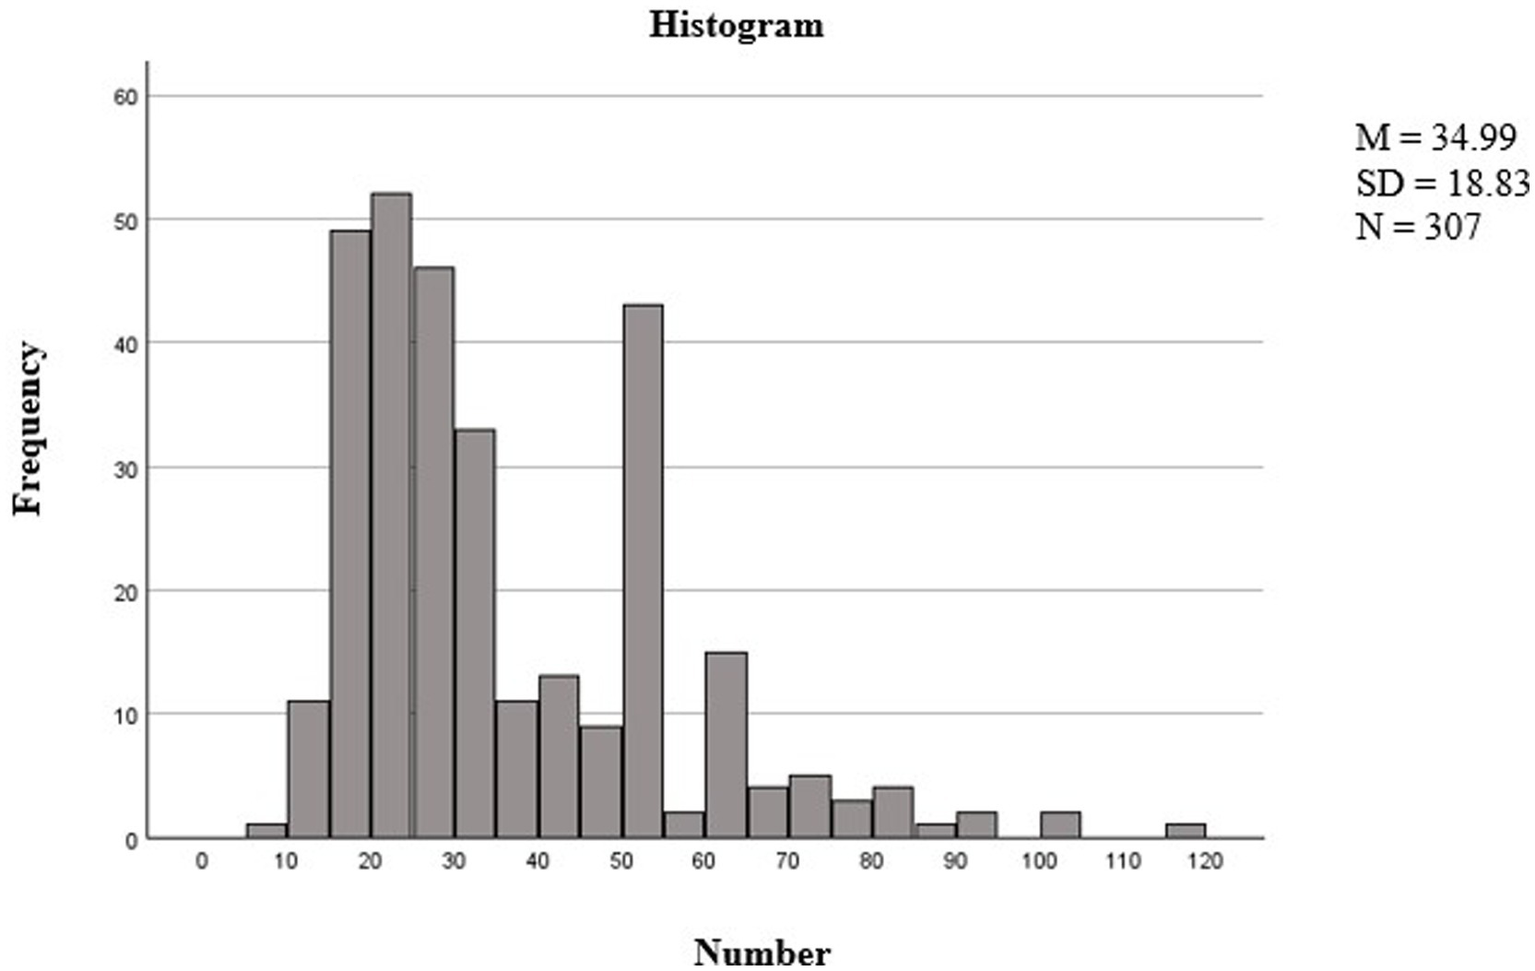
Distribution of item selection per test based on stop rule. The figure shows the distribution of the number of items completed (x-axis labeled “number of items”) and their frequency (y-axis labeled “frequency”).
The two minor peaks observed at around 50 and 60 items correspond to the application of stop rules, such as SEM < 0.447 or SEM < 0.387, which marks the end of the test for many participants at these points. Items that show adequate fit to a particular IRT model can be assumed to tap into the construct as specified by the model (Chan et al., 2015), while items that show poor fit may measure a different dimension that is not captured by the model specified.
The stop-rule effectively controls standard error, allowing for reliable ability estimates around the 50th item in most cases, as shown in Figure 6. The dimensions display varying convergence rates in T-scores as more items are answered, with most dimensions stabilizing after approximately 50 to 70 items. For example, dimension SB shows slower T-score stabilization with an R-value of 0.558, indicating moderate reliability. However, dimension EL stabilizes more quickly and shows higher reliability with an R-value of 0.816, as evidenced by the narrower confidence bands and consistent T-scores earlier in the item sequence. Similarly, BK demonstrates strong reliability, with an R-value of 0.785.
Figure 6
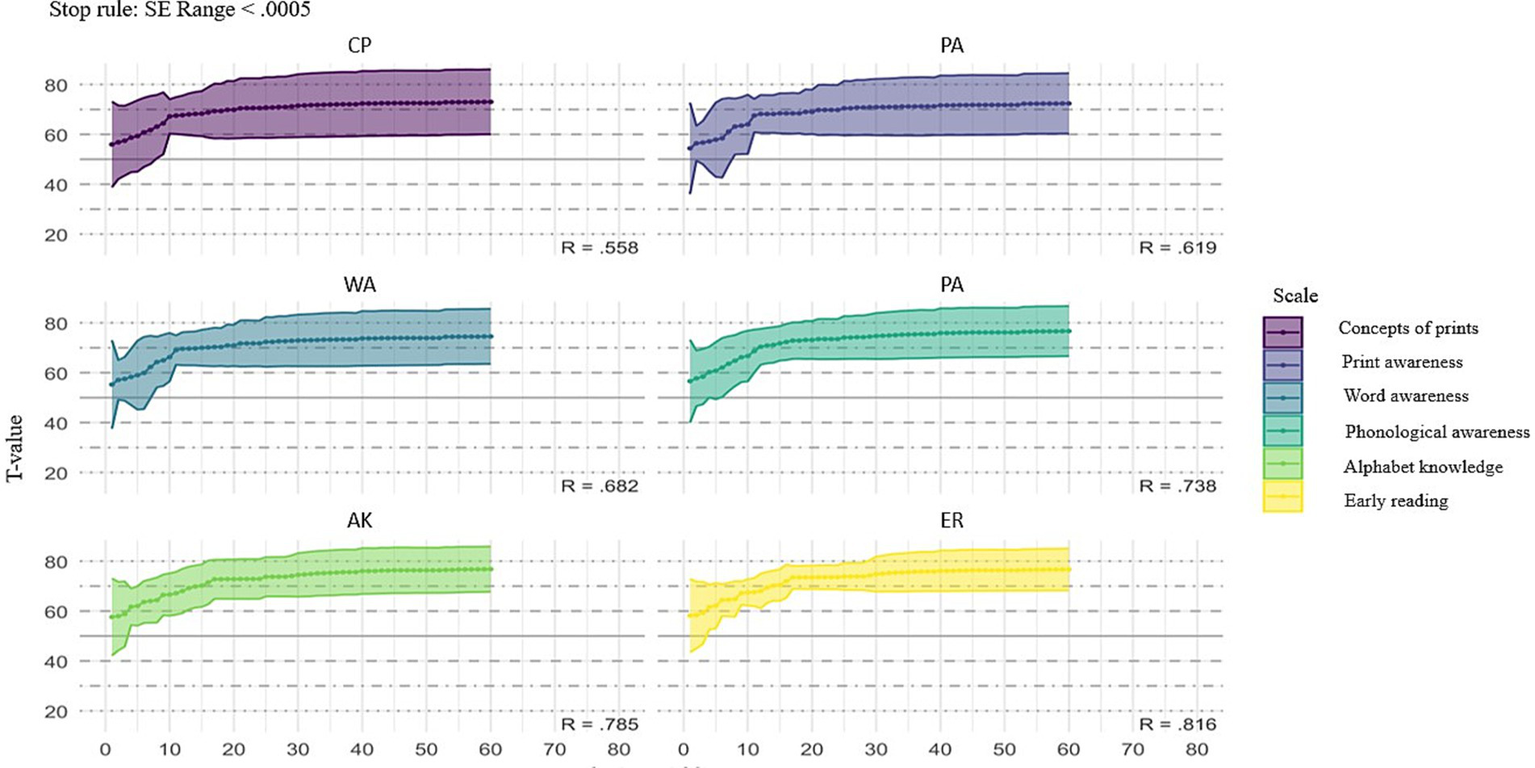
Test of t-scores across six scales using stop rule when standard errors (SE) < 0.0005. The solid lines represent the average t-scores, while the shaded areas indicate the standard error ranges.
3.3 Test–retest reliability
The stability of all measures over time was examined through a correlation analysis. T1 took place in Fall 2023, followed by T2 in Spring 2024. As shown in Table 7, which presents both within-time correlations and T1-T2 test–retest correlations, each measure demonstrated good reliability across the two time points. The strong correlations (p < 0.01) among literacy components suggest that these skills are highly interrelated, with each influencing or aligning closely with the others.
Table 7
| Pearson correlations | ||||||||||
|---|---|---|---|---|---|---|---|---|---|---|
| Variable | n | M | SD | 1 | 2 | 3 | 4 | 5 | 6 | T1-T2 |
| T1 | ||||||||||
| Concept of prints | 307 | 23.91 | 10.41 | – | 0.76* | |||||
| Print awareness | 307 | 12.12 | 3.86 | 0.61* | – | 0.71* | ||||
| Word awareness | 307 | 5.36 | 3.20 | 0.61* | 0.68* | – | 0.73* | |||
| Phonologic awareness | 307 | 18.91 | 4.27 | 0.51* | 0.53* | 0.55* | – | 0.64* | ||
| Alphabet knowledge | 307 | 19.57 | 9.14 | 0.53* | 0.45* | 0.48* | 0.57* | – | 0.88* | |
| Early reading | 307 | 7.14 | 9.05 | 0.49* | 0.39* | 0.40* | 0.53* | 0.86* | – | 0.77* |
| T2 | ||||||||||
| Concept of prints | 159 | 28.26 | 9.68 | – | – | |||||
| Print awareness | 159 | 13.77 | 3.56 | 0.64* | – | – | ||||
| Word awareness | 159 | 6.89 | 3.33 | 0.66* | 0.67* | – | – | |||
| Phonologic awareness | 159 | 20.77 | 4.45 | 0.56* | 0.56* | 0.59* | – | – | ||
| Alphabet knowledge | 159 | 21.27 | 8.61 | 0.57* | 0.49* | 0.61* | 0.60* | – | – | |
| Early reading | 159 | 8.61 | 8.86 | 0.50* | 0.42* | 0.56* | 0.53* | 0.84* | – | – |
Combined within-time & test–retest correlations of early literacy skills.
*p < 0.01.
4 Discussion
This study aimed to develop a conceptual framework for adaptive early literacy assessment tools using MCAT based on Item-Response Theory (IRT). Our findings will be discussed concerning two key points: the psychometric properties of the tablet-based assessment tool and its applications in early literacy education.
The results highlight the powerful psychometric properties of the EuLeApp©, which employs a Multidimensional Computerized Adaptive Testing (MCAT) methodology. The current distribution of item completion demonstrates the effectiveness of this adaptive mechanism (Keuning and Verhoeven, 2008), with most children completing the assessment after a variable number of items, reflecting its tailored nature. This approach ensures that the assessment dynamically adjusts to each child’s ability level, thereby improving the efficiency and precision of early literacy skill measurement. Simulation studies further indicate that the proposed method optimizes item selection, enhancing the accuracy of ability estimates by leveraging the CAT framework, which adjusts item difficulty based on a child’s performance. This adaptive approach yields a more individualized assessment, offering greater precision in measuring early literacy skills compared to traditional fixed-length tests. The method also considers test-taking participation in item selection, which is especially beneficial for children with lower ability levels, particularly in low-category (CAT) settings (Gorgun and Bulut, 2023). In sum, these findings have significant implications for measurement practices in adaptive testing (Weiss, 2004; Yen et al., 2012).
Additionally, while computerized adaptive testing (CAT) typically operates more effectively with simpler models such as the 1PL and 2PL, applying the 4PL model in this study presents areas that warrant further exploration. In this study, the 4PL-IRT model gave better results when using item parameters as an item pool and estimating children’s ability levels based on the entire test (183 items). As we mentioned before, one reason for this may be that children’s attention may decrease after the 10th minute of the test, which lasts approximately 20 min. A parameter that accounts for the probability of carelessness, modeling the chance of a correct answer even when the test child has, the 4PL model could better capture situations where children with sufficient ability to answer questions correctly fail due to a lack of attention or motivation. While the 4-Parameter Logistic (4PL) Model offers flexibility by accounting for guessing and the possibility of a high-performing test child not answering correctly, it may show a weak estimation of item difficulty or discrimination used for adaptive testing with Item Response Theory (IRT). However, to mitigate these challenges, many models have been tested in the calibration phase of the item parameters to ensure that the lower and upper asymptotes are estimated accurately and the items are carefully pre-calibrated. In addition, restrictions were applied to the parameter ranges or regularization techniques of the 4PL model to prevent overfitting and enhance the robustness of the parameter estimates. While these methods helped mitigate some potential issues, further research is necessary to clarify these adjustments’ impact more clearly. Specifically, future studies should explore how these restrictions influence the accuracy and stability of parameter estimates within the 4PL model, particularly in early literacy assessment contexts. Investigating the long-term effects of using the 4PL model across different populations and educational settings will provide greater insight into its practical value. Continued evaluation and iterative development of EuleApp© will allow for a more robust tool that meets the needs of both educators and young learners better, supporting more precise assessments of early literacy skills.
The EuLeApp© assessment tool has the potential to effectively identify children’s strengths and areas of weaknesses in early literacy development. Specifically, its adaptive, data-driven, and multidimensional framework may offer advantages over traditional methods in educational settings. The findings indicate that EuLeApp© can tailor assessments to each child’s individual ability levels through sophisticated item selection rules. This dynamic adjustment enables more precise and targeted literacy evaluations than traditional assessments, which typically do not modify item difficulty in response to a child’s performance during testing. Moreover, the present study has some important implications for screening children early for possible early reading-writing problems and dyslexia. The literature documents the relationship between early literacy skills and reading achievement well (Whitehurst and Lonigan, 1998; Justice et al., 2009; Jiménez et al., 2024) and highlights the potential for early monitoring of these skills (Catts et al., 2001; Neumann and Neumann, 2014). Additionally, other research has pointed out that early comprehensive and accurate assessments provide stronger predictions regarding dyslexia risk and later reading problems (Catts et al., 2001; Catts et al., 2015). However, studies have often been limited by digital assessment tools that focus only on one or two early literacy domains (e.g., Golinkoff et al., 2017; Jonathan Castañeda-Fernández et al., 2023; Neumann, 2018). Our findings showed that our more comprehensive screening app can identify children at risk for early literacy, which is crucial for later reading comprehension and school success, with acceptable level of accuracy. The potential of the EuleApp© to accurately measure literacy skills suggests that it could serve to identify children who may benefit from early interventions, thus mitigating the risks associated with dyslexia and other literacy challenges. It is important to note that children enter kindergarten with varying levels of language and cognitive skills, which are critical predictors of future reading success. In the standardization process of this assessment tool, our initial focus was on evaluating children with typical language development to establish baseline performance measures. In the next phase, further development of this screening tool is needed to ensure that children’s early literacy accurately distinguishes among diverse children. Overall, using the tool in this way in an early educational setting would be useful for both identifying literacy practices in everyday practice integration, enabling teachers to reflect on their practice, and monitoring progress.
In conclusion, the integration of adaptive, data-driven tools like the EuleApp© in educational settings not only addresses the need for precise assessments but also underscores the critical importance of proactive measures in supporting children’s literacy development. The results showed that the individual component scores exhibit adequate psychometric properties, including sufficient precision and validity, supporting the reliability of the assessment tool in measuring early literacy skills effectively.
5 Limitations
This study presents several limitations that should be acknowledged. One limitation of this research is the relatively small sample size. A larger number of participants would facilitate more precise calibration of item parameters and enhance the accuracy of ability estimates across diverse groups (Bjorner et al., 2007). Although the current sample size was sufficient to conduct the Computerized Adaptive Testing (CAT) analysis, employing a larger sample would improve the generalizability and robustness of the results. The findings of this study may also lack generalizability due to the limited diversity within the sample. This research was predominantly conducted with a German population and in the German language, which may not fully represent the experiences of children from diverse cultural, linguistic, or socioeconomic backgrounds. The composition of the sample, mainly consisting of participants from middle- and high-socioeconomic-status regions, may present a potential limitation regarding the interpretation of item parameters. In other words, due to their exposure to more literacy-rich environments, these children may have found certain items easier, potentially resulting in a ceiling effect. For instance, assessments of early phonemic awareness (Burt and Barbara Dodd, 1999), alphabet knowledge, or early reading skills (Bowey, 1995; Dolean et al., 2019) may have been less discriminatory for children with early literacy advantages.
Future studies should incorporate more varied samples by increasing the sample size and including participants from diverse cultural and socioeconomic backgrounds to enhance the current findings. Ensuring that all young children have the opportunity to develop proficiency in literacy skills is a key area of focus globally. Consequently, further research involving different populations is essential for exploring the broader applicability of the EuleApp© in various linguistic contexts and ensuring its effectiveness across diverse educational settings. In addition, the study’s design may limit the depth of insight into the effectiveness of the EuleApp© assessment tool. For instance, a cross-sectional design captures data at a single point in time, which may not adequately reflect the changes in children’s literacy skills over time. Longitudinal studies could provide more comprehensive insights into how children’s abilities develop and how effectively the tool tracks these changes.
Statements
Data availability statement
The raw data supporting the conclusions of this article will be made available by the authors, without undue reservation.
Ethics statement
The studies involving humans were approved by the Research Ethics Committee of the Carl von Ossietzky University of Oldenburg. The studies were conducted in accordance with the local legislation and institutional requirements. Written informed consent to participate in this study was provided by the participants or participants’ legal guardian/next of kin.
Author contributions
MY: Conceptualization, Formal analysis, Supervision, Writing – original draft, Writing – review & editing. CS: Investigation, Writing – review & editing. MM: Funding acquisition, Project administration, Writing – review & editing. HL: Writing – review & editing, Methodology, Formal analysis, Visualization, Software. TJ: Conceptualization, Funding acquisition, Project administration, Supervision, Writing – review & editing.
Funding
The author(s) declare that financial support was received for the research and/or publication of this article. This work was supported by the German Federal Ministry of Education and Research (BMBF) [grant number 01NV2105A].
Acknowledgments
We sincerely appreciate and thank all families, teachers, and children who participated in the study. We also thank our research assistants, who helped us collect data and insight during the research.
Conflict of interest
HL is the founder of DHL Data Science Seminars.
The remaining authors declare that the research was conducted in the absence of any commercial or financial relationships that could be construed as a potential conflict of interest.
Generative AI statement
The authors declare that no Gen AI was used in the creation of this manuscript.
Publisher’s note
All claims expressed in this article are solely those of the authors and do not necessarily represent those of their affiliated organizations, or those of the publisher, the editors and the reviewers. Any product that may be evaluated in this article, or claim that may be made by its manufacturer, is not guaranteed or endorsed by the publisher.
References
1
Ackerman T. A. Gierl M. J. Walker C. M. (2003). Using multidimensional item response theory to evaluate educational and psychological tests. Educ. Meas. Issues Pract.22, 37–51. doi: 10.1111/j.1745-3992.2003.tb00136.x
2
Adams M. J. (1994). Beginning to read: Thinking and learning about print.
3
Antoniou F. Ralli A. M. Mouzaki A. Diamanti V. Papaioannou S. (2022). Logometro®: the psychometric properties of a norm-referenced digital battery for language assessment of Greek-speaking 4–7 years old children. Front. Psychol.13:900600. doi: 10.3389/fpsyg.2022.900600
4
Anderson V. Levin H. S. Jacobs R. (2002). Executive functions after frontal lobe injury: A developmental perspective. J. Clin. Exp. Neuropsychol.24, 224–247. doi: 10.1207/S15327647JCD1201_02
5
Baker F. (2001). The basics of item response theory: ERIC clearinghouse on assessment and evaluation. College Park, MD: University of Maryland, ERIC Clearinghouse on Assessment and Evaluation.
6
Barton M. A. Lord F. M. (1981). An upper asymptote for the three-parameter logistic item-response model. ETS Research Report Series1981. doi: 10.1002/j.2333-8504.1981.tb01255.x
7
Best J. R. Miller P. H. (2010). A developmental perspective on executive function. Child Dev.81, 1641–1660. doi: 10.1111/j.1467-8624.2010.01499.x
8
Bjorner J. B. Chang C. H. Thissen D. Reeve B. B. (2007). Developing tailored instruments: item banking and computerized adaptive assessment. Qual. Life Res.16, 95–108. doi: 10.1007/s11136-007-9168-6
9
Bowey J. A. (1995). Socioeconomic status differences in preschool phonological sensitivity and first-grade reading achievement. J. Educ. Psychol.87, 476–487. doi: 10.1037/0022-0663.87.3.476
10
Brassard M. R. Boehm A. E. (2007). “Assessment of emotional development and behavior problems” in ed. B. A. Bracken. Preschool assessment: principles and practices. New York: Guilford Press. 508–576.
11
Brown A. T. (2015). Confirmatory factor analysis for applied research. 2nd Edn. New York: The Guilford Press.
12
Buckingham J. Wheldall K. Beaman-Wheldall R. (2013). Why poor children are more likely to become poor readers: the school years. Aust. J. Educ.57, 190–213. doi: 10.1177/0004944113495500
13
Bulut O. Cormier D. C. (2018). Validity evidence for progress monitoring with star reading: slope estimates, administration frequency, and number of data points. Front. Educ.3:68. doi: 10.3389/feduc.2018.00068
14
Burt A. H. Barbara Dodd L. (1999). Phonological awareness skills of 4-year-old British children: an assessment and developmental data. Int. J. Lang. Commun. Disord.34, 311–335. doi: 10.1080/136828299247432
15
Bruder I . (1993). Alternative assessment: Putting technology to the test. Electronic Learning, 12, 22–23.
16
Campbell C. Jane B. (2012). Motivating children to learn: the role of technology education. Int. J. Technol. Des. Educ.22, 1–11. doi: 10.1007/s10798-010-9134-4
17
Care E. Kim H. Vista A. Anderson K. (2018). Education system alignment for 21st century skills: Focus on assessment. Washington, DC: Center for Universal Education at The Brookings Institution.
18
Carson K. Boustead T. Gillon G. (2015). Content validity to support the use of a computer-based phonological awareness screening and monitoring assessment (com PASMA) in the classroom. Int. J. Speech Lang. Pathol.17, 500–510. doi: 10.3109/17549507.2015.1016107
19
Castañeda-Fernández J. Neira-Piñeiro M. R. López-Bouzas N. del-Moral-Pérez M. E. (2023). Empirical validation of the Oral Narrative Competence Evaluation with the TellingApp (ONCE) Scale in early childhood. Int. J. Child-Comput. Interact.36, 100580. doi: 10.1016/j.ijcci.2023.100580
20
Catts H. W. Fey M. E. Tomblin J. B. Zhang X. (2002). A longitudinal investigation of reading outcomes in children with language impairments. J. Speech Lang. Hear. Res.45, 1142–1157. doi: 10.1044/1092-4388(2002/093)
21
Catts H. W. Fey M. E. Zhang X. Tomlin J. B. (2001). Estimating the risk of future reading difficulties in kindergarten children: a research-based model and its clinical implementation. Lang. Speech. Hear. Serv. Sch.32, 38–50. doi: 10.1044/0161-1461(2001/004)
22
Catts H. W. Nielsen D. C. Bridges M. S. Liu Y. S. Bontempo D. E. (2015). Early identification of reading disabilities within an RTI framework. J. Learn. Disabil.48, 281–297. doi: 10.1177/0022219413498115
23
Chan K. S. Gross A. L. Pezzin L. E. Brandt J. Kasper J. D. (2015). Harmonizing measures of cognitive performance across international surveys of aging using item response theory. J. Aging Health. 27, 1392–1414. doi: 10.1177/0898264315583054
24
Chalmers R. P. (2015) mirtCAT: computerized adaptive testing with multidimensional item response theory. R package version 0.6, 1.
25
Chalmers R. P. (2016). Generating adaptive and non-adaptive test interfaces for multidimensional item response theory applications. J. Stat. Softw.71, 1–39. doi: 10.18637/jss.v071.i05
26
Chaney C. (1994). Language development, metalinguistic awareness, and emergent literacy skills of 3-year-old children in relation to social class. Appl. Psycholinguist.15, 371–394. doi: 10.1017/S0142716400004501
27
Chen F. F. West S. G. Sousa K. H. (2006). A comparison of bifactor and second-order models of quality of life. Multivar. Behav. Res.41, 189–225. doi: 10.1207/s15327906mbr4102_5
28
Davey A. (2005). Issues in evaluating model fit with missing data. Struct. Equ. Model.12, 578–597. doi: 10.1207/s15328007sem1204_4
29
Dolean D. Melby-Lervåg M. Tincas I. Damsa C. Lervåg A. (2019). Achievement gap: socioeconomic status affects reading development beyond language and cognition in children facing poverty. Learn. Instr.63:101218. doi: 10.1016/j.learninstruc.2019.101218
30
Dunn K. J. McCray G. (2020). The place of the bifactor model in confirmatory factor analysis investigations into construct dimensionality in language testing. Front. Psychol.11:1357. doi: 10.3389/fpsyg.2020.01357
31
Ebenbeck N. Gebhardt M. (2022). Simulating computerized adaptive testing in special education based on inclusive progress monitoring data. Front. Educ.7:945733. doi: 10.3389/feduc.2022.945733
32
Ebenbeck N. Gebhardt M. (2024). Differential performance of computerized adaptive testing in students with and without disabilities–a simulation study. J. Spec. Educ. Technol.39, 481–490. doi: 10.1177/01626434241232117
33
Elimelech A. Aram D. (2020). Using a digital spelling game for promoting alphabetic knowledge of preschoolers: the contribution of auditory and visual supports. Read. Res. Q.55, 235–250. doi: 10.1002/rrq.264
34
Engel S. (1995). The stories children tell: Making sense of the narratives of childhood. New York: Henry Holt and Company.
35
European Commission (2023) ‘Germany: Early childhood education and care’. Available online at: https://eurydice.eacea.ec.europa.eu/national-education-systems/germany/educational-guidelines (Accessed October 30, 2024).
36
Gee J. P. (2012). “What is literacy?” in eds. SimpsonJ.MayrA.JonesE.. Language and linguistics in context (London: Routledge), 257–264.
37
Golinkoff R. M. De Villiers J. G. Hirsh-Pasek K. Iglesias A. Wilson M. S. Morini G. et al . (2017). User's manual for the quick interactive language screener (QUILS): A measure of vocabulary, syntax, and language acquisition skills in young children. Baltimore, MD: Paul H. Brookes Publishing Company.
38
Gonski D. Arcus T. Boston K. Gould V. Johnson W. O’Brien L. et al . (2018). Through growth to achievement: Report of the review to achieve educational excellence in Australian schools. Canberra: Commonwealth of Australia.
39
Gorgun G. Bulut O. (2023). Incorporating test-taking engagement into the item selection algorithm in low-stakes computerized adaptive tests. Large-Scale Assess. Educ.11:27. doi: 10.1186/s40536-023-00177-5
40
Haladyna T. M. (2013). Developing and validating test items. London: Routledge.
41
Halliday S. E. Calkins S. D. Leerkes E. M. (2018). Measuring preschool learning engagement in the laboratory. J. Exp. Child Psychol.167, 93–116. doi: 10.1016/j.jecp.2017.10.006
42
He L. Min S. (2017). Development and validation of a computer adaptive EFL test. Lang. Assess. Q.14, 160–176. doi: 10.1080/15434303.2016.1162793
43
Hindman A. H. Morrison F. J. Connor C. M. Connor J. A. (2020). Bringing the science of reading to preservice elementary teachers: tools that bridge research and practice. Read. Res. Q.55, S197–S206. doi: 10.1002/rrq.345
44
Hirsh-Pasek K. Zosh J. M. Golinkoff R. M. Gray J. H. Robb M. B. Kaufman J. (2015). Putting education in “educational” apps: lessons from the science of learning. Psychol. Sci. Public Interest16, 3–34. doi: 10.1177/1529100615569721
45
Ho J. C. S. McBride C. Lui K. F. H. Łockiewicz M. (2024). WordSword: an efficient online word Reading assessment for global English. Assessment31, 875–891. doi: 10.1177/10731911231194971
46
Jiménez M. V. Yumus M. Schiele T. Mues A. Niklas F. (2024). Preschool emergent literacy skills as predictors of reading and spelling in grade 2 and the role of migration background in Germany. J. Exp. Child Psychol.244:105927. doi: 10.1016/j.jecp.2024.105927
47
Justice L. M. Ezell H. K. (2001). Word and print awareness in 4-year-old children. Child Lang. Teach. Ther.17, 207–225. doi: 10.1177/026565900101700303
48
Justice L. M. Invernizzi M. A. Meier J. D. (2002). Designing and implementing an early literacy screening protocol. Lang. Speech Hear. Serv. Sch.33, 84–101. doi: 10.1044/0161-1461(2002/007)
49
Justice L. M. Kaderavek J. N. Fan X. Sofka A. Hunt A. (2009). Accelerating preschoolers' early literacy development through classroom-based teacher–child storybook reading and explicit print referencing. Lang. Speech Hear. Serv. Sch.40, 67–85. doi: 10.1044/0161-1461(2008/07-0098)
50
Keuning J. Verhoeven L. (2008). Spelling development throughout the elementary grades: the Dutch case. Learn. Individ. Differ.18, 459–470. doi: 10.1016/j.lindif.2007.12.001
51
Lee Y. H. Jia Y. (2014). Using response time to investigate students' test-taking behaviors in a NAEP computer-based study. Large-Scale Assess. Educ.2, 1–24. doi: 10.1186/s40536-014-0008-1
52
Levine D. A. Duncan P. W. Nguyen-Huynh M. N. Ogedegbe O. G. (2020). Interventions targeting racial/ethnic disparities in stroke prevention and treatment. Stroke. doi: 10.1161/STROKEAHA.120.030427
53
Liao Z. Y. Jian F. Long H. Lu Y. Wang Y. Yang Z. et al . (2012). Validity assessment and determination of the cutoff value for the Index of Complexity, Outcome and Need among 12–13 year-olds in Southern Chinese. Int J Oral Sci4, 88–93. doi: 10.1038/ijos.2012.24
54
Magis D. Barrada J. R. (2017). Computerized adaptive testing with R: recent updates of the package catR. J. Stat. Softw.76, 1–19. doi: 10.18637/jss.v076.c01
55
Magis D. Raîche G. (2012). Random generation of response patterns under computerized adaptive testing with the R package catR. J. Stat. Softw.48, 1–31. doi: 10.18637/jss.v048.i08
56
Marsh J. Plowman L. Yamada-Rice D. Bishop J. Scott F. (2020). “Digital play: a new classification” in eds. StephenC.EdwardsS.. Digital play and Technologies in the Early Years (London: Routledge), 20–31.
57
Maydeu-Olivares A. (2013). Goodness-of-fit assessment of item response theory models. Meas. Interdiscip. Res. Perspect.11, 71–101. doi: 10.1080/15366367.2013.831680
58
McArthur G. M. Filardi N. Francis D. A. Boyes M. E. Badcock N. A. (2020). Self-concept in poor readers: a systematic review and meta-analysis. PeerJ8:e8772. doi: 10.7717/peerj.8772
59
McElvany N. Lorenz R. Frey A. Goldhammer F. Schilcher A. Stubbe T. C. (Eds.) (2023). IGLU 2021: Lesekompetenz von Grundschulkindern im internationalen Vergleich und im Trend über 20 Jahre. Münster, Germany: Waxmann Verlag.
60
McLachlan C. Fleer M. Edwards S. (2018). Early childhood curriculum: Planning, assessment and implementation. Cambridge: Cambridge University Press.
61
Meijer R. R. Nering M. L. (1999). Computerized adaptive testing: overview and introduction. Appl. Psychol. Meas.23, 187–194. doi: 10.1177/01466219922031310
62
Meindl M. Jungmann T. (2019). Erzähl- und Lesekompetenzen erfassen bei vier- bis fünfjährigen Kindern (EuLe 4–5). Göttingen: Hogrefe.
63
Morrow L. M. (2007). Developing literacy in preschool. New York: The Guilford Press.
64
Nagy W. E. Anderson R. C. (1995) Metalinguistic awareness and literacy acquisition in different languages. Center for the Study of Reading Technical Report; no. 618.
65
Nelson P. M. Van Norman E. R. Klingbeil D. A. Parker D. C. (2017). Progress monitoring with computer adaptive assessments: the impact of data collection schedule on growth estimates. Psychol. Sch.54, 463–471. doi: 10.1002/pits.22015
66
Neumann M. M. (2018). Using tablets and apps to enhance emergent literacy skills in young children. Early Child. Res. Q.42, 239–246. doi: 10.1016/j.ecresq.2017.10.006
67
Neumann M. M. Anthony J. L. Erazo N. A. Neumann D. L. (2019) ‘Assessment and technology: mapping future directions in the early childhood classroom’, in Front. Educ.4, p. 116. doi: 10.3389/feduc.2019.00116
68
Neumann M. M. Neumann D. L. (2014). Touch screen tablets and emergent literacy. Early Childhood Educ. J.42, 231–239. doi: 10.1007/s10643-013-0608-3
69
OECD (2013) Synergies for better learning: An international perspective on evaluation and assessment, OECD Reviews of Evaluation and Assessment in Education. Available online at: https://dx.doi.org/10.1787/9789264190658-en (accessed October 30, 2024).
70
OECD . (2015) Students, computers and learning: Making the connection. PISA. Available online at: https://doi.org/10.1787/9789264239555-en (accessed October 30, 2024)
71
Petermann F. (2018). SET 5–10. Sprachstandserhebungstest für Kinder im Alter zwischen 5 und 10 Jahren. Göttingen: Hogrefe.
72
Petermann F. Rißling J.-K. Metzer J. (2016). SET 3–5. Sprachstandserhebungstest für Kinder im Alter zwischen 3 und 5 Jahren, vol. 48. Göttingen: Hogrefe, 69–79.
73
Piasta S. B. Justice L. M. McGinty A. S. Kaderavek J. N. (2012). Increasing young children’s contact with print during shared reading: longitudinal effects on literacy achievement. Child Dev.83, 810–820. doi: 10.1111/j.1467-8624.2012.01754.x
74
Raymond M. R. Stevens C. Bucak S. D. (2019). The optimal number of options for multiple-choice questions on high-stakes tests: application of a revised index for detecting nonfunctional distractors. Adv. Health Sci. Educ.24, 141–150. doi: 10.1007/s10459-018-9855-9
75
Roberts J. S. Donoghue J. R. Laughlin J. E. (2000). A general item response theory model for unfolding unidimensional polytomous responses. Appl. Psychol. Meas.24, 3–32. doi: 10.1177/01466216000241001
76
Robitzsch A. (2022). Four-parameter guessing model and related item response models. Math. Comput. Appl.27:95. doi: 10.3390/mca27060095
77
Schildkamp K. Kuiper W. (2010). Data-informed curriculum reform: which data, what purposes, and promoting and hindering factors. Teach. Teach. Educ.26, 482–496. doi: 10.1016/j.tate.2009.06.007
78
Segall D. O. (2009). “Principles of multidimensional adaptive testing” in eds. van der LindenW. J.GlasC. A. W.. Elements of adaptive testing (New York, NY: Springer), 57–75.
79
Sharkey N. S. Murnane R. J. (2006). Tough choices in designing a formative assessment system. Am. J. Educ.112, 572–588. doi: 10.1086/505060
80
Shaywitz S. E. (1998). Dyslexia. N. Engl. J. Med.338, 307–312. doi: 10.1056/NEJM199801293380507
81
Sideridis G. D. Tsaousis I. Al-Sadaawi A. (2018). Assessing construct validity in math achievement: an application of multilevel structural equation modeling (MSEM). Front. Psychol.9:1451. doi: 10.3389/fpsyg.2018.01451
82
Snow C. E. (2020). The science of early literacy development: Insights from research on reading acquisition. Cambridge, MA: Harvard University Press.
83
Snow C. E. Dickinson D. K. (1991). “Skills that aren't basic in a new conception of literacy” in eds. PearsonP. D.BarrR.KamilM.. The handbook of literacy research (New York, NY: Routledge), 200–222.
84
Snow C. E. Van Hemel S. B. (2008). Early childhood assessment: Why, what, and how. Washington, DC: The National Academies Press.
85
Templin J. Henson R. A. (2010). Diagnostic measurement: Theory, methods, and applications. New York, NY: Guilford Press.
86
Tomasik M. J. Berger S. Moser U. (2018). On the development of a computer-based tool for formative student assessment: epistemological, methodological, and practical issues. Front. Psychol.9:2245. doi: 10.3389/fpsyg.2018.02245
87
Vygotsky L. S. (1978). Mind in society: The development of higher psychological processes. Harvard University Press. vol. 86.
88
Weiss D. J. (1982). Improving measurement quality and efficiency with adaptive testing. Appl. Psychol. Meas.6, 473–492. doi: 10.1177/014662168200600408
89
Weiss D. J. (2004). Computerized adaptive testing for effective and efficient measurement in counseling and education. Meas. Eval. Couns. Dev.37, 70–84. doi: 10.1080/07481756.2004.11909751
90
Weiss D. J. Kingsbury G. G. (1984). Application of computerized adaptive testing to educational problems. J. Educ. Meas.21, 361–375. doi: 10.1111/j.1745-3984.1984.tb01040.x
91
Whitehurst G. J. Lonigan C. J. (1998). Child development and emergent literacy. Child Dev.69, 848–872. doi: 10.1111/j.14678624.1998.tb06247.x
92
Wise S. L. (2014). The utility of adaptive testing in addressing the problem of unmotivated examinees. J. Comput. Adapt. Test.2, 1–17. doi: 10.7333/jcat.v2i0.30
93
Wise S. L. Kong X. (2005). Response time effort: a new measure of examinee motivation in computer-based tests. Appl. Meas. Educ.18, 163–183. doi: 10.1207/s15324818ame1802_2
94
Wolf E. J. Harrington K. M. Clark S. L. Miller M. W. (2013). Sample size requirements for structural equation models: an evaluation of power, bias, and solution propriety. Educ. Psychol. Meas.73, 913–934. doi: 10.1177/0013164413495237
95
Yao L. (2013). Comparing the performance of five multidimensional CAT selection procedures with different stopping rules. Appl. Psychol. Meas.37, 3–23. doi: 10.1177/0146621612455687
96
Yen Y. C. Ho R. G. Laio W. W. Chen L. J. Kuo C. C. (2012). An empirical evaluation of the slip correction in the four parameter logistic models with computerized adaptive testing. Appl. Psychol. Meas.36, 75–87. doi: 10.1177/0146621611432862
Summary
Keywords
early literacy, digital assessment, preschool age, item response theory, computerized adaptive test, psychometric validation
Citation
Yumus M, Stuhr C, Meindl M, Leuschner H and Jungmann T (2025) EuleApp©: a computerized adaptive assessment tool for early literacy skills. Front. Psychol. 16:1522740. doi: 10.3389/fpsyg.2025.1522740
Received
04 November 2024
Accepted
28 February 2025
Published
25 April 2025
Volume
16 - 2025
Edited by
Ioannis Tsaousis, National and Kapodistrian University of Athens, Greece
Reviewed by
Kelvin Fai Hong Lui, Lingnan University, Hong Kong SAR, China
Penelope Collins, University of California, Irvine, United States
Guher Gorgun, University of Kiel, Germany
Updates
Copyright
© 2025 Yumus, Stuhr, Meindl, Leuschner and Jungmann.
This is an open-access article distributed under the terms of the Creative Commons Attribution License (CC BY). The use, distribution or reproduction in other forums is permitted, provided the original author(s) and the copyright owner(s) are credited and that the original publication in this journal is cited, in accordance with accepted academic practice. No use, distribution or reproduction is permitted which does not comply with these terms.
*Correspondence: Melike Yumus, melike.yumus@uni-oldenburg.de
Disclaimer
All claims expressed in this article are solely those of the authors and do not necessarily represent those of their affiliated organizations, or those of the publisher, the editors and the reviewers. Any product that may be evaluated in this article or claim that may be made by its manufacturer is not guaranteed or endorsed by the publisher.