Abstract
Objective:
This study aims to explore the prevalence of depression in older adults with chronic diseases and to identify heterogeneous subgroups within this population. Additionally, we seek to investigate the influencing factors associated with depressive conditions among older adults. This study aims to provide a foundational reference for the development of targeted intervention programs.
Methods:
This study utilized data from the 2018 China Health and Aging Tracking Survey (CHARLS), including 5,878 older adults with chronic diseases. We explored potential categories of depression among these individuals through latent profile analysis. Additionally, one-way chi-square tests and one-way ANOVA were employed for single factor, while multi-factor correlation was identified via multinomial logistic regression analysis.
Results:
A total of 5,878 older adults with chronic diseases were included in this study. The participants were categorized into four groups: low level (1,904; 32.4%), low level with high despair (304; 5.2%), medium level (2,963; 50.4%), and high level (707; 12.0%). Univariate analysis of variance revealed significant differences among all variables, except for the presence of only one child. In comparison to the low level group (i.e., control group), the factors influencing the high level group included anxiety, instrumental activities of daily living (IADL), living alone, self-assessment of current life and health, exercise, activity limitation, financial self-assessment, and marital status. For the medium level group significant factors included anxiety, living alone, health self-evaluation, alcohol use, exercise, and activity limitation. Influential factors for the low level with high despair group include health self-evaluation, exercise, engagement in regular physical labor, and economic self-assessment.
Limitations:
The CES-D-10 scale may not fully capture the presence of depression in older adults with high levels of chronic illness.
Conclusion:
Depression in older adults with chronic illnesses, stemming from both physical and psychological factors, can significantly impact their overall health status. Therefore, it is essential to provide more targeted healthcare services tailored to the diverse needs of this population in future community health initiatives. Such approaches aim to improve depressive symptoms and enhance the quality of life for older adults.
1 Introduction
Chronic diseases pose a significant burden on global health. Currently, chronic diseases account for over 36 million deaths worldwide, representing three-fifths of all fatalities, making them a critical public health issue that affects the global economy (World Health Organization, 2014). In China, which has the largest elderly population over the age of 60, approximately 180 million (75%) individuals suffer from chronic diseases (Huang et al., 2019). According to China’s medium- and long-term plan for the Prevention of Chronic Diseases (2017–2025), these conditions primarily include cardiovascular and cerebrovascular diseases, diabetes, chronic respiratory diseases such as chronic obstructive pulmonary disease, and others.
The prevalence of chronic diseases among the elderly not only significantly impacts their quality of life but also leads to psychological disturbances. Older adults with chronic illnesses may experience adverse psychological states, including depression and anxiety, particularly in high-stress situations. Compared to the general population, the elderly face a higher prevalence of chronic diseases and are more psychologically vulnerable. Research indicates that older adults with chronic conditions may experience anxiety and depression due to economic factors, psychological stress, and poor self-management capabilities, which can adversely affect daily life and hinder effective treatment and recovery (Hao et al., 2025).
Therefore, it is essential to assess the mental health status of older adults with chronic diseases, identify influencing factors, and provide targeted interventions to improve their psychological well-being, thereby promoting active aging. However, many previous studies have assessed psychological states based solely on total scores, typically reporting results as “yes” or “no” regarding depression or poor psychological health, which fails to account for the heterogeneity of psychological distress (Ghiggia et al., 2022). This one-dimensional assessment overlooks the individual differences among older adults with chronic diseases.
This study aims to explore the characteristics of psychological distress in older adults with chronic diseases using latent profile analysis (LPA), clarifying the relationship between latent categories of depressive states and their influencing factors. LPA is a person-centered approach, in contrast to variable-centered methods. Recent studies have utilized LPA to examine depressive states among older adults. For instance, Wang S. et al. (2023) conducted a latent profile analysis of cognitive functioning and depressive symptoms in Chinese older adults, identifying four subgroups related to cognitive impairment and depressive status: mild cognitive impairment, moderate cognitive impairment, mild cognitive impairment combined with depression, and moderate cognitive impairment combined with depression. This approach allows for a clearer understanding of the differences among subgroups within the study population.
Despite the insights from existing studies, there have been no reports applying LPA to investigate the depressive status of older adults with chronic diseases. Therefore, this study will utilize LPA to identify depressive subtypes in this population, clarify the relationship between each influencing factor and the potential categories of depression, and compare the differences in depressive statuses among these categories. Although existing research has confirmed the association between chronic diseases and depression, current studies still exhibit several limitations: First, most investigations treat depression as a single research issue, overlooking its heterogeneity and failing to identify subtypes with distinct clinical characteristics and prognoses (Ye et al., 2025). Second, large-scale, population-based studies targeting elderly individuals with chronic diseases in Chinese communities remain scarce. Furthermore, the application of advanced statistical methods such as latent class analysis in this field remains insufficient (Xin et al., 2025). The goal is to provide specific intervention recommendations in future studies to enhance the quality of life for older adults.
2 Measurement and methods
2.1 Sample
The data for this study was sourced from the China Health and Aging Tracking Survey (CHARLS), which includes survey results from 113,000 households collected between 1998 and 2018. This comprehensive survey has been conducted eight times across 23 regions, including provinces (autonomous regions), municipalities, and counties in China. Utilizing various methodologies, CHARLS provides a multifaceted assessment of the health status of older adults, making the data both representative and widely recognized by scholars both domestically and internationally. All research participants voluntarily signed informed consent forms. After removing private information, the data became available for free through the Peking University Open Research Data Platform.1
In this study, we focused on older adults with chronic diseases from the CHARLS 2018 dataset (Center for Healthy Aging and Development Research, Peking University, 2020). During the review process, we encountered significant missing data. After screening and excluding samples with missing information, we retained a total of 5,878 samples as the final study population. The screening process is illustrated in Figure 1.
Figure 1
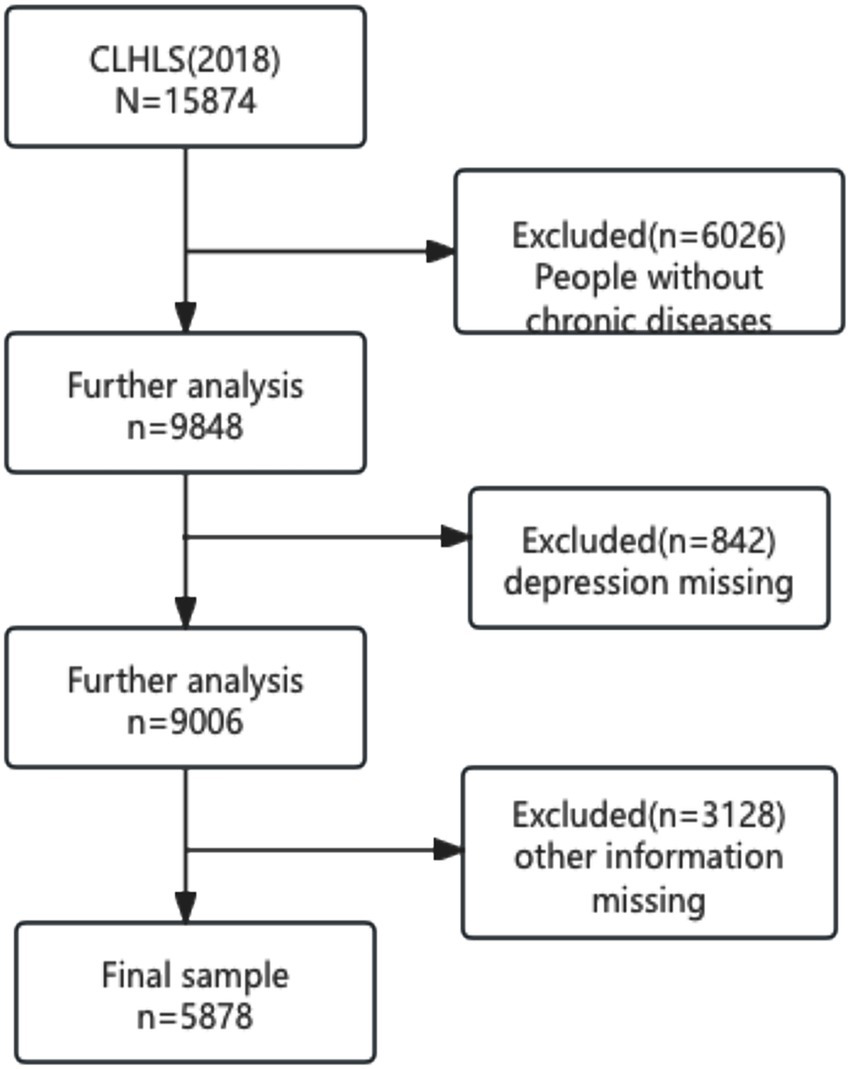
Flow chart of sample selection.
2.2 Measurement
2.2.1 Depression assessment
The CHARLS utilized the 10-item short version of the Center for Epidemiological Studies Depression Scale (CES-D) (Andresen et al., 1994) to assess respondents’ depression status. In this scale, items 5 and 8, which state “I am hopeful for the future” and “I am happy,” are considered positive indicators, while the remaining eight items are negative indicators. Responses to each item are categorized as “rarely or not at all,” “not too much,” “sometimes or half the time,” and “most of the time,” with corresponding scores of 0, 1, 2, and 3 assigned. For positive items, the scoring is reversed. The total score is the sum of all 10 items, with higher scores indicating more severe levels of depression. In this study, the Cronbach’s alpha coefficient for the depression scale was 0.823, demonstrating good reliability and validity.
2.2.2 Demographic information
This study included the following variables based on a review of preliminary literature and basic information from the CHARLS questionnaire: (1) Demographic information: age, gender, current residence status, marital status, whether the individual lives alone, and the number of children; (2) Socio-economic information: years of education, self-assessment of life satisfaction, and self-assessment of economic status; and (3) Healthcare information: self-assessment of health status, smoking habits, alcohol consumption, exercise frequency, enjoyment of retirement policies, activity limitations due to health problems, and regular engagement in physical labor. These variables are summarized in Table 1.
Table 1
| Variables | Assignment mode |
|---|---|
| Gender | 1 = male; 2 = female |
| Age | 1 = 60–69; 2 = 70–79; 3 = 80–89; 4 = ≥90 |
| Residence | 1 = city; 2 = town; 3 = rural |
| Marital status | 0 = no spouse;1 = have a spouse |
| Education level | 0 = none;1 = 0 to 6 years;2 = ≥7 years |
| Smoke | 1 = yes; 2 = no |
| Drink | 1 = yes; 2 = no |
| Exercise | 1 = yes; 2 = no |
| Live alone | 1 = no;2 = yes |
| only one child | 0 = no;1 = yes |
| Self evaluation of life | 1 = good; 2 = fair; 3 = bad |
| Self-rated | 1 = good; 2 = fair; 3 = bad |
| Economic situation | 1 = good; 2 = fair; 3 = bad |
| Enjoy retirement system | 0 = no;1 = yes |
| Limited in activities | 1 = strongly limited; 2 = limited; 3 = no |
| Physical labor | 1 = yes; 2 = no |
| IADL | Measured value |
| Anxiety | Measured value |
Case of variable assignment.
2.2.3 Anxiety assessment
CHARLS employed the 7-item Generalized Anxiety Disorder Scale (GAD-7) to evaluate anxiety symptoms. Each item is scored as follows: 0 for no occurrence in the past 2 weeks, 1 for occurrence on several days, 2 for occurrence more than half the days, and 3 for occurrence nearly every day. A higher total score indicates a more severe anxiety state. The GAD-7 demonstrated good reliability, with a Cronbach’s alpha of 0.895 (Dhira et al., 2021).
2.2.4 Assessment of activities of daily living
The assessment of instrumental activities of daily living (IADL) in CHARLS consists of eight items, such as the ability to visit a neighbor, shop alone, cook, and do laundry. Each item is scored as follows: 1 for independence, 2 for some difficulty, and 3 for inability. A higher total score indicates greater impairment in performing daily activities (Xiang et al., 2018). The IADL scale exhibited excellent reliability with a Cronbach’s alpha coefficient of 0.936.
2.3 Statistical analysis
2.3.1 Control and test for common method bias
To address potential common method bias from using the same measurement environment or item context, this study employed the Harman one-factor method. If the number of factors with eigenvalues greater than 1 is fewer than the critical criterion of 40% variance explained by the first factor, serious common method bias is not present (Podsakoff et al., 2003).
2.3.2 Descriptive analysis
Statistical analyses were performed using SPSS 26. Chi-square tests and ANOVA were utilized for comparisons between categories, while logistic regression was applied for multifactorial analysis, using a significance level of α = 0.05.
2.3.3 Missing data handling
Prior to latent profile analysis, this study employed a combination of listwise deletion and missing pattern testing for missing data: First, the missing rates for all core variables (CES-D total score and item scores, number of chronic conditions, self-rated health status, etc.) and covariates were calculated. Results showed that the missing rate for all key variables was <5%; Second, Little’s MCAR test determined the missing data type. The test result (p = 0.23 > 0.05) indicated the data exhibited missing completely at random (MCAR) characteristics; Third, given the low missing rate and MCAR compliance, listwise deletion was applied to exclude samples with missing key variables, ultimately yielding 5,878 valid cases; Fourth, to validate the robustness of the missing data handling approach, multiple imputation (set imputation cycles = 20) was additionally applied to missing values, and latent profile analysis was repeated. The results were consistent with those from listwise deletion, confirming that the missing data treatment did not affect the core conclusions.
2.3.4 Latent profile analysis
Latent profile analysis (LPA) was conducted using the CES-D-10 scale as an observational indicator, with Mplus software facilitating the analysis. Starting from an initial single-category model, the number of categories was incrementally increased to identify the optimal model. Model fit was assessed using the Akaike information criterion (AIC), Bayesian information criterion (BIC), and sample-corrected Bayesian information criterion (aBIC), with smaller values indicating better fit. The entropy value, ranging from 0 to 1, measured classification accuracy, with values closer to 1 indicating higher accuracy (≥0.8 suggests over 90% accuracy). Likelihood ratio test metrics, including Roe–Mondale–Reuben corrected likelihood ratios and Bootstrap-based likelihood ratios, were employed to compare model fit, with p < 0.05 indicating that a model with k categories outperformed one with k-1 categories (Lin et al., 2025).
Model comparison results indicate that AIC, BIC, and aBIC values progressively decrease from Model 1 to Model 5. Both BLRT and LMRT tests yield p < 0.001, suggesting that increasing the number of categories theoretically improves model fit. However, Model 4 exhibits the highest entropy value (0.841) among all category models, achieving optimal classification accuracy. Furthermore, all category proportions are ≥5.2%, indicating sufficient sample size and robust parameter estimation. Although the 5-category model showed marginally better fit metrics than the 4-category model, it contained an extremely small category (2.5%) with insufficient sample size to reliably estimate the distribution characteristics of core variables. This increases the risk of model overfitting, and the newly added category lacks independent clinical significance and interpretability. In conclusion, the 4-category model was ultimately determined as the optimal latent profile model in this study.
2.3.5 Association analysis between covariates and latent categories
A two-step approach is employed to address the association between covariates and latent categories: ① Step 1 constructs a baseline LPA model without covariates to identify latent categories based purely on depression symptom heterogeneity; ② After determining the optimal 4-class baseline model, incorporate demographic, health-related, and socioeconomic covariates as predictors into a multinomial logistic regression model. Using the most common latent category as the reference group, analyze the influence of each covariate on depression subtype assignment, calculating odds ratios (OR) and 95% confidence intervals (CI).
3 Results
3.1 Demographic information
This study included a total of 5,878 subjects, all older adults with chronic diseases. The analysis revealed a predominance of females among those with high levels of depression, primarily within the age range of 70 to 80 years. Older adults with chronic diseases residing in rural areas exhibited higher levels of depression compared to their counterparts living in urban settings. Interestingly, chronically ill individuals who smoke and consume alcohol demonstrated lower levels of depression than those who abstain from these activities. Furthermore, older adults without partners and living alone showed higher levels of depression. Detailed statistical information regarding the remaining demographic variables is provided in Table 2.
Table 2
| Variables | N (%) | Low-level | Low level-high despair | Medium level | High level | χ 2/F | p |
|---|---|---|---|---|---|---|---|
| Gender | 77.082 | <0.001 | |||||
| Male | 2,724 (46.3) | 996 | 159 | 132 | 241 | ||
| Female | 3,154 (53.7) | 908 | 145 | 1,635 | 466 | ||
| Age | 34.362 | <0.01 | |||||
| 60–69 | 793 (13.5) | 292 | 38 | 387 | 76 | ||
| 70–79 | 1,777 (30.2) | 638 | 91 | 851 | 197 | ||
| 80–89 | 1,650 (28.1) | 491 | 85 | 854 | 220 | ||
| ≥90 | 1,658 (28.2) | 483 | 90 | 871 | 214 | ||
| Residence | 29.583 | <0.01 | |||||
| City | 1,880 (32) | 680 | 92 | 911 | 197 | ||
| Town | 1,758 (29.9) | 538 | 99 | 869 | 252 | ||
| Rural | 2,240 (38.1) | 686 | 113 | 1,183 | 258 | ||
| Marital status | 84.736 | <0.001 | |||||
| No spouse | 2,937 (49.9) | 821 | 143 | 1,531 | 422 | ||
| Have a spouse | 2,941 (50.1) | 1,083 | 161 | 1,432 | 265 | ||
| Education level | |||||||
| None | 2,301 (39.1) | 609 | 102 | 1,231 | 359 | ||
| 0–6 | 2,059 (35) | 704 | 114 | 1,023 | 218 | ||
| ≥7 | 1,518 (25.8) | 591 | 88 | 709 | 130 | ||
| Smoke | 12.409 | 0.006 | |||||
| Yes | 863 (14.7) | 313 | 51 | 418 | 81 | ||
| No | 5,015 (85.3) | 1,591 | 253 | 2,545 | 626 | ||
| Drink | 50.659 | <0.01 | |||||
| Yes | 827 (14.1) | 345 | 52 | 367 | 63 | ||
| No | 5,051 (85.9) | 1,559 | 252 | 2,596 | 644 | ||
| Exercise | 202.869 | <0.01 | |||||
| Yes | 2,289 (38.9) | 959 | 111 | 1,064 | 155 | ||
| No | 3,589 (61.1) | 945 | 193 | 1,899 | 552 | ||
| Live alone | |||||||
| No | 4,695 (79.9) | 1,614 | 238 | 2,348 | 495 | ||
| Yes | 1,183 (20.1) | 290 | 66 | 615 | 212 | ||
| Only one child | 5.465 | 0.141 | |||||
| Yes | 585 (10.0) | 184 | 40 | 282 | 79 | ||
| No | 5,293 (90.0) | 1,720 | 264 | 2,681 | 628 | ||
| Self evaluation of life | 719.356 | <0.01 | |||||
| Good | 2,537 (43.2) | 1,160 | 167 | 1,110 | 100 | ||
| Far | 2,409 (41) | 621 | 96 | 1,392 | 300 | ||
| Bad | 932 (15.9) | 123 | 41 | 461 | 307 | ||
| Self-rated | 820.726 | <0.01 | |||||
| Good | 2,537 (43.2) | 1,160 | 167 | 1,110 | 100 | ||
| Fair | 2,409 (41) | 621 | 96 | 1,392 | 300 | ||
| Bad | 932 (15.9) | 123 | 41 | 461 | 307 | ||
| Economic situation | 408.49 | <0.01 | |||||
| Good | 1,298 (22.1) | 576 | 74 | 580 | 68 | ||
| Fair | 4,039 (68.7) | 1,239 | 202 | 2,147 | 451 | ||
| Bad | 541 (9.2) | 89 | 28 | 236 | 188 | ||
| Enjoy retirement system | 39.443 | <0.01 | |||||
| No | 3,726 (63.4) | 1,109 | 187 | 1,937 | 493 | ||
| Yes | 2,152 (36.6) | 795 | 117 | 1,026 | 214 | ||
| Limited in activities | 260.945 | <0.01 | |||||
| No | 492 (8.4) | 99 | 23 | 244 | 126 | ||
| Limited | 1,461 (24.9) | 333 | 63 | 814 | 251 | ||
| Strongly limited | 3,925 (66.8) | 1,472 | 218 | 1,905 | 330 | ||
| Physical labor | 8.465 | 0.037 | |||||
| Yes | 4,165 (70.9) | 1,328 | 199 | 2,118 | 520 | ||
| No | 1,713 (29.1) | 576 | 105 | 845 | 187 | ||
| Anxiety | 1.459 ± 2.756 | 0.325 ± 1.168 | 0.372 ± 1.255 | 1.376 ± 2.277 | 5.265 ± 4.341 | 796.37 | <0.001 |
| IADL | 19.500 ± 5.525 | 20.627 ± 5.022 | 19.701 ± 5.829 | 19.284 ± 5.522 | 17.286 ± 5.918 | 68.205 | <0.001 |
General characteristics of the chronically ill elderly.
3.2 Results of latent profile analysis
This study performed a latent profile analysis (LPA) based on CESD-10 scale scores, exploring potential subgroups by evaluating models with 1 to 5 categories. The model fit information (detailed in Table 3) revealed progressively lower AIC, BIC, and aBIC values from categories 1 to 5. All models achieved entropy values above 0.8, indicating clear delineation of categories, and both the LMR and BLR tests showed significant results, suggesting an improved model fit with additional categories. However, the five-category model included a category comprising less than 5% of the sample, while the three-category model had an entropy value below 0.8 despite significant LMR and BLR tests, potentially impacting model accuracy. Notably, the four-category model exhibited the highest entropy. Consequently, the study adopted the four-category model, as shown in Table 4, which presents the attribution probability matrix. The average probability of subgroup membership ranged from 90.1 to 91.5%, supporting the validity of the four-category profiling results.
Table 3
| Profile | AIC | BIC | aBIC | Entropy | LMRT (p) | BLRT (p) | Proportion |
|---|---|---|---|---|---|---|---|
| 1 | 167519.938 | 167653.517 | 167589.963 | 1 | — | — | 1 |
| 2 | 157502.341 | 157709.389 | 157610.88 | 0.805 | <0.001 | <0.001 | 0.661/0.339 |
| 3 | 154120.61 | 154401.127 | 154267.663 | 0.815 | <0.001 | <0.001 | 0.351/0.522/0.157 |
| 4 | 152813.733 | 153167.718 | 152999.299 | 0.841 | <0.001 | <0.001 | 0.324/0.052/0.120/0.504 |
| 5 | 151799.938 | 152227.392 | 152024.018 | 0.839 | <0.001 | <0.001 | 0.271/0.051/0.171/0.481/0.025 |
Indicators for each latent profile of depression among chronically ill elderly.
Table 4
| Profile | Profile 1 | Profile 2 | Profile 3 | Profile 4 |
|---|---|---|---|---|
| Profile 1 | 0.915 | 0.012 | 0.000 | 0.073 |
| Profile 2 | 0.054 | 0.901 | 0.000 | 0.045 |
| Profile 3 | 0.000 | 0.000 | 0.911 | 0.089 |
| Profile 4 | 0.059 | 0.011 | 0.024 | 0.906 |
Attribution probabilities for each latent profile of subjects.
3.3 Naming of potential profiles
Based on the latent profile analysis, the average scores and relative levels of the four categories in the CES-D scale were plotted (see Figure 2 for details). The first category, comprising 1,904 individuals (32.4%), exhibited low average scores across all items and was designated the “Low Level Group.” The second group comprised 304 participants (5.2% of the sample). This cohort scored low on all nine other items of the CES-D scale (covering dimensions such as worry, difficulty concentrating, sadness, and loneliness), but scored significantly higher than the other three groups on the fifth item (item content: “I feel hopeless about the future, “which is reverse-scored, meaning higher scores indicate lower hope for the future and stronger despair) was significantly higher than in the other three groups (F = 12.78, p < 0.001). Based on this core characteristic—low overall depressive symptom levels but specific elevation in the” despair about the future “dimension—this study named this category the” Low-Level-High-Despair Group.” The third category consisted of 2,963 individuals (50.4%) with medium average scores across all items, earning the designation “Medium Level Group.” Finally, the fourth category, with 707 individuals (12.0%), demonstrated high average scores on all items and was named the “High Level Group.” In Figure 2, D1 to D10 represent 10 items of the CES-D scale, assessing dimensions of emotional well-being including worry (D1), concentration difficulties (D2), sadness/depression (D3), perceived usefulness (D4), hope for the future (D5), nervousness (D6), happiness compared to youth (D7), feelings of loneliness (D8), and sleep quality (D9–D10). Scores range from 1 to 5, with higher scores indicating more severe depressive symptoms in the corresponding dimension. The four profiles are defined by distinct score patterns: low-level (32.40%, consistently low scores across all items), low level-high despair (5.2%, low scores on most items but extreme peak in D5), medium level (50.4%, moderate scores across all items), and high level (12.0%, consistently high scores across all items).
Figure 2
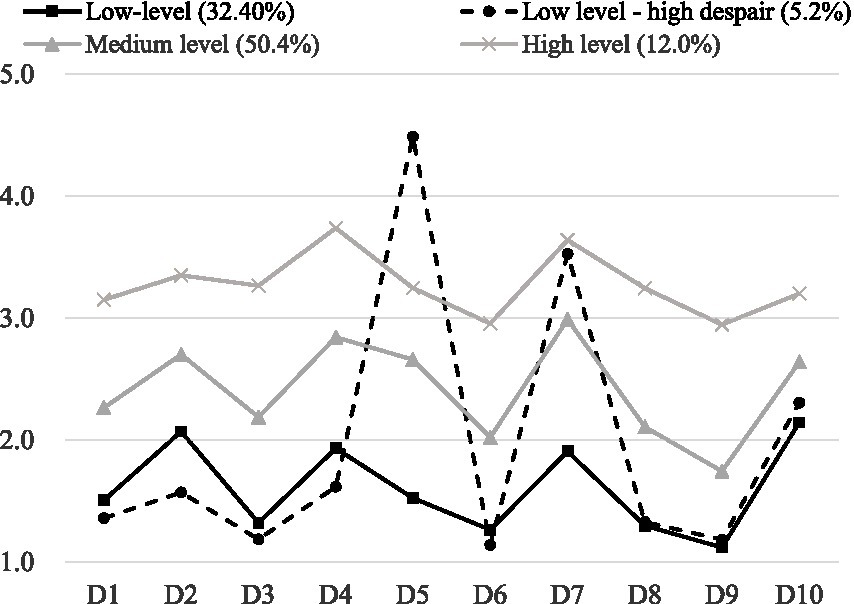
Four types of LPA model profiles.
3.4 Differences in characteristics between profiles
Chi-square tests and ANOVA were utilized to compare differences in single risk factors among older adults with chronic diseases across various depression profiles. The results indicated statistically significant differences (p < 0.05) in several factors, including gender, age, marital status, residential status, educational attainment, smoking, drinking, exercise habits, living alone, self-assessment of life satisfaction, self-rated health, self-rated economic status, retirement system coverage, activity limitations, anxiety levels, self-care capabilities, and physical labor involvement. However, no significant differences were found regarding whether participants had one child (p > 0.05).
3.5 Multiple logistic regression analyses for different depression profiles
Multiple logistic regression analyses were performed with the “Low Level” profile serving as the reference group. The dependent variable was the depression profile classification, while independent variables included those that were statistically significant in univariate analyses. All odds ratios (OR) were adjusted for the covariates listed in the table.
Findings revealed that not living alone [OR = 0.649, 95% CI = (0.462, 0.910)], having average health [OR = 0.559, 95% CI = (0.362, 0.861)], exercising [OR = 0.639, 95% CI = (0.486, 0.840)], engaging in regular physical labor [OR = 0.701, 95% CI = (0.516, 0.953)], and possessing economic affluence [OR = 0.578, 95% CI = (0.340, 0.981)] were negatively associated with being categorized in the “Low Level-High Despair” subgroup.
Conversely, higher levels of anxiety [OR = 1.491, 95% CI = (1.413, 1.572)] and increased activity restrictions due to health problems [OR = 1.286, 95% CI = (1.086, 1.523)] positively predicted categorization in the “Medium Level” subgroup. For the “High Level” subgroup, factors positively predicting membership included higher anxiety levels [OR = 2.052, 95% CI = (1.932, 2.181)], greater activity restrictions [OR = 1.350, 95% CI = (1.023, 1.781)], and not having a partner [OR = 1.743, 95% CI = (1.304, 1.330)].
In contrast, significant negative predictors for the “High Level” subgroup included self-care [OR = 0.965, 95% CI = (0.938, 0.993)], not living alone [OR = 0.578, 95% CI = (0.433, 0.771)], self-rated life satisfaction as good [OR = 0.170, 95% CI = (0.076, 0.397)], self-rated health as good [OR = 0.150, 95% CI = (0.103, 0.219)], and fair health [OR = 0.469, 95% CI = (0.343, 0.641)]. Additionally, exercising [OR = 0.408, 95% CI = (0.343, 0.534)], being economically affluent [OR = 0.345, 95% CI = (0.216, 0.551)], and having an average economic status [OR = 0.554, 95% CI = (0.384, 0.799)] were also significantly negatively predictive of being categorized in the “High Level” subgroup see Table 5 for details.
Table 5
| Variables | Low level-high despair | Medium level | High level | ||||||
|---|---|---|---|---|---|---|---|---|---|
| OR | LLCI | ULCI | OR | LLCI | ULCI | OR | LLCI | ULCI | |
| Anxiety | 0.991 | 0.873 | 1.124 | 1.491*** | 1.413 | 1.572 | 2.052*** | 1.932 | 2.181 |
| IADL | 0.986 | 0.954 | 1.02 | 0.989 | 0.972 | 1.006 | 0.965* | 0.938 | 0.993 |
| Gender | |||||||||
| Male | 0.977 | 0.726 | 1.316 | 0.956 | 0.822 | 1.111 | 0.81 | 0.619 | 1.059 |
| Residence | |||||||||
| City | 0.73 | 0.488 | 1.091 | 0.882 | 0.722 | 1.078 | 0.984 | 0.682 | 1.418 |
| Town | 1.139 | 0.845 | 1.536 | 0.941 | 0.805 | 1.1 | 1.215 | 0.928 | 1.59 |
| Age | |||||||||
| 60–69 | 0.726 | 0.433 | 1.219 | 0.933 | 0.719 | 1.211 | 0.952 | 0.585 | 1.55 |
| 70–79 | 0.812 | 0.533 | 1.236 | 0.907 | 0.729 | 1.127 | 1.007 | 0.689 | 1.472 |
| 80–89 | 0.952 | 0.662 | 1.37 | 1.061 | 0.878 | 1.282 | 1.246 | 0.906 | 1.714 |
| Live alone | |||||||||
| Yes | 0.649* | 0.462 | 0.91 | 0.764** | 0.637 | 0.916 | 0.578*** | 0.433 | 0.771 |
| Self evaluation of life | |||||||||
| Good | 0.354 | 0.119 | 1.057 | 0.552 | 0.262 | 1.166 | 0.170*** | 0.076 | 0.379 |
| Fair | 0.673 | 0.225 | 2.012 | 0.994 | 0.469 | 2.108 | 0.51 | 0.229 | 1.134 |
| Self-rated | |||||||||
| Good | 0.667 | 0.43 | 1.034 | 0.433*** | 0.341 | 0.551 | 0.15*** | 0.103 | 0.219 |
| Fair | 0.559** | 0.362 | 0.861 | 0.758* | 0.599 | 0.96 | 0.469*** | 0.343 | 0.641 |
| Smoke | |||||||||
| Yes | 1.008 | 0.705 | 1.443 | 0.967 | 0.801 | 1.168 | 0.997 | 0.698 | 1.426 |
| Drink | |||||||||
| Yes | 1.007 | 0.708 | 1.433 | 0.807* | 0.669 | 0.972 | 0.737 | 0.502 | 1.083 |
| Exercise | |||||||||
| Yes | 0.639** | 0.486 | 0.84 | 0.703*** | 0.613 | 0.807 | 0.408*** | 0.313 | 0.534 |
| Physical labor | |||||||||
| Yes | 0.701* | 0.516 | 0.953 | 0.94 | 0.8 | 1.104 | 0.989 | 0.748 | 1.308 |
| Limited in activities | |||||||||
| Strongly limited | 1.095 | 0.639 | 1.877 | 1.106 | 0.833 | 1.467 | 1.269 | 0.831 | 1.936 |
| Limited | 1.038 | 0.74 | 1.455 | 1.286** | 1.086 | 1.523 | 1.350* | 1.023 | 1.781 |
| Education level | |||||||||
| None | 0.807 | 0.534 | 1.22 | 1.114 | 0.903 | 1.374 | 1.132 | 0.773 | 1.659 |
| 0–6 | 0.948 | 0.675 | 1.332 | 1.047 | 0.878 | 1.249 | 1.032 | 0.736 | 1.448 |
| Enjoy retirement system | |||||||||
| No | 0.998 | 0.694 | 1.436 | 1.051 | 0.872 | 1.265 | 0.773 | 0.55 | 1.087 |
| Economic situation | |||||||||
| Good | 0.578* | 0.34 | 0.981 | 0.832 | 0.613 | 1.128 | 0.345*** | 0.216 | 0.551 |
| Fair | 0.661 | 0.412 | 1.06 | 1.091 | 0.824 | 1.444 | 0.554** | 0.384 | 0.799 |
| Marital status | |||||||||
| No | 0.877 | 0.634 | 1.215 | 1.168 | 0.991 | 1.377 | 1.743*** | 1.304 | 2.33 |
Multiple logistic regression analysis.
OR, odds ratio; LLCI, lower limit of 95% confidence interval; ULCI, upper limit of 95% confidence interval. Reference group: low-level group. All ORs were adjusted for all covariates listed in the table *p < 0.05, **p < 0.01, and ***p < 0.001.
4 Discussion
This study categorized subgroups of depressed older adults with chronic illnesses and analyzed factors associated with their depression. The results indicated significant heterogeneity in psychological distress, leading to the rational division of four categories based on model fitting indexes, which confirmed differences in depressive symptoms among older adults with chronic illnesses. This finding aligns with previous studies (He et al., 2023; Martini et al., 2023; Silva et al., 2022; Huang et al., 2022; Chen et al., 2020; Ye et al., 2025).
-
Low-level type: In this study, 32.4% of participants fell into this category, characterized by lower depression and anxiety scores. This group appears less prone to psychological distress.
-
Low level-high despair type: Comprising 5.2% of participants, this subgroup exhibited negative attitudes toward the future and lower happiness levels. Most individuals were aged 80 or older, suggesting that age may correlate with negative psychological outlooks due to declining health and function (Asante et al., 2022). Economic stability and family support can help maintain some psychological balance, but anxiety and pessimism remain prevalent (Pan et al., 2023).
-
Medium level type: Representing 50.4% of the sample, individuals in this group reported higher depression and anxiety scores, coupled with lower self-care abilities. Research indicates that difficulties in self-care contribute to feelings of helplessness, increasing psychological stress (Yin et al., 2023; Kopf and Hewer, 2024). This demographic requires more attention in future research and interventions to prevent progression to more severe depressive states.
-
High level type: Comprising 12.0% of participants, this group exhibited the highest levels of depression, predominantly consisting of older adults who were older, lived in rural areas, had lower educational attainment, lived alone, and expressed dissatisfaction with their lives, health, and economic status. Targeted psychological interventions are crucial for alleviating their distress and enhancing quality of life.
The findings also indicated that male chronically ill older adults with spouses, better economic and educational backgrounds, and those who engage in social activities were more likely to belong to the low-risk depression group. In contrast, females were more prevalent in medium and high depression categories, accounting for 66% of those with severe depression. WHO reports that while women live longer, they often face higher rates of illness and disability (Kitas, 2023). Traditional gender roles in China may contribute to women’s higher stress levels, as they typically manage more family responsibilities, leading to reduced personal time and increased psychological pressure (Pinquart and Srensen, 2006; Pinquart and Sörensen, 2011).
As age increases, so does the prevalence of medium and high depression categories. Deteriorating physiological functions and limited daily activities exacerbate fears associated with aging and mortality, leading to negative emotions (Chang and Wang, 2023). Additionally, rural elderly individuals face economic, social, and healthcare disadvantages that contribute to higher depression rates (Wang Y. et al., 2023). Living alone, especially for those without spouses, further intensifies feelings of isolation and helplessness, increasing the risk of depression (World Health Organization, 2023; Yang et al., 2020).
Lifestyle factors also play a significant role; older adults who do not engage in regular exercise are more prone to depression. Exercise not only aids in managing chronic illnesses but also fosters social interaction, reducing feelings of loneliness (Xin et al., 2025; Wang, 2021). Higher scores in instrumental activities of daily living (IADL) (Wang S. et al., 2023) correlate with lower depression likelihood, emphasizing the importance of self-care abilities in maintaining mental health (Sandberg et al., 2019; Casado and Lee, 2012).
Moreover, elderly individuals who perceive their economic status as average or poor (Shi et al., 2023; Sharpe et al., 2023), along with those dissatisfied with their health, are more likely to fall into higher depression categories (Wang, 2020). This highlights the importance of addressing economic concerns and health perceptions in psychological interventions (Ye et al., 2025; Zhong et al., 2021; Xu and Ma, 2020). Lastly, while smoking and drinking were associated with lower depression levels in this study, these behaviors should not be encouraged as healthy coping mechanisms. Instead, promoting positive lifestyle changes, such as regular exercise, is vital for improving mental health among this population.
Although excessive alcohol consumption has been proven to increase the risk of depression in the general population, studies on older adults suggest that moderate drinking may exhibit a “protective effect” through pathways such as social bonding and temporary mood regulation. A similar study using the CHARLS database found that elderly individuals who drank less than once per month had a significantly lower risk of depression compared to those who never drank (95% CI = −0.085 to 0.829, p = 0.110) (Xu et al., 2025). This suggests that infrequent drinking may reduce depression levels by alleviating loneliness and enhancing social engagement among the elderly. The European ELSA cohort study similarly noted that moderate drinking following the Mediterranean pattern (<40 g/day for men, <24 g/day for women) did not increase depression risk in older adults and was weakly associated with lower psychological distress scores, consistent with the lower depression levels observed among drinkers in this study (Smith et al., 2024). In this study, smoking was associated with reduced depression severity—not due to any inherent “protective effect” of smoking, but rather the unique characteristics of the elderly population. A study using CHARLS data on middle-aged and elderly Chinese women showed that rural elderly smokers did not exhibit a significantly increased risk of depression (OR = 1.10, 95% CI = 0.78–1.57), while quitters exhibited a trend toward reduced depression risk (OR = 0.77) (Yone et al., 2025). This suggests the observed “smoking-depression association” in this study may represent an apparent correlation driven by confounding factors (e.g., greater social interaction among smokers, reduced perception of pain/discomfort), rather than a causal relationship. Furthermore, studies involving individuals with severe mental illness also confirm that quitting smoking does not increase the risk of depressive symptoms, further supporting that the association between smoking and depression lacks direct causality.
5 Limitations
This study has several limitations. First, although the CLHLS sample is nationally representative, regional and selection nonresponse biases may still exist, affecting the generalizability of results. Second, both chronic diseases and depressive symptoms were measured through self-reporting, potentially introducing information bias; moreover, some potential confounders (such as detailed medication history and quality of social support) were not fully collected. Third, despite utilizing longitudinal data, the influence of reverse causality or unmeasured confounders cannot be entirely ruled out. Furthermore, latent class analysis results depend on model specifications, and the limited available indicators in the CLHLS may not fully capture the heterogeneity of comorbidity. Future studies could integrate biomarker data, more frequent follow-up assessments, and causal inference methods to further validate these findings.
6 Conclusion
This study categorized the depressive status of older adults with chronic diseases into four distinct subgroups, each exhibiting unique characteristics. Notably, those in the high-level and intermediate-level categories, who demonstrate poorer psychological well-being, require greater attention and effective interventions to alleviate anxiety and depression. Addressing these issues is essential for promoting healthy aging among this vulnerable population.
Statements
Data availability statement
The datasets presented in this study can be found in online repositories. The names of the repository/repositories and accession number(s) can be found at: http://opendata.pku.edu.cn/.
Ethics statement
The studies involving humans were approved by Peking University Open Research Data Platform (Peking University Research Center for Healthy Aging and Development). The studies were conducted in accordance with the local legislation and institutional requirements. The participants provided their written informed consent to participate in this study. Written informed consent was obtained from the individual(s) for the publication of any potentially identifiable images or data included in this article.
Author contributions
YQ: Data curation, Formal analysis, Funding acquisition, Investigation, Methodology, Validation, Writing – original draft. XS: Supervision, Validation, Writing – review & editing. YZ: Resources, Writing – original draft.
Funding
The author(s) declared that financial support was not received for this work and/or its publication.
Conflict of interest
The author(s) declared that this work was conducted in the absence of any commercial or financial relationships that could be construed as a potential conflict of interest.
Generative AI statement
The author(s) declared that Generative AI was not used in the creation of this manuscript.
Any alternative text (alt text) provided alongside figures in this article has been generated by Frontiers with the support of artificial intelligence and reasonable efforts have been made to ensure accuracy, including review by the authors wherever possible. If you identify any issues, please contact us.
Publisher’s note
All claims expressed in this article are solely those of the authors and do not necessarily represent those of their affiliated organizations, or those of the publisher, the editors and the reviewers. Any product that may be evaluated in this article, or claim that may be made by its manufacturer, is not guaranteed or endorsed by the publisher.
Footnotes
References
1
Andresen E. M. Malmgren J. A. Carter W. B. Patrick D. L. (1994). Screening for depression in well older adults: evaluation of a short form of the CES-D (Center for Epidemiologic Studies Depression Scale). Am. J. Prev. Med.10, 77–84.
2
Asante D. Rio J. Stanaway F. Worley P. Isaac V. (2022). Psychological distress, multimorbidity and health services among older adults in rural South Australia. J. Affect. Dis.309, 453–460. doi: 10.1016/j.jad.2022.04.140,
3
Casado B. L. Lee S. E. (2012). Access barriers to and unmet needs for home- and community-based services among older Korean Americans. Home Health Care Serv. Q.31, 219–242. doi: 10.1080/01621424.2012.703540,
4
Chang H. Wang Z.-S. (2023). Mediating effects of depression on daily activity ability and self-neglect in empty-nesting elderly. Mod. Preventive Med.50, 1669–1674.
5
Chen C. Chow A. M. Tang S. (2020). Trajectories of depression symptoms in Chinese elderly during widowhood: a secondary analysis. Aging Ment. Health24, 1254–1262. doi: 10.1080/13607863.2019.1603285
6
Dhira T. A. Rahman M. A. Sarker A. R. Mehareen J. (2021). Validity and reliability of the Generalized Anxiety Disorder-7 (GAD-7) among university students of Bangladesh. PLoS One16:e0261590. doi: 10.1371/journal.pone.0261590,
7
Ghiggia A. Bottiroli S. Lingiardi V. Tassorelli C. Galli F. Castelli L. (2022). Alexithymia and psychological distress in fibromyalgia and chronic migraine: a cross-sectional study. J. Psychosom. Res.163:111048. doi: 10.1016/j.jpsychores.2022.111048,
8
Hao R. Yao Y. Liu L. (2025). Comment on: “Depressive symptom trajectories and hypertension risk among Chinese middle-aged and older adults: the China Health and Retirement Longitudinal Study”. Geriatr Gerontol Int. doi: 10.1111/ggi.70279
9
He Y. Tong Y. Cai Y . (2023). Effects of social activeness on depressive symptoms in older adults. J. Nurs.38, 82–86.
10
Huang M. Liu H. Li H. Xiang C. Zhang Z. et al . (2022). Analysis of the latent profile and influencing factors of depressive symptoms among the widowed elderly in China. Med. Soc.35, 93–99.
11
Huang K. Yang T. Xu J. Yang L. Zhao J. Zhang X. et al . (2019). Prevalence, risk factors, and management of asthma in China: a national cross-sectional study. Lancet394, 407–418. doi: 10.1016/S0140-6736(19)31147-X,
12
Kitas G. (2023). World population prospects 2019: highlights. New York, NY: United Nations, Department of Economic and Social Affairs, Population Division.
13
Kopf D. Hewer W. (2024). Prevention of depression in old age: individual and societal relevance. Z. Gerontol. Geriatr.57, 175–178. doi: 10.1007/s00391-024-02306-3,
14
Lin C. C. Li C. I. Liu C. S. Lin C. H. Yang S. Y. Li T. C. (2025). Relationship of depression and mortality in community-residing elderly individuals: mediating role of frailty and quality of life. BMC Geriatr. doi: 10.1186/s12877-025-06834-4
15
Martini M. Arenhardt F. K. Caldieraro M. A. Fleck M. P. Feiten J. G. Marschner R. A. et al . (2023). Chronic pain predicts a worse response to depression treatment, regardless of thyroid function or psychotropics prescribed. J. Affect. Disord.343, 1–7. doi: 10.1016/j.jad.2023.09.026,
16
Pan S. Wang L. Zheng L. Luo J. Mao J. Qiao W. et al . (2023). Effects of stigma, anxiety and depression, and uncertainty in illness on quality of life in patients with prostate cancer patients with prostate cancer: a cross-sectional analysis. BMC Psychol.11:129. doi: 10.1186/s40359-023-01159-6
17
Pinquart M. Sörensen S. (2011). Spouses, adult children, and children-in-law as caregivers of older adults: a meta-analytic comparison. Psychol. Aging26, 1–14. doi: 10.1037/a0021863,
18
Pinquart M. Srensen S. (2006). Gender differences in caregiver stressors, social resources, and health: an updated meta-analysis. J. Gerontol. B61, P33–P45. doi: 10.1093/geronb/61.1.p33
19
Podsakoff P. M. Mackenzie S. B. Lee J. Y. Podsakoff N. P. (2003). Common method biases in behavioral research: acritical review of the literature and recommended remedies. J. Appl. Psychol.88, 879–903. doi: 10.1037/0021-9010.88.5.879,
20
Sandberg L. Nilsson I. Rosenberg L. Borell L. Boström A. M. (2019). Home care services for older clients with and without cognitive impairment in Sweden. Health Soc. Care Community27, 139–150. doi: 10.1111/hsc.12631,
21
Sharpe L. Michalowski M. Richmond B. Menzies R. E. Shaw J. (2023). Fear of progression in chronic illnesses other than cancer: a systematic review and meta-analysis of a transdiagnostic construct. Health Psychol. Rev.17, 301–320. doi: 10.1080/17437199.2022.2039744
22
Shi Y. Howe T. H. Halpin P. F. Wu B. (2023). Poststroke activity engagement in community dwellers: association with illness perceptions and perceived environment. Clin. Rehabil.37, 132–142. doi: 10.1177/02692155221111926,
23
Silva S. Bartolo A. Santos I. M. Pereira A. Monteiro S. (2022). Towards a better understanding of the factors associated with distress in elderly cancer patients: a systematic review. Int. J. Environ. Res. Public Health19:3424. doi: 10.3390/ijerph19063424,
24
Smith A. Jones B. Williams C. (2024). Moderate alcohol consumption and depression in older adults: findings from the English Longitudinal Study of Ageing (ELSA). Sci. Rep.14:8976. doi: 10.1093/ageing/afm001
25
Wang F. (2020). Relationship between social support, depression and life satisfaction among older adults. Chin. J. Gerontol.40, 4886–4888.
26
Wang J. (2021). Research on the construction of social support system for the mental health of community home-disabled elderly. Shanghai: East China Normal University.
27
Wang Y. Chen Q. Liu L. (2023). Meta-analysis of the detection rate and influencing factors of depression in Chinese elderly people. Chin. Gen. Med.26, 4329–4335.
28
Wang S. Guo K. Li D. Wang Y. Wang S. Xu Z. et al . (2023). Effects of physical activity levels on frailty in Chinese older adults: a multi-period study based on the China Health and Aging Tracking Survey. J. Shaanxi Normal Univ.51, 91–103. doi: 10.15983/j.cnki.jsnu.2023302
29
Wang C. Wei C. Hong H. Wei W. Lu G. (2023). Latent profile analysis of cognitive function and depressive symptoms in Chinese elderly: results from the China Health and Retirement Longitudinal Study. Psychogeriatrics23, 108–115. doi: 10.1111/psyg.12909,
30
World Health Organization (2014). Global status report on noncommunicable diseases 2014. Geneva: WHO Press.
31
World Health Organization . (2023). Mental health of older adults. Available online at: https://www.who.int/news-room/fact-sheets/detail/mental-health-of-older-adults. (Accessed June 17, 2025)
32
Xiang X. An R. Heinemann A. (2018). Depression and unmet needs for assistance with daily activities among community-dwelling older adults. Gerontologist58, 428–437. doi: 10.1093/geront/gnw262,
33
Xin J. Liu W. Li W. Feng Q. Hao G. Wang L. (2025). Low iron status and cognitive impairment in northern China community-dwelling older adults: a cross-sectional study. Front. Nutr.12:1672340. doi: 10.3389/fnut.2025.1672340,
34
Xu H. Y. Geng D. D. Wang J. (2025). Correlation between living habits and depressive symptoms in Chinese older adults. J. Chongqing Med. Univ.50, 114–122.
35
Xu N. Ma Z. H. (2020). A summary of research on empty nesters at home and abroad. China Collect. Econ.23, 87–88.
36
Yang R. Wang H. Edelman L. S. Tracy E. L. Demiris G. Sward K. A. et al . (2020). Loneliness as a mediator of the impact of social isolation on cognitive functioning of Chinese older adults. Age Ageing49, 599–604. doi: 10.1093/ageing/afaa020,
37
Ye B. Li Y. Gao J. (2025). Depressive symptoms affect frailty through attitudes to aging: a cross-lagged analysis. BMC Geriatr. doi: 10.1186/s12877-025-06852-2
38
Yin Y. Zhou H. Liu M. Liang F. Ru Y. Yang W. et al . (2023). Status and influencing factors of social isolation in elderly patients with maintenance hemodialysis. Chin. J. Nurs.58, 822–828. doi: 10.3761/j.issn.0254-1769.2023.07.008
39
Yone K. Suzuki T. Tanaka M. (2025). Smoking cessation and depression among smokers with serious mental illness: a systematic review and meta-analysis. Psychiatry Res.342:11568.
40
Zhong X. L. Wang B. C. Zhang Q. (2021). Mental health status of empty nesters and its countermeasures. Chin. J. Gerontol.41, 5129–5132.
Summary
Keywords
CHARLS (China Health and Retirement Longitudinal Study), chronic illness, depression, older adults, potential categories
Citation
Qu Y, Sun X and Zhao Y (2026) Analysis of potential categories of depression in older adults with chronic illness. Front. Psychol. 17:1701471. doi: 10.3389/fpsyg.2026.1701471
Received
08 September 2025
Revised
17 December 2025
Accepted
05 January 2026
Published
27 January 2026
Volume
17 - 2026
Edited by
Olusegun Baiyewu, University of Ibadan, Nigeria
Reviewed by
Sorina Corman, Lucian Blaga University of Sibiu, Romania
Ying Zhou, Beijing Open University, China
Updates
Copyright
© 2026 Qu, Sun and Zhao.
This is an open-access article distributed under the terms of the Creative Commons Attribution License (CC BY). The use, distribution or reproduction in other forums is permitted, provided the original author(s) and the copyright owner(s) are credited and that the original publication in this journal is cited, in accordance with accepted academic practice. No use, distribution or reproduction is permitted which does not comply with these terms.
*Correspondence: Xiaomin Sun, 1477279015@qq.com
Disclaimer
All claims expressed in this article are solely those of the authors and do not necessarily represent those of their affiliated organizations, or those of the publisher, the editors and the reviewers. Any product that may be evaluated in this article or claim that may be made by its manufacturer is not guaranteed or endorsed by the publisher.