Abstract
Introduction:
Bedtime procrastination is defined as deliberately delaying sleep without any external conditions preventing sleep. One of the most frequently used scales in this field is the Bedtime Procrastination Scale (BPS). The original form of the scale consists of nine items rated on a 5-point Likert scale. The BPS is a measurement tool that has been applied to many cultures, both in the language in which it was developed and in adaptations to different languages. This study aims to examine the reliability coefficients obtained from different studies for the BPS using meta-analysis methods and to determine the average effect size for the scale.
Method:
For this purpose, studies were searched in the Scopus, Proquest, Web of Science, ScienceDirect, EBSCO, and Google Scholar databases between 2014 and 2025 using the keyword “Bedtime Procrastination Scale,” and analyses were performed on 128 reliability coefficients (127 for α and 11 studies for ω). The Bonnet transformation was used to obtain the average reliability coefficient.
Results:
Cronbach’s alpha (α) was estimated at 0.855 [95% CI (0.843, 0.865)], and McDonald’s omega (ω) was estimated at 0.867 [95% CI (0.834, 0.894)]. There was no publication and reporting bias found for either reliability coefficient analysis; however, the magnitude of heterogeneity suggests that moderator analyses are warranted to explain systematic variability across studies. The moderator analysis found that the variables mean age, SD age, region, and sample group were significant for the Cronbach alpha coefficient, while only the sample group variable was significant for the McDonald’s omega coefficient.
Discussion:
Overall, the findings indicate that the Bedtime Procrastination Scale demonstrates high and acceptable reliability across studies for both Cronbach’s alpha and McDonald’s omega. While age, region, and sample type emerged as significant moderators (for Cronbach’s alpha), a substantial proportion of heterogeneity remained unexplained, indicating that reliability variability cannot be attributed to a single set of study characteristics. Although reliability was generally adequate, the observed heterogeneity and wide prediction intervals suggest that caution is warranted when the scale is used in high-stakes or critical decision-making contexts. Moreover, recommendations were made for both researchers and practitioners.
Introduction
Procrastination is a common phenomenon that occurs frequently in daily life and is extensively studied. In the scholarly literature, procrastination is characterized as the voluntary postponement of intended tasks or decisions, even when individuals anticipate that such delays will be detrimental to desired outcomes (Steel, 2007; Sirois and Pychyl, 2013).
Procrastination occurs across multiple life domains, including academic contexts (Schouwenburg, 1995; Klingsieck, 2013; Steel, 2007), occupational settings (Nguyen et al., 2013), everyday household tasks (Ferrari et al., 1995; Milgram et al., 1988), and health-related behaviors (Sirois, 2004; Sirois, 2007), where individuals delay necessary tasks in ways that may undermine performance and wellbeing.
Beyond these domains, procrastination has also been increasingly examined in relation to sleep-related behaviors. Research over the past decade has consistently shown that insufficient or poor-quality sleep is associated with a range of adverse mental and physical health outcomes. Bedtime procrastination, as a self-regulatory failure that prioritizes leisure or technology-related activities over sleep, has been identified as a key behavioral contributor to sleep deprivation, leading to reduced sleep duration and impaired sleep quality (Chung et al., 2020; Kroese et al., 2014; Kühnel et al., 2016). In contemporary societies characterized by fast-paced lifestyles (Åkerstedt and Nilsson, 2003; Basner et al., 2007) and pervasive use of digital technology (Cain and Gradisar, 2010; Exelmans and Bulck, 2017), bedtime procrastination has emerged as a prevalent and consequential behavior with significant implications for mental and physical health (Ford and Kamerow, 1989; Howarth and Miller, 2024; Manocchia et al., 2001; Zhang et al., 2024). In light of the growing recognition of bedtime procrastination as a significant determinant of sleep-related outcomes, it is imperative to employ a reliable and valid instrument to measure this construct. Furthermore, the existing measurement tool must be subjected to rigorous evaluation in terms of its validity and reliability.
Bedtime procrastination scale
Bedtime procrastination was defined as the voluntary delay of going to bed without external circumstances preventing sleep. The Bedtime Procrastination Scale (BPS), originally developed in English (Kroese et al., 2014), is a widely used instrument to assess this construct. The instrument comprises nine items within a unidimensional structure, four of which are reverse-worded. Over the past decade, the BPS has been translated and adapted into several languages, including Arabic (Hammoudi et al., 2021), Chinese (Ma et al., 2021), German (Bernecker and Job, 2019), Spanish (Brando-Garrido et al., 2022), Dutch (Broers, 2014), Korean (An et al., 2019), Japanese (Miyagawa et al., 2024), Polish (Herzog-Krzywoszanska and Krzywoszanski, 2019), Portuguese (Magalhães et al., 2020), Indonesian (Rahayu and Caninsti, 2024), Persian (Rasouli et al., 2025), and Turkish (Dinç et al., 2016). With these various versions, the BPS has been administered across a wide range of cultural contexts, including Western (e.g., the USA and Germany), East Asian (e.g., China and Japan), South Asian (e.g., India and Pakistan), Middle Eastern (e.g., Iran and Saudi Arabia), and Southeast Asian societies (e.g., Singapore and Indonesia). In addition, studies employing the BPS have targeted populations with age ranges spanning from early adolescence to adulthood, with approximately 13–56 years (Exelmans and Bulck, 2021; Kullik et al., 2025). These populations include young adults (Flores et al., 2023; Jeoung et al., 2023), adolescents (Deng et al., 2024; Pu et al., 2022), university students (Hamvai et al., 2023; Xu et al., 2024), and the general population (Deng et al., 2022; Miyagawa et al., 2024).
This extensive use underscores the widespread acceptance and versatility of BPS as a measure of bedtime procrastination. However, the extensive use of the BPS across diverse populations and research contexts also raises important questions regarding the consistency and generalizability of its reliability estimates. Despite its widespread use, the reliability of its scores has shown substantial inconsistency across studies, with reported internal consistency estimates (e.g., Cronbach’s alpha and McDonald’s omega) ranging from 0.540 to 0.982. Moreover, several studies have relied on reliability coefficients reported in the original validation study rather than estimating reliability from their own data, a practice referred to as reliability induction (Thompson and Vacha-Haase, 2000; Huang et al., 2023; Manasa and Saju Stephen, 2024; Son and Kwag, 2021). This practice reflects the erroneous assumption that reliability is an invariant property of the instrument itself, rather than a characteristic of the scores obtained within a specific sample and research context (Thompson and Vacha-Haase, 2000). Given the diversity of samples and study conditions under which the BPS has been administered, variability in reported reliability estimates is expected, and the absence of consistently reported coefficients further limits conclusions regarding the scale’s psychometric robustness.
The widespread use of the Bedtime Procrastination Scale across multiple languages and diverse target populations, together with the observed variability and lack of stability in its reported reliability coefficients across studies, was explicitly highlighted as the research gap that justifies conducting a reliability generalization meta-analysis (RGMA) of the BPS.
Meta-analytical reliability generalization
Reliability is a fundamental psychometric property of test scores, reflecting the consistency of scores across administrations under comparable conditions, yet it may vary across applications as a function of score variability, sample characteristics, and administration procedures (Crocker and Algina, 1986; Henson and Thompson, 2002). Considering that reliability coefficients can fluctuate across different administrations, systematically identifying the factors that influence—or do not influence—this variability within the context of a given measurement instrument can inform the implementation of more rigorous and precise reliability practices in subsequent research employing the instrument (Henson and Thompson, 2002; López-Ibáñez et al., 2024; Vacha-Haase et al., 2002). In line with American Psychological Association’s (2020) Journal Article Reporting Standards, researchers are explicitly encouraged to estimate and report reliability coefficients for the scores analyzed in their own samples, underscoring that reliability is a property of the obtained scores rather than a fixed characteristic of the measurement instrument (Appelbaum et al., 2018). Fundamentally developed for this purpose, reliability generalization (RG) studies aim to (a) examine the distribution of reliability coefficients reported in the literature, (b) identify possible sources that account for variability in these estimates, and (c) provide pooled reliability estimates for the instrument under investigation (López-Ibáñez et al., 2024;Vacha-Haase, 1998; Vacha-Haase et al., 2002). Through the use of RG, researchers can potentially design future studies in ways that enhance score reliability, increase effect sizes, improve statistical power, and strengthen the likelihood of obtaining significant results (Henson and Thompson, 2002).
To summarize, the widespread use of the Bedtime Procrastination Scale, along with the non-constant nature of its reliability and the variability of reliability coefficients reported across studies, underscores the importance of conducting a reliability generalization meta-analysis for this instrument. Such an approach enables a systematic evaluation of the psychometric robustness of the BPS, ensuring its valid and reliable application across diverse populations and research contexts.
Purpose of the study
The purpose of the present study is to examine the meta-analytic reliability of the BPS while considering various moderator variables, thereby accounting for the heterogeneity observed in reliability coefficients.
By applying this approach to the BPS, the present study aims to (a) quantify the overall reliability of the scale across published research, (b) evaluate the variability in reliability estimates, and (c) explore predictors of heterogeneity of the reliability, with continuous moderators including the mean age, standard deviation of age, sample size, percentage of female, mean of BPS scale score and standard deviation of BPS scale score by the way categorical moderators including region, language, sample type and publication type.
Method
A Reliability Generalization Meta-Analysis (RGMA; Vacha-Haase, 1998) was conducted to estimate average population reliability coefficients for the BPS. The conduct and reporting followed the REGEMA guidelines and checklist proposed by Sánchez-Meca et al. (2021), developed to address the lack of dedicated RG standards. These guidelines aim to enhance clarity, reproducibility, and transparency in RG studies through a structured flow and a 30-item checklist across eight dimensions, which informed study selection, coding, and synthesis.
Search strategy
In the first stage of the data collection process, a literature search was conducted in the Scopus, Proquest, Web of Science, ScienceDirect, EBSCO, and Google Scholar databases using the keyword “Bedtime Procrastination Scale.” These searches were conducted in July 2025, and no year limit was set for the studies. Since the scale addressed in the study was developed in 2014, the studies reviewed cover the period between 2014 and July 2025. Hand-searching was also performed.
Inclusion and exclusion criteria
In the process of including studies in the meta-analysis, (1) the study must have been published as an article or thesis; (2) the language of publication must be English; (3) the scale used in the study must be the Bedtime Procrastination Scale (BPS) developed by Kroese et al. (2014) or adapted versions; and (4) the reliability coefficient and sample size related to the BPS must be reported in the study.
On the other hand, studies were excluded (1) if the studies were conducted using a qualitative research design, bibliometric studies, meta-analyses, or systematic reviews; (2) if the items on the BPS scale were reduced or additional items were added; (3) if the BPS scale was used with a rating scale other than a 5-point Likert scale; (4) if the study was written in a language other than English, (5) if the study was published in a format other than an article or thesis, (6) if the study used data from a previously included study (same sample), and (7)sStudies that used the BPS but either explicitly reported no reliability coefficients (by report) or omitted them altogether (by omission), and did not respond to requests for reliability information or an anonymized data set.
Figure 1 shows the REGEMA flowchart for BPS, which summarizes the selection process of studies included in the meta-analysis. This process includes both exclusion and inclusion stages.
Figure 1
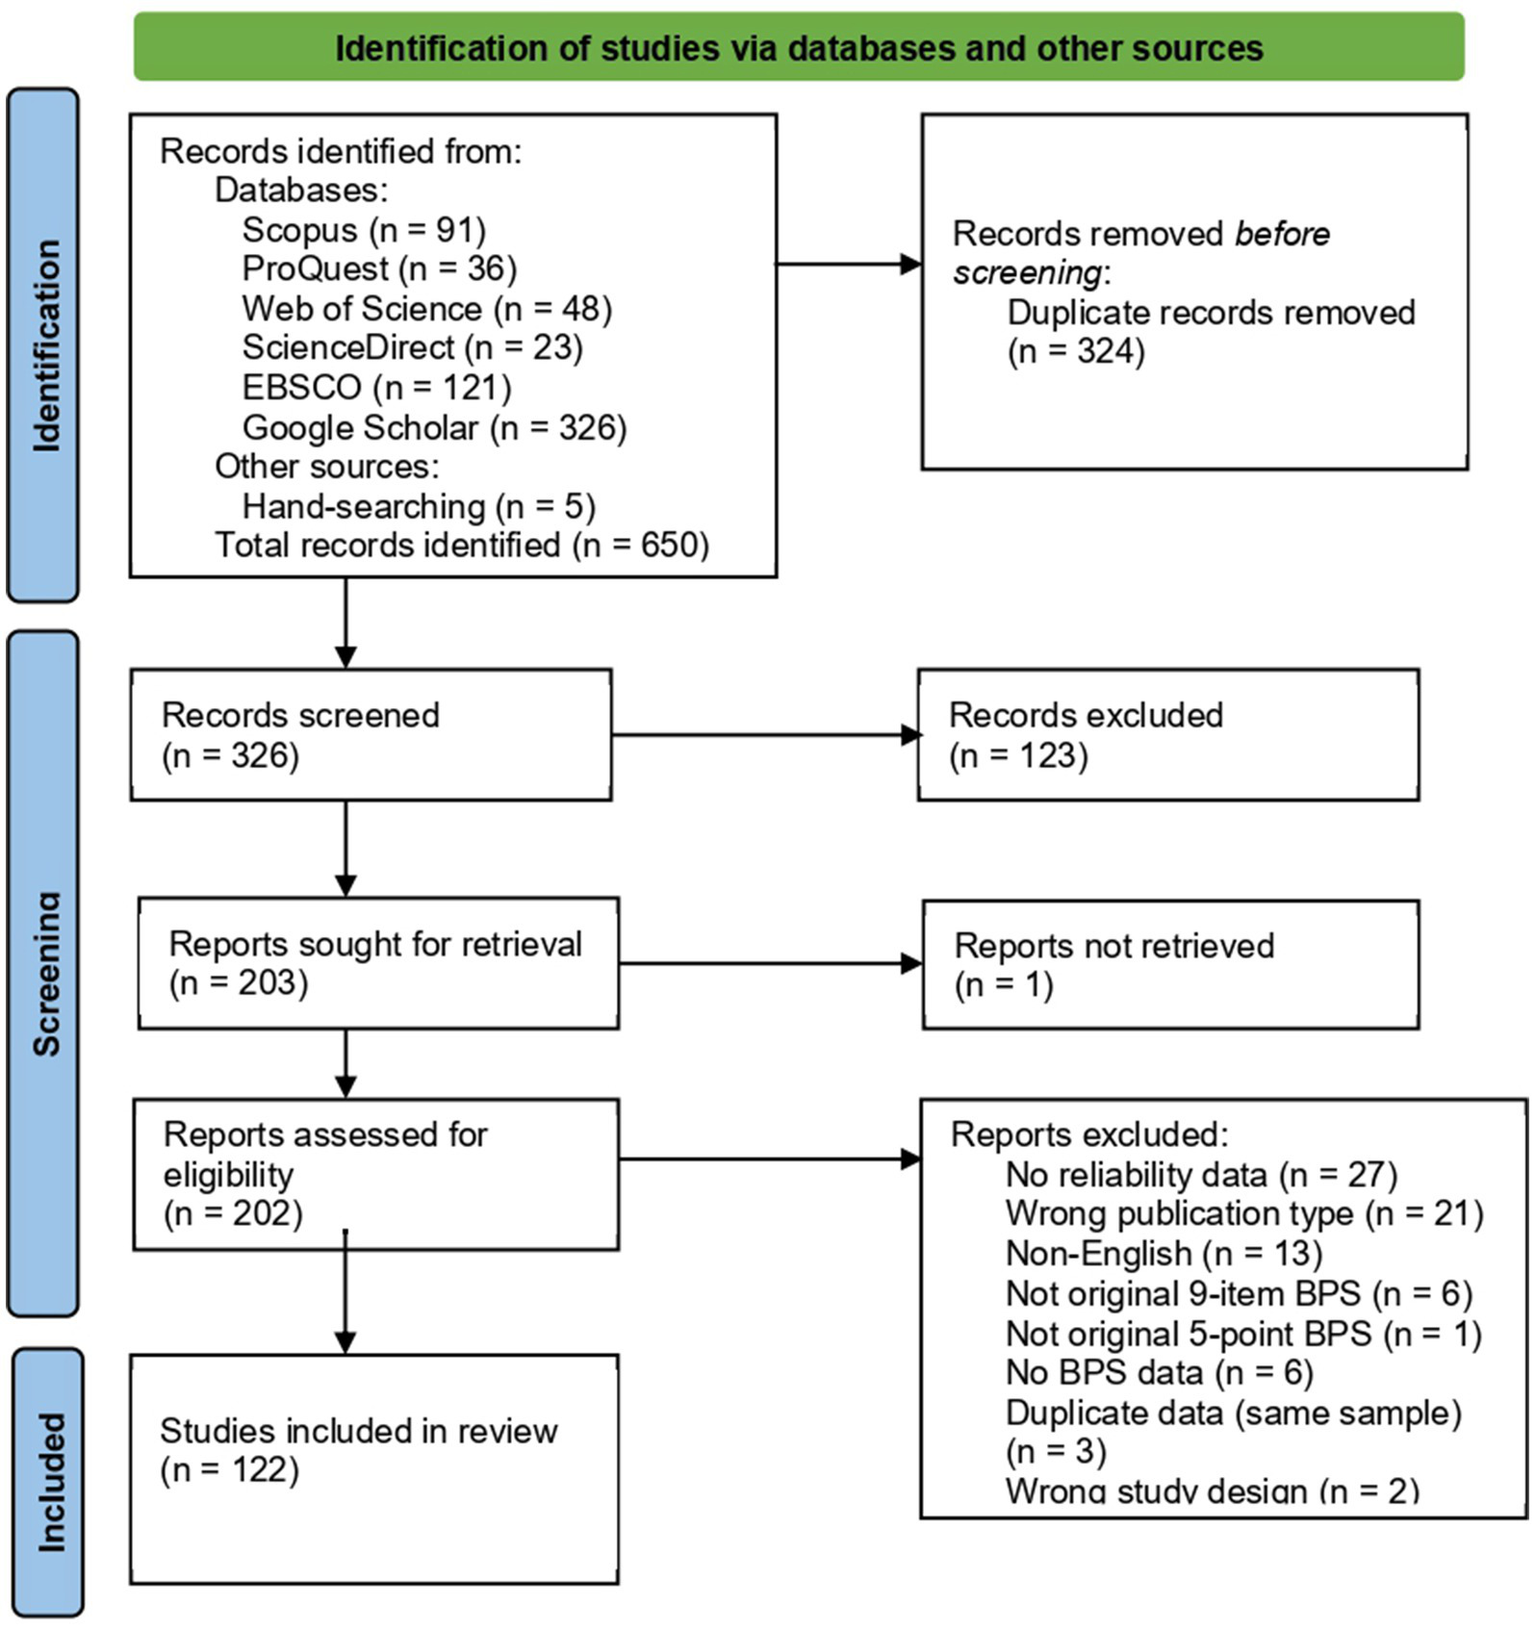
REGEMA flowchart for BPS.
A total of 650 records were identified through database searching (Scopus = 91, ProQuest = 36, Web of Science = 48, ScienceDirect = 23, EBSCO = 121, Google Scholar = 326) and other sources (hand-searching = 5). After removing 324 duplicates, 326 records remained for screening. Of these, 123 were excluded based on titles and abstracts. The full texts of 202 reports were assessed for eligibility, with one report not retrieved. Among the 201 accessible reports, 76 were excluded for the following reasons: no reliability data (n = 27), nonacceptable publication type (n = 21), non-English (n = 13), not original 9-item 5-point BPS (n = 6), no BPS data (n = 3), duplicate data (n = 3), non-acceptable study design (n = 2), and unclear reporting of reliability (n = 1). Ultimately, 122 studies were included in the review. Since six of these studies were conducted on two different groups, analyses were performed with a total of 128 independent reliability coefficients. Since these subgroups were based on non-overlapping participant samples, each reliability coefficient was treated as an independent unit of analysis, consistent with recommendations for independent subgroups within studies (Borenstein et al., 2009, Chapter 23). In addition, when the same participant group was assessed at multiple time points within a study, these coefficients were not treated as independent. Instead, a single composite reliability coefficient was computed for that study by aggregating across time points, along with a corresponding mean BPS score and standard deviation. This approach follows established recommendations for handling multiple outcomes or time points based on the same participants to avoid violating independence assumptions (Borenstein et al., 2009, Chapter 24).
Data extraction
In reliability generalization research, variability in reported reliability coefficients is commonly examined in relation to study-level methodological and sample characteristics. This variability can be attributed to the methodological characteristics including sample size (Peterson, 1994; Vassar and Bradley, 2011), publication year (Greco et al., 2018), publication type (Vassar et al., 2011; Tümtürk and Sen, 2025), mean of the scale score (Hayat, 2024; Miller et al., 2018; Tümtürk and Sen, 2025), and standard deviation of the scale score (Aguayo-Estremera et al., 2011; Miller et al., 2018), as well as participants’ demographic characteristics such as age (Pretorius and Padmanabhanunni, 2025), gender (Aguayo-Estremera et al., 2011; Vassar et al., 2011), and sample type (Peterson, 1994; Pretorius and Padmanabhanunni, 2025). In addition, contextual variables including language (Grace et al., 2018; Pretorius and Padmanabhanunni, 2025) or geographical region of the study (Aguayo-Estremera et al., 2011; Tümtürk and Sen, 2025) are frequently considered.
Consistent with prior reliability generalization studies that have examined methodological, sample-related, and contextual sources of variability, the present study operationalized these factors through a standardized data extraction procedure. For each study, the study tag (first author and year) and the publication type (e.g., peer-reviewed article and thesis) were recorded. Reported reliability coefficients were extracted, including Cronbach’s alpha and/or McDonald’s omega. Sample-related characteristics were documented, such as sample size, language of the BPS administration, country of data collection, participants’ mean age and standard deviation, sample group (e.g., university students, adolescents, and general population), and the female ratio in the sample. Descriptive statistics for the scale, including the BPS mean and standard deviation, were also extracted. Where necessary, BPS means and standard deviations reported at the total-score level were recalculated and transformed to item-level metrics to ensure consistency across studies. Specifically, some primary studies reported descriptive statistics based on the summed total BPS score, whereas others reported item-level mean scores (i.e., average per item). To ensure comparability across studies, all total-score means and standard deviations were converted to item-level means and standard deviations by dividing the total score statistics by the number of items in the BPS. This harmonization allowed all descriptive statistics to be expressed on a common item-level scale.
Study selection and coding were conducted using a multi-stage and systematic procedure. All screening and eligibility decisions were managed using the Rayyan software (Ouzzani et al., 2016). In the first stage, title and abstract screening were performed independently and in parallel by two reviewers. All records were evaluated by both reviewers and labelled in Rayyan as include, exclude, or maybe. Records for which the reviewers’ decisions were discordant (i.e., those marked as conflict in Rayyan), as well as records labelled as maybe by at least one reviewer, were discussed in consensus meetings involving all three authors. Final inclusion or exclusion decisions were reached by agreement, in accordance with the predefined eligibility criteria.
Studies that passed the abstract screening stage and were selected for full-text review were then examined in detail by two reviewers. For all studies deemed eligible at this stage, relevant information was coded using a standardized data extraction form. In the final stage, all data extraction sheets prepared for the included studies were independently reviewed by the third author. Any potential errors, omissions, or inconsistencies identified at this stage were re-evaluated in consultation with the other authors, and necessary corrections were made before finalizing the dataset.
This multi-stage, independent, and consensus-based review process was designed to ensure consistency and methodological rigor in the selection and coding of studies included in the meta-analysis.
Data analysis
All analyses were conducted within a reliability generalization meta-analytic framework (Vacha-Haase, 1998; Rodríguez and Maeda, 2006) to estimate pooled internal consistency coefficients for the BPS and to examine sources of variability across studies. Both Cronbach’s alpha (α) and McDonald’s omega (ω) were included when reported. Because reliability coefficients are bounded between 0 and 1 and typically skewed, estimates were transformed prior to analysis using Bonett’s (2002) ABT variance-stabilizing transformation, which has been recommended for internal consistency coefficients such as α and ω (López-Ibáñez et al., 2024). This approach yields effect sizes with approximately normal sampling distributions and known large-sample variances. At this stage, all meta-analytic computations, including pooled reliability estimates, confidence intervals, and heterogeneity statistics, were performed using the transformed coefficients. To facilitate interpretation of the results, all pooled reliability estimates and their corresponding confidence intervals were subsequently back-transformed to the original reliability coefficient metric (Cronbach’s alpha and McDonald’s omega). Accordingly, the pooled reliability estimates and confidence intervals reported in this study are presented on the original scale familiar to readers. This approach enhances the interpretability of results obtained from statistical analyses conducted on the transformed scale in the RG study (Sánchez-Meca et al., 2013).
Random-effects models were fit using restricted maximum likelihood (REML) estimation to obtain pooled reliability estimates and between-study variance (τ2). Heterogeneity was assessed with Cochran’s Q, the I2 index (Higgins and Thompson, 2002), and the H2 statistic. In total, 95% prediction intervals were also calculated to describe the plausible range of reliability coefficients in future studies. Robustness was evaluated through leave-one-out influence diagnostics and examination of standardized residuals; in addition, normal Q–Q plots were inspected to assess distributional assumptions of model residuals (Viechtbauer, 2010).
Publication bias and small-study effects were examined using complementary methods. Funnel plots were inspected visually, accompanied by Egger’s regression test and Begg–Mazumdar rank correlation. Duval and Tweedie’s (2000) trim-and-fill procedure was applied as a sensitivity analysis, and precision-effect and precision-effect estimate with standard error (PET and PEESE) regressions were conducted (Stanley and Doucouliagos, 2014).
Reliability induction is a specific form of publication bias in RGMA, where the bias is introduced through the selective reporting or omission of reliability coefficients (López-Ibáñez et al., 2024). In the present study, of the 149 studies identified as using the BPS, 27 did not provide sample-specific reliability estimates: 14 did not report reliability coefficients, and 13 reported reliability values from prior studies and did not respond to author contact attempts. Accordingly, the reliability induction rate was calculated as 18.12%.
To explore heterogeneity, moderator analyses were conducted at both continuous and categorical levels. Mixed-effects meta-regressions were performed with sample characteristics (mean age, SD of age, female ratio, sample size) and scale characteristics (mean and standard deviation of BPS scores). For categorical moderators, we pre-specified the subgroup levels and applied a common-τ2 framework. For α, we compared effects across four moderators: (i) Region (Asia and Europe; studies from other continents or with mixed/international samples were excluded for this moderator), (ii) Scale language (Chinese, English, and Others), (iii) Sample group [adolescent, general population, and university students (undergraduate and postgraduate students combined into this category)], and (iv) Publication type (article and thesis). For ω, subgroup analyses were limited to the sample group (general population and university students). Levels with missing information or fewer than two independent studies were excluded a priori from the relevant moderator analysis to ensure stable within-group estimates (k ≥ 2). Other categorical moderators were not analyzed for ω due to feasibility (sparse cells for Region, Scale language) or no variability (Publication type: all articles).
Region-based analyses were restricted to Asia and Europe, as these categories represented theoretically meaningful and internally coherent groupings with sufficient numbers of studies. Studies conducted in other regions (e.g., North America and Oceania) were not combined into an “other” category because they did not share a common geographical or cultural framework that would allow for a substantively interpretable comparison. For scale language, Chinese and English versions were examined separately due to their substantial representation and distinct measurement contexts. The remaining languages were grouped under “other,” reflecting adapted versions of the BPS with small individual sample sizes that did not permit separate analysis.
All subgroup models assumed a common between-study variance (τ2) across levels. We estimated τ2 via REML and then obtained level-specific pooled effects using fixed-effect estimation on augmented variances (vi* = vi + τ2), with 95% CIs reported on the coefficient scale after back-transformation. Between-group heterogeneity was evaluated with the analog ANOVA statistic Qbetween (df = group−1). Where the omnibus test was significant (α = 0.05), we conducted pairwise contrasts between subgroup means using Wald tests on the transformed scale and applied a Bonferroni adjustment to control family-wise error. In addition, we reported the proportion of between-study variance explained (R2) for significant moderators as , following Borenstein et al. (2009).
As a sensitivity analysis, we additionally fitted separate random-effects models within each level of categorical moderators, allowing the between-study variance (τ2) to be estimated independently for each subgroup. These analyses revealed that τ2 values varied slightly across subgroup levels, indicating differences in residual heterogeneity. However, the pooled reliability estimates and their confidence intervals were highly consistent with those obtained under the common-τ2 specification, and the overall pattern of results remained unchanged. Accordingly, the main analyses assuming a common between-study variance are retained for presentation, with subgroup-specific τ2 estimates used to evaluate the robustness of the findings.
All analyses were carried out in R (R Core Team, 2024) using the metafor package (Viechtbauer, 2010). Forest plots, funnel plots, and diagnostic figures were generated with ggplot2 and base metafor functions. Supplementary materials include additional diagnostic plots (trim-and-fill funnels, PET/PEESE scatterplots, Q–Q plots) and subgroup tables.
Results
Study characteristics
A total of 122 studies (128 reliability coefficients) were included in the reliability generalization meta-analysis of the BPS. The frequencies of categorical moderators and descriptive statistics of continuous moderators are summarized in Table 1, while Table 2 presents a summary of the coded study characteristics and moderators used in the reliability generalization meta-analysis.
Table 1
| Moderators | Cronbach’s alpha (f) | McDonald’s omega (f) | |
|---|---|---|---|
| Categorical moderators | |||
| Publication type | Article | 118 | 11 |
| Thesis | 9 | – | |
| Scale language | Chinese | 49 | – |
| English | 47 | – | |
| Other languages | 31 | – | |
| Region | Asia | 84 | – |
| Europe | 25 | – | |
| Sample group | Adolescents | 12 | 1 |
| General population | 33 | 6 | |
| University students | 76 | 4 | |
| Not reported | 7 | – | |
| Quantitative moderators | |||
| Mean | Standard deviation | ||
| Age | 22.61 | 9.85 | |
| BPS score | 3.14 | 0.83 | |
Frequencies of categorical moderators and descriptive statistics of continuous moderators.
Due to the limited number of studies reporting McDonald’s omega, moderator analyses could not be conducted for all subgroups; therefore, frequencies are reported only for the subgroups included in the moderator analyses.
Age and BPS score statistics were computed based on 110 and 114 studies, respectively. For both continuous moderators, means and standard deviations were weighted by sample size.
Table 2
| Study tag | Publication type | Alpha | Omega | Sample size | Language of BPS | Country | Age (Mean ± SD) | Sample group | Female ratio | BPS (Mean ± SD) |
|---|---|---|---|---|---|---|---|---|---|---|
| Ali et al. (2021) | Article | 0.782 | 510 | Arabic | Lebanon | 16.15 (3.24) | Adolescent | 74.90 | 3.07 (0.71) | |
| Alshammari et al. (2023) | Article | 0.640 | 495 | English | Saudi Arabia | 20.89 (2.01) | University stu. | 61.84 | 3.12 (0.76) | |
| An and Zhang (2024) | Article | 0.910 | 999 | Chinese | China | 21.16 (1.6) | General pop. | 74.87 | 3.0 (0.8) | |
| Andrews and Lokesh (2024) | Article | 0.870 | 488 | English | India | University stu. | 50.20 | 2.92 (0.66) | ||
| Bernecker and Job (2019) | Article | 0.890 | 185 | German | Germany | 21.73 (4.18) | University stu. | 86.40 | 3.29 (0.58) | |
| Article | 0.850 | 137 | German | Germany | 14.41 (0.6) | Adolescent | 51.10 | 2.97 (0.59) | ||
| Bistricky et al. (2025) | Article | 0.880 | 74 | English | USA | 25.68 (7.67) | General pop. | 89.20 | 3.07 (0.7) | |
| Brando-Garrido et al. (2022) | Article | 0.830 | 177 | Spanish | Spain | 23.1 (4.94) | University stu. | 75.71 | ||
| Broers (2014) | Thesis | 0.930 | 153 | English | USA | 38.23 (13.52) | General pop. | 54.20 | ||
| Thesis | 0.730 | 57 | Dutch | Holland | 21.53 (3.72) | University stu. | 64.90 | 2.14 (0.75) | ||
| Cai et al. (2022) | Article | 0.887 | 500 | Chinese | China | 19.4 (0.55) | University stu. | 83.50 | 4.25 (0.5) | |
| Carciofo and Cheung (2025) | Article | 0.867 | 306 | English | 20.36 (4.0) | University stu. | 88.88 | 2.8 (0.86) | ||
| Cemei et al. (2024) | Article | 0.950 | 683 | English | Pakistan | 18.83 (0.19) | University stu. | 3.11 (0.83) | ||
| Chen et al. (2022) | Article | 0.834 | 1827 | Chinese | China | 19.07 (1.09) | University stu. | 75.50 | ||
| Chen et al. (2023) | Article | 0.827 | 576 | Chinese | China | 18.16 (0.73) | University stu. | 44.37 | 3.24 (1.14) | |
| Chung et al. (2020) | Article | 0.850 | 106 | Korean | Korea | 22.7 (2.89) | General pop. | 61.30 | 3.35 (0.66) | |
| Cong et al. (2024) | Article | 0.890 | 466 | Chinese | China | 20.18 (1.42) | University stu. | 89.78 | 2.76 (0.83) | |
| Correa-Iriarte et al. (2023) | Article | 0.840 | 310 | English | Spain | 30.0 (10.1) | General pop. | 46.80 | ||
| Cui et al. (2021) | Article | 0.795 | 1,181 | Chinese | China | 18.91 (0.85) | University stu. | 50.72 | 2.85 (0.77) | |
| Dardara and AL-Makhalid (2021) | Article | 0.610 | 536 | English | Saudi Arabia | 24.27 (5.62) | University stu. | 39.60 | 3.77 (0.23) | |
| Delaei-Milan (2023) | Article | 0.875 | 133 | English | Iran | University stu. | ||||
| Deng et al. (2022) | Article | 0.800 | 913 | Chinese | China | 19.72 (1.24) | General pop. | 54.00 | 3.27 (0.67) | |
| Deng et al. (2024) | Article | 0.793 | 2,167 | Chinese | China | 12.99 (1.27) | Adolescent | 44.76 | 3.01 (0.51) | |
| Exelmans and Bulck (2021) | Article | 0.882 | 821 | English | Belgium | 45.6 (18.01) | General pop. | 59.00 | 2.62 (0.7) | |
| Fathy and Mandoob (2025) | Article | 0.790 | 490 | Arabic | Iraq | University stu. | 73.00 | 2.85 (0.75) | ||
| Feng and Sun (2022) | Article | 0.910 | 815 | Chinese | China | 19.53 (1.31) | University stu. | 87.24 | 3.13 (0.71) | |
| Feng et al. (2022) | Article | 0.738 | 364 | Chinese | China | 19.48 (0.93) | University stu. | 67.85 | 3.36 (0.74) | |
| Flores et al. (2023) | Article | 0.730 | 213 | English | Young adults | 80.28 | 2.99 (0.75) | |||
| Franco-Jimenez (2024) | Article | 0.740 | 419 | Spanish | Peru | 21.68 (3.26) | University stu. | 66.11 | 3.31 (0.86) | |
| Galama (2020) | Thesis | 0.920 | 32 | Dutch | Holland | 16.1 (0.81) | Adolescent | 68.75 | 2.83 (0.82) | |
| Geng et al. (2021) | Article | 0.800 | 355 | English | China | 19.42 (1.33) | University stu. | 83.10 | 2.75 (0.68) | |
| Guo et al. (2020) | Article | 0.787 | 401 | Chinese | China | 19.48 (0.85) | University stu. | 66.08 | 3.18 (0.66) | |
| Hammoudi et al. (2021) | Article | 0.750 | 591 | Arabic | Lebanon | 21.13 (4.08) | University stu. | 81.20 | 2.68 (0.73) | |
| Hamvai et al. (2023) | Article | 0.870 | 211 | English | Hungary | 22.25 (3.47) | University stu. | 71.60 | 2.82 (0.68) | |
| Hazumi et al. (2024) | Article | 0.860 | 0.860 | 574 | Japanese | Japan | 44.25 (12.84) | General pop. | 50.00 | 3.26 (0.86) |
| He et al. (2025) | Article | 0.800 | 1,021 | Chinese | China | 18.97 (0.96) | University stu. | 67.19 | 3.61 (0.75) | |
| Herzog-Krzywoszanska and Krzywoszanski (2019) | Article | 0.859 | 0.834 | 431 | Polish | Poland | 22.2 (3.23) | University stu. | 88.90 | 3.03 (0.68) |
| Article | 0.862 | 0.839 | 335 | Polish | Poland | 38.7 (13.3) | General pop. | 51.00 | 3.14 (0.76) | |
| Hill et al. (2025) | Article | 0.870 | 55 | English | International | 28.7 (6.5) | General pop. | 25.45 | 3.13 (0.87) | |
| Hou and Hu (2023) | Article | 0.860 | 1,336 | Chinese | China | 19.23 (1.49) | Undergraduate & graduate stu. | 65.76 | 3.27 (0.83) | |
| Huang et al. (2024) | Article | 0.846 | 1,048 | Chinese | China | 20.25 (2.29) | University stu. | 44.20 | 2.79 (0.76) | |
| Jakowski and Stork (2022) | Article | 0.880 | 98 | English | USA & Sweden | 21.0 (1.7) | University stu. | 62.24 | 3.2 (0.74) | |
| Jakowski (2022) | Article | 0.920 | 217 | German | Germany | 26.9 (7.0) | General pop. | 29.00 | 3.14 (0.43) | |
| Jeon et al. (2023) | Article | 0.720 | 374 | English | Korea | 23.08 (2.17) | General pop. | 84.50 | 3.24 (0.84) | |
| Jeoung et al. (2023) | Article | 0.540 | 60 | Korean | Korea | 21.33 (2.35) | Young adults | 86.70 | 3.34 (0.83) | |
| Jiang et al. (2024) | Article | 0.910 | 541 | Chinese | China | University stu. | 94.30 | 2.86 (0.62) | ||
| Kadzikowska-Wrzosek (2018) | Article | 0.850 | 304 | English | Poland | 28.54 (7.97) | University stu. | 71.70 | 2.86 (0.67) | |
| Kadzikowska-Wrzosek (2020) | Article | 0.850 | 175 | English | Poland | 17.66 (0.85) | Adolescent | 46.85 | ||
| Keulen (2020) | Thesis | 0.900 | 141 | English | Holland | 42.3 (15.6) | General pop. | 69.00 | 2.77 (0.96) | |
| Krishnan and Chew (2024) | Article | 0.870 | 221 | English | Singapore | 23.64 (5.72) | General pop. | 63.30 | 3.05 (0.94) | |
| Kroese et al. (2014) | Article | 0.920 | 177 | English | USA | 39.7 (11.0) | General pop. | 51.40 | 3.11 (0.56) | |
| Kroese et al. (2016) | Article | 0.880 | 2,431 | English | Holland | 50.7 (18.1) | General pop. | 54.50 | 2.96 (0.6) | |
| Kullik et al. (2025) | Article | 0.930 | 20 | English | Germany | 12.9 (1.68) | Adolescent | 100.00 | 3.38 (0.71) | |
| Kıraç et al. (2021) | Article | 0.865 | 768 | Turkish | Türkiye | General pop. | 65.90 | 3.23 (0.85) | ||
| Lee et al. (2025) | Article | 0.824 | 0.817 | 300 | Korean | Korea | 17.0 (0.9) | Adolescent | 50.00 | 2.78 (0.92) |
| Li et al. (2025) | Article | 0.772 | 522 | Chinese | China | 29.87 (4.85) | In-service clinical nurses | 88.31 | 3.12 (0.21) | |
| Lin et al. (2025) | Article | 0.920 | 1,423 | Chinese | China | University stu. | 80.60 | 2.71 (0.81) | ||
| Ling et al. (2024) | Article | 0.870 | 763 | Chinese | China | 19.48 (2.06) | University stu. | 64.60 | ||
| Lionnet (2023) | Thesis | 0.920 | 327 | English | New Zealand | 20.93 (6.34) | University stu. | 80.70 | 3.22 (0.86) | |
| Liu et al. (2024) | Article | 0.853 | 4,196 | English | China | 29.17 (0.14) | General pop. | 42.28 | 3.48 (0.72) | |
| Liu et al. (2025) | Article | 0.840 | 990 | Chinese | China | 23.06 (4.21) | University stu. | 46.06 | 2.89 (0.8) | |
| Luo et al. (2024) | Article | 0.890 | 0.892 | 252 | English | China | 20.32 (1.47) | University stu. | 100.00 | 2.52 (0.32) |
| Ma et al. (2022) | Article | 0.820 | 1,550 | Chinese | China | 19.3 (0.98) | University stu. | 69.29 | 3.22 (0.77) | |
| Mao et al. (2022) | Article | 0.850 | 3,687 | Chinese | China | 16.17 (2.42) | General pop. | 57.23 | 3.17 (0.81) | |
| Meng and Xuan (2023) | Article | 0.868 | 707 | Chinese | China | University stu. | 70.16 | 3.25 (0.8) | ||
| Meng et al. (2021) | Article | 0.867 | 267 | Chinese | China | University stu. | 67.41 | |||
| Article | 0.863 | 361 | Chinese | China | University stu. | 73.68 | 3.38 (0.83) | |||
| Meng et al. (2022) | Article | 0.831 | 552 | Chinese | China | 19.22 (0.64) | University stu. | 62.86 | 3.01 (0.85) | |
| Meng et al. (2024) | Article | 0.982 | 3,599 | Chinese | China | 19.12 (1.05) | University stu. | 44.80 | 2.7 (0.8) | |
| Meng et al. (2023) | Article | 0.855 | 583 | Chinese | China | 20.02 (1.85) | University stu. | 71.35 | 2.98 (0.36) | |
| Miyagawa et al. (2024) | Article | 0.900 | 0.920 | 252 | Japanese | Japan | 39.36 (9.27) | General pop. | 55.60 | 2.97 (0.83) |
| Article | 0.900 | 0.920 | 630 | Japanese | Japan | 37.69 (12.82) | General pop. | 57.20 | ||
| Mu et al. (2023) | Article | 0.860 | 271 | Chinese | China | 21.5 (2.8) | University stu. | 58.30 | 2.86 (0.73) | |
| Nauts et al. (2016) | Article | 0.910 | 234 | English | USA | 37.1 (13.48) | General pop. | 42.31 | 2.7 (0.78) | |
| Okay et al. (2022) | Article | 0.910 | 317 | Turkish | Türkiye | 21.78 (3.94) | General pop. | 78.86 | 2.97 (0.77) | |
| Oliveira et al. (2022) | Article | 0.900 | 560 | Portuguese | Portugal | 29.85 (12.83) | General pop. | 74.50 | 3.2 (0.88) | |
| Oliveira et al. (2025) | Article | 0.900 | 0.900 | 653 | Portuguese | Portugal | 29.8 (12.45) | General pop. | 74.70 | 2.66 (0.72) |
| Pillion (2023) | Thesis | 0.720 | 711 | English | Australia | 15.1 (1.2) | Adolescent | 47.30 | 2.8 (0.41) | |
| Pu et al. (2022) | Article | 0.850 | 121 | English | Singapore | 15.9 (1.14) | Adolescent | 54.55 | 3.08 (0.75) | |
| Pu et al. (2025) | Article | 0.850 | 119 | English | Singapore | 22.66 (1.67) | University stu. | 53.78 | 2.25 (0.77) | |
| Qin et al. (2025) | Article | 0.873 | 769 | English | 20.89 (1.63) | University stu. | 75.90 | 3.38 (1.24) | ||
| Rahayu and Caninsti (2024) | Article | 0.678 | 192 | Indonesian | Indonesia | Adolescent | 75.00 | 3.22 (0.84) | ||
| Rapoport et al. (2025) | Article | 0.910 | 262 | German | Germany | 35.35 (14.05) | General pop. | 66.41 | 3.03 (0.77) | |
| Rasouli et al. (2025) | Article | 0.840 | 433 | Persian | Iran | 22.57 (3.52) | General pop. | 55.70 | 3.23 (0.89) | |
| Rehman et al. (2023) | Article | 0.920 | 0.900 | 241 | English | Pakistan | 29.72 (9.3) | General pop. | 87.5 | 2.79 (0.65) |
| Saed et al. (2019) | Article | 0.820 | 433 | English | Iran | University stu. | 55.66 | 2.91 (0.8) | ||
| Santos (2020) | Thesis | 0.900 | 446 | Portuguese | Portugal | 23.7 (5.49) | University stu. | 70.00 | 3.11 (0.85) | |
| Sezer et al. (2025) | Article | 0.880 | 336 | English | UK | 43.11 (11.41) | General pop. | 56.00 | 3.19 (0.62) | |
| Shao et al. (2024) | Article | 0.800 | 453 | Chinese | China | 21.21 (1.59) | University stu. | 44.80 | ||
| Shi et al. (2024) | Article | 0.770 | 737 | Chinese | China | 20.05 (1.38) | University stu. | 80.87 | 3.08 (0.61) | |
| Shoukat et al. (2025) | Article | 0.780 | 300 | English | Pakistan | University stu. | 50.00 | 3.25 (1.69) | ||
| Shukla and Andrade (2023) | Article | 0.780 | 560 | English | India | 19.8 (1.9) | Undergraduate & graduate stu. | 57.50 | 3.12 (0.82) | |
| Sirois et al. (2019) | Article | 0.890 | 134 | English | UK | 30.22 (13.5) | General pop. | 77.40 | 3.07 (0.76) | |
| Article | 0.900 | 646 | English | UK | 30.74 (12.2) | General pop. | 68.90 | |||
| Song et al. (2024) | Article | 0.824 | 0.817 | 300 | Korean | Korea | 17.0 (0.9) | University stu. | 50.00 | 2.68 (0.68) |
| Teoh and Wong (2023) | Article | 0.870 | 220 | English | Australia | 20.34 (2.86) | University stu. | 67.73 | 3.49 (0.76) | |
| Teoh et al. (2021) | Article | 0.830 | 270 | English | Singapore | 22.39 (5.41) | University stu. | 73.33 | 2.74 (0.76) | |
| Trost and Hast (2024) | Article | 0.890 | 418 | German | Germany | 23.3 (3.0) | Young adults | 83.60 | 3.62 (0.64) | |
| Tu et al. (2023) | Article | 0.790 | 910 | Chinese | China | 20.14 (3.48) | University stu. | 60.00 | 3.02 (0.39) | |
| Türkarslan et al. (2020) | Article | 0.910 | 229 | Turkish | Türkiye | 27.82 (10.81) | General pop. | 68.12 | 3.1 (0.74) | |
| Uygur and Bahar (2023a) | Article | 0.610 | 497 | Turkish | Türkiye | 20.41 (1.83) | University stu. | 72.80 | 3.42 (0.77) | |
| Uygur and Bahar (2023b) | Article | 0.760 | 553 | Turkish | Türkiye | 20.55 (2.17) | University stu. | 69.60 | 2.8 (0.8) | |
| Wang et al. (2024) | Article | 0.840 | 54 | Chinese | China | 19.8 (0.6) | University stu. | 92.60 | ||
| Wang et al. (2025) | Article | 0.876 | 935 | Chinese | China | University stu. | 53.50 | 4.17 (1.43) | ||
| Washof (2023) | Thesis | 0.750 | 149 | Dutch | Holland | 38.8 (13.3) | General pop. | 53.69 | 3.25 (0.73) | |
| Xu et al. (2024) | Article | 0.890 | 855 | Chinese | China | 21.16 (1.83) | University stu. | 46.20 | ||
| Yang et al. (2023) | Article | 0.804 | 1,217 | Chinese | China | 20.3 (2.2) | University stu. | 42.65 | 3.11 (0.98) | |
| Yang et al. (2024) | Article | 0.850 | 2044 | English | China | University stu. | 63.11 | 3.71 (0.3) | ||
| Yasin et al. (2024) | Article | 0.740 | 182 | English | Pakistan | 21.98 (2.17) | University stu. | 100.00 | 3.01 (0.41) | |
| Yinn et al. (2024) | Article | 0.852 | 108 | English | Malaysia | 22.27 (1.89) | Young adults | 57.40 | 3.1 (0.8) | |
| You et al. (2020) | Article | 0.880 | 1,104 | Chinese | China | 20.2 (1.43) | University stu. | 63.00 | 2.94 (0.93) | |
| You et al. (2023) | Article | 0.880 | 1,103 | Chinese | China | 20.17 (1.43) | University stu. | 63.00 | 3.02 (0.66) | |
| Yu et al. (2025) | Article | 0.872 | 356 | Chinese | China | University stu. | 50.60 | 2.46 (0.63) | ||
| Yuan et al. (2024) | Article | 0.840 | 464 | English | China | 21.7 (3.1) | University stu. | 65.50 | 3.15 (0.87) | |
| Zhang and Shi (2025) | Article | 0.870 | 2052 | Chinese | China | 20.0 (1.53) | University stu. | 68.40 | 2.91 (0.63) | |
| Zhang and Wu (2020) | Article | 0.790 | 427 | English | China | 19.36 (1.06) | University stu. | 66.00 | 3.13 (1.01) | |
| Zhang (2024) | Thesis | 0.860 | 105 | English | International | 23.9 (4.07) | University stu. | 73.38 | ||
| Zhang C. et al. (2023) | Article | 0.805 | 318 | Chinese | China | 16.92 (0.67) | Adolescent | 64.20 | 3.2 (0.56) | |
| Zhang M. X. et al. (2023) | Article | 0.813 | 698 | Chinese | China | 20.15 (1.77) | University stu. | 33.38 | 3.41 (0.77) | |
| Zhang et al. (2024) | Article | 0.830 | 3,539 | Chinese | China | 15.6 (2.9) | Elementary to college stu. | 59.80 | 3.36 (0.87) | |
| Zhang et al. (2025) | Article | 0.917 | 403 | English | Pakistan | 23.42 (4.2) | University stu. | 58.31 | 3.28 (0.91) | |
| Zhao et al. (2024) | Article | 0.874 | 288 | Chinese | China | 20.89 (2.27) | Undergraduate & graduate stu. | 68.40 | 2.98 (0.75) | |
| Zhuo (2024) | Article | 0.860 | 474 | Chinese | China | University stu. | 53.00 | 3.23 (0.84) | ||
| Zhou et al. (2025) | Article | 0.922 | 6,543 | Chinese | China | University stu. | 64.70 | 3.19 (0.84) | ||
| Zhu et al. (2020) | Article | 0.795 | 391 | Chinese | China | 19.48 (0.86) | University stu. | 66.75 | 3.34 (0.81) | |
| Zhu et al. (2022) | Article | 0.760 | 2,822 | Chinese | China | 19.77 (1.41) | University stu. | 71.40 | 3.55 (0.64) | |
| Zhu et al. (2023) | Article | 0.780 | 668 | Chinese | China | 20.36 (1.69) | University stu. | 64.97 | 2.92 (0.66) | |
| Zhu et al. (2024) | Article | 0.830 | 665 | Chinese | China | 13.72 (1.64) | Adolescent | 49.77 | 3.29 (0.87) | |
Summary of coded study characteristics in the reliability generalization meta-analysis of BPS.
When the study tag includes “a” and “b” within the year (e.g., Uygur and Bahar, 2023a,b), this denotes two distinct studies by the same author in the same year. stu., students; pop., population. Empty cells denote missing information in the original study. For consistency, BPS mean and SD values were recalculated and transformed to item-level metrics when reported as total scores.
The majority were journal articles, with a smaller number of theses. Sample sizes varied widely, ranging from very small groups of fewer than 30 participants to large-scale studies with several thousand respondents. Studies represented diverse geographical regions and languages, including Chinese, English, Arabic, Turkish, German, Spanish, Portuguese, and others, reflecting broad international use of the BPS.
Participants encompassed a variety of groups, most commonly university students, but also adolescents, general population samples, and young adults. The average age across samples ranged from early adolescence to middle adulthood, with female participation rates differing substantially across studies.
Internal consistency estimates (Cronbach’s alpha and, where available, McDonald’s omega) showed considerable variability across studies. In several cases, more than one coefficient was reported within a single publication due to analyses conducted on multiple groups. When the same study tag appears with suffixes “a” and “b,” this denotes distinct groups within the same study; when tags include “_1” and “_2,” this indicates separate studies conducted by the same author in the same year. Empty cells reflect missing information in the original reports.
Bps alpha
Publication and reporting biases (α)
Publication bias was examined using multiple, complementary diagnostics based on Bonett’s ABT transformation of Cronbach’s alpha. Visual inspection of the funnel plot (Figure 2) shows the distribution of individual studies around the pooled estimate, plotted against the standard error, allowing assessment of potential small-study effects. Visual inspection was paired with formal tests, which did not indicate clear asymmetry: Egger’s regression was non-significant (z = 0.268, p = 0.789), and Begg–Mazumdar’s rank correlation was also non-significant (Kendall’s τ = 0.110, p = 0.068). As a sensitivity check, Duval and Tweedie’s trim-and-fill procedure imputed k₀ = 20 potentially missing studies and yielded a downward-adjusted pooled reliability of α = 0.836 [95% CI (0.822, 0.850)], compared with the original REML estimate of α = 0.855 [95% CI (0.843, 0.865)]; this corresponds to an absolute change of −0.019 (≈ −2.16%), suggesting that possible unpublished (or published but that not report the empirical reliability) studies would have only a modest impact on the pooled estimate.
Figure 2
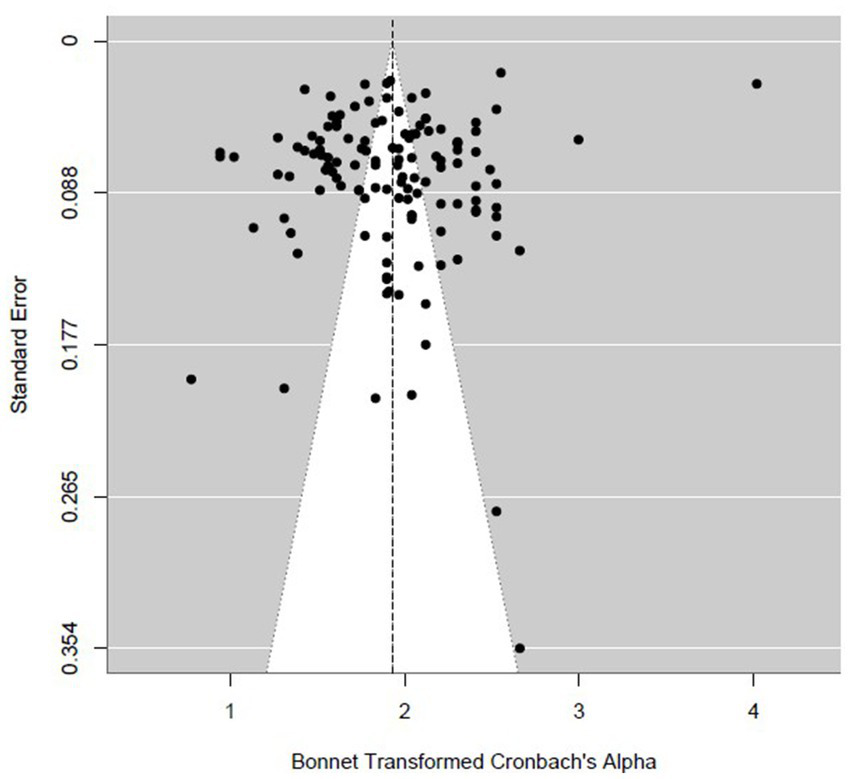
Funnel plot of Cronbach’s alpha (Bonett-transformed) for the BPS.
To further probe small-study effects, PET and PEESE meta-regressions produced bias-adjusted intercepts of α = 0.8518 and α = 0.8515, respectively, which closely align with the original pooled estimate, suggesting minimal impact of small-study/publication bias on the central estimate. Taken together, the evidence is mixed. That is, trim-and-fill indicates possible missing, less precise studies that would slightly lower the pooled reliability, whereas Egger, Begg-Mazumdar, PET, and PEESE provide little support for material small-study bias. The pooled reliability estimate is therefore interpreted as robust, with all diagnostics reported for transparency (see Supplementary Figures S1–S3: trim-and-fill funnel, PET, and PEESE scatterplots).
Mean reliability and heterogeneity (α)
A random-effects meta-analysis was conducted on 127 (one study only reported omega) independent samples using Bonett’s ABT transformation of Cronbach’s alpha (REML estimator). The pooled effect on the ABT scale1 was 1.9286 [SE = 0.0388, z = 49.71, p < 0.0001; 95% CI (1.8525, 2.0046)], which back-translates to a mean reliability of α = 0.8546 [95% CI (0.8432, 0.8653)]. Between-study heterogeneity was very large: τ2 = 0.1827 (SE = 0.0240), τ = 0.4274, I2 = 98.24%, H2 = 56.88; Cochran’s Q(126) = 11,892.77, p < 0.0001. All heterogeneity statistics (τ2 and τ) are reported on the transformed (ABT) scale. Reflecting this heterogeneity, the 95% prediction interval on the alpha scale was wide (0.6629–0.9373), indicating that future studies conducted under similar conditions may plausibly yield reliability estimates across this range. The dispersion of study-specific estimates is visualized in the forest plot (see Supplementary Figure S4), which illustrates both the concentration of effects around the pooled estimate of the mean and the presence of studies with lower and higher reliability.
Leave-one-out diagnostics did not reveal undue influence by any single study. Across the most influential omissions identified, the back-transformed pooled α remained tightly bounded (approximately 0.852–0.856), while heterogeneity indices stayed high (e.g., I2 ≈ 97.7–98.2%; τ2 ≈ 0.146–0.181). A Q–Q plot of standardized residuals (see Supplementary Figure S5) further indicated approximate normality, with most studies following the theoretical quantile line reasonably well and only modest deviations in the tails. This pattern supports the robustness of the central estimate while reflecting the very high heterogeneity observed across studies. Taken together, the central estimate of reliability is stable, but the magnitude of heterogeneity suggests that moderator analyses are warranted to explain systematic variability across studies.
Meta regressions for continuous moderator variables (α)
Mixed-effects meta-regressions were conducted to examine whether sample characteristics and scale scores accounted for heterogeneity in Cronbach’s alpha coefficients of the BPS (Table 3). Mean age was positively associated with reliability estimates, b = 0.016, 95% CI [0.005, 0.027], p = 0.005, explaining 6.87% of the heterogeneity. Similarly, age variability (sd of age) was a significant positive predictor, b = 0.030, 95% CI [0.012, 0.048], p = 0.001, accounting for 8.75% of the heterogeneity (see Supplementary Figures S6, S7). That is, studies with older samples and greater age variability tend to report higher reliability estimates for the BPS scores. By contrast, the proportion of women in the sample was unrelated to reliability (p = 0.935). With respect to sample size, the raw n specification showed a marginal trend, b ≈ 0.000, 95% CI [−0.000, 0.000], p = 0.072, explaining 2.07% of heterogeneity, whereas the log-transformed N was clearly nonsignificant (p = 0.619). For scale score moderators, neither the mean BPS score (b = −0.200, 95% CI [−0.470, 0.070], p = 0.144) nor the SD of BPS scores (b = 0.197, 95% CI [−0.231, 0.625], p = 0.365) significantly predicted reliability. Both explained negligible portions of heterogeneity (≤1.3%). Overall, while older average age and greater age variability of participants were associated with higher reliability, these effects were small. Moreover, the persistence of very high I2 values should be interpreted cautiously, as I2 is a relative measure of heterogeneity and may remain inflated in meta-analyses with generally large sample sizes and very small sampling variances, even when the inclusion of moderators leads to only modest reductions in the true between-study variance (τ2).
Table 3
| Moderator | k | τ 2 | I 2 (%) | R 2 (%) | Estimate (b) | 95% CI | p |
|---|---|---|---|---|---|---|---|
| Mean age | 110 | 0.182 | 98.10 | 6.87 | 0.016 | 0.005, 0.027 | 0.005* |
| SD age | 109 | 0.175 | 98.04 | 8.75 | 0.030 | 0.012, 0.048 | 0.001* |
| Women (%) | 125 | 0.177 | 98.19 | 0.00 | 0.000 | −0.005, 0.005 | 0.935 |
| Sample size (n) | 127 | 0.179 | 98.13 | 2.07 | 0.000 | −0.000, 0.000 | 0.072 |
| Sample size (log n) | 127 | 0.184 | 98.21 | 0.00 | 0.020 | −0.059, 0.100 | 0.619 |
| Mean BPS score | 113 | 0.194 | 98.39 | 1.27 | −0.200 | −0.470, 0.070 | 0.144 |
| sd BPS score | 113 | 0.197 | 98.42 | 0.00 | 0.197 | −0.231, 0.625 | 0.365 |
Mixed-effects meta-regression results for continuous moderators of BPS (α).
*p < 0.05; k: number of alphas included.
Subgroup analyses for categorical moderator variables (α)
Subgroup analyses (Table 4) using a common-τ2 model showed a significant difference by Region [Q(1) = 5.776, p = 0.016], with Europe exhibiting higher reliability (α ≈ 0.877) than Asia (α ≈ 0.845). That is, studies conducted in Europe tend to report more reliable BPS scores than studies conducted in Asia. Scale language showed no differences [Q(2) = 0.539, p = 0.764]. Sample group was significant [Q(2) = 10.742, p = 0.005]; pairwise tests (Bonferroni) indicated that the general population had higher reliability than university students (α ≈ 0.882 vs. 0.849; p_adj = 0.016) and adolescents (α ≈ 0.882 vs. 0.825; p_adj = 0.018), whereas adolescents and university students did not differ (α ≈ 0.825 vs. 0.849; p_adj = 0.760) (see Supplementary Table S1). In other words, BPS scores appear to be more reliable in studies based on general population samples than in studies focusing on university students or adolescents. Publication type showed no difference [Q(1) = 0.421, p = 0.516]. The moderators explained ≈4.1% (Region) and ≈7.5% (Sample group) of between-study variance (R2; see Supplementary Table S2).
Table 4
| Moderator | Category | k | Alpha [CI] | Z | Q | df | p |
|---|---|---|---|---|---|---|---|
| Region | Asia | 84 | 0.845 [0.830–0.858] | 40.903* | 5.776* | 1 | 0.016 |
| Europe | 25 | 0.877 [0.855–0.896] | 24.499* | ||||
| Scale language | Chinese | 49 | 0.854 [0.835–0.871] | 30.954* | 0.539 | 2 | 0.764 |
| English | 47 | 0.859 [0.840–0.876] | 30.329* | ||||
| Others | 31 | 0.849 [0.823–0.870] | 23.721* | ||||
| Sample group | Adolescent | 12 | 0.825 [0.777–0.863] | 14.088* | 10.742* | 2 | 0.005 |
| General population | 33 | 0.882 [0.864–0.897] | 29.439* | ||||
| University students | 76 | 0.849 [0.835–0.863] | 39.931* | ||||
| Publication type | Article | 118 | 0.854 [0.842–0.865] | 47.748* | 0.421 | 1 | 0.516 |
| Thesis | 9 | 0.868 [0.822–0.902] | 13.445* |
Subgroup analyses for categorical moderators (α).
*p < 0.05; k: number of alphas included.
Alpha coefficients were pooled on the alpha-based transformation (ABT) scale. The Z statistic tests whether the pooled alpha estimate for each subgroup differs significantly from zero. The Q statistic, along with its degrees of freedom (df) and p-value, represents the between-groups omnibus test assessing whether pooled alpha coefficients differ significantly across categories of the moderator (i.e., a meta-analytic analogue of ANOVA).
Bps omega
Publication and reporting biases (ω)
Publication bias was assessed using multiple, complementary diagnostics on the Bonett-transformed scale. Formal tests did not indicate asymmetry: Egger’s regression was non-significant (z = 0.0496, p = 0.9604), and Begg–Mazumdar’s rank correlation was also non-significant (Kendall’s τ = −0.0561, p = 0.8137). Visual inspection of the funnel plot suggested symmetry (Figure 3).
Figure 3
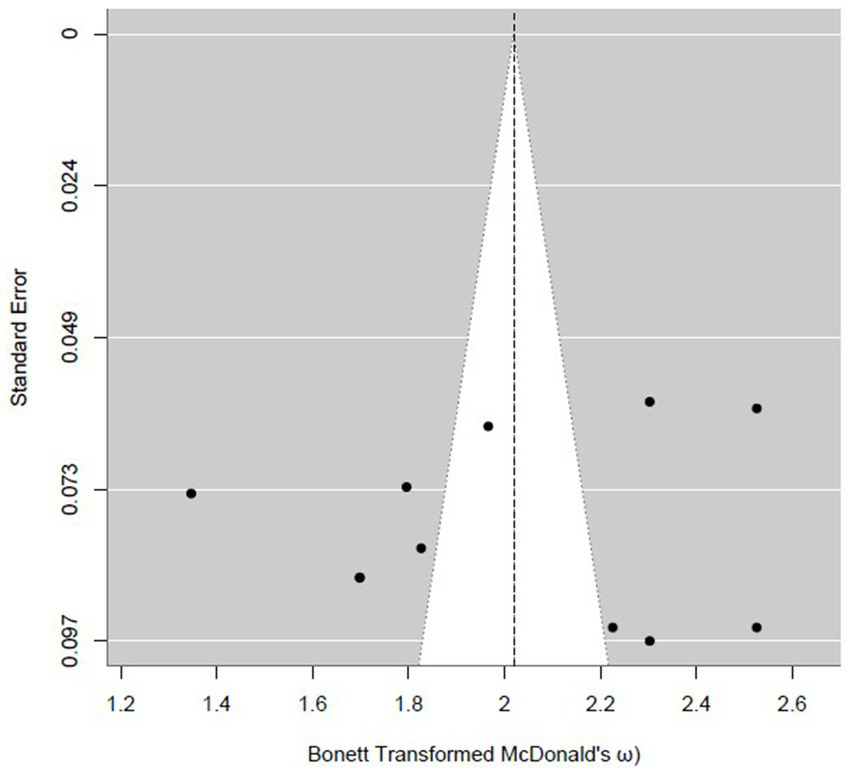
Funnel plot of McDonald’s omega (Bonett-transformed) for the BPS.
As a sensitivity check, Duval and Tweedie’s trim-and-fill procedure imputed k₀ = 0 studies and left the pooled estimate unchanged at ω = 0.867 [95% CI (0.833, 0.894)]. PET and PEESE meta-regressions yielded bias-adjusted intercepts close to the pooled estimate (PET ω = 0.8625; PEESE ω = 0.8561). Taken together, these indicators provide little evidence of material small-study/publication bias, and the central reliability estimate appears robust (see Supplementary Figures S8–S10: trim-and-fill funnel, PET, and PEESE scatterplots).
Mean reliability and heterogeneity (ω)
A random-effects meta-analysis on k = 11 independent samples yielded a pooled effect of 2.019 on the ABT transformed scale [SE = 0.116, z = 17.48, p < 0.0001; 95% CI (1.793, 2.246)]. Back-transformed to McDonald’s omega, the mean reliability was ω = 0.867 with 95% CI [0.834, 0.894]. Between-study heterogeneity was substantial: τ2 = 0.140 (SE = 0.066), τ = 0.375, I2 = 96.07%, H2 = 25.41; Cochran’s Q(10) = 262.60, p < 0.0001. Consistent with this dispersion, the 95% prediction interval on the omega scale was [0.714, 0.938], indicating that future studies conducted under similar conditions may plausibly yield reliability estimates across this range. Study-level estimates and their confidence intervals are displayed in the forest plot (Figure 4). Individual study estimates with 95% confidence intervals are shown as squares and horizontal lines, respectively. The size of the square reflects the study’s weight, and the diamond represents the pooled reliability estimate with its confidence interval.
Figure 4
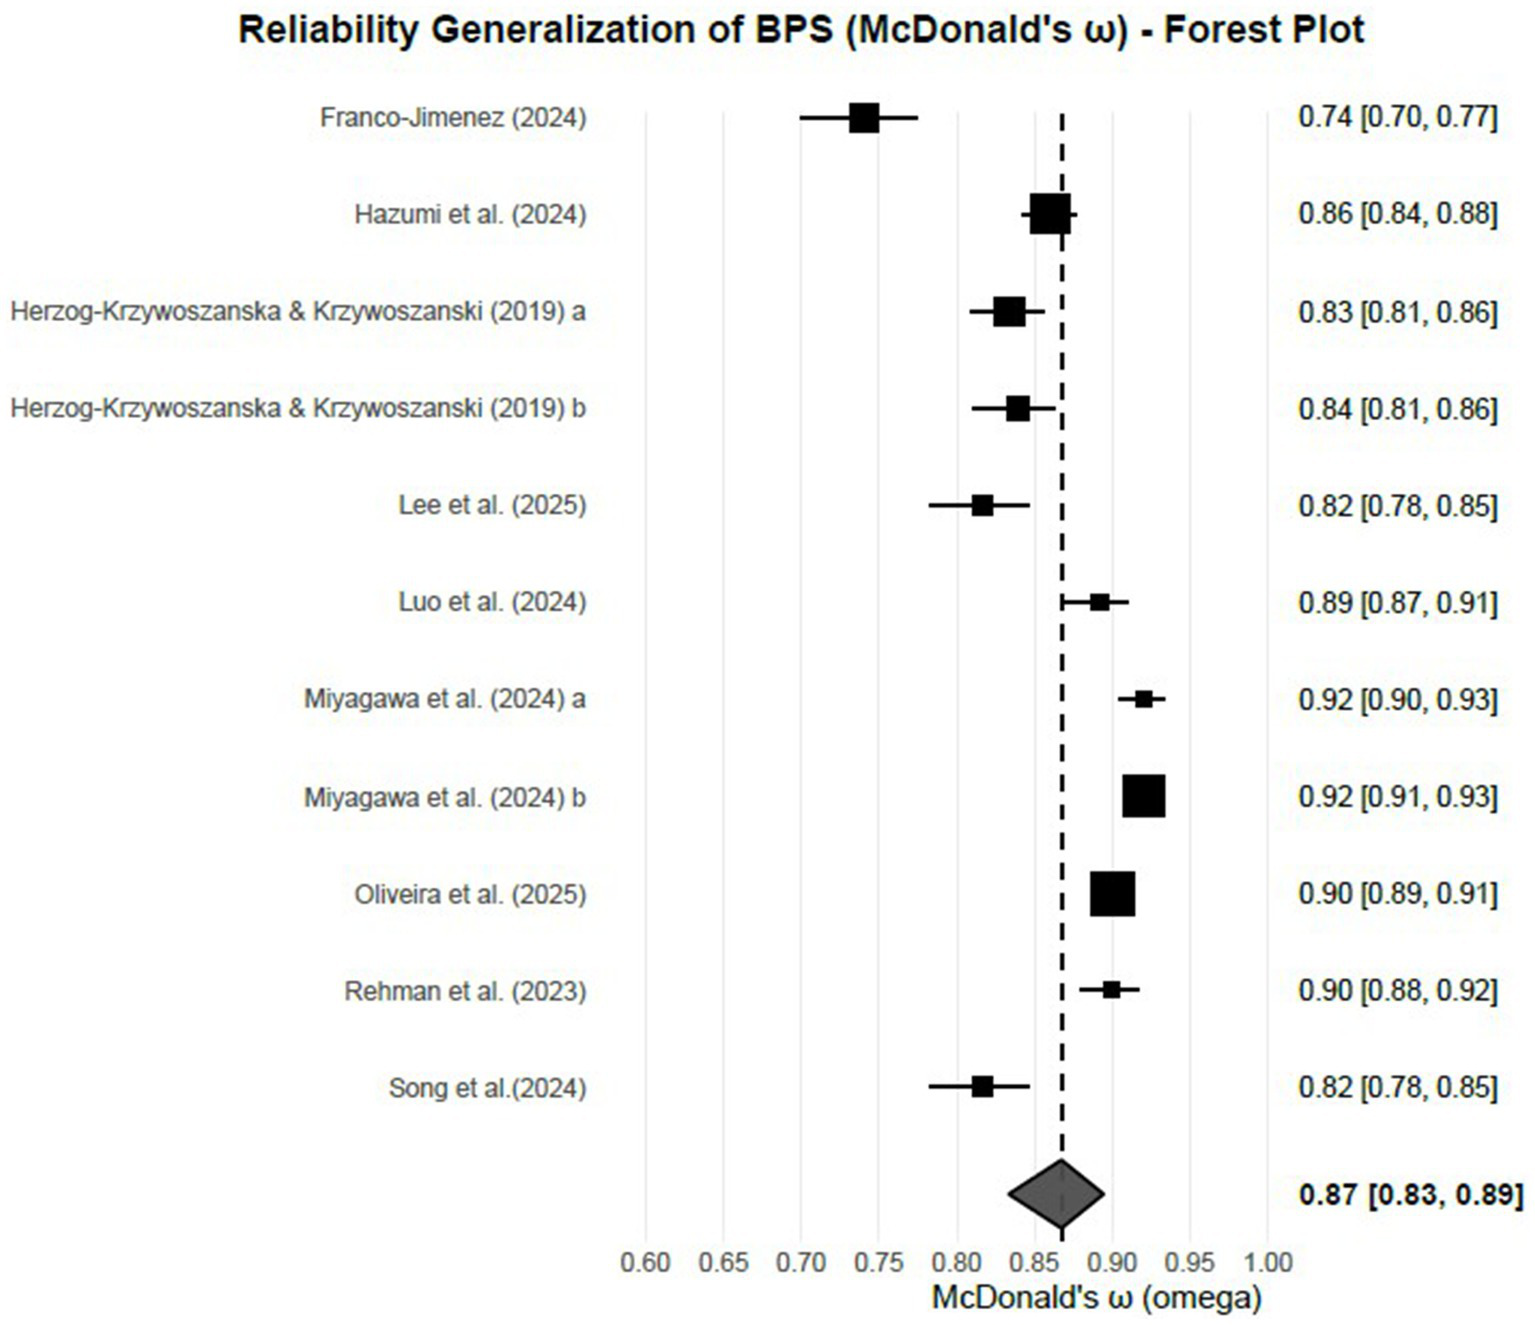
Forest plot of McDonald’s ω for the BPS.
Leave-one-out analyses did not indicate undue influence by any single study. Across the most influential omissions, heterogeneity remained high (I2 ≈ 94.56–96.46%; τ2 ≈ 0.101–0.152), and the pooled effect on the transformed scale remained within a narrow band, implying a stable central estimate despite notable between-study variability. A Q–Q plot of standardized residuals (see Supplementary Figure S11) further indicated approximate normality, with most studies following the theoretical quantile line and only modest deviations at the extremes. This supports the robustness of the central estimate while highlighting the very high heterogeneity observed across studies.
Meta regressions for continuous moderator variables (ω)
Mixed-effects meta-regressions were conducted to examine whether sample characteristics and scale scores accounted for heterogeneity in McDonald’s ω coefficients of the BPS (Table 5). None of the continuous moderators reached statistical significance (all p ≥ 0.086). For age-related moderators, mean age showed a non-significant positive association, b = 0.020, 95% CI [−0.005, 0.045], p = 0.099, and age variability (sd of age) was likewise non-significant, b = 0.039, 95% CI [−0.007, 0.085], p = 0.086. The proportion of women was unrelated to reliability, b = 0.004, 95% CI [−0.011, 0.020], p = 0.546. Neither sample size in raw units [b ≈ 0.000, 95% CI (−0.001, 0.002), p = 0.656] nor on the log scale [b = 0.042, 95% CI (−0.724, 0.808), p = 0.903] predicted ω. For scale-score moderators, mean BPS [b = −0.612, 95% CI (−1.587, 0.363), p = 0.186] and sd of BPS [b = −0.738, 95% CI (−2.385, 0.909), p = 0.332] were also non-significant. Overall, residual heterogeneity remained very high (I2 ≈ 95–96%), indicating that most between-study variability in ω was not explained by these moderators with the available k (10–11 studies per model).
Table 5
| Moderator | k | τ 2 | I 2 (%) | R 2 (%) | Estimate (b) | 95% CI | p |
|---|---|---|---|---|---|---|---|
| Mean age | 11 | 0.112 | 95.09 | 20.00 | 0.020 | −0.005, 0.045 | 0.099 |
| SD age | 11 | 0.108 | 94.92 | 22.75 | 0.039 | −0.007, 0.085 | 0.086 |
| Women (%) | 11 | 0.150 | 96.33 | 0.00 | 0.004 | −0.011, 0.020 | 0.546 |
| Sample size (n) | 11 | 0.153 | 96.30 | 0.00 | 0.000 | −0.001, 0.002 | 0.656 |
| Sample size (log n) | 11 | 0.156 | 96.41 | 0.00 | 0.042 | −0.724, 0.808 | 0.903 |
| Mean BPS score | 10 | 0.109 | 94.57 | 11.88 | −0.612 | −1.587, 0.363 | 0.186 |
| SD BPS score | 10 | 0.123 | 95.35 | 1.01 | −0.738 | −2.385, 0.909 | 0.332 |
Mixed-effects meta-regression results for continuous moderators of BPS (ω).
*p < 0.05; k: number of omegas included.
Subgroup analyses for categorical moderator variables (ω)
Subgroup analyses using a common-τ2 model compared university students and the general population (Table 6). The between-groups test was significant, Q(1) = 5.445, p = 0.020, with higher reliability in general population samples [ω = 0.894, 95% CI (0.863, 0.917); k = 6] than in university student samples [ω = 0.828, 95% CI (0.766, 0.874); k = 4]. The sample-group moderator explained ≈34.7% of the between-study variance (R2; see Supplementary Table S3). Other categorical moderators were not analyzed for ω due to feasibility (sparse cells for Region, Scale language) or no variability (Publication type: all articles).
Table 6
| Sample group | k | ω [95% CI] | Z | Q | df | p |
|---|---|---|---|---|---|---|
| General population | 6 | 0.894 [0.863–0.917] | 17.345* | 5.445* | 1 | 0.020 |
| University students | 4 | 0.828 [0.766–0.874] | 11.097* |
Subgroup analysis for sample group (ω).
*p < 0.05; k: number of omegas included.
Z-statistic tests pooled effects on the ABT scale. Q/df/p are the between-groups omnibus tests (analog ANOVA).
Discussion
Reliability is crucial in psychological assessment because it ensures the consistency and accuracy of the data collected. Unreliable data can compromise the validity of research findings and lead to incorrect conclusions. Using the REGEMA framework, the present study aimed to evaluate the reliability of the Bedtime Procrastination Scale (BPS) across diverse cultural, linguistic, and sample characteristics. Accordingly, reliability generalization meta-analyses were conducted to estimate the pooled reliability of the BPS using two internal consistency coefficients—Cronbach’s alpha and McDonald’s omega—and to investigate potential moderator variables that may account for variability in reliability estimates across individual studies. The results indicated that the pooled reliability estimates were 0.855 for Cronbach’s alpha and 0.867 for McDonald’s omega. It should be noted that the pooled McDonald’s omega estimate was based on a smaller number of studies. The pooled reliability estimates were higher than the commonly accepted threshold of 0.70 (Cohen et al., 2022; George and Mallery, 2020; Nunnally and Bernstein, 1994). While this cut-off is considered sufficient for studies focusing on predictive or construct validity (Nunnally and Bernstein, 1994), higher thresholds of 0.90 or 0.95 are recommended in contexts involving high risk or critical decision-making (Cohen et al., 2022; Nunnally and Bernstein, 1994). From a construct validity perspective, the pooled reliability estimates obtained in this study can therefore be considered acceptable.
In addition, 95% prediction intervals were estimated for both Cronbach’s alpha and McDonald’s omega (for Cronbach’s alpha: 0.6629–0.9373; for McDonald’s omega: 0.714–0.938). Prediction intervals provide an estimate of the range within which reliability coefficients of future studies are expected to fall (Higgins et al., 2009; IntHout et al., 2016). The relatively wide prediction intervals observed in this study indicate that caution is warranted, particularly in situations involving high-stakes or critical decisions.
Identifying sources affecting the homogeneity of reliability is another key point of the study. After estimating pooled reliability, the homogeneity of reliability coefficients was assessed using Cochran’s Q, the I2 index (Higgins and Thompson, 2002), and the H2 statistic. The results showed that in the analysis of internal consistency coefficients such as Cronbach’s alpha and McDonald’s omega, there was a significant degree of variability between studies, commonly referred to as inter-study heterogeneity. Moderator analyses revealed that various characteristics were statistically significant predictors of variability in reliability estimates. However, the heterogeneity explained by these moderators was generally found to be low. This may be partly due to the large number of studies included in the analysis, whereby even small differences in a large sample can become statistically significant (Borenstein et al., 2009). Furthermore, it highlights the need for careful interpretation of statistical significance and that it should not be equated with practical importance.
In this study, mean age, standard deviation of age, proportion of female participants, sample size, mean BPS scores, and standard deviation of BPS scores were included as continuous moderators, and analyses were conducted to account for the observed heterogeneity in Cronbach’s alpha and McDonald’s omega coefficients. Meta-regression results for Cronbach’s alpha revealed that both mean age and age variability (standard deviation of age) were significantly associated with reliability, indicating that higher average age and greater dispersion in participant ages corresponded to increased Cronbach’s alpha values. Supporting this perspective, Schipke and Freund (2012) reported that samples consisting solely of adults or solely of older individuals negatively affected reliability, whereas larger sample sizes tended to have a positive influence. By contrast, no significant associations were observed for female proportion, sample size, mean BPS score, or standard deviation of BPS score, which showed that gender distribution, sample size, and score averages were not statistically significant predictors of heterogeneity of reliability. The fact that the effect of the female ratio on reliability coefficients is statistically insignificant indicates that similar levels of reliability evidence have been achieved in terms of the gender variable. Indeed, Franco-Jimenez (2024), in their study on the Bedtime Procrastination Scale, examined measurement invariance by gender and found that the scale provided measurement invariance across genders. This finding provides evidence for the construct validity of the scale across genders. Therefore, it can be said that the finding that reliability does not differ by gender is consistent with previous findings regarding construct validity from a psychometric perspective. Sample size was also a non-significant moderator. The content of BPS may facilitate stable reliability estimates, reducing the need for large samples to achieve adequate measurement precision. Notably, in the original development study of the instrument, data collected from 177 participants already provided sufficient evidence for the psychometric properties. For McDonald’s omega coefficients, however, none of the continuous moderator variables, including mean age and age variability, were found to be significant. This may be attributable to the relatively small number of studies reporting omega, which reduced the power of the significance test of the moderators in participant age across samples. Indeed, the studies included in the omega analyses predominantly encompassed participants with a narrower age range compared to those in the Cronbach’s alpha analyses.
Subgroup analyses of Cronbach’s alpha for categorical moderator variables revealed significant effects for region and sample group, whereas scale language and publication type were not significant predictors of variability in reliability coefficients. With respect to region, studies conducted in Europe yielded higher reliability estimates compared to those conducted in Asia. For the categorical moderator variable of sample group, which distinguished between adolescents, university students, and the general population, results indicated that the general population group demonstrated significantly higher reliability compared to both adolescents and university students. However, no significant differences were observed between the adolescent and university student samples. Bruna et al. (2018) associated the high heterogeneity between samples with the variability of reliability. Despite the presence of significant categorical moderators, neither scale language nor publication type emerged as a significant moderator. Non-significance of the language can be explained by the psychometric properties of the BPS. The instrument is a brief, unidimensional measure consisting of nine items that are conceptually straightforward and terminologically simple. These features likely facilitate practical adaptation across languages while maintaining the integrity of the factor structure, thereby preserving response consistency across translations. Moreover, although the original validation study was conducted with a relatively small sample, construct validity was nonetheless supported, further suggesting that the scale’s structure is robust and easily replicable across different linguistic and cultural contexts. For McDonald’s omega, categorical moderator analyses were limited to sample type (university students and the general population). The results paralleled those of Cronbach’s alpha, indicating that measurements obtained from general population samples demonstrated higher reliability than those from university student samples.
A relatively large number of moderator analyses were conducted to explore potential sources of heterogeneity. As noted in the meta-analytic literature, although multiple testing can increase the risk of Type I error, there is no consensus on how this issue should be handled in subgroup analyses or meta-regression (Borenstein et al., 2009). Accordingly, rather than applying a uniform multiplicity correction across all tests, moderator results were interpreted cautiously and in context, with emphasis placed on the consistency, direction, and theoretical plausibility of effects rather than on isolated p-values. This approach is consistent with recommendations for exploratory moderator analyses in meta-analysis.
The findings indicate that the BPS demonstrates consistently high internal consistency across both Cronbach’s alpha and McDonald’s omega coefficients, providing convergent evidence for the scale’s reliability. Nonetheless, while reliability was sufficient for the majority of research objectives, greater caution is recommended in high-stakes or high-risk contexts where measurement precision is crucial. It is important to note that reliability constitutes a necessary but not sufficient condition for accurate measurement. In order to meaningfully interpret the data and make practical decisions, there is also a need for evidence of validity. However, the present RGMA did not address this additional aspect. The moderator’s analysis underscores the necessity for careful interpretation, suggesting that greater emphasis should be placed on the consistency and theoretical plausibility of observed patterns rather than on isolated significance tests. The results obtained for alpha and omega are largely compatible, thereby reinforcing confidence in the internal consistency of the BPS. However, they concurrently highlight the broader measurement considerations that extend beyond reliability alone.
Limitations
In the present study, pooled reliability estimates were calculated, and subsequent analyses were conducted based on all reliability coefficients, regardless of the specific research context. However, the intended purpose of the instrument within each study, such as providing evidence for construct validity versus supporting decision-making about individuals, was not taken into account. Considering that the BPS has been linked to various health outcomes, including insomnia, obesity, and diabetes, it is important to recognize that future RGMA analyses of BPS should consider the specific contexts and applications of the scale. Conducting subgroup analyses based on these contextual distinctions may provide more nuanced insights into the reliability of the instrument in relation to its uses in different fields, including psychological and clinical settings.
Implications
The findings of this study have important implications for both research and applied contexts. Although pooled reliability estimates were examined across all studies regardless of their specific context, the results highlight that certain moderators, such as age, region, and sample type, can meaningfully influence reliability outcomes. This suggests that researchers and practitioners should consider these factors when interpreting BPS scores, particularly in high-stakes or clinical contexts where decisions may have significant consequences.
With regard to prospective research, the non-significant moderators in this meta-analysis, including publication type, language, sample size, mean and standard deviation of BPS scores, and percentage of women, imply that these factors may have a negligible influence on reliability. Nevertheless, future studies could further explore their potential effects. Investigating the BPS in novel cultural, clinical, or applied settings may help identify conditions under which these variables could become more relevant. This would ultimately improve the generalizability and interpretability of the scale across diverse populations.
Conclusion
This meta-analysis aimed to comprehensively review the reliability of the Bedtime Procrastination Scale (BPS) scores across diverse cultural and linguistic samples, considering methodological characteristics. The study demonstrated that the BPS exhibits strong internal consistency overall, including across gender, different versions of the scale, publication types, and sample sizes. It is vital for future studies to continue looking at the BPS in different research settings, such as clinical and medical decision-making, as well as large-scale empirical research, to look for ways to improve the accuracy and practical use of the tool in a range of research and applied situations.
Statements
Data availability statement
The data that support the findings of this study are openly available in the Open Science Framework (OSF) at https://doi.org/10.17605/OSF.IO/4YD5H.
Author contributions
EO: Methodology, Software, Writing – original draft, Visualization, Formal analysis, Validation. SÇ-D: Formal analysis, Software, Writing – original draft, Conceptualization, Visualization, Investigation, Validation. AE: Software, Methodology, Writing – original draft, Formal analysis, Visualization, Investigation, Validation.
Funding
The author(s) declared that financial support was not received for this work and/or its publication.
Conflict of interest
The author(s) declared that this work was conducted in the absence of any commercial or financial relationships that could be construed as a potential conflict of interest.
Generative AI statement
The author(s) declared that Generative AI was not used in the creation of this manuscript.
Any alternative text (alt text) provided alongside figures in this article has been generated by Frontiers with the support of artificial intelligence and reasonable efforts have been made to ensure accuracy, including review by the authors wherever possible. If you identify any issues, please contact us.
Publisher’s note
All claims expressed in this article are solely those of the authors and do not necessarily represent those of their affiliated organizations, or those of the publisher, the editors and the reviewers. Any product that may be evaluated in this article, or claim that may be made by its manufacturer, is not guaranteed or endorsed by the publisher.
Supplementary material
The Supplementary material for this article can be found online at: https://www.frontiersin.org/articles/10.3389/fpsyg.2026.1709258/full#supplementary-material
Footnotes
1.^Bonett’s alpha bias transformation yields negative values because it is based on the logarithmic transformation of (1 − α). For ease of presentation, the metafor package reports the absolute values of the transformed coefficients. Accordingly, the actual transformed estimates corresponding to the reported pooled effect and confidence limits are −1.9286, −1.8525, and −2.0046, respectively. All τ and τ estimates are likewise expressed on the transformed scale.
References
1
Aguayo-Estremera R. Vargas-Pecino C. de la Fuente Solana E. I. Lozano Fernández L. M. (2011). A meta-analytic reliability generalization study of the Maslach burnout inventory. Int. J. Clin. Health Psychol.11, 343–361.
2
Åkerstedt T. Nilsson P. M. (2003). Sleep as restitution: an introduction. J. Intern. Med.254, 6–12. doi: 10.1046/j.1365-2796.2003.01195.x,
3
Ali B. T. A. Saleh N. O. Mreydem H. W. Hammoudi S. F. Lee T. Chung S. et al . (2021). Screen time effect on insomnia, depression, or anxiety symptoms and physical activity of school students during COVID-19 lockdown in Lebanon: a cross sectional study. Sleep Med. Res.12, 101–109. doi: 10.17241/smr.2021.01109
4
Alshammari T. K. Rogowska A. M. Basharahil R. F. Alomar S. F. Alseraye S. S. Al Juffali L. A. et al . (2023). Examining bedtime procrastination, study engagement, and studyholism in undergraduate students, and their association with insomnia. Front. Psychol.13:1111038. doi: 10.3389/fpsyg.2022.1111038,
5
American Psychological Association (2020). Publication manual of the American Psychological Association. 7th Edn. Washington DC: American Psychological Association.
6
An H. Chung S.-J. Suh S. (2019). Validation of the Korean version of the Bedtime Procrastination Scale in young adults. J. Sleep Med.16, 41–47. doi: 10.13078/jsm.19030
7
An Y. Zhang M. X. (2024). Relationship between problematic smartphone use and sleep problems: the roles of sleep-related compensatory health beliefs and bedtime procrastination. Digit. Health10. doi: 10.1177/20552076241283338,
8
Andrews J. L. Lokesh L. (2024). The relatıonshıp between bedtıme procrastınatıon and emotıonal ıntellıgence among college students. Annals of the Bhandarkar Oriental Research Institute2, 133–141.
9
Appelbaum M. Cooper H. Kline R. B. Mayo-Wilson E. Nezu A. M. Rao S. M. (2018). Journal article reporting standards for quantitative research in psychology: the APA publications and communications board task force report. Am. Psychol.73, 3–25. doi: 10.1037/amp0000191,
10
Basner M. Fomberstein K. M. Razavi F. M. Banks S. William J. H. Rosa R. R. et al . (2007). American time use survey: sleep time and its relationship to waking activities. Sleep30, 1085–1095. doi: 10.1093/sleep/30.9.1085,
11
Bernecker K. Job V. (2019). Too exhausted to go to bed: implicit theories about willpower and stress predict bedtime procrastination. Br. J. Psychol.111, 126–147. doi: 10.1111/bjop.12382,
12
Bistricky S. L. Lopez A. K. Pollard T. B. Egan A. Gimenez-Zapiola M. Pascuzzi B. et al . (2025). Brief multimodal ıntervention to address bedtime procrastination and sleep through self-compassion and sleep hygiene during stressful times. J. Coll. Stud. Ment. Health. 1–25. doi: 10.1080/28367138.2025.2491521
13
Bonett D. G. (2002). Sample size requirements for testing and estimating coefficient alpha. J. Educ. Behav. Stat.27, 335–340. doi: 10.3102/10769986027004335
14
Borenstein M. Hedges L. V. Higgins J. P. Rothstein H. R. (2009). Introduction to meta-analysis: John Wiley & Sons, Ltd.
15
Brando-Garrido C. Montes-Hidalgo J. Limonero J. T. Gómez-Romero M. J. Tomás-Sábado J. (2022). Spanish version of the bedtime procrastination scale: cross-cultural adaptation and psychometric evaluation in a sample of nursing students. Psychol. Rep.125, 1765–1779. doi: 10.1177/00332941211005120,
16
Broers V. (2014) Identifying and supporting bedtime procrastinators: a self-regulation failure perspective implementing self-monitoring as intervention. (master thesis). Utrecht University
17
Bruna M. O. Brabete A. C. Izquierdo J. M. A. (2018). Reliability generalization as a seal of quality of substantive meta-analyses: the case of the VIA inventory of strengths (VIA-IS) and their relationships to life satisfaction. Psychol. Rep.122, 1167–1188. doi: 10.1177/0033294118779198,
18
Cai X. Gao Y. Fang Y. W. (2022). Validity and reliability of the Chinese Bedtime Procrastination Scale among college students. Int. J. Prog. Sci. Technol.34, 353–361. doi: 10.52155/ijpsat.v34.1.4456
19
Cain N. Gradisar M. (2010). Electronic media use and sleep in school-aged children and adolescents: a review. Sleep Med.11, 735–742. doi: 10.1016/j.sleep.2010.02.006,
20
Carciofo R. Cheung R. Y. (2025). Eveningness and procrastination: an exploration of relationships with mind wandering, sleep quality, self-control, and depression. Eur. J. Investig. Health Psychol. Educ.15:79. doi: 10.3390/ejihpe15050079,
21
Cemei L. Sriram S. Holý O. Rehman S. (2024). A longitudinal investigation on the reciprocal relationship of problematic smartphone use with bedtime procrastination, sleep quality, and mental health among university students. Psychol. Res. Behav. Manag.17, 3355–3367. doi: 10.2147/PRBM.S472299,
22
Chen S. Liao J. Wang X. Wei M. Liu Y. (2023). Bidirectional relations between problematic smartphone use and bedtime procrastination among Chinese university students: self-control as a mediator. Sleep Med.112, 53–62. doi: 10.1016/j.sleep.2023.09.033,
23
Chen D. Zhang Y. Lin J. Pang D. Cheng D. Si D. (2022). Factors influencing bedtime procrastination in junior college nursing students: a cross-sectional study. BMC Nurs.21:97. doi: 10.1186/s12912-022-00881-7,
24
Chung S. J. An H. Suh S. (2020). What do people do before going to bed? A study of bedtime procrastination using time use surveys. Sleep43. doi: 10.1093/sleep/zsz267,
25
Cohen R. J. Schneider W. J. Tobin R. M. (2022). Psychological testing and assessment: an introduction to tests and measurement. 10th Edn: McGraw-Hill Education.
26
Cong T. Kuang Y. Bao Y. Yu S. (2024). Effects of perceived academic stress on sleep quality among Chinese college students: mediating effects of social comparison, bedtime procrastination, and the protective role of emotion regulation. Curr. Psychol.43, 31327–31342. doi: 10.1007/s12144-024-06707-w
27
Correa-Iriarte S. Hidalgo-Fuentes S. Martí-Vilar M. (2023). Relationship between problematic smartphone use, sleep quality and bedtime procrastination: a mediation analysis. Behav. Sci.13:839. doi: 10.3390/bs13100839,
28
Crocker L. Algina J. (1986). Introduction to classical and modern test theory: Holt, Rinehart and Winston.
29
Cui G. Yin Y. Li S. Chen L. Liu X. Tang K. et al . (2021). Longitudinal relationships among problematic mobile phone use, bedtime procrastination, sleep quality and depressive symptoms in Chinese college students: a cross-lagged panel analysis. BMC Psychiatry21:449. doi: 10.1186/s12888-021-03451-4,
30
Dardara E. A. AL-Makhalid K. A. (2021). Investigating the relationship between bedtime procrastination, psychological stress, and mental health among Saudi undergraduates. Rigeo11. doi: 10.48047/rigeo.11.08.247
31
Delaei-Milan F. (2023). Netflix is the new Scheherazade! Exploring the relationships between online binge-watching, self-control, and bedtime procrastination among college students in Iran. J. Mod. Psychol.3, 33–40. doi: 10.22034/jmp.2024.423672.1078
32
Deng Y. Ye B. Yang Q. (2022). COVID-19 related emotional stress and bedtime procrastination among college students in China: a moderated mediation model. Nat. Sci. Sleep14, 1437–1447. doi: 10.2147/NSS.S371292,
33
Deng Y. Ye B. Yang Q. (2024). “Why don’t you go to bed on time”? Parental psychological control and bedtime procrastination among Chinese adolescents. Child Youth Serv. Rev.160. doi: 10.1016/j.childyouth.2024.107543
34
Dinç Y. D. Koçhan K. Zat Z. (2016). The validity and reliability of the Bedtime Procrastination Scale. Int. J. Humanit. Soc. Sci. Invent.5, 57–62.
35
Duval S. Tweedie R. (2000). Trim and fill: a simple funnel-plot–based method of testing and adjusting for publication bias in meta-analysis. Biometrics56, 455–463. doi: 10.1111/j.0006-341X.2000.00455.x,
36
Exelmans L. Bulck J. V. (2017). Bedtime mobile phone use and sleep in adults. Soc. Sci. Med.148, 93–101. doi: 10.1016/j.socscimed.2015.11.037
37
Exelmans L. Bulck J. V. (2021). “Glued to the tube”: the interplay between self-control, evening television viewing, and bedtime procrastination. Commun. Res.48, 594–616. doi: 10.1177/0093650216686877
38
Fathy M. G. Mandoob K. J. (2025). The role of emotional schemas in binge eating and bedtime procrastination. Iran. J. Psychiatry20, 304–320. doi: 10.18502/ijps.v20i3.19038,
39
Feng Y. Meng D. Guo J. Zhao Y. Ma X. Zhu L. et al . (2022). Bedtime procrastination in the relationship between self-control and depressive symptoms in medical students: from the perspective of sex differences. Sleep Med.95, 84–90. doi: 10.1016/j.sleep.2022.04.022,
40
Feng B. Sun W. (2022). Bedtime procrastination and fatigue in Chinese college students: the mediating role of mobile phone addiction. Int. J. Ment. Health Addict.21, 3362–3375. doi: 10.1007/s11469-022-00796-z
41
Ferrari J. R. Johnson J. L. McCown W. G. (1995). “Assessment of academic and everyday procrastination” in Procrastination and task avoidance: theory, research, and treatment. eds. FerrariJ. R.JohnsonJ. L.McCownW. G. (Springer), 55–75.
42
Flores J. G. S. Li-Min Ho V. A. Kok S. A. L. Teoh A. N. (2023). FOMO predicts bedtime procrastination and poorer sleep quality via rumination. Am. J. Health Behav.47, 1221–1230. doi: 10.5993/AJHB.47.6.15
43
Ford D. E. Kamerow D. B. (1989). Epidemiologic study of sleep disturbances and psychiatric disorders: an opportunity for prevention?JAMA262, 1479–1484. doi: 10.1001/jama.1989.03430110069030
44
Franco-Jimenez R. A. (2024). Traducción y propiedades psicométricas de la Bedtime Procastination Scale (BPS) en universitarios peruanos. Propós. Represent.12:e1992. doi: 10.20511/pyr2024.v12.1992
45
Galama M. (2020). Exploring the effectiveness of a sleep hygiene app to decrease social media use and improve sleep. (master thesis). Eindhoven University of Technology
46
Geng Y. Gu J. Wang J. Zhang R. (2021). Smartphone addiction and depression, anxiety: the role of bedtime procrastination and self-control. J. Affect. Disord.293, 415–421. doi: 10.1016/j.jad.2021.06.062,
47
George D. Mallery P. (2020). IBM SPSS statistics 26: step by step—a simple guide and reference. 16th Edn: Routledge.
48
Greco L. M. O’Boyle E. H. Cockburn B. S. Yuan Z. (2018). Meta-analysis of coefficient alpha: a reliability generalization study. J. Manage. Stud.55, 583–618. doi: 10.1111/joms.12328
49
Guo J. Meng D. Ma X. Zhu L. Yang L. Mu L. (2020). The impact of bedtime procrastination on depression symptoms in Chinese medical students. Sleep Breath.24, 1247–1255. doi: 10.1007/s11325-020-02079-0,
50
Hammoudi S. F. Mreydem H. W. Abou Ali B. T. Saleh N. O. Chung S. Hallit S. et al . (2021). Smartphone screen time among university students in Lebanon and its association with insomnia, bedtime procrastination, and body mass index during the COVID-19 pandemic: a cross-sectional study. Psychiatry Investig.18, 871–878. doi: 10.30773/pi.2021.0120,
51
Hamvai C. Kiss H. Vörös H. Fitzpatrick K. M. Vargha A. Pikó B. F. (2023). Association between impulsivity and cognitive capacity decrease is mediated by smartphone addiction, academic procrastination, bedtime procrastination, sleep insufficiency and daytime fatigue among medical students: a path analysis. BMC Med. Educ.23, 1–12. doi: 10.1186/s12909-023-04522-8,
52
Hayat B. (2024). Meta-analysis of coefficient alpha: empirical demonstration using English language teaching reflection inventory. J. Curric. Teach.13, 231–243. doi: 10.5430/jct.v13n2p231
53
Hazumi M. Kawamura A. Yoshiike T. Matsui K. Kitamura S. Tsuru A. et al . (2024). Development and validation of the Japanese version of the Bedtime Procrastination Scale (BPS-J). BMC Psychol.12, 1–14. doi: 10.1186/s40359-024-01557-4,
54
He Q. Wu H. Meng X. Li C. (2025). The relationship between perceived stress and bedtime procrastination among Chinese college students: a moderated mediation model. Front. Psych.16. doi: 10.3389/fpsyt.2025.1547389,
55
Henson R. K. Thompson B. (2002). Characterizing measurement error in scores across studies: some recommendations for conducting “reliability generalization” studies. Meas. Eval. Couns. Dev.35, 113–127. doi: 10.1080/07481756.2002.12069054
56
Herzog-Krzywoszanska R. Krzywoszanski L. (2019). Bedtime procrastination, sleep-related behaviors, and demographic factors in an online survey on a polish sample. Front. Neurosci.13. doi: 10.3389/fnins.2019.00963,
57
Higgins J. P. T. Thompson S. G. (2002). Quantifying heterogeneity in a meta-analysis. Stat. Med.21, 1539–1558. doi: 10.1002/sim.1186,
58
Higgins J. P. Thompson S. G. Spiegelhalter D. J. (2009). A re-evaluation of random-effects meta-analysis. J. R. Stat. Soc. A Stat. Soc.172, 137–159. doi: 10.1111/j.1467-985X.2008.00552.x,
59
Hill V. M. Ferguson S. A. Rebar A. L. Meaklim H. Vincent G. E. (2025). A randomised pilot trial for bedtime procrastination: examining the efficacy and feasibility of the reducing evening screen time online intervention (REST-O). Sleep Med.129, 306–315. doi: 10.1016/j.sleep.2025.02.043,
60
Hou X. Hu J. (2023). Depression and bedtime procrastination: chain mediation of brooding and perceived stress. Heliyon9. doi: 10.1016/j.heliyon.2023.e22672,
61
Howarth N. E. Miller M. A. (2024). Sleep, sleep disorders, and mental health: a narrative review. Heart Mind8, 146–158. doi: 10.4103/hm.HM-D-24-00030
62
Huang T. Liu Y. Tan T. C. Li Y. Zhang X. (2023). Mobile phone dependency and sleep quality in college students during COVID-19 outbreak: the mediating role of bedtime procrastination and fear of missing out. BMC Public Health23. doi: 10.1186/s12889-023-16061-4,
63
Huang J. Yang Z. Wang Q. Liu J. Xie W. Sun Y. (2024). The relationship between family cohesion and bedtime procrastination among Chinese college students: the chain mediating effect of coping styles and mobile phone addiction. BMC Psychiatry24:250. doi: 10.1186/s12888-024-05700-8,
64
IntHout J. Ioannidis J. P. Rovers M. M. Goeman J. J. (2016). Plea for routinely presenting prediction intervals in meta-analysis. BMJ Open6. doi: 10.1136/bmjopen-2015-010247,
65
Jakowski S. (2022). Self-tracking via smartphone app: potential tool for athletes’ recovery self-management? A survey on technology usage and sleep behaviour. Ger. J. Exerc. Sport Res.52, 253–261. doi: 10.1007/s12662-022-00812-3,
66
Jakowski S. Stork M. (2022). Effects of sleep self-monitoring via app on subjective sleep markers in student athletes. Somnologie26, 244–251. doi: 10.1007/s11818-022-00395-z,
67
Jeon H. Lee W. Suh S. (2023). Emotion regulation strategies as a moderator between insomnia severity and bedtime procrastination. Sleep Med. Res.14, 220–226. doi: 10.17241/smr.2023.02033
68
Jeoung S. Jeon H. Yang H. C. An H. Suh S. (2023). A randomized controlled trial of a behavioral intervention for decreasing bedtime procrastination using a wait-list control group in a non-clinical sample of young adults. Sleep Med.108, 114–123. doi: 10.1016/j.sleep.2023.06.001,
69
Jiang X. Xie L. Wang S. (2024). Study on sleep procrastination behavior and psychological prevention strategies among university students during vocational awareness internships. Pac. Int. J.7, 129–134. doi: 10.55014/pij.v7i4.662
70
Kadzikowska-Wrzosek R. (2018). Self-regulation and bedtime procrastination: the role of self-regulation skills and chronotype. Pers. Individ. Differ.128, 10–15. doi: 10.1016/j.paid.2018.02.015
71
Kadzikowska-Wrzosek R. (2020). Insufficient sleep among adolescents: the role of bedtime procrastination, chronotype and autonomous vs. controlled motivational regulations. Curr. Psychol.39, 1031–1040. doi: 10.1007/s12144-018-9825-7
72
Keulen E. V. 2020 Why would you sleep? A study on awareness of short-term and long-term health consequences of insufficient sleep in association with bedtime procrastination, moderated by Chronotype. (master’s thesis). Utrecht University
73
Kıraç R. Söyler S. Yılmaz G. Uyar S. (2021). Effect of the anxiety to catch coronavirus (COVID-19) on bedtime procrastination. Cukurova Med. J.46, 495–507. doi: 10.17826/cumj.850205
74
Klingsieck K. B. (2013). Procrastination: when good things don’t come to those who wait. Eur. Psychol.18, 24–34. doi: 10.1027/1016-9040/a000138
75
Krishnan A. Chew P. K. (2024). Impact of social media addiction and internet gaming disorder on sleep quality: serial mediation analyses. Psychiatry Q.95, 185–202. doi: 10.1007/s11126-024-10068-9,
76
Kroese F. M. De Ridder D. T. Evers C. Adriaanse M. A. (2014). Bedtime procrastination: introducing a new area of procrastination. Front. Psychol.5. doi: 10.3389/fpsyg.2014.00611,
77
Kroese F. M. Evers C. Adriaanse M. A. de Ridder D. T. (2016). Bedtime procrastination: a self-regulation perspective on sleep insufficiency in the general population. J. Health Psychol.21, 853–862. doi: 10.1177/1359105314540014,
78
Kühnel J. Bledow R. Feuerhahn N. (2016). When do you procrastinate? Sleep quality and social sleep lag jointly predict self-regulatory failure at work. J. Organ. Behav.37, 983–1002. doi: 10.1002/job.2084
79
Kullik L. Kiel A. Kellmann M. Jakowski S. (2025). Perceived recovery-stress states and sleep in pre-and post-menarche elite youth swimmers. Int. J. Sport Exerc. Psychol., 1–19. doi: 10.1080/1612197X.2025.2481451
80
Lee T. Cho E. Ahmed O. Ahn J. Bang Y. R. Chung S. et al . (2025). The impact of depression on bedtime procrastination in high school students in pandemic era: the mediating roles of conscientiousness and emotional stability. Int. J. Behav. Med., 1–8. doi: 10.1007/s12529-025-10351-4
81
Li L. Hua J. Xu Q. Wu J. Zhang Y. Li F. et al . (2025). Latent profile analysis of factors influencing sleep quality in ICU nurses cross-sectional study. Sci. Rep.15. doi: 10.1038/s41598-025-01643-6,
82
Lin X. Fu X. Shen Y. Liu G. Ding N. Zhang G. et al . (2025). Cross-lagged analysis of mobile phone addiction and bedtime procrastination: a comparison of gender and perceived stress levels among Chinese college students. Front. Psychol.16. doi: 10.3389/fpsyg.2025.1588090,
83
Ling Y. Gao B. Jiang B. Zhu S. Jiang Y. (2024). Self-control and bed procrastination as mediators between mindfulness and sleep quality among college students during the COVID-19 pandemic. Sci. Rep.14. doi: 10.1038/s41598-024-68591-5,
84
Lionnet S. (2023). The utility of PERMA wellbeing elements to predict sleep quality, nutrition, and bedtime procrastination among university students: a thesis submitted in partial fulfilment of the requirements for the degree of master of science in psychology, University of Canterbury. (doctoral dissertation). University of Canterbury
85
Liu Z. Y. Chen Y. J. Bian T. Y. Xiang Y. Yuan R. M. Yang H. X. (2025). Associations among smartphone addiction, chronotype, and bedtime procrastination: Bayesian network analysis and pilot intervention. Curr. Psychol.44, 3326–3339. doi: 10.1007/s12144-025-07407-9
86
Liu N. Wang J. Zang W. (2024). The impact of sleep determination on procrastination before bedtime: the role of anxiety. Int. J. Ment. Health Promot.26. doi: 10.32604/ijmhp.2024.047808
87
López-Ibáñez C. López-Nicolás R. Blázquez-Rincón D. M. Sánchez-Meca J. (2024). Reliability generalization meta-analysis: comparing different statistical methods. Curr. Psychol.43, 18275–18293. doi: 10.1007/s12144-023-05604-y
88
Luo X. Hu Y. Liu H. (2024). Assessing between-and within-person reliabilities of items and scale for daily procrastination: a multilevel and dynamic approach. Assessment32, 61–76. doi: 10.1177/10731911241235467,
89
Ma X. Meng D. Zhu L. Xu H. Guo J. Yang L. et al . (2022). Bedtime procrastination predicts the prevalence and severity of poor sleep quality of Chinese undergraduate students. J. Am. Coll. Heal.70, 1104–1111. doi: 10.1080/07448481.2020.1785474,
90
Ma X. Zhu L. Guo J. Zhao Y. Fu Y. Mou L. (2021). Reliability and validity of the Bedtime Procrastination Scale in Chinese college students. Chin. J. Clin. Psychol.29, 717–720. doi: 10.16128/j.cnki.1005-3611.2021.04.011
91
Magalhães P. Cruz V. Teixeira S. Fuentes S. Rosário P. (2020). An exploratory study on sleep procrastination: bedtime vs. while-in-bed procrastination. Int. J. Environ. Res. Public Health17:5892. doi: 10.3390/ijerph17165892,
92
Manasa M. Saju Stephen S. (2024). Bedtime procrastination, achievement anxiety and personality traits among college students. Int. J. Acad. Res. Educ. Soc. Sci.12.
93
Manocchia M. Keller S. Ware J. E. (2001). Sleep problems, health-related quality of life, work functioning and health care utilization among the chronically ill. Qual. Life Res.10, 331–345. doi: 10.1023/A:1012299519637,
94
Mao B. Chen S. Wei M. Luo Y. Liu Y. (2022). Future time perspective and bedtime procrastination: the mediating role of dual-mode self-control and problematic smartphone use. Int. J. Environ. Res. Public Health19. doi: 10.3390/ijerph191610334,
95
Meng X. Su H. Li C. (2022). Effect of self-efficacy on bedtime procrastination among Chinese university students: a moderation and mediation model. Front. Psychol.13:863523. doi: 10.3389/fpsyg.2022.863523,
96
Meng F. Xuan B. (2023). Boredom proneness on Chinese college students’ phubbing during the COVID-19 outbreak: the mediating effects of self-control and bedtime procrastination. J. Healthc. Eng.2023, 1–8. doi: 10.1155/2023/4134283,
97
Meng S. Zhang Y. Tang L. Zhang M. Tang W. Onyebuchi N. et al . (2024). The effects of mobile phone addiction on bedtime procrastination in university students: the masking effect of physical activity and anxiety. BMC Psychol.12:395. doi: 10.1186/s40359-024-01899-z,
98
Meng D. Zhao Y. Guo J. Xu H. Fu Y. Ma X. et al . (2021). Time perspective and bedtime procrastination: the role of the chronotype–time perspective relationship. Nat. Sci. Sleep13, 1307–1318. doi: 10.2147/NSS.S313157,
99
Meng D. Zhao Y. Guo J. Xu H. Zhu L. Fu Y. et al . (2023). The relationship between bedtime procrastination, future time perspective, and self-control. Curr. Psychol.42, 11378–11387. doi: 10.1007/s12144-021-02419-7
100
Milgram N. A. Sroloff B. Rosenbaum M. S. (1988). The procrastination of everyday life. J. Res. Pers.22, 197–212. doi: 10.1016/0092-6566(88)90015-3
101
Miller B. K. Nicols K. M. Clark S. Daniels A. Grant W. (2018). Meta-analysis of coefficient alpha for scores on the narcissistic personality inventory. PLoS One13. doi: 10.1371/journal.pone.0208331,
102
Miyagawa S. Sato T. Maeda S. (2024). Demographic predictors of bedtime procrastination in the Japanese population. Sleep Biol. Rhythms22, 199–206. doi: 10.1007/s41105-023-00508-7,
103
Mu Y. Wang Y. Yuan J. Knutson K. L. Zhu D. Izci-Balserak B. et al . (2023). Cross-cultural adaptation and validation of the Chinese version of the sleep health index. Sleep Health9, 117–123. doi: 10.1016/j.sleh.2022.09.005,
104
Nauts S. Kamphorst B. A. Sutu A. E. Poortvliet R. Anderson J. H. (2016). Aversive bedtime routines as a precursor to bedtime procrastination. Eur. Health Psychol.18, 80–85.
105
Nguyen B. Steel P. Ferrari J. R. (2013). Procrastination’s impact in the workplace and the workplace’s impact on procrastination. Int. J. Sel. Assess.21, 388–399. doi: 10.1111/ijsa.12048
106
Nunnally J. C. Bernstein I. H. (1994). Psychometric theory. 3rd Edn: McGraw-Hill.
107
Okay D. Türkarslan K. K. Çevrim M. Bozo Özen Ö. (2022). Sleep go away, i don’t have much time left to live: is bedtime procrastination related to perceived time left in life?J. Turk. Sleep Med. doi: 10.4274/jtsm.galenos.2021.24119
108
Oliveira A. Pereira B. Aguiar C. Rosário P. Magalhães P. (2025). Assessing motives for delaying bedtime: development and psychometric properties of the reasons for Bedtime Procrastination Scale. Psicothema37, 91–99. doi: 10.70478/psicothema.2025.37.10,
109
Oliveira A. Pereira B. Rosário P. Magalhães P. (2022). Bedtime procrastination during the second COVID-19 lockdown in Portugal. Sleep Sci15, 105–111. doi: 10.5935/1984-0063.20220031,
110
Ouzzani M. Hammady H. Fedorowicz Z. Elmagarmid A. (2016). Rayyan—a web and mobile app for systematic reviews. Syst. Rev.5:210. doi: 10.1186/s13643-016-0384-4,
111
Peterson R. A. (1994). A meta-analysis of Cronbach’s coefficient alpha. J. Consum. Res.21, 381–391. doi: 10.1086/209405
112
Pillion M. (2023). Investigation into pre-bedtime technology use to improve adolescent sleep. (doctoral dissertation). Flinders University
113
Pretorius T. B. Padmanabhanunni A. (2025). Reliability generalization of the problem solving inventory: a meta-analysis of Cronbach’s alpha with a varying-coefficient model. SAGE Open15. doi: 10.1177/21582440251361978
114
Pu Z. Leong R. L. Chee M. W. Massar S. A. (2022). Bedtime procrastination and chronotype differentially predict adolescent sleep on school nights and non-school nights. Sleep Health8, 640–647. doi: 10.1016/j.sleh.2022.09.007,
115
Pu Z. Ng A. S. Suh S. Chee M. W. Massar S. A. (2025). Failing to plan: bedtime planning, bedtime procrastination, and objective sleep in university students. Sleep Med.132. doi: 10.1016/j.sleep.2025.106556,
116
Qin D. Zhang J. Wei X. Wu L. (2025). For escaping and compensating? Exploring security and bedtime procrastination in college students: the mediating role of nighttime internet usage. Curr. Psychol.44. doi: 10.1007/s12144-025-07911-y
117
R Core Team . (2024). R: a language and environment for statistical computing [Computer software] R Foundation for Statistical Computing. Available online at: https://www.R-project.org/ (Accessed May 1, 2025).
118
Rahayu S. A. T. Caninsti R. (2024). The role of smartphone addiction on bed procrastination and mindful eating behavior in adolescents. Indigenous9, 1–13. doi: 10.23917/indigenous.v9i1.2804
119
Rapoport O. Ruppenthal L. Möcklinghoff S. Merz S. Neidhardt E. (2025). When the night is too short. Bedtime procrastination, self-compassion, and sleep in a daily diary study. Psychol. Health40, 1083–1101. doi: 10.1080/08870446.2023.2297794,
120
Rasouli A. Seraji H. T. Nejad-Ebrahim Soumee Z. Jahanbakhsh S. Javadi V. Saed O. (2025). Assessing bedtime procrastination in Iran: psychometric properties and predictive value for insomnia. Behav. Sleep Med.23, 105–117. doi: 10.1080/15402002.2024.2423291,
121
Rehman S. Rehman E. Liu B. (2023). Potential correlation between self-compassion and bedtime procrastination: the mediating role of emotion regulation. Psychol. Res. Behav. Manag.16, 4709–4723. doi: 10.2147/PRBM.S431922,
122
Rodríguez M. C. Maeda Y. (2006). Meta-analysis of coefficient alpha. Psychol. Methods11, 306–322. doi: 10.1037/1082-989X.11.3.306,
123
Saed O. Ahmadi R. Baytamar J. M. Mohammadi M. Kousari Z. (2019). The roles of procrastinatory cognitions and bedtime procrastination in insomnia among students. J. Sleep Sci.4, 29–36.
124
Sánchez-Meca J. López-López J. A. López-Pina J. A. (2013). Some recommended statistical analytic practices when reliability generalization studies are conducted. Br. J. Math. Stat. Psychol.66, 402–425. doi: 10.1111/j.2044-8317.2012.02057.x,
125
Sánchez-Meca J. Marín-Martínez F. López-López J. A. Núñez-Núñez R. M. Rubio-Aparicio M. López-García J. J. et al . (2021). Improving the reporting quality of reliability generalization meta-analyses: the REGEMA checklist. Res. Synth. Methods12, 516–536. doi: 10.1002/jrsm.1487,
126
Santos D. R. A. (2020). Exploring bedtime procrastination among university students: the role of general procrastination, academic procrastination and perceived importance of sleep. (master’s thesis). Universidade do Minho
127
Schipke D. Freund P. A. (2012). A meta-analytic reliability generalization of the physical self-description questionnaire (PSDQ). Psychol. Sport Exerc.13, 789–797. doi: 10.1016/j.psychsport.2012.04.012
128
Schouwenburg H. C. (1995). “Academic procrastination” in Procrastination and task avoidance: theory, research, and treatment. eds. FerrariJ. R.JohnsonJ. L.McCownW. G. (Springer), 71–96.
129
Sezer B. Gucciardi D. F. Ntoumanis N. Riddell H. (2025). Investigating the role of goal motives in predicting bedtime procrastination using a daily diary study design: a registered report. Psychol. Health, 1–24. doi: 10.1080/08870446.2025.2458871,
130
Shao L. Jin J. Yu G. (2024). Childhood environmental risk and youth bedtime procrastination: a path model with life history strategy and sense of control as mediators. Child Abuse Negl.150. doi: 10.1016/j.chiabu.2023.106137,
131
Shi X. Wu Y. Cao F. Wang X. Du K. Zang S. (2024). The effect of loneliness on interpersonal sensitivity among nursing undergraduates: a chain mediation role of problematic internet use and bedtime procrastination. BMC Nurs.23:642. doi: 10.1186/s12912-024-02321-0,
132
Shoukat M. Irshad A. Gillani S. A. (2025). Relationship between bedtime procrastination, sleep quality and smartphone addiction in college students. Crit. Rev. Soc. Sci. Stud.3, 2273–2285. doi: 10.59075/gaw2wh15
133
Shukla A. Andrade C. (2023). Prevalence of bedtime procrastination in university students and reexamination of the Bedtime Procrastination Scale. Prim. Care Companion CNS Disord.25, 1–5. doi: 10.4088/PCC.22m03334,
134
Sirois F. M. (2004). Procrastination and intentions to perform health behaviors: the role of self-efficacy and the consideration of future consequences. Pers. Individ. Differ.37, 115–128. doi: 10.1016/j.paid.2003.08.005
135
Sirois F. M. (2007). “I’ll look after my health, later”: a replication and extension of the procrastination–health model with community-dwelling adults. Pers. Individ. Differ.43, 15–26. doi: 10.1016/j.paid.2006.11.003
136
Sirois F. M. Nauts S. Molnar D. S. (2019). Self-compassion and bedtime procrastination: an emotion regulation perspective. Mindfulness10, 434–445. doi: 10.1007/s12671-018-0983-3
137
Sirois F. M. Pychyl T. A. (2013). Procrastination and the priority of short-term mood regulation: consequences for future self. Soc. Personal. Psychol. Compass7, 115–127. doi: 10.1111/spc3.12011
138
Son S. -M. Kwag S. -W. 2021 Changes in bedtime procrastination and quality of sleep of people with intellectual disability through the application of white noise Ann. Rom. Soc. Cell Biol. 25 5433–5442. Available online at: http://www.annalsofrscb.ro/index.php/journal/article/view/6488
139
Song J. Ahmed O. Lee T. (2024). Validation of the Bedtime Procrastination Scale among Korean high school students during the COVID-19 pandemic. Sleep Med. Res.15, 255–261. doi: 10.17241/smr.2024.02544
140
Stanley T. D. Doucouliagos H. (2014). Meta-regression approximations to reduce publication selection bias. Res. Synth. Methods5, 60–78. doi: 10.1002/jrsm.1095
141
Steel P. (2007). The nature of procrastination: a meta-analytic and theoretical review of quintessential self-regulatory failure. Psychol. Bull.133, 65–94. doi: 10.1037/0033-2909.133.1.65,
142
Teoh A. N. Ooi E. Y. E. Chan A. Y. (2021). Boredom affects sleep quality: the serial mediation effect of inattention and bedtime procrastination. Pers. Individ. Differ.171. doi: 10.1016/j.paid.2020.110460
143
Teoh A. N. Wong J. W. K. (2023). Mindfulness is associated with better sleep quality in young adults by reducing boredom and bedtime procrastination. Behav. Sleep Med.21, 61–71. doi: 10.1080/15402002.2022.2035729,
144
Thompson B. Vacha-Haase T. (2000). Sample compositions and variabilities in published studies versus those in test manuals: validity of score reliability inductions. Educ. Psychol. Meas.60, 509–522. doi: 10.1177/00131640021970682
145
Trost S. Hast M. (2024). Loneliness and bedtime procrastination: exploring a model of interconnectedness among young adults in Germany. J. Sleep Sleep Disord. Res.1, 1–16. doi: 10.14302/issn.2574-4518.jsdr-245287
146
Tu Z. He J. Wang Z. Wang C. Tian J. Tang Y. (2023). Development and validation of the while-in-bed-smartphone-use-induced sleep procrastination scale (WSPS) in Chinese undergraduates with/without problematic smartphone use. Qual. Life Res.32, 3085–3098. doi: 10.1007/s11136-023-03457-3,
147
Tümtürk E. Sen S. (2025). A reliability generalization meta-analysis of children’s test anxiety scale. Psychol. Rep. doi: 10.1177/00332941251320284,
148
Türkarslan K. K. Okay D. Çevrim M. Bozo Ö. (2020). Life is short, stay awake: death anxiety and bedtime procrastination. J. Gen. Psychol.147, 43–61. doi: 10.1080/00221309.2019.1633994,
149
Uygur O. F. Bahar A. (2023a). Sleep effort and insomnia severity: the role of bedtime procrastination. Sleep Med. Res.14, 18–24. doi: 10.17241/smr.2023.01655
150
Uygur Ö. F. Bahar A. (2023b). The relationship between attention deficit hyperactivity disorder symptoms and bedtime procrastination. J. Contemp. Med.13, 241–246. doi: 10.16899/jcm.1242778
151
Vacha-Haase T. (1998). Reliability generalization: exploring variance in measurement error affecting score reliability across studies. Educ. Psychol. Meas.58, 6–20. doi: 10.1177/0013164498058001002
152
Vacha-Haase T. Henson R. K. Caruso J. C. (2002). Reliability generalization: moving toward improved understanding and use of score reliability. Educ. Psychol. Meas.62, 562–569. doi: 10.1177/0013164402062004002
153
Vassar M. Bradley G. (2011). A reliability generalization meta-analysis of coefficient alpha for the Reynolds adolescent depression scale. Clin. Child Psychol. Psychiatry17, 519–527. doi: 10.1177/1359104511424998,
154
Vassar M. Knaup K. G. Hale W. Hale H. (2011). A meta-analysis of coefficient alpha for the impact of event scales: a reliability generalization study. S. Afr. J. Psychol.41, 6–16. doi: 10.1177/008124631104100102
155
Viechtbauer W. (2010). Conducting meta-analyses in R with the metafor package. J. Stat. Softw.36, 1–48. doi: 10.18637/jss.v036.i03
156
Wang Y. Wang X. Wu S. Zhang W. Li J. Liu B. (2025). Physical exercise and bedtime procrastination among college students: mediating roles of self-control and mobile phone addiction. Front. Psychol.16. doi: 10.3389/fpsyg.2025.1630326,
157
Wang Y. Yang J. Yuan J. Izci-Balserak B. Mu Y. Chen P. et al . (2024). Within-and between-person correlates of affect and sleep health among health science students. Brain Sci.14. doi: 10.3390/brainsci14121250,
158
Washof J. (2023). The moderating role of self-control on the relationship between work-family conflict and deliberate bedtime procrastination. (master thesis). University of Groningen
159
Xu C. Lin N. Shen Z. Xie Z. Xu D. Fu J. et al . (2024). Bedtime procrastination related to loneliness among Chinese university students during post-pandemic period: a moderated chain mediation model. BMC Public Health24:491. doi: 10.1186/s12889-024-18019-6,
160
Yang Y. Gong S. Yao L. Qiu Y. Wang J. Xu X. (2024). The relationship between performance goal orientation and bedtime procrastination: the mediation roles of academic stress and self-control. Curr. Psychol.43, 25923–25933. doi: 10.1007/s12144-024-06260-6
161
Yang Z. Huang J. Li Z. Xu H. Guo C. (2023). The effect of smartphone addiction on the relationship between psychological stress reaction and bedtime procrastination in young adults during the COVID-19 pandemic. BMC Psychiatry23. doi: 10.1186/s12888-023-05276-9,
162
Yasin N. Mushtaq R. Karamat A. (2024). Bedtime procrastination, sleep disturbance, fatigue and mental health in female university students: mediation analysis. J. Prof. Appl. Psychol.5, 215–223. doi: 10.52053/jpap.v5i2.271
163
Yinn T. H. Jun I. L. L. Jieh L. S. Jalil N. I. A. (2024). Unlocking the secrets of bedtime procrastination: the role of self–control, chronotype, and future time perspective in Malaysian young adults. J. Psikol. Malaysia38, 107–122.
164
You Z. Li X. Ye N. Zhang L. (2023). Understanding the effect of rumination on sleep quality: a mediation model of negative affect and bedtime procrastination. Curr. Psychol.42, 136–144. doi: 10.1007/s12144-020-01337-4
165
You Z. Mei W. Ye N. Zhang L. Andrasik F. (2020). Mediating effects of rumination and bedtime procrastination on the relationship between internet addiction and poor sleep quality. J. Behav. Addict.9, 1002–1010. doi: 10.1556/2006.2020.00104,
166
Yu W. Zhou X. Li B. (2025). The relationship between mobile phone addiction and physical activity behavior among university students: the mediating role of bedtime procrastination. Front. Psychol.16. doi: 10.3389/fpsyg.2025.1603046,
167
Yuan J. Bai J. Wang Y. Wu H. Mu Y. Zhao C. et al . (2024). Sleep behaviors predicted sleep disturbances among Chinese health science students: a cross-sectional study. Sleep Breath.28, 449–457. doi: 10.1007/s11325-023-02888-z,
168
Zhang K. (2024). Instant enjoyment above sleep: a cross-sectional study on the relationship between delay discounting and sleep health with the mediating role of bedtime procrastination. (master's thesis). Utrecht University
169
Zhang C. Meng D. Zhu L. Ma X. Guo J. Fu Y. et al . (2023). The effect of trait anxiety on bedtime procrastination: the mediating role of self-control. Int. J. Behav. Med.30, 260–267. doi: 10.1007/s12529-022-10089-3,
170
Zhang Y. Rehman S. Addas A. Ahmad M. Khan A. (2025). The mediating role of cognitive reappraisal on bedtime procrastination and sleep quality in higher educational context: a three-wave longitudinal study. Nat. Sci. Sleep17, 129–142. doi: 10.2147/NSS.S497183,
171
Zhang X. Shi Y. (2025). Latent profiles of nighttime-specific smartphone use and smartphone addiction among medical students: associations with bedtime procrastination and sleep disturbance. Perspect. Psychiatr. Care2025. doi: 10.1155/ppc/4786639
172
Zhang M. X. Wu A. M. (2020). Effects of smartphone addiction on sleep quality among Chinese university students: the mediating role of self-regulation and bedtime procrastination. Addict. Behav.111. doi: 10.1016/j.addbeh.2020.106552,
173
Zhang Y. Ye H. Cai Y. Chen F. Huang M. Li M. et al . (2024). Is bedtime procrastination related to multidimensional sleep health? Evidence from samples of different educational stages (aged 10–25) in China. Child Psychiatry Hum. Dev., 1–11. doi: 10.1007/s10578-024-01786-z
174
Zhang M. X. Zhou H. Yang H. M. Wu A. M. (2023). The prospective effect of problematic smartphone use and fear of missing out on sleep among Chinese adolescents. Curr. Psychol.42, 5297–5305. doi: 10.1007/s12144-021-01863-9
175
Zhao Y. Meng D. Ma X. Guo J. Zhu L. Fu Y. et al . (2024). Examining the relationship between bedtime procrastination and personality traits in Chinese college students: the mediating role of self-regulation skills. J. Am. Coll. Heal.72, 432–438. doi: 10.1080/07448481.2022.2038179,
176
Zhou R. Xiao Y. Shen X. Zhao W. Liu G. Chen H. et al . (2025). The predictive performance of behavioral-psychological factors on anxiety symptoms of varying severity among Chinese college students. J. Affect. Disord.385. doi: 10.1016/j.jad.2025.119408,
177
Zhu Y. Huang J. Yang M. (2022). Association between chronotype and sleep quality among Chinese college students: the role of bedtime procrastination and sleep hygiene awareness. Int. J. Environ. Res. Public Health20:197. doi: 10.3390/ijerph20010197,
178
Zhu Y. Liu J. Wang Q. Huang J. Li X. Liu J. (2023). Examining the association between boredom proneness and bedtime procrastination among Chinese college students: a sequential mediation model with mobile phone addiction and negative emotions. Psychol. Res. Behav. Manag.16, 4329–4340. doi: 10.2147/PRBM.S431615,
179
Zhu L. Meng D. Ma X. Guo J. Mu L. (2020). Sleep timing and hygiene practices of high bedtime procrastinators: a direct observational study. Fam. Pract.37, 779–784. doi: 10.1093/fampra/cmaa079,
180
Zhu Y. Wang Q. Liu J. Huang J. (2024). Parental psychological control and depression, anxiety among adolescents: the mediating role of bedtime procrastination and moderating role of neuroticism. Arch. Psychiatr. Nurs.51, 1–9. doi: 10.1016/j.apnu.2024.05.002,
181
Zhuo R. (2024). Examining bedtime procrastination through the lens of academic stressors among undergraduate students: academic stressors including mediators of mobile phone addiction and active procrastination. Curr. Psychol.43, 1–10. doi: 10.1007/s12144-024-06038-w
Summary
Keywords
Bedtime Procrastination Scale, Cronbach’s alpha, McDonald’s omega, meta-analysis, reliability generalization
Citation
Oyar E, Çelikten-Demirel S and Erdemir A (2026) A meta-analytic reliability generalization study of the Bedtime Procrastination Scale. Front. Psychol. 17:1709258. doi: 10.3389/fpsyg.2026.1709258
Received
19 September 2025
Revised
02 January 2026
Accepted
04 January 2026
Published
18 February 2026
Volume
17 - 2026
Edited by
Laura Badenes-Ribera, University of Valencia, Spain
Reviewed by
Juan Botella, Autonomous University of Madrid, Spain
Amirhossein Rasouli, Shahid Beheshti University of Medical Sciences, Iran
Updates
Copyright
© 2026 Oyar, Çelikten-Demirel and Erdemir.
This is an open-access article distributed under the terms of the Creative Commons Attribution License (CC BY). The use, distribution or reproduction in other forums is permitted, provided the original author(s) and the copyright owner(s) are credited and that the original publication in this journal is cited, in accordance with accepted academic practice. No use, distribution or reproduction is permitted which does not comply with these terms.
*Correspondence: Esra Oyar, esratas@gazi.edu.tr
Disclaimer
All claims expressed in this article are solely those of the authors and do not necessarily represent those of their affiliated organizations, or those of the publisher, the editors and the reviewers. Any product that may be evaluated in this article or claim that may be made by its manufacturer is not guaranteed or endorsed by the publisher.