 Hannah L. Dimmick
 Cody R. van Rassel1
 Martin J. MacInnis
 Reed Ferber
- 1Human Performance Laboratory, Faculty of Kinesiology, University of Calgary, Calgary, AB, Canada
- 2Running Injury Clinic, Calgary, AB, Canada
Running biomechanics are affected by fatiguing or prolonged runs. However, no evidence to date has conclusively linked this effect to running-related injury (RRI) development or performance implications. Previous investigations using subject-specific models in running have demonstrated higher accuracy than group-based models, however, this has been infrequently applied to fatigue. In this study, two experiments were conducted to determine whether subject-specific models outperformed group-based models to classify running biomechanics during non-fatigued and fatigued conditions. In the first experiment, 16 participants performed four treadmill runs at or around the maximal lactate steady state. In the second experiment, nine participants performed five prolonged runs using commercial wearable devices. For each experiment, two segments were extracted from each trial from early and late in the run. For each participant, a random forest model was applied with a leave-one-run-out cross-validation to classify between the early (non-fatigued) and late (fatigued) segments. Additionally, group-based classifiers with a leave-one-subject-out cross validation were constructed. For experiment 1, mean classification accuracies for the single-subject and group-based classifiers were 68.2 ± 8.2% and 57.0 ± 8.9%, respectively. For experiment 2, mean classification accuracies for the single-subject and group-based classifiers were 68.9 ± 17.1% and 61.5 ± 11.7%, respectively. Variable importance rankings were consistent within participants, but these rankings differed from each participant to those of the group. Although the classification accuracies were relatively low, these findings highlight the advantage of subject-specific classifiers to detect changes in running biomechanics with fatigue and indicate the potential of using big data and wearable technology approaches in future research to determine possible connections between biomechanics and RRI.
1. Introduction
Researchers have long hypothesized that fatigue during running could be a contributing factor to running-related injury (RRI) (1, 2) and performance degradation (3–6). Fatigue-related changes in biomechanics may lead to tissues (i.e., bones, tendons, ligaments, muscles) receiving “atypical” stress/impact beyond the tissue's tensile limits (7). Given that “typical” biomechanics do not appear to be associated with injury (8) or performance (9, 10), it has been postulated that altered biomechanics due to fatigue could be “improper” for the body, leading to negative outcomes. Thus, if the nature of these atypical movements could be identified, runners could attempt to correct these alterations to maintain non-fatigued biomechanics and avoid injurious/inefficient movement patterns through strength and conditioning interventions. The ability to identify when biomechanics begin to change could also inform training and recovery protocols. However, to date, the scientific literature has not substantiated a consistent relationship between biomechanical patterns and RRI reduction or performance enhancement (11, 12), necessitating new approaches to understand the etiology and implications of fatigue on running biomechanics.
Conflicting results between physiological fatigue and concomitant changes in running biomechanics could be explained by methodological issues. One possibility is the heterogeneous nature of the studies (i.e., varying fatiguing protocols, participant populations, and data collection modalities), making synthesis difficult. Another potential factor is the predominance of group-based analyses (13, 14) that often ignore relevant individual responses. For example, previous studies have reported that fatigue is associated with significant increases in mean step length (15) and instantaneous loading rate (16), while simultaneously reporting that some individuals demonstrated opposite changes or no changes in those variables. Others have reported no changes in peak positive tibial acceleration, even though ∼50% of the participants showed a positive change, while others showed a negative change (17), washing out any reportable mean effect. These examples and others make it clear that group-based analyses can mask relevant responses from individual runners, obscuring meaningful conclusions.
In recent years, the medical field has turned towards “precision medicine”—a model based on “an understanding of the genetic make-up, personal lifestyle, gene, and surrounding environment of an individual” (18). This model shifts the focus from the “average” patient to the individual patient (19). Although some researchers have commented on the need for individualized models in a sports science context (20–22), noting “the “average” runner (mean data) [does] not resemble any of the individuals in a group”, (23), the volume of data required to design these models has, until recently, been difficult to obtain. However, with the advent and expanding accessibility of high-frequency data from wearable sensors and machine learning models (24), “precision sports science” (25) is an increasingly plausible and potentially useful framework (26).
At present, machine learning models have been used infrequently to investigate subject-specific models of running biomechanical fatigue. Buckley et al. (27) used a random forest classifier to distinguish fatigued and non-fatigued running biomechanics from a single center-of-mass (CoM) inertial measurement unit (IMU) in both subject-specific and group-based classifiers. The subject-specific classifiers out-performed the group-based classifier with accuracies of 89% and 75%, respectively. In contrast, Op De Beéck et al. (28) determined that individual models had slightly higher mean average error than group-based models when regressing rate of perceived exertion (RPE) to biomechanical features over the course of a fatiguing trial. These conflicting results may be due to analysis differences, with one using a binary fatigue classifier and the other employing a regression approach. Subject-specific models have significantly outperformed group-based models for differentiating incline (29) and weather (30) conditions during running. Furthermore, Ahamed et al. (30) demonstrated that in a random forest model, the most important features to classification were different between participants, indicating that biomechanics changed between conditions, but that these specific changes were largely unique to each individual. Determining feature importance for individuals during fatigue in running has not, to our knowledge, been investigated previously. Moreover, determining whether individuals rely on different strategies when adjusting biomechanics during fatigue in running is critical to ultimately determining the necessity of subject-specific intervention.
Therefore, the purpose of this study was to investigate the difference between subject-specific and group-based models used to classify the effect of exercise-induced fatigue from prolonged running in two experimental conditions: a lab-based treadmill protocol and an outdoor, “real-world” dataset. Describing biomechanical changes due to running fatigue at an individual level has potential implications for RRI prevention and performance if these effects can be correctly and consistently defined. We hypothesize that subject-specific models will show greater accuracy than group-based models and that data collected from the treadmill in controlled conditions will produce a model with higher accuracy than data collected from runners in real-world, outdoor conditions.
2. Methods
Two experiments were conducted for this investigation. Experiment 1 was performed using a laboratory-based protocol. Subsequently, Experiment 2 was developed to compare/complement the results from Experiment 1 using “in the wild” data.
2.1. Experiment 1
2.1.1. Participants
Sixteen recreationally and competitively trained runners (7 female, 9 male, age = 30 ± 4 years, height = 174.3 ± 9.1 cm, weight = 70.5 ± 10.5 kg) provided informed consent to participate in this study, which was approved by the Ethics Board at the University of Calgary (REB20-0111). Participants were included if they were between the ages of 18 and 45 years and had a recent 10-km performance of ≤50 min or ≤55 min for men and women, respectively. All participants were familiar with treadmill running, were free of medical conditions and injuries that could interfere with metabolic and cardiorespiratory exercise responses and completed the Physical Activity Readiness Questionnaire prior to exercise to ensure there were no identifiable contraindications to exercise.
2.1.2. Protocol
Participants visited the lab 5 times. For all visits, participants were instructed to refrain from eating and consuming caffeine at least 2 h prior to testing and to refrain from strenuous exercise at least 6 h prior. Participants used their own running shoes but were required to use the same shoes for each visit. In the first visit, maximal lactate steady state (MLSS) was estimated using a modified Step-Ramp-Step test that has been validated for use in running (31, 32). The MLSS represents the boundary between heavy and severe exercise (33–36). For the next 4 visits, participants performed treadmill runs at or around the estimated MLSS (2 trials at MLSS, 1 trial 5% above MLSS, 1 trial 5% below MLSS) (33). Each trial began with the participant performing a 5-min warmup at 1.9 m/s before increasing to the target speed. The trial was terminated when the participant reached volitional exhaustion, or at 45 min, whichever occurred first. Each visit was separated by at least 48 h, and participants were not informed of the speed until after all experimental trials were completed. During each trial, participants were fitted with an IMU (Blue Trident, Vicon, Oxford, UK; tri-axial accelerometer sampling rate 1,125 Hz, range ±16 g) positioned between the posterior superior iliac spines with the top border of the sensor positioned on a line coincident with the inferior aspect of the iliac crest. The X, Y, and Z axes were oriented in the vertical (+ to the superior), medial-lateral (+ to the left), and anterior-posterior (+ to the posterior) directions, respectively. Incline was set at 1% to correspond to previous literature (37). RPE values (38) were recorded every 5 min.
2.1.3. Data processing
Initial contact for each step was identified using methods described in Benson et al. (39). A step was defined as the duration between consecutive initial contacts from contralateral feet, and a stride was defined as the duration between consecutive initial contacts from the ipsilateral foot. Mean and standard deviation of the number of data points in each step were calculated, and those ±2 standard deviations from the mean were labeled as improperly segmented and excluded (39). Samples were constructed from the raw signal of five consecutive strides (39, 40). Non-fatigue (NF) and fatigue (FT) conditions were considered the first 5 min of the trial and the final complete 5-min segment (to correspond to RPE sampling), respectively (41). The RPE label for each condition was the value provided at the end of the 5-min segment. For example, if a participant terminated the test at 38 min, the period from 30 to 35 min would be defined as the FT condition, and it would correspond to a single RPE value (taken at 35 min).
Thirty-nine features were extracted from the acceleration signals of each sample: mean, standard deviation, median, 25th percentile, 75th percentile, root mean square (RMS), maximum, minimum, sample entropy calculated from the three primary axes (vertical, medio-lateral, anterior-posterior) and the resultant (17, 28, 39, 42–48), and the ratio of single-axis RMS to resultant RMS (49). These features were selected based on previous analyses (31) and were identified due to their typical inclusion as features in machine learning models.
2.2. Experiment 2
2.2.1. Participants
Nine participants (1 female, 8 males, age = 44 ± 13 years) were selected from the Wearable Technology Citizen Science Level-4 secure research database on the following criteria: reported very good or excellent health in the previous year, recorded at least 5 outdoor runs that were >14 km within a 3-month period, and recorded runs with a qualifying Garmin device (Garmin, Inc., Olathe, KS, USA). Participants provided informed consent to share their information through the database, which was approved by the Ethics Board at the University of Calgary (REB20-0572).
2.2.2. Protocol
Within the database, the frequency of activities, weather, distance, route, speed, and surfaces represent individuals' own training habits and were not prescribed or controlled by researchers. Runs selected for this study were required to be completed outdoors, within a 3-month period, under similar weather conditions to minimize variability (e.g., effects of training) (30). Surfaces were not reported, and injury history/training status were not known.
Participants used their own Garmin devices for data collection (HRM-Tri, n = 5; HRM-Run, n = 3; Running Dynamics Pod, n = 1). Qualifying devices were those that were (1) enabled to calculate Garmin Running Dynamics and (2) had been previously lab-validated (50, 51). The HRM devices are mounted on the sternum and the Running Dynamics Pod is mounted on the low back. Garmin Running Dynamics are variables calculated onboard select Garmin devices: stance time, stance time balance, cadence, stride length, vertical oscillation, and vertical ratio (52). Each participant used the same device for every run that was included in analysis. Data were sampled using the device's onboard algorithms, uploaded by the participant to the Garmin Connect online platform, and extracted for data processing via the Wearable Technology Citizen database.
2.2.3. Data processing
Five of 6 Garmin Running Dynamics variables were selected for analysis: stance time, stance time balance, cadence, stride length, and vertical oscillation. It should be noted that vertical ratio was excluded due to its direct correlation to vertical oscillation and stride length (i.e., it would add minimal additional relevant information for classification). Trials were only included if <20% of strides had any variable missing. Strides with any missing variables were excluded from analysis. Trials were additionally excluded if the analysis segments included stopped time (e.g., for a walk break or red light) ≥ 30 s. This selection process was performed until each participant had 5 runs that met the criteria.
To remove the effect of speed and grade, which can have significant impacts on biomechanics (53, 54), all variables were analyzed in successive univariate models adjusted for speed and grade (55).
The first 2-km and final 1-km were excluded from each trial to account for any potential changes in biomechanics associated with warmup or cooldown. After these exclusions, the first 2-km segment (BEG) and the final 2-km segment of each run were selected for analysis. A visualization of the segment selection from both experiments can be found in Figure 1. Due to the constraints of the database, participants' fatigue level in Experiment 2 could not be empirically determined. The minimum distance, 14-km, was selected to ensure reasonable confidence that participants would be experiencing fatigue by the end of their session. For simplicity, this prolonged effort is referred to here as “fatiguing”.
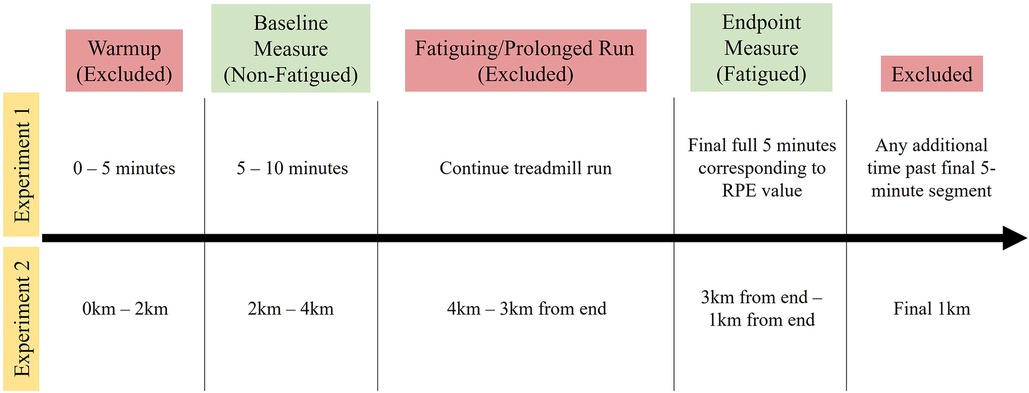
Figure 1. Timeline of segment selection.
2.3. Data analysis
An ensemble machine learning classifier, random forest, was employed to develop classification models for the NF vs. FT during Experiment 1, as well as the BEG vs. END segments for Experiment 2. The random forest classifier provides high levels of accuracy while additionally reporting the relative importance of each predictor variable (56). The random forest model was selected for several reasons. First, in a pilot analysis, random forest performed as well or better than a support vector machine, naïve bayes, and logistic regression. Additionally, the random forest allowed for consistency with previous literature (29, 30) and robustness to small datasets (56).
Two methods were used to determine the ability of the random forest classifier to distinguish between the two conditions (57, 58). These methods are described in Figure 2. Method 1 was a subject-specific approach, where data from only one participant at a time was included. A leave-one-trial-out cross-validation was performed. Data from 3 (Experiment 1) or 4 (Experiment 2) runs were used as the training set, and the test set consisted of the final (4th/5th) run. This was performed 4–5 times per participant, with each possible combination of runs used for the training and test sets.
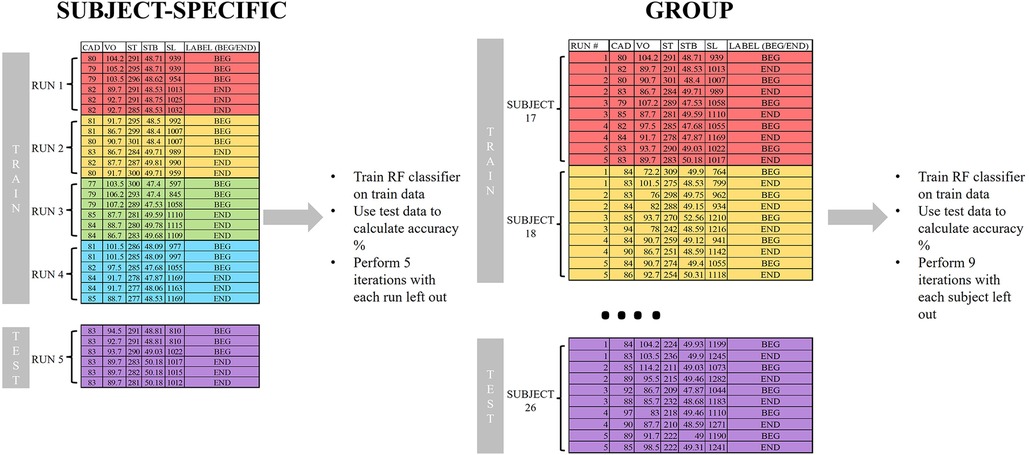
Figure 2. Example data from Experiment 1 to demonstrate the workflow of the random forest classifiers for subject-specific and group-based models.
Method 2 was a group-based approach and collapsed all runs for each participant into a single set per participant. Then, a leave-one-subject-out cross-validation was performed by using data from n-1 participants were used as the training set, with the test set consisting of the left-out participant. This was performed for each participant. Both methods were performed for each segment pair (NF vs. FT, BEG vs. END) and were applied using the standalone Python programming language (version 3.7.4, www.python.org) (59).
The developed random forest models were tuned with a grid search (max_depth (2–20), n_estimators (100–1000), and max_features (1–39 for Experiment 1, 1–5 for Experiment 2)) on the training set using a 5-fold cross-validation with the built-in Anaconda distribution (open-source) of Python programming language, using numpy, scikit-learn, and scipy (“sklearn.ensemble.RandomForestClassifier”) packages (60). Because all variables were continuous, the random forest employed a Gini index calculation to determine variable importance based on impurity reduction (61).
For further information on usage of random forest for commercial wearable data, refer to Ahamed et al. (30).
Significance of classification results was tested using binomial methods from Combrisson & Jerbi (62). These methods provide a framework to perform empirical significance testing for binary classifiers given limitations in sample size, rather than assuming a theoretical significance of >50% accuracy.
To compare RPE between conditions in Experiment 1, a paired samples t-test was performed.
Significance was set at α ≤ 0.05.
3. Results
3.1. Descriptive
Trial details for each participant are presented in Tables 1, 2 for Experiments 1 and 2, respectively. For Experiment 1, treadmill speeds at MLSS ranged from 2.77–3.98 m/s (males = 2.77–3.98 m/s, females = 2.82–3.89 m/s). Results of other tested classifiers are reported in Supplementary Tables S1, S2.
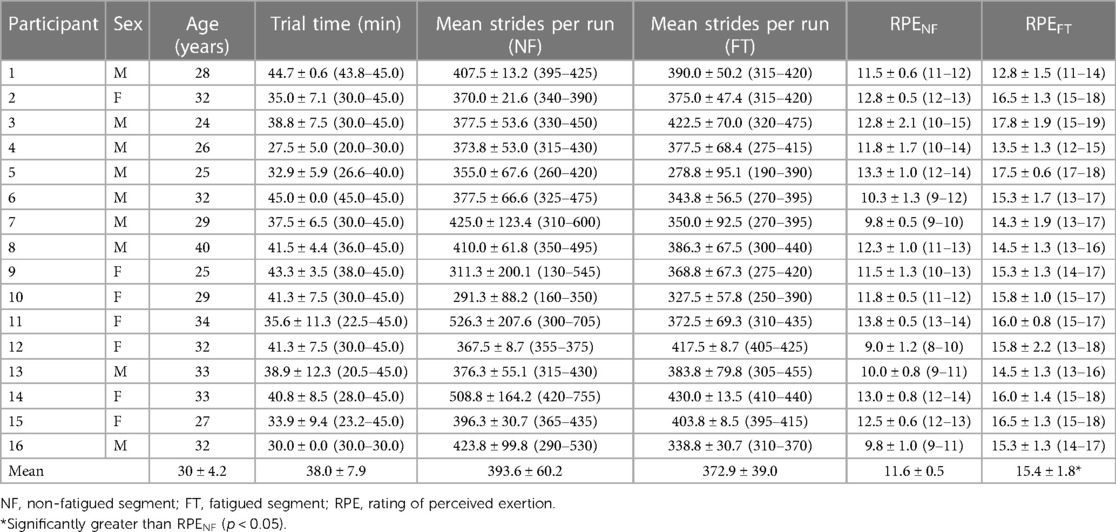
Table 1. Descriptive characteristics of participants and included runs for Experiment 1; mean ± SD (range).
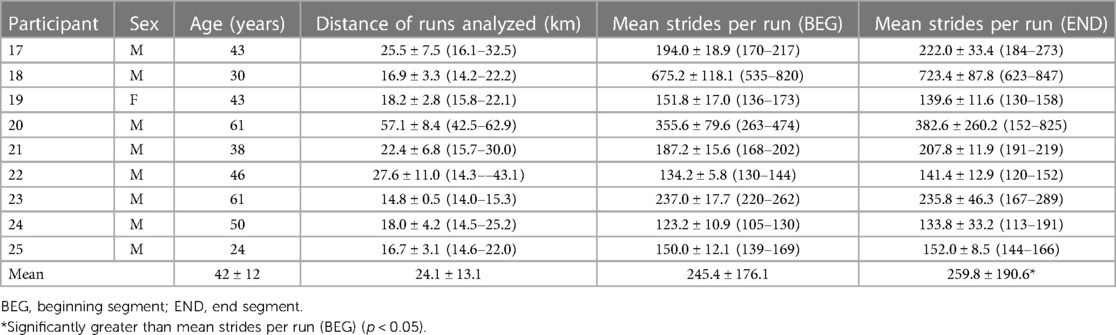
Table 2. Descriptive characteristics of participants and included runs for Experiment 2; mean ± SD (range).
3.2. Random forest classifiers
Figures 3, 4 present the results of the random forest classifiers for Experiments 1 and 2, respectively, and include the minimum classification accuracy required for significance. Mean classification accuracies for the single-subject and group-based NF vs. FT classifiers from Experiment 1 were 68.2 ± 8.2% and 57.0 ± 8.9%, respectively. Mean classification accuracies for the single-subject and group-based BEG vs. END classifiers from Experiment 2 were 68.9 ± 17.1% and 61.5 ± 11.7%, respectively. Further details of individual classifier results, including details on precision and recall, can be found in the Supplementary Tables S3–S6. Variable importance rankings are presented in Supplementary Tables S7–S10, and the general trend of the data indicated that individual participants showed relatively high consistency in variable importance rankings across classifier iterations (with different train/test sets), but these did not necessarily align with the variable importance rankings in the group-based model, or other individuals' subject-specific models. Alternatively, in the group-based models, variable importance rankings were generally similar no matter which participant was used as the test set.
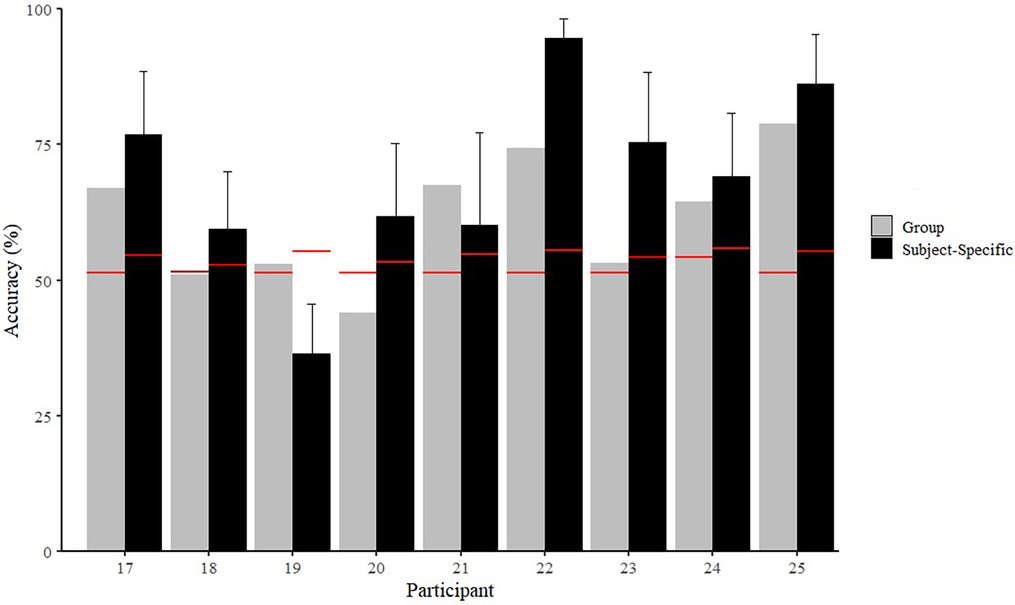
Figure 3. Accuracies of non-fatigued (NF) vs. fatigued (FT) classifiers for subject-specific and group-based models in Experiment 1. Group-based values reflect the accuracy of the model when the specific participant was used as the left-out test set. Red lines represent minimum classification accuracy required for significance (p < 0.05).
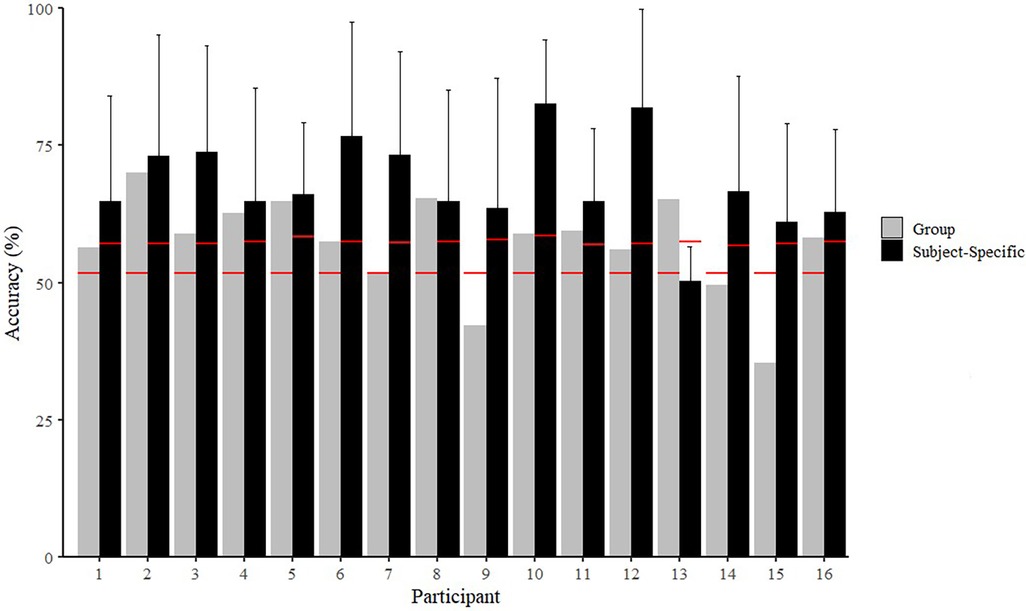
Figure 4. Accuracies of beginning (BEG) vs. end (END) classifiers for subject-specific and group-based models in Experiment 2. Group-based values reflect the accuracy of the model when the specific participant was used as the left-out test set. Red lines represent minimum classification accuracy required for significance (p < 0.05).
For example, for every iteration of the BEG vs. END classifiers, the group-based model ranked cadence and stance time as the most important features, but Participant 23 ranked ST as the least important each time in the subject-specific models. Additionally, in the BEG vs. END subject-specific classifiers, Participant 6 never ranked stance time balance outside of the top 2, whereas Participant 25 only ranked stance time balance in the bottom 2. In the NF vs. FT classifier, the median of the vertical axis was selected in the top 5 for 14 out of 16 iterations in the group-based classifier, but was always ranked in the bottom 10 features for Participant 16.
4. Discussion
The primary finding of this study was that subject-specific models were more accurate than group-based models in distinguishing between non-fatigued and fatigued running states. These results support our hypothesis and align with previous findings that have demonstrated greater efficacy of subject-specific models over group-based classifiers for fatigue (27) and other running conditions (30, 63, 64). In contrast to our hypothesis, the mean classification accuracies were relatively similar between Experiments 1 and 2, with high variability between participants and trials. A secondary finding was that different variable importance rankings were observed between participants, as well as different rankings between each participant and the group classifiers.
The accuracy of the subject-specific classifiers here was lower than a previous study that also used individualized binary classifiers from an IMU at the CoM (89%) (27). However, that study used a different type of fatiguing protocol (beep test) and a continuous signal rather than a discrete or statistical feature set, so it may not be directly comparable to the current study. Moreover, the group-based accuracy means (i.e., NF vs. FT = 57.0 ± 8.9%; BEG vs. END = 61.5 ± 11.7%) and ranges (i.e., NF vs. FT = 35.3–70.1%; BEG vs. END = 44.0–78.8%) were largely similar to previous similar analyses using CoM-mounted IMUs to classify between non-fatigued and fatigued states (i.e., 60.9% (43); 53%–64% (27)).
Importantly, the classification accuracies of most models were statistically significant (p < 0.05), although this does not necessarily indicate that the accuracy was sufficient to be meaningful to an end user. As discussed previously, different types of runners may have different standards for accuracy, sensitivity, and specificity of a system that could be used to identify fatigue (43). Determining the minimum accuracy for usefulness may be a topic for future investigations. A system with high specificity but low sensitivity for identifying fatigue may not be sufficient for making real-time training decisions based on fatigue identification given the lack of ability to detect fatigue as it appears. However, a system with high sensitivity and low specificity may lead to disuse or overly cautious training decisions due to over-identification of fatigue states. There are several possible reasons that higher classification accuracy was not observed here. First, a single sensor placed at the CoM may be insufficient to detect global changes in biomechanics due to fatigue in these protocols. Marotta et al. (43) concluded that placing sensors on either side of a joint, especially the knee joint (i.e., thigh and shank), produced the highest classification accuracies between non-fatigued and fatigued biomechanics. Therefore, to adequately detect these effects, additional sensor information may be required. Secondly, previous studies have hypothesized that if the exercise intensity (and associated cardiovascular stress) is high enough, participants may terminate the activity prior to enough neuromuscular fatigue occurring to alter biomechanics (65). This could have been a factor in Experiment 1, especially for the trials at the highest speed, whereas in Experiment 2, because no information was collected on participants' fatigue states, it is possible that the prolonged runs were an insufficient fatiguing stimulus to adequately alter biomechanics as detected from a CoM IMU for some participants (2, 41, 66–69). More data/additional trials may also be required to adequately quantify an individual's fatigue response. Further research employing different sensor arrangements, number of running trials, and intensity of trials is therefore necessary.
Differences in fitness/experience level could also be a possible explanation for the high variability in subject-specific model accuracies (Supplementary Tables S3, S5). For example, in the subject-specific NF vs. FT classifier, Participant 13 (VO2max = 58.2 ml/kg/min) had an accuracy of 50.2%, while Participant 10 (VO2max = 49.5 ml/kg/min) had an accuracy of 82.6%. The range was even wider in the subject-specific BEG vs. END classifier, with Participant 19 producing only a 36.4% accuracy, while Participant 22 produced a 94.7% accuracy. These ranges also may be due to differing individual strategies to manage fatigue, anthropometric characteristics, training approaches/history, injury status/history, etc. (41, 66, 67, 70–73), potential differences in day-to-day placement of commercial devices (74).
Irrespective of these limitations, the results of the current study emphasize how individual runners show different biomechanical responses to fatigue as compared to those reported in group-based models. These individual importance rankings showed salient differences from the group rankings, supporting the hypothesis that group-based information is likely insufficient to capture fatigue effects for most individuals nor to understand the intricacies of how fatiguing runs may alter biomechanical patterns. While inter-individual differences for certain variables have been previously noted, to our knowledge, this is the first to compare inter-individual differences across multiple variables in a single model.
More work is required before individualized running fatigue models could serve as the basis for an intervention protocol. Williams (13) advocated for identifying individuals' structural and functional abilities and determining how these abilities interact to influence performance and injury outcomes. Relevant variables to include in the models—as well as possible external influences on “typical” biomechanics, such as different footwear (75), listening to music (76), or mood (77)—would first have to be determined. Subsequently, the causes of these biomechanical alterations would have to be determined (e.g., weakness, asymmetries, pain, or other sources). Next, interventions could be designed to “correct” these issues and prolong non-fatigued biomechanics later into the run. However, based on the results presented here, it appears that a precision sports science approach is required to ultimately determine if fatigue-based interventions could be successful for injury prevention or performance enhancement.
There are other limitations in this study that must also be acknowledged. First, the devices used in Experiment 2 were commercial wearable devices with parameters derived from proprietary algorithms and were limited to the specific variables measured and calculated by the device. All devices had been previously lab validated and shown to be highly reliable, but additional variables important to the task (e.g., joint kinematics and kinetics) may have been missed (78). However, these devices are those that are typically used by runners to derive information about their training, and the complementary results between the two experiments emphasize the general underlying conclusions. Similarly, features selected from treadmill data were based on previous literature, and by making an ad hoc selection, relevant information could have been discarded (79). Second, in Experiment 2, external circumstances were not controlled and may have changed running form or influenced biomechanical adjustments in unknown ways. However, this also increases the real-world applicability of the analysis given the heterogeneity of circumstances most runners experience day-to-day. Third, some participants in Experiment 2 had longer runs than others, meaning that their END segments were further away from the BEG segment than others. This method was chosen to incorporate the segments that were most likely to represent a fatigued state. However, without knowing participant fitness or fatigue information, it is not clear which (if either) was the correct selection to demonstrate fatigue-related alterations in biomechanics. Fourth, there is a risk of overfitting given the relatively small sample sizes, particularly in the subject-specific model, although cross-validation procedures were employed to reduce this risk (80, 81). Finally, the sample sizes between the group-based and subject-specific models were not the same, which could impact the comparability of accuracy results, although it should not affect the interpretation of variable importance rankings. Additionally, by including minimum accuracies for significance (which are based on sample sizes), better performance comparisons may be made.
In conclusion, this study indicates that fatigue-related changes in running biomechanics are better described by subject-specific than group-based models. Additionally, this presents evidence that runners generally alter their biomechanics in a manner different from the aggregate, indicating that group-based models are likely insufficient to explain many individuals' responses to fatigue and thus unlikely to be the basis for successful intervention. In the future, adding more IMUs/additional types of sensors (e.g., heart rate, blood oxygenation) (78), using different IMU configurations (43), or applying different classifiers (27, 82) may improve accuracy and applicability. Researchers and developers will need to find the right balance of model type, sensor configuration, and measurement variables to make this type of system both efficacious and usable to coaches and clinicians.
Data availability statement
The raw data supporting the conclusions of this article will be made available by the authors, upon reasonable request.
Ethics statement
The studies involving humans were approved by University of Calgary Conjoint Health Research Ethics Board. The studies were conducted in accordance with the local legislation and institutional requirements. The participants provided their written informed consent to participate in this study.
Author contributions
HD: Conceptualization, Data curation, Formal Analysis, Funding acquisition, Investigation, Methodology, Software, Validation, Visualization, Writing – original draft, Writing – review & editing. CvR: Conceptualization, Data curation, Formal Analysis, Funding acquisition, Investigation, Methodology, Project administration, Writing – review & editing. MM: Writing – review & editing, Conceptualization, Funding acquisition, Methodology, Project administration, Resources, Supervision. RF: Conceptualization, Funding acquisition, Project administration, Supervision, Writing – review & editing.
Funding
The author(s) declare financial support was received for the research, authorship, and/or publication of this article.
This work was partially funded by the NSERC CREATE Wearable Technology and Collaboration (We-TRAC) Training Program (Project No. CREATE/511166-229 2018) and two NSERC Discovery Grants (Project Nos. RGPIN/04079-2014, RGPIN-2018-06424) and supported by funding from an NSERC Vanier Canada Graduate Scholarship, an Alberta Innovates Graduate Studentship in Health Innovation, an Alberta Innovates Graduate Student Scholarship for Data-Enable Innovation, and a University of Calgary Eyes High Doctoral Recruitment Scholarship
Acknowledgments
The authors thank the students who assisted in data collection, Kate M. Sales and Oluwatimilehin Olamilekan Ajayi, as well as assistance with database retrieval from Allan Brett.
Conflict of interest
The authors declare that the research was conducted in the absence of any commercial or financial relationships that could be construed as a potential conflict of interest.
Publisher's note
All claims expressed in this article are solely those of the authors and do not necessarily represent those of their affiliated organizations, or those of the publisher, the editors and the reviewers. Any product that may be evaluated in this article, or claim that may be made by its manufacturer, is not guaranteed or endorsed by the publisher.
Supplementary material
The Supplementary Material for this article can be found online at: https://www.frontiersin.org/articles/10.3389/fspor.2023.1283316/full#supplementary-material
References
1. Clansey AC, Hanlon M, Wallace ES, Lake MJ. Effects of fatigue on running mechanics associated with tibial stress fracture risk. Med Sci Sports Exerc. (2012) 44(10):1917–23. doi: 10.1249/MSS.0b013e318259480d
2. Voloshin AS, Mizrahi J, Verbitsky O, Isakov E. Dynamic loading on the human musculoskeletal system —effect of fatigue. Clin Biomech. (1998) 13(7):515–20. doi: 10.1016/S0268-0033(98)00030-8
3. Burgess DTL, Lambert PMI. The effects of training, muscle damage and fatigue on running economy. Int Sport Med J. (2010) 11(4):363–79.
4. Derrick TR, Dereu D, Mclean SP. Impacts and kinematic adjustments during an exhaustive run. Med Sci Sports Exerc. (2002) 34(6):998–1002. doi: 10.1097/00005768-200206000-00015
5. Elliot B, Ackland T. Biomechanical effects of fatigue on 10,000 meter running technique. Res Q Exerc Sport. (1981) 52(2):160–6. doi: 10.1080/02701367.1981.10607853
6. Morgan DW, Bransford DR, Costill DL, Daniels JT, Howley ET, Krahenbuhl GS. Variation in the aerobic demand of running among trained and untrained subjects. Med Sci Sports Exerc. (1995) 27(3):404–9. doi: 10.1249/00005768-199503000-00017
7. Grimston SK, Zernicke RF. Exercise-related stress responses in bone. J Appl Biomech. (1993) 9:2–14. doi: 10.1123/jab.9.1.2
8. Jauhiainen S, Pohl AJ, Äyrämö S, Kauppi J, Ferber R. A hierarchical cluster analysis to determine whether injured runners exhibit similar kinematic gait patterns. Scand J Med Sci Sports. (2020) 30(4):732–40. doi: 10.1111/sms.13624
9. Moore IS. Is there an economical running technique? A review of modifiable biomechanical factors affecting running economy. Sports Med. (2016) 46(6):793–807. doi: 10.1007/s40279-016-0474-4
10. Hunter I, Smith GA. Preferred and optimal stride frequency, stiffness and economy: changes with fatigue during a 1-h high-intensity run. Eur J Appl Physiol. (2007) 100(6):653–61. doi: 10.1007/s00421-007-0456-1
11. Gruber AH. The “impacts cause injury” hypothesis: running in circles or making new strides? J Biomech. (2023) 156:111694. doi: 10.1016/j.jbiomech.2023.111694
12. Lopes AD, Mascarinas A, Hespanhol L. Are alterations in running biomechanics associated with running injuries? A systematic review with meta-analysis. Braz J Phys Ther. (2023) 27(4):100538. doi: 10.1016/j.bjpt.2023.100538
13. Williams KR. Biomechanical factors contributing to marathon race success. Sports Med. (2007) 37(4):420–3. doi: 10.2165/00007256-200737040-00038
14. Zandbergen MA, Marotta L, Bulthuis R, Buurke JH, Veltink PH, Reenalda J. Effects of level running-induced fatigue on running kinematics: a systematic review and meta-analysis. Gait Posture. (2023) 99:60–75. doi: 10.1016/j.gaitpost.2022.09.089
15. Williams KR, Snow R, Agruss C. Changes in distance running kinematics with fatigue. Int J Sport Biomech. (1991) 7(2):138–62. doi: 10.1123/ijsb.7.2.138
16. Paquette MR, Melcher DA. Impact of a long run on injury-related biomechanics with relation to weekly mileage in trained male runners. J Appl Biomech. (2017) 33(3):216–21. doi: 10.1123/jab.2016-0170
17. Schütte KH, Seerden S, Venter R, Vanwanseele B. Influence of outdoor running fatigue and medial tibial stress syndrome on accelerometer-based loading and stability. Gait Posture. (2018) 59:222–8. doi: 10.1016/j.gaitpost.2017.10.021
18. Subramanian M, Wojtusciszyn A, Favre L, Boughorbel S, Shan J, Letaief KB, et al. Precision medicine in the era of artificial intelligence: implications in chronic disease management. J Transl Med. (2020) 18(1):472. doi: 10.1186/s12967-020-02658-5
19. The Precision Medicine Initiative. Obama White House (2015). Available at: https://obamawhitehouse.archives.gov/precision-medicine
20. Jukic I, MIlanovic L, Krakan I, Njaradi N, Calleja-Gonzalez J, Cuzzolin F, et al. Strength and conditioning in top-level team sports: an individual discipline. In Zagreb, Croatia. (2020).
21. Kinugasa T, Cerin E, Hooper S. Single-subject research designs and data analyses for assessing elite athletes??? conditioning. Sports Med. (2004) 34(15):1035–50. doi: 10.2165/00007256-200434150-00003
22. Horst F, Hoitz F, Slijepcevic D, Schons N, Beckmann H, Nigg BM, et al. Identification of subject-specific responses to footwear during running. Sci Rep. (2023) 13(1):11284. doi: 10.1038/s41598-023-38090-0
23. Bates B. Single-subject methodology: an alternative approach. Med Sci Sports Exerc. (1996) 28(5):631–8. doi: 10.1097/00005768-199605000-00016
24. Phinyomark A, Petri G, Ibáñez-Marcelo E, Osis ST, Ferber R. Analysis of big data in gait biomechanics: current trends and future directions. J Med Biol Eng. (2018) 38(2):244–60. doi: 10.1007/s40846-017-0297-2
25. Mattsson CM, Wheeler MT, Waggott D, Caleshu C, Ashley EA. Sports genetics moving forward: lessons learned from medical research. Physiol Genomics. (2016) 48(3):175–82. doi: 10.1152/physiolgenomics.00109.2015
26. Montalvo AM, Tse-Dinh YC, Liu Y, Swartzon M, Hechtman KS, Myer GD. Precision sports medicine: the future of advancing health and performance in youth and beyond. Strength Cond J. (2017) 39(2):48–58. doi: 10.1519/SSC.0000000000000292
27. Buckley C, O’Reilly MA, Whelan D, Farrell AV, Clark L, Longo V, et al. Binary classification of running fatigue using a single inertial measurement unit. In: 2017 IEEE 14th International Conference on Wearable and Implantable Body Sensor Networks (BSN). Eindhoven, Netherlands: IEEE (2017). p. 197–201. Available at: http://ieeexplore.ieee.org/document/7936040/ (cited 2021 Sep 28).
28. Op De Beéck T, Meert W, Schütte K, Vanwanseele B, Davis J. Fatigue prediction in outdoor runners via machine learning and sensor fusion. In: Proceedings of the 24th ACM SIGKDD International Conference on Knowledge Discovery & Data Mining. London, United Kingdom: ACM (2018). p. 606–15.
29. Ahamed NU, Benson LC, Clermont CA, Pohl AJ, Ferber R. New considerations for collecting biomechanical data using wearable sensors: how does inclination influence the number of runs needed to determine a stable running gait pattern? Sensors. (2019) 19(11):2516. doi: 10.3390/s19112516
30. Ahamed NU, Kobsar D, Benson L, Clermont C, Kohrs R, Osis ST, et al. Using wearable sensors to classify subject-specific running biomechanical gait patterns based on changes in environmental weather conditions. Jan YK, editor. PLoS One. (2018) 13(9):e0203839. doi: 10.1371/journal.pone.0203839
31. Dimmick HL, van Rassel CR, MacInnis MJ, Ferber R. Between-day reliability of commonly used IMU features during a fatiguing run and the effect of speed. Sensors. (2022) 22(11):4129. doi: 10.3390/s22114129
32. van Rassel CR, Ajayi OO, Sales KM, Azevedo RA, Murias JM, Macinnis MJ. A “step-ramp-step” protocol to identify running speed and power associated with the maximal metabolic steady state. Med Sci Sports Exerc. (2023) 55(3):534–47. doi: 10.1249/MSS.0000000000003066
33. Beneke R, von Duvillard SP. Determination of maximal lactate steady state response in selected sports events. Med Sci Sports Exerc. (1996) 28(2):241–6. doi: 10.1097/00005768-199602000-00013
34. Billat VL, Sirvent P, Py G, Koralsztein JP, Mercier J. The concept of maximal lactate steady state: a bridge between biochemistry, physiology and sport science. Sports Med. (2003) 33(6):407–26. doi: 10.2165/00007256-200333060-00003
35. Faude O, Kindermann W, Meyer T. Lactate threshold concepts: how valid are they? Sports Med. (2009) 39(6):469–90. doi: 10.2165/00007256-200939060-00003
36. Poole DC, Jones AM. Oxygen uptake kinetics. Compr physiol. (2012) 2(2):933–96. doi: 10.1002/cphy.c100072
37. Jones AM, Doust JH. A 1% treadmill grade most accurately reflects the energetic cost of outdoor running. J Sports Sci. (1996) 14(4):321–7. doi: 10.1080/02640419608727717
38. Borg GAV. Pyschophysical bases of perceived exertion. Med Sci Sports Exercise. (1982) 14(7):377–81.
39. Benson LC, Clermont CA, Osis ST, Kobsar D, Ferber R. Classifying running speed conditions using a single wearable sensor: optimal segmentation and feature extraction methods. J Biomech. (2018) 71:94–9. doi: 10.1016/j.jbiomech.2018.01.034
40. Wundersitz DWT, Gastin PB, Richter C, Robertson SJ, Netto KJ. Validity of a trunk-mounted accelerometer to assess peak accelerations during walking, jogging and running. Eur J Sport Sci. (2015) 15(5):382–90. doi: 10.1080/17461391.2014.955131
41. Strohrmann C, Harms H, Kappeler-Setz C, Troster G. Monitoring kinematic changes with fatigue in running using body-worn sensors. IEEE Trans Inform Technol Biomed. (2012) 16(5):983–90. doi: 10.1109/TITB.2012.2201950
42. Kwapisz JR, Weiss GM, Moore SA. Activity recognition using cell phone accelerometers. SIGKDD Explor Newsl. (2011) 12(2):74–82. doi: 10.1145/1964897.1964918
43. Marotta L, Buurke JH, van Beijnum BJF, Reenalda J. Towards machine learning-based detection of running-induced fatigue in real-world scenarios: evaluation of IMU sensor configurations to reduce intrusiveness. Sensors. (2021) 21(10):3451. doi: 10.3390/s21103451
44. Pla G, Hollville E, Schütte K, Vanwanseele B. The use of a single trunk-mounted accelerometer to detect changes in center of mass motion linked to lower-leg overuse injuries: a prospective study. Sensors. (2021) 21(21):7385. doi: 10.3390/s21217385
45. Preece SJ, Goulermas JY, Kenney LPJ, Howard D. A comparison of feature extraction methods for the classification of dynamic activities from accelerometer data. IEEE Trans Biomed Eng. (2009) 56(3):871–9. doi: 10.1109/TBME.2008.2006190
46. Pirttikangas S, Fujinami K, Nakajima T. Feature selection and activity recognition from wearable sensors. In: Youn HY, Kim M, Morikawa H, editors. International symposium on ubiquitious computing systems. Berlin: Springer (2006). p. 516–27.
47. Richman JS, Moorman JR. Physiological time-series analysis using approximate entropy and sample entropy. Am J Physiol Heart Circ Physiol. (2000) 278(6):H2039–49. doi: 10.1152/ajpheart.2000.278.6.H2039
48. Schütte KH, Maas EA, Exadaktylos V, Berckmans D, Venter RE, Vanwanseele B. Wireless tri-axial trunk accelerometry detects deviations in dynamic center of mass motion due to running-induced fatigue. PLoS One. (2015) 10(10):e0141957. doi: 10.1371/journal.pone.0141957
49. McGregor SJ, Busa MA, Yaggie JA, Bollt EM. High resolution MEMS accelerometers to estimate VO2 and compare running mechanics between highly trained inter-collegiate and untrained runners. PLoS One. (2009) 4(10):e7355. doi: 10.1371/journal.pone.0007355
50. Adams D, Pozzi F, Carroll A, Rombach A, Zeni J. Validity and reliability of a commercial fitness watch for measuring running dynamics. J Orthop Sports Phys Ther. (2016) 46(6):471–6. doi: 10.2519/jospt.2016.6391
51. Watari R, Hettinga B, Osis S, Ferber R. Validation of a torso-mounted accelerometer for measures of vertical oscillation and ground contact time during treadmill running. J Appl Biomech. (2016) 32(3):306–10. doi: 10.1123/jab.2015-0200
52. Garmin, Inc. Running Dynamics and Physiological Measurements | Garmin Technology. Available at: https://discover.garmin.com/en-CA/performance-data/running/ (cited 2021 Aug 3).
53. Hollis CR, Koldenhoven RM, Resch JE, Hertel J. Running biomechanics as measured by wearable sensors: effects of speed and surface. Sports Biomech. (2021) 20(5):521–31. doi: 10.1080/14763141.2019.1579366
54. Vernillo G, Giandolini M, Edwards WB, Morin JB, Samozino P, Horvais N, et al. Biomechanics and physiology of uphill and downhill running. Sports Med. (2017) 47(4):615–29. doi: 10.1007/s40279-016-0605-y
55. Napier C, MacLean CL, Maurer J, Taunton JE, Hunt MA. Kinetic risk factors of running-related injuries in female recreational runners. Scand J Med Sci Sports. (2018) 28(10):2164–72. doi: 10.1111/sms.13228
56. Degenhardt F, Seifert S, Szymczak S. Evaluation of variable selection methods for random forests and omics data sets. Brief Bioinform. (2019) 20(2):492–503. doi: 10.1093/bib/bbx124
57. Ferber R, Osis ST, Hicks JL. Delp stride length. Gait biomechanics in the era of data science. J Biomech. (2016) 49(16):3759–61. doi: 10.1016/j.jbiomech.2016.10.033
58. Reynard F, Terrier P. Determinants of gait stability while walking on a treadmill: a machine learning approach. J Biomech. (2017) 65:212–5. doi: 10.1016/j.jbiomech.2017.10.020
59. Pedregosa F, Varoquaux G, Gramfort A, Michel V, Thirion B, Grisel O, et al. Scikit-learn: machine learning in python. Mach Learn Python. 6.
60. Gupta VP, Garton ALA, Sisti JA, Christophe BR, Lord AS, Lewis AK, et al. Prognosticating functional outcome after intracerebral hemorrhage: the ICHOP score. World Neurosurg. (2017) 101:577–83. doi: 10.1016/j.wneu.2017.02.082
61. Archer KJ, Kimes RV. Empirical characterization of random forest variable importance measures. Comput Stat Data Anal. (2008) 52(4):2249–60. doi: 10.1016/j.csda.2007.08.015
62. Combrisson E, Jerbi K. Exceeding chance level by chance: the caveat of theoretical chance levels in brain signal classification and statistical assessment of decoding accuracy. J Neurosci Methods. (2015) 250:126–36. doi: 10.1016/j.jneumeth.2015.01.010
63. Ahamed NU, Kobsar D, Benson LC, Clermont CA, Osis ST, Ferber R. Subject-specific and group-based running pattern classification using a single wearable sensor. J Biomech. (2019) 84:227–33. doi: 10.1016/j.jbiomech.2019.01.001
64. Derie R, Robberechts P, Van den Berghe P, Gerlo J, De Clercq D, Segers V, et al. Tibial acceleration-based prediction of maximal vertical loading rate during overground running: a machine learning approach. Front Bioeng Biotechnol. (2020) 8:33. doi: 10.3389/fbioe.2020.00033
65. Abt JP, Sell TC, Chu Y, Lovalekar M, Burdett RG, Lephart SM. Running kinematics and shock absorption do not change after brief exhaustive running. J Strength Cond Res. (2011) 25(6):1479–85. doi: 10.1519/JSC.0b013e3181ddfcf8
66. Hoenig T, Rolvien T, Hollander K. Footstrike patterns in runners: concepts, classifications, techniques, and implicationsfor running-related injuries. Dtsch Z Sportmed. (2020) 71(3):55–61. doi: 10.5960/dzsm.2020.424
67. Maas E, De Bie J, Vanfleteren R, Hoogkamer W, Vanwanseele B. Novice runners show greater changes in kinematics with fatigue compared with competitive runners. Sports Biomech. (2018) 17(3):350–60. doi: 10.1080/14763141.2017.1347193
68. de Azevedo RA, Cruz R, Couto P, Silva-Cavalcante MD, Boari D, Lima-Silva AE, et al. Characterization of performance fatigability during a self-paced exercise. J Appl Physiol. (2019) 127(3):838–46. doi: 10.1152/japplphysiol.00090.2019
69. Prigent G, Apte S, Paraschiv-Ionescu A, Besson C, Gremeaux V, Aminian K. Concurrent evolution of biomechanical and physiological parameters with running-induced acute fatigue. Front Physiol. (2022) 13:814172. doi: 10.3389/fphys.2022.814172
70. Chan-Roper M, Hunter I, Myrer JW, Eggett DL, Seeley MK. Kinematic changes during a marathon for fast and slow runners. J Sports Sci Med. (2012) 11:77–82.24137065
71. Clermont CA, Benson LC, Osis ST, Kobsar D, Ferber R. Running patterns for male and female competitive and recreational runners based on accelerometer data. J Sports Sci. (2019) 37(2):204–11. doi: 10.1080/02640414.2018.1488518
72. Miller RH, Meardon SA, Derrick TR, Gillette JC. Continuous relative phase variability during an exhaustive run in runners with a history of iliotibial band syndrome. J Appl Biomech. (2008) 24(3):262–70. doi: 10.1123/jab.24.3.262
73. Winter SC, Gordon S, Brice SM, Lindsay D, Barrs S. A multifactorial approach to overuse running injuries: a 1-year prospective study. Sports Health. (2020) 12(3):296–303. doi: 10.1177/1941738119888504
74. Van Oeveren BT, De Ruiter CJ, Hoozemans MJM, Beek PJ, Van Dieën JH. Inter-individual differences in stride frequencies during running obtained from wearable data. J Sports Sci. (2019) 37(17):1996–2006. doi: 10.1080/02640414.2019.1614137
75. Horst F, Hoitz F, Slijepcevic D, Schons N, Beckmann H, Nigg BM, et al.. Identification of subject-specific responses to footwear during running. Sci Rep. (2023) 13(1):11284. doi: 10.1038/s41598-023-38090-0
76. Terry PC, Karageorghis CI, Saha AM, D’Auria S. Effects of synchronous music on treadmill running among elite triathletes. J Sci Med Sport. (2012) 15(1):52–7. doi: 10.1016/j.jsams.2011.06.003
77. Kühner P. How perceived mood states change during a 60-minute endurance run and how they interrelate with other physiological and biomechanical parameters. Universität Koblenz-Landau zur Verleihung (2011).
78. Benson LC, Clermont CA, Ferber R. New considerations for collecting biomechanical data using wearable sensors: the effect of different running environments. Front Bioeng Biotechnol. (2020) 8:86. doi: 10.3389/fbioe.2020.00086
79. Chau T. A review of analytical techniques for gait data. Part 2: neural network and wavelet methods. Gait Posture. (2001) 13(2):102–20. doi: 10.1016/S0966-6362(00)00095-3
81. Refaeilzadeh P, Tang L, Liu H. Cross-Validation. In: Liu L, Özsu MT, editors. Encyclopedia of database systems. New York, NY: Springer (2016). p. 1–7. Available at: https://doi.org/10.1007/978-1-4899-7993-3_565-2 (cited 2023 Oct 13).
82. Eskofier B, Kugler P, Melzer D, Kuehner P. Embedded classification of the perceived fatigue state of runners: towards a body sensor network for assessing the fatigue state during running. In: 2012 Ninth International Conference on Wearable and Implantable Body Sensor Networks. London, United Kingdom: IEEE (2012). p. 113–7. http://ieeexplore.ieee.org/document/6200548/ (cited 2022 Aug 6).
Keywords: running biomechanics, machine learning, subject-specific model, running fatigue, wearable technology
Citation: Dimmick HL, van Rassel CR, MacInnis MJ and Ferber R (2023) Use of subject-specific models to detect fatigue-related changes in running biomechanics: a random forest approach. Front. Sports Act. Living 5:1283316. doi: 10.3389/fspor.2023.1283316
Received: 25 August 2023; Accepted: 8 December 2023;
Published: 21 December 2023.
Edited by:
Josh Walker, Leeds Beckett University, United KingdomReviewed by:
Jasper Reenalda, University of Twente, NetherlandsEzio Preatoni, University of Bath, United Kingdom
© 2023 Dimmick, van Rassel, MacInnis and Ferber. This is an open-access article distributed under the terms of the Creative Commons Attribution License (CC BY). The use, distribution or reproduction in other forums is permitted, provided the original author(s) and the copyright owner(s) are credited and that the original publication in this journal is cited, in accordance with accepted academic practice. No use, distribution or reproduction is permitted which does not comply with these terms.
*Correspondence: Hannah L. Dimmick aGFubmFoLmRpbW1pY2tAdWNhbGdhcnkuY2E=