 Kristýna Dvořáková
 Ana Carolina Paludo
 Adam Wagner
 Dominik Puda1
 Marta Gimunová
 Michal Kumstát
- 1Department of Sport Performance and Exercise Testing, Faculty of Sports Studies, Masaryk University, Brno, Czechia
- 2Department of Physical Activities and Health Sciences, Faculty of Sports Studies, Masaryk University, Brno, Czechia
Introduction: The review aims to summarize the markers used in diagnosing relative energy deficiency in sport (REDs) and compare them with the REDs CAT2 score.
Methods: A systematic search was performed in the PubMed, Web of Science, and SPORTDiscus databases during April 2023. The descriptors used were “athlete” AND “REDs,” along with respective entry terms. The selection process followed the PRISMA 2020 recommendations, identifying 593 records, from which 13 studies were ultimately selected. Seventy-nine markers were identified and categorized into six groups: bone mineral density (BMD), metabolic resting rate, blood biomarkers, anthropometrics, nutritional intake, and performance parameters. The most frequently utilized biomarkers included BMD, anthropometric parameters (e.g., body mass index, body mass, and fat mass), and the triiodothyronine (T3) concentration.
Results: According to the REDs CAT2 pointed indicators, the biomarkers varied among the studies, while 7 out of the 13 included studies achieved a ≥60% agreement rate with this tool. The prevalence of low energy availability, an etiological factor in the development of REDs, was detected in 4 out of 13 studies, with an average of 39.5%.
Conclusion: In conclusion, this review highlights the most commonly used markers in diagnosing REDs, such as BMD, anthropometric parameters, and T3 hormone concentration. Due to the current inconsistencies, standardizing diagnostic methodologies is crucial for future research. By focusing on widely used markers, this review aids future research planning and result interpretation and points out the ongoing need for methodological consistency in evolving diagnostic tools.
Systematic Review Registration: https://www.crd.york.ac.uk/, PROSPERO (CRD42022320007).
Introduction
The phenomenon of energy deficiency in sports is a widespread problem among athletes and has emerged as a new syndrome called relative energy deficiency in sport (REDs). In cooperation with the International Olympic Committee (IOC), the concept of REDs and its first official definition were introduced in 2014 (1). REDs is characterized by low energy availability (LEA), causing a profound impact on physiological functions within the organism. It includes, but is not limited to, areas such as abnormalities in metabolic function, menstrual cycle, bone health, immunity, protein synthesis, and cardiovascular health (1). The first symptoms that drew attention to possible disturbances of the athlete's bodily functions were menstrual cycle abnormalities (2). Based on these observations, the female athlete triad (FAT) was created in 1992. The first version of FAT included amenorrhea, osteoporosis, and disordered eating (3). During ongoing research, the definition was updated to include (1) low energy availability with or without disordered eating, (2) low bone mineral density (BMD), and (3) menstrual dysfunction (4). Thus, research had focused primarily on female athletes up to this point. However, it became evident that low energy availability affects many more human health and performance areas. Furthermore, it also affects male athletes (1, 5). Therefore, as mentioned above, the concept of REDs was developed (1). Since 2014, studies have increasingly focused on male athletes, but the number of studies involving female athletes is still noticeably higher.
Although REDs has been widely accepted and respected among the sports science community, there are still numerous limitations in its practical application in monitoring athletes (6, 7).
The etiological factor for REDs is LEA (1, 8); therefore, the diagnosis needs to involve parameters related to LEA. The common practice is to use screening questionnaire tools, which are well applicable to the field and suited for the initial detection of at-risk athletes in large populations (9). Nonetheless, questionnaire tools should be cautiously evaluated due to the frequent design of self-reported questions. It is recommended that questionnaires be used along with objective, practical measurements to provide a more in-depth assessment (10). However, one of the biggest challenges is the unification of the diagnostic methods for REDs (11) and the different methodologies used in studies, which can lead to challenges in assessing and evaluating the research findings (10, 12). Significant progress in this area has been enabled by the latest 2023 IOC Consensus statement and the associated IOC REDs Clinical Assessment Tool-Version 2 (IOC REDs CAT2) (13, 14). This tool has undergone internal expert voting statement validation and external validation through cross-agreement among REDs experts in clinical settings, enabling the identification of a more refined set of markers suitable for diagnosing REDs (14).
Further challenges within the REDs field also involve identifying markers suitable for diagnosis, determining their cutoff values, and fostering more effective collaboration among experts. Despite the great importance of the IOC 2023 Consensus statement (13) and the IOC REDs CAT2 (14), their integration into the diagnostic process and research may require time. Therefore, it is still relevant to highlight the methodological inconsistencies present in current studies.
A comprehensive summary of the markers used to assess REDs in the existing literature is not yet available. Such a review, combined with insights from the REDs CAT2 tool, could assist in selecting a more specific set of markers to increase consistency across studies and facilitate the interpretation and comparison of results. Therefore, this review aims to bridge this gap by providing an overview of practical measurement methods, the frequency of their use in the included studies, and a comparison with the REDs CAT2 tool.
Materials and methods
A systematic review was performed under the Preferred Reporting Items for Systematic Reviews and Meta-Analyses (PRISMA) guidelines, updated in 2020 (15), to answer the research question. The review was registered at PROSPERO with number CRD42022320007.
Eligibility criteria and search strategy
Studies were eligible for inclusion if they met the following criteria: participants: athletes of both sexes, all disciplines, and advanced or elite level; outcomes: evaluation of the type, variety, number, and frequency of individual markers used in REDs diagnosis, as well as compliance with the IOC recommendation. Studies were ineligible if the outcomes of interest were not measured or the results were not described. Literature reviews, guidelines, letters to the editor, conference abstracts, dissertation thesis, and non-English language articles were also excluded. Considering that REDs was officially defined in 2014, the search was performed with a data range from March 2014 to. The search was conducted on Medline (via PubMed), Web of Science, and SPORTDiscus (via EBSCOhost) in April 2023. The search terms followed the descriptors from categories #1 and #2 related to “athlete” AND “relative energy deficiency” using the entry terms and derivative words (available in the Table 1).
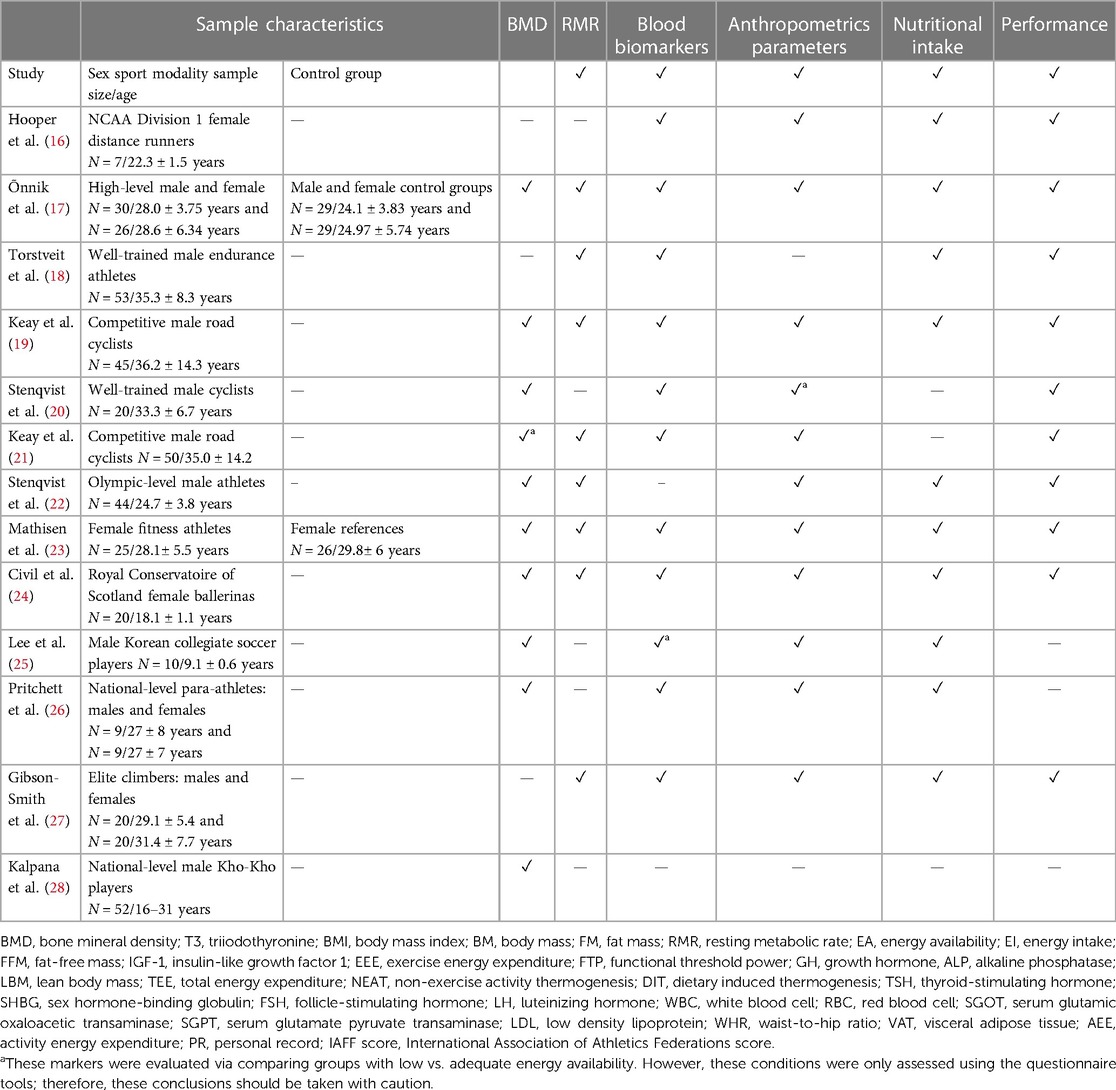
Table 1 Characteristics of the included studies and categories of used markers (n = 13 studies).
Selection process and data extraction
The articles were imported into Rayyan systematic review software to proceed with the selection process. This process was performed as follows: (1) a researcher (KD) uploaded the articles from each database and then (2) excluded the review articles, letters to the editor, duplicates, and articles in non-English languages (identified by the software); (3) two independent researchers (DP and AW) screened the articles’ titles and abstracts, and a third checked those excluded (KD); and (4) finally, two independent researchers (KD and AW) screened the full text of the articles for final inclusion. Any disagreements between reviewers were resolved by a third reviewer (AP). A prior pilot selection, with the first 25 articles, was performed to test the researchers’ understanding, demonstrating an agreement of 88% between the two reviewers (DP and AW).
Data related to the sample characteristics (e.g., sex, sport modality, age, and size), the presence of REDs, biomarkers used in REDs diagnosis [e.g., hormones, resting metabolic rate, bone mineral density, blood glucose, body mass index (BMI), and cholesterol], and any potentially relevant outcomes were extracted from included studies by two researchers (KD and AW).
Methodological quality
The assessment of methodological quality for the articles with a descriptive approach was performed using the STROBE tool (29) and for those with an intervention approach was performed by ROBINS-I (30). Three researchers participated in this phase (KD, AW, and AP). The STROBE checklist assesses the quality of cohort, case–control, and cross-sectional studies. It contains 22 items assessing risk factors for bias. Response options are a score of 0 if the articular checklist item is not fulfilled, 1 if the articular checklist item is fulfilled, and NA if the checklist item does not apply to the specific publication. Based on the sum of the total score and the percentage gain of the possible maximum, the quality of the study is then evaluated as follows: ≥85 = excellent, 70 to <85 = good, 50 to <70 = fair, and <50 = poor, as used previously. The ROBINS-I rating system is based on seven domains, each consisting of a subset of questions focusing on possible areas of systematic error. The domains include confounding, participants, classification of interventions, deviations from intended interventions, missing data, measurement of outcomes, and selection of the reported results. In this review, we used only domains 2–7 for evaluation; more details on this process are provided in the Discussion section. The response options are “Yes,” “Probably yes,” “Probably no,” “No,” and “No information.” Based on the continuous responses, each domain is then evaluated as a whole, and the rating of all the domains is reflected in the labeling of the study as “Low risk,” “Moderate risk,” “Serious risk,” and “Critical risk” of bias.
REDs CAT2 agreement
The biomarkers used in the included studies were compared with the IOC REDs CAT2 (14), an improved version derived from the original IOC REDs Clinical Assessment Tool (CAT) introduced in 2015 (31). The development of the IOC REDs CAT2 involved internal validation through expert voting statements and external validation via clinical cross-agreement assessments by experts. The assessment protocol of IOC REDs CAT2 comprises three sequential steps:
I. Initial screening using population-specific REDs questionnaires or clinical interviews, with individuals deemed at risk moving on.
II. Assessment of various REDs signs/symptoms to uniform the Severity/Risk Assessment Tool and Stratification, with guidelines for sports participation; data obtained from these steps serve as the basis.
III. Physician-led final clinical diagnosis/stratification and associated implementation of a treatment plan, ideally involving a collaboration of a multidisciplinary health team and REDs performance (14).
Based on the scoring outcomes of primary and secondary indicators, the risk is categorized into four-color traffic-light severity/risk classifications, ranging from “none” to “very low,” “mild,” “moderate to high,” to “very high/extreme.” Recommendations concerning the monitoring of athletes, participation in training and competitions, and medical interventions complement these classifications. In addition, REDs CAT2 incorporates a set of potential indicators deemed emerging (14).
In the review process, markers identified in the included studies were compared to those outlined in the REDs CAT2. Given the focus on objective measurement methods, subjective markers obtained through interviews or questionnaires were omitted from this comparison. Subsequently, reviewer KD computed agreement rates between each study and the REDs CAT2 tool for scored, potential, and overall indicators. A second independent reviewer (AW) checked this process to ensure reliability.
Results
Study characteristics and methodological quality
In total, 595 articles were found in the databases matching the combination of keywords entered. After excluding articles that were duplicates (n = 96) and for other reasons, such as those written in a foreign language (non-English) (n = 10) and with no access (n = 1), 488 articles were evaluated during the title and abstract screening. Of these articles, 155 were excluded through the review method, and 463 did not meet the eligibility criteria. For 25 articles, the full text was assessed; of these, 12 studies were excluded due to non-compatibility. Therefore, 13 studies were included in the final process (Figure 1).
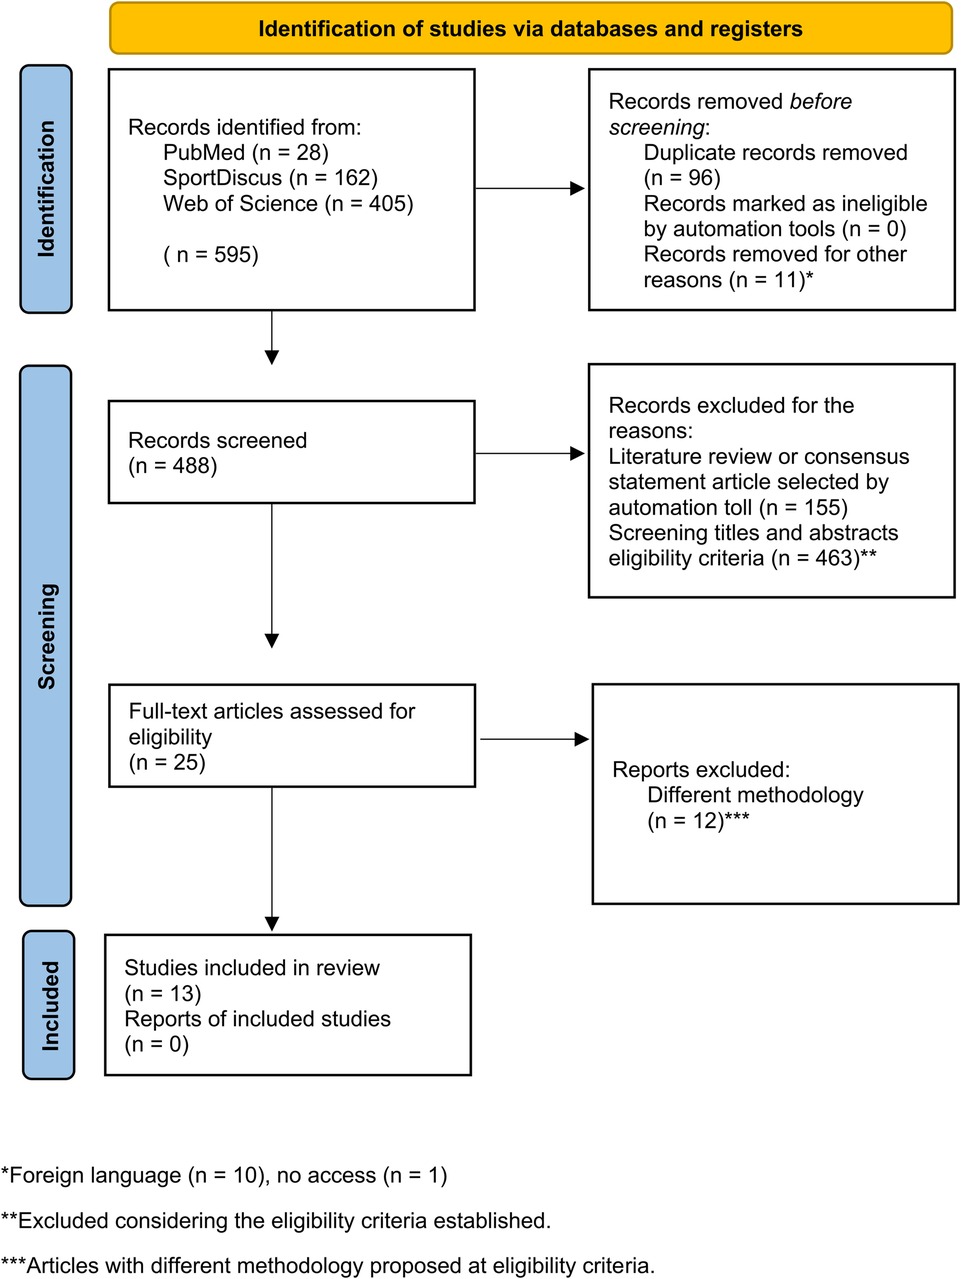
Figure 1 Flowchart diagram of the study selection process (PRISMA 2020) (15).
The main characteristics and the categories of the REDs markers used in the included studies (bone mineral density, resting metabolic rate, blood markers, anthropometric parameters, nutritional intake, and performance) are presented in Table 1. Most of these studies focus on female athletes (7 out of 13); the most investigated disciplines were endurance sports, team sports, ballet, climbing, or a mix of disciplines or para-athletics disciplines. Athletes competed at the performance levels of well-trained, competitive, elite, national, and Olympic levels. Two studies also included a control group.
Among the 13 papers, 12 presented a descriptive study design and 1 presented an intervention design. For the descriptive ones, the methodological quality, assessed by the STROBE tool, demonstrated a range from good to excellent quality. Specifically, six studies were rated as excellent (17, 18, 20, 23–25) and six were rated as good (16, 21, 22, 26–28) (see the Table 2). One paper was designed as an intervention and demonstrated a moderated risk of bias based on the ROBINS-I tool.
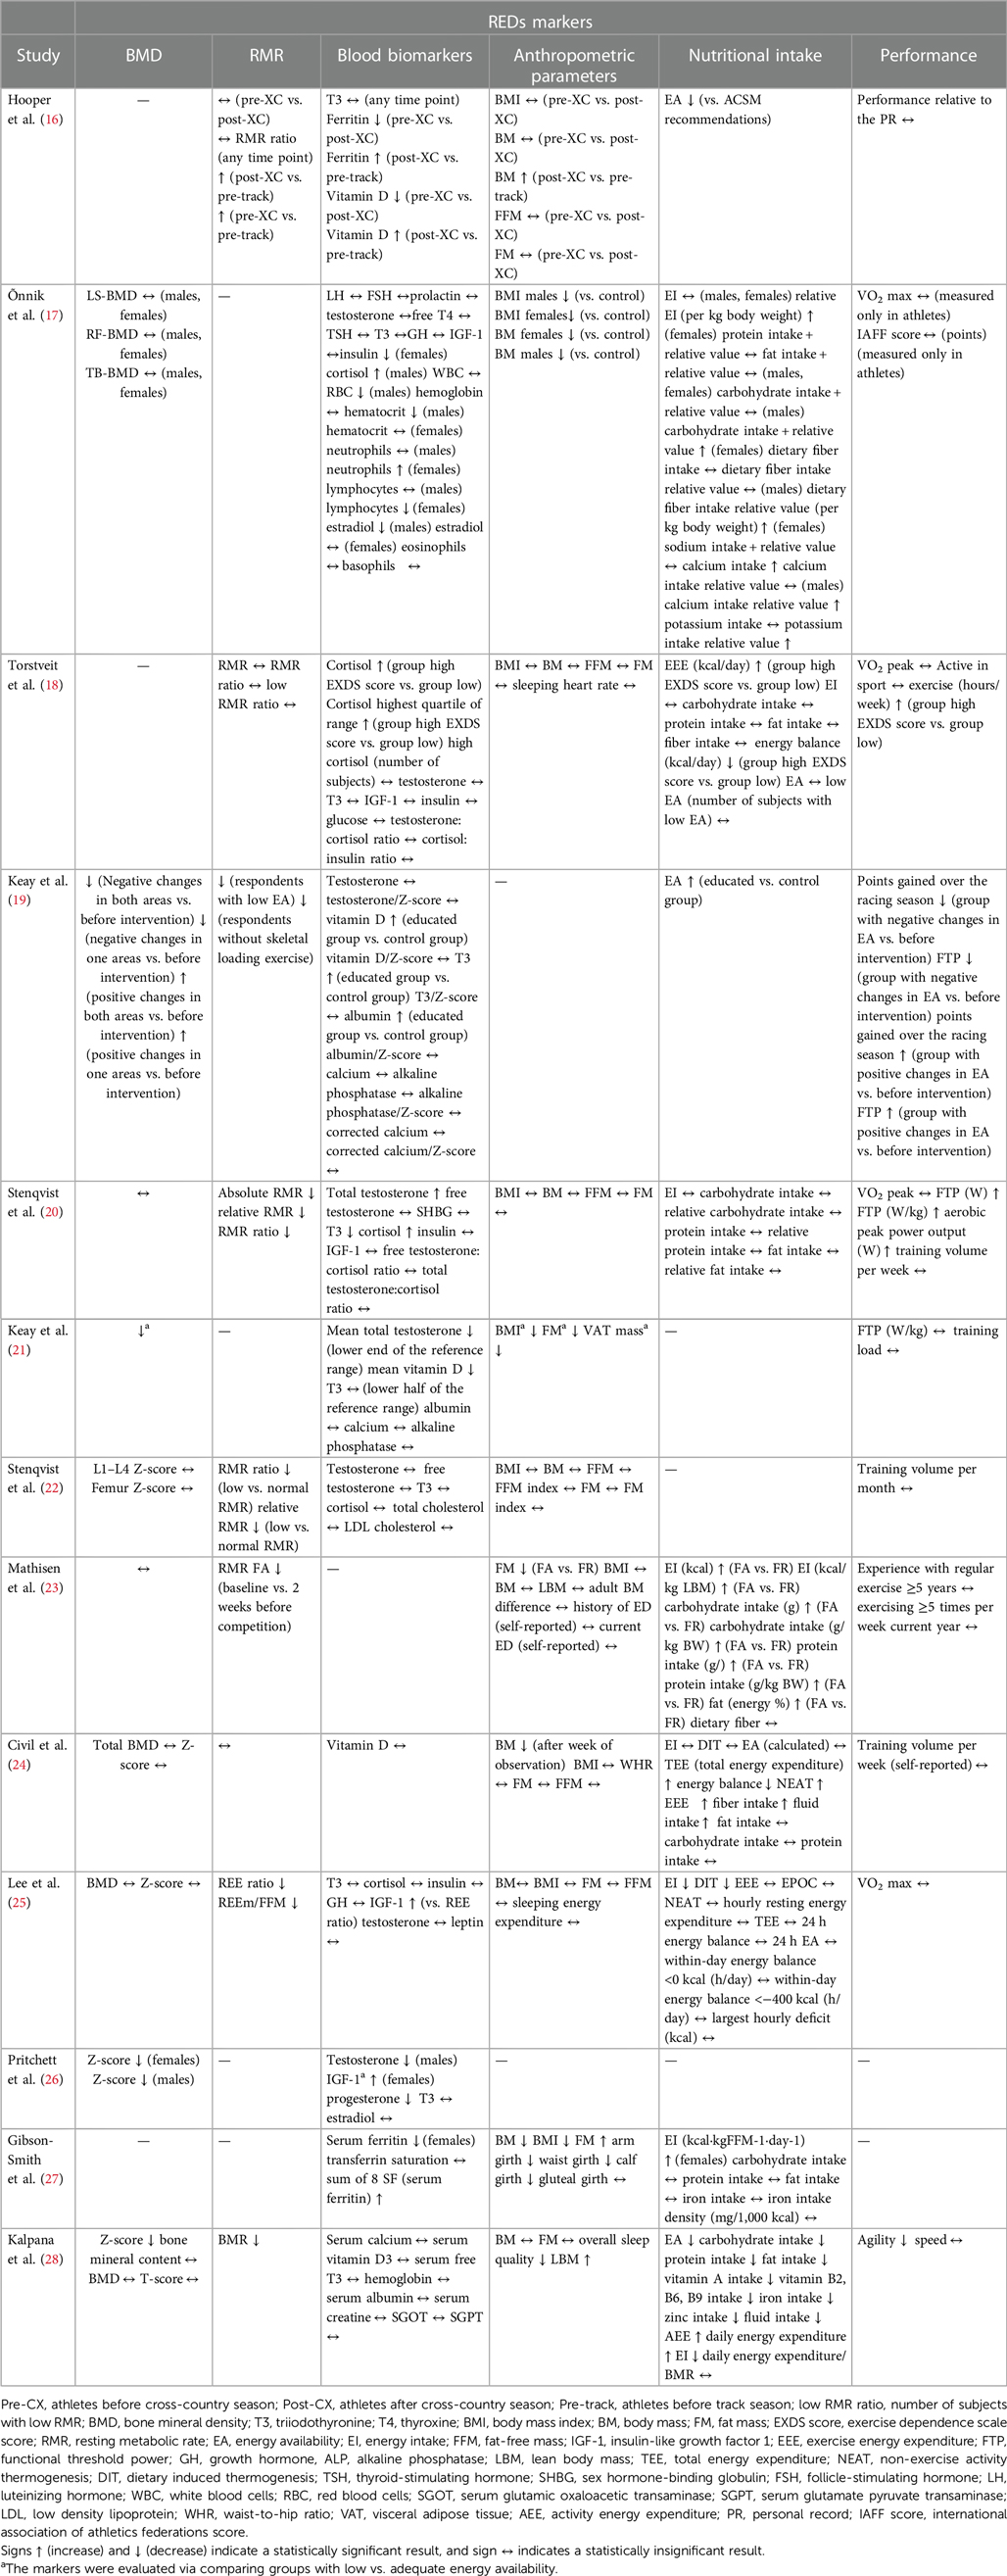
Table 2 Overview of biomarkers used in REDs diagnosis and main outcomes (n = 13).
Overview of biomarkers used in REDs diagnosis and the frequency of their use
We found 79 biomarkers used to determine the presence of REDs in the 13 included studies. Table 2 presents the complexity and diversity of the biomarkers used within the included studies. The biomarkers were categorized into five groups (bone mineral density biomarkers, resting metabolic rate biomarkers, blood biomarkers, anthropometric parameters, nutritional intake parameters, and performance parameters). All 13 studies used at least two (or more) categories of markers to determine the presence of REDs.
Table 3 presents the quantification of biomarkers used to assess REDs and complements Table 2. It shows a comprehensive overview of the frequency of their use in the included studies. The biomarkers most often used were BMD, BMI, BM (body mass), FM (fat mass), and T3 (triiodothyronine) blood concentrations, which were involved in 10 of the 13 studies (76.9%). Nine studies (69.2%) used the measurement of RMR (resting metabolic rate), while 8 studies (61.5%) used total testosterone level and EI (energy intake). Seven studies (53.9%) used nutritional parameters such as carbohydrate, protein, and fat intake EA (energy availability) was used in six studies (46.2%).
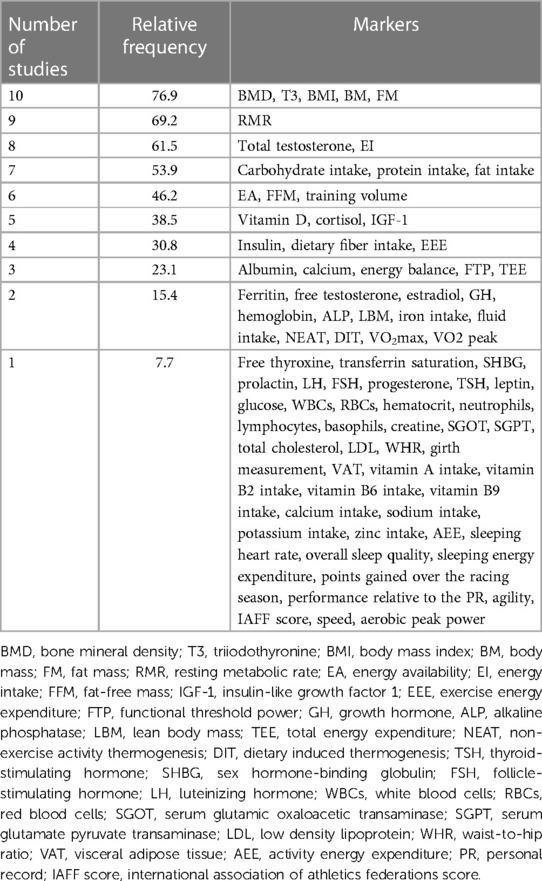
Table 3 Frequency of markers measured among the studies.
Discussion
This review systematically compiles a list of methods utilized in diagnosing REDs. Our analysis of included studies revealed that the most frequently used biomarkers in current studies are BMD, BMI, BM, FM, and blood T3 concentration, included in 10 out of 13 studies (76.9%).
While the 2023 IOC Consensus statement marked a significant milestone in selecting appropriate diagnostic markers for REDs, the authors emphasized the necessity for ongoing updates and revisions. This included refining the range of recognized sequelae associated with REDs and reassessing the markers themselves. Thus, a critical examination of the strengths and limitations of these markers, alongside evaluating their ability to reflect individuals’ health status accurately, remains imperative.
Anthropometric parameters
Anthropometric parameters, such as BMI and body composition, are widely used in medical practice. According to the Centers for Disease Control and Prevention's recommendations for general practitioners (32), BMI is a simple, inexpensive, and non-invasive method of estimating body fat and health risk, requiring no special equipment. However, several studies have pointed to the inaccuracy of BMI, particularly among patients with different ethnic backgrounds or an inability to distinguish body weight between body fat and muscle mass (33, 34). Thus, although this calculation can provide valuable information in the REDs diagnostic process, as with other markers, it cannot be evaluated in isolation (35). According to REDs CAT2, BMI is considered a potential indicator in assessing REDs risk, underscoring that the need for further research to quantify the parameters and cutoffs more accurately (14).
To accurately determine body composition, it is necessary to use valid methods that contribute to an objective assessment of the athlete’s overall condition. Body composition and adipose tissue thicknesses can be accessed via skinfold measurement. However, B-mode ultrasound is a more reliable and preferred method, which can provide good results even in lean individuals (36). Despite its costliness, the dual-energy x-ray absorptiometry (DXA) measurement is also the recommended method of choice as the gold standard for assessing body composition (37).
The authors of the IOC Consensus statement also pointed out that too much focus on anthropometric parameters and body composition can intensify the pressure placed on athletes, especially on adolescents under the age of 18 years (13, 38). It is, therefore, essential to identify valid and reliable methods and develop guidelines for interpreting, managing, and communicating with athletes (39).
Bone health
Biomarkers assessing bone health are among the most used, as shown by the results of this review. Impaired bone health has been associated with low energy availability from its onset. It was also included in the original definition of the female athlete triad (34), from which the concept of REDs was developed (1). Low energy availability affects bone health through reduced levels of hormones such as estrogen, leptin, and T3 associated with insulin-like growth factor 1 (IGF-1) secretion (40–43). In addition, inadequate intake of essential nutrients, including protein, calcium, or vitamin D, has been linked to the low energy intake associated with REDs (44, 45).
DXA is the most used method for measuring bone mineral density (46) and is also noted as a “preferred method” in the 2023 IOC Consensus statement (13). According to REDs CAT2, the authors recommend the following as a positive finding:
• Premenopausal women and men aged <50 years: BMD Z-score <−1 at the lumbar spine, total hip, or femoral neck or decreased BMD Z-score from previous testing.
• Children/adolescents: BMD Z-score <−1 at the lumbar spine or total body less head or decreased BMD Z-score from the last testing (may be due to bone loss or insufficient bone gain) (14).
Some previously published studies on energy availability have also used markers of bone turnover derived from blood samples. The research findings by Ihle and Loucks (47) suggest that changes may be apparent after 3 days of LEA. The findings of the study by Papageorgiou et al. (48) showed that 5 days of LEA below 15 kcal/day leads to changes in bone turnover markers in women, but no significant changes were found in men. A year later, Papageorgiou et al. (49) conducted another study involving a group of eumenorrheic women in whom 3-day LEA through dietary energy restriction resulted in changes in bone formation but not bone resorption. However, these bone turnover markers are not established due to the number of factors that may influence them. The time taken for the manifestation of changes might also be significantly influenced by variables such as the severity of LEA.
Moreover, markers reporting bone mineral density status should continually be assessed in the context of supplementary information, considering the specificity of each sport discipline. For example, the bone density of weightlifters generally reaches higher values than the reference range (50), and average values may indicate reduced BMD in these athletes.
Resting metabolic rate
RMR was assessed in nine of the 13 included studies, accounting for 69.2% (see Table 3). RMR represents the energy necessary to maintain homeostasis while at rest. Unlike basal metabolic rate, which necessitates strict conditions such as a 12-h fasting period and a thermoneutral environment, RMR can be measured throughout the day (51). The suppressed RMR associated with LEA may be explained by adaptive responses aimed at conserving energy (52).
Various methodologies are employed in studies to determine RMR. Indirect calorimetry is often called the gold standard but requires specialized equipment (53). Consequently, researchers usually resort to estimating RMR using predictive equations, such as those proposed by Cunningham (54), Harris and Benedict (55), or Owen et al. (56). Another approach is the RMR ratio, defined as the ratio between measured RMR and predicted RMR. Some studies suggest that the RMR ratio serves as a valid indicator of LEA (57, 58). However, it is advisable to evaluate RMR in conjunction with other markers due to variations in the degree of metabolic suppression among athletes. These variations are influenced by factors such as the severity of LEA (58).
The 2023 IOC Consensus statement recognizes RMR testing as a “used and recommended” method for identifying impaired energy metabolism. Specifically, the endorsed procedures include indirect or room calorimetry measurements (13). In addition, REDs CAT2 identifies RMR as a potential indicator, with a reduced or low RMR [<30 kcal/kg fat-free mass (FFM)/day] or an RMR ratio (<0.90) considered indicative of the condition (14). However, Sterringer and Larson-Meyer (59) pointed out that a threshold of 0.9 may not be appropriate for all cases. In particular, for studies using the Cunningham equation from 1991 (60) or DEXA measurement, a threshold of 0.9 may lead to an underestimation of the prevalence of LEA.
Blood biomarkers—hormone concentration
One of the most used markers in the included studies (76.9%) was T3. It is one of the hormonal agents released by the thyroid gland and is indispensable in energy metabolism and growth (61). T3 is also involved in the reproductive process (62) and bone tissue metabolism through the local production of IGF-1 (63). Although its concentration is strongly associated with metabolic functions, this marker still needs to be evaluated in the context of other methods. This is because its concentration may be affected by many conditions, such as circadian rhythms, thyroid disease, alterations in serum binding proteins, or other associated medical conditions (64, 65). Clinically or subclinically low total or free T3 is also considered one of the primary REDs indicators listed in REDs CAT2 (14), and clinically or subclinically low IGF-1 is included in the list of potential indicators.
Testosterone concentration is also a frequently used marker in the studies (61, 5%). Subclinically low total or free testosterone is listed in REDs CAT2 primary indicators; clinically low total or free testosterone is considered a severe primary indicator (counted as two primary indicators) (14). While disturbances in the menstrual cycle may affect the hypothalamic–pituitary–gonadal axis in women, this condition may not be detected as early in male athletes. Thus, for male athletes, in addition to testosterone levels, it is often necessary to consider self-reported data, such as the presence of low libido or decreased frequency of morning erections, in the diagnosis of REDs. Thus, as already mentioned, a combination of diagnostic methods is required. In women, low energy availability disrupts luteinizing hormone (LH) pulsatility, which further affects the hypothalamic–pituitary–gonadal axis, including levels of follicle-stimulating hormone (FSH), estrogens, and progesterone (66, 67). Two studies tested estradiol levels (17, 26), while one study tested levels of LH, FSH (17), and progesterone (26). However, the REDs CAT2 tool does not directly use these hormones as female reproductive cycle function indicators. Instead, it uses self-reported data on the presence of primary amenorrhea, secondary amenorrhea, or oligomenorrhea (14). LEA also affects other endocrine pathways such as cortisol, leptin, growth hormone, IGF-1 axis, sympathetic and parasympathetic tone, or thyroid hormones (66).
Calculation of energy availability
The calculation of energy availability has been used in 46.2% of the included studies (6 out of 13). Given that low energy availability is a direct etiological factor in developing REDs (1), its inclusion in diagnostic methods appears logical. The variables required for the calculation of energy availability can also be obtained in a non-invasive and non-burdensome way. The prevalence of low energy availability was detected in four of the thirteen included studies: 67% (16), 23% (18), 22% (24), and 46% (28). In another study, a prevalence of 28% was assessed through the SEAQ-I questionnaire (21). In conclusion, the mean observed prevalence of LEA across the studies is 39.5%.
However, previous studies have indicated that calculating energy availability carries a high risk of error (9). Sources of this inaccuracy can include energy intake, while data obtained through nutritional recall may underestimate actual intake by 10%–20% (68, 69), and even cases of an underestimation of 50% are not uncommon (70). The measurement of energy expenditure also needs to be evaluated cautiously. Various methods of assessing energy expenditure are used across studies, such as doubly labeled water technique, direct calorimetry, indirect calorimetry, accelerometry, heart rate monitoring, or pedometry (71). Nevertheless, using more accurate methods is often complicated by the high cost of these devices in research settings. Therefore, epidemiological studies frequently rely on self-reported methods, which can lead to significant inaccuracies in the observed outcomes (72). Thus, calculating energy availability may serve as a valuable complementary method for diagnosing REDs and could also be beneficial in determining the optimal therapeutic approach (73). However, like other markers, it should not be evaluated in isolation.
Reference markers according to IOC REDs CAT2
Although there is still no uniform and standardized methodological approach for the diagnosis of REDs, the new IOC Consensus statement of 2023 provides a comprehensive overview of:
(I) Preferred methods;
(II) Used and recommended methods; and
(III) Potential methods applicable for these purposes (13).
The IOC REDs CAT2 is closely aligned with this document and summarizes the LEA indicators, including symptoms and signs, that have emerged as current best practices for clinical assessment and research. Based on the evaluation of these indicators, an athlete may be included in one of the four-color traffic-light severity/risk categories. Each category is also associated with recommendations for athletic participation, athlete monitoring, medical intervention, or even full medical support, which may require the athlete’s temporary exclusion from training and competition (14).
The authors of the REDs CAT2 emphasize that this advanced tool should not be used in isolation but in combination with clinical consideration and other tools, such as screening questionnaires. In addition, they warn that the tool's reliability decreases if all the included indicators cannot be assessed and that REDs CAT2 is not a substitute for professional clinical diagnosis, advice, and/or treatment (13). Nevertheless, REDs CAT2 represents a scientifically supported system for evaluating LEA indicators and was selected as a reference tool to assess the quality of the markers used in the included studies.
As this review primarily focuses on objective methods of practical measurement, some subjective indicators obtained through interviews or questionnaires were excluded from this comparison. However, as previously mentioned, objective and subjective methods cannot be entirely separated, and combining them is desirable. After excluding methods that are not objectively measurable, 15 markers were identified in the reference tool. Five of these markers are scored as primary or secondary indicators; 10 potential markers are not scored but are considered emerging. An overview of the included and excluded indicators and the results of the agreement can be found in Table 4. The highest agreement with the CAT2 REDs was achieved in the study of Stenqvist et al. (22) using 80% of the scored indicators. Six studies used 60% (19–21, 25, 26, 74), two used 40% (18, 28), three used 20% (16, 23, 24) of the scored indicators, while one study did not include any of these scored markers but only the potential ones (27).
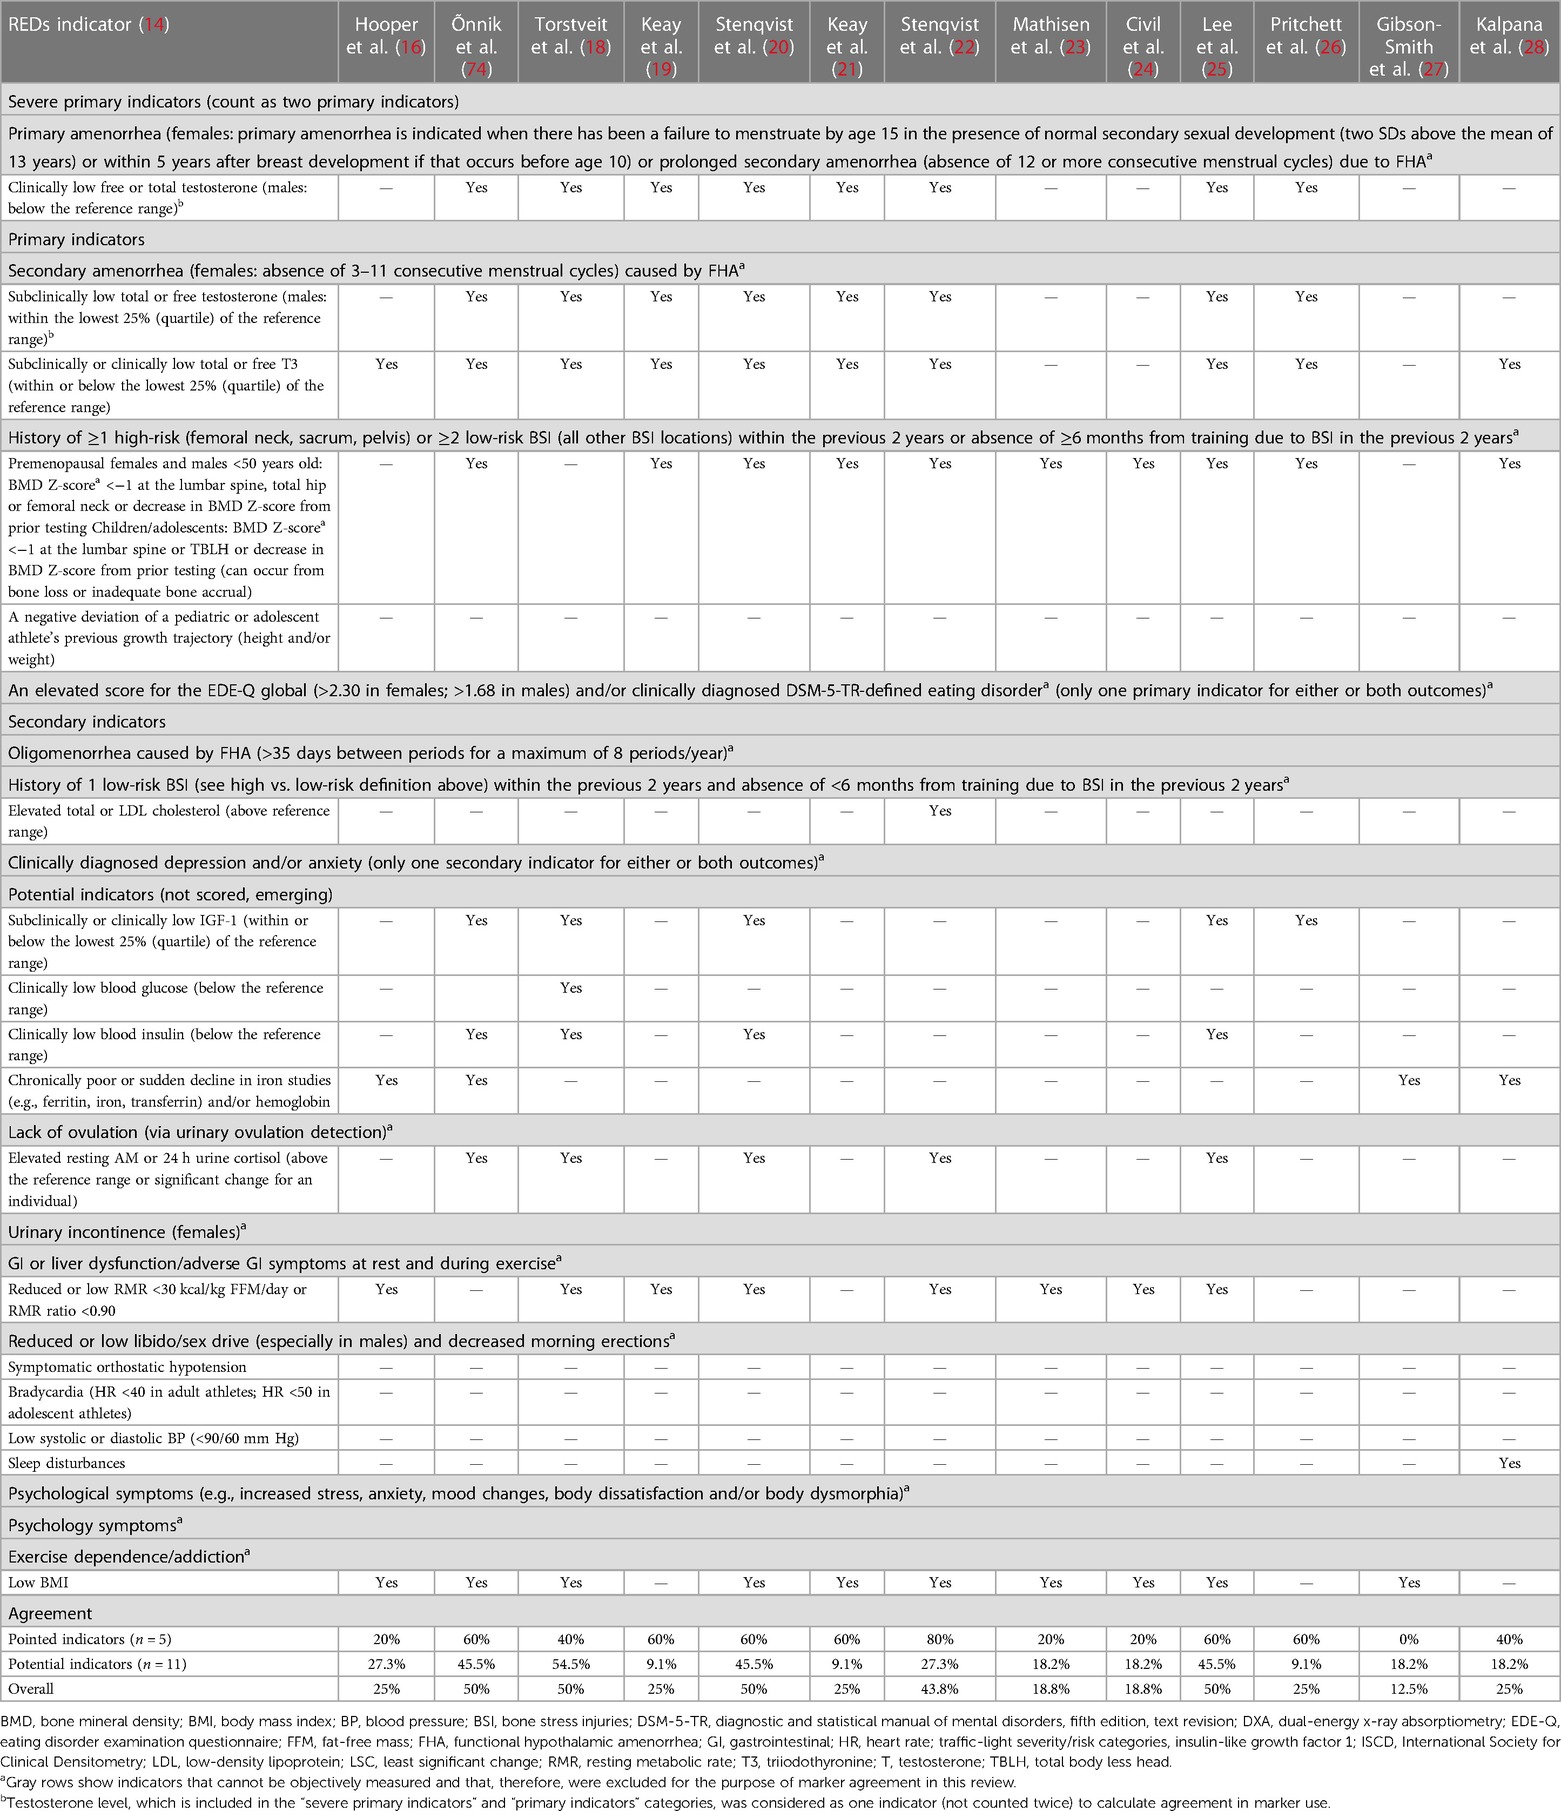
Table 4 Agreement of used markers according to IOC REDs CAT2 (n = 13 studies).
Limitations
The main limitation, not only of this review but to the entire field of REDs, is that no single marker or group of markers can reliably indicate the presence of REDs in athletes at this time. Therefore, we can only determine athletes’ risk levels as “low/moderate/high” rather than diagnosing the presence or absence of REDs. REDs cannot be diagnosed based on a single variable. Instead, several factors must be considered. Thus, this review can only provide an overview of the markers used in REDs diagnosis in current studies and highlight their frequency of use. The most commonly used markers were also analyzed with respect to the REDs CAT2 tool. Another potential source of error is the assessment of study quality and the risk of bias. Although three researchers performed these tasks independently, evaluating individual questions and the overall evaluation of the included categories might be influenced by subjective perceptions or interpretations of the questions related to the REDs topic.
Future directions
The process of diagnosing REDs is currently fragmented, with studies employing various methods and a broad range of markers in their methodologies, as evidenced by the findings of this review. In addition, determining the presence or absence of REDs is challenging. In response, it is crucial to identify reliable markers suitable for diagnosing REDs, establish diagnostic cutoffs, and develop guidelines for their evaluation (13). It is essential to approach this condition holistically, considering factors that may influence the final diagnosis, such as the age of the athletes, their overall nutritional status, or the type and intensity of their training schedule. Furthermore, the importance of interdisciplinary and multidisciplinary collaboration in diagnosing, treating, and preventing this syndrome cannot be overstated, as it is necessary to improve the future approach to REDs. The fragmentation of complex conditions like REDs can lead to erroneous conclusions and flawed therapeutic strategies (75). The prevention of REDs should not rely solely on the sports physician. Coaches, physiotherapists, nutritional therapists, psychiatrists, the athletes themselves and, when appropriate, their parents should all be involved in every part of this process–primary, secondary, and tertiary REDs prevention (73, 76).
Conclusion
This review is among the first articles to summarize the type and frequencies of markers used in REDs diagnosis in current studies. A focus on unifying the methodology for diagnosing REDs is essential for future research, as the variety of markers and inconsistent methodologies may complicate the interpretation of results. This review identified that the most commonly used markers were BMD, anthropometrical parameters (e.g., BMI, BM, and FM), and T3 hormone concentration (76.9% of the included studies). RMR (69.2% of the included studies), testosterone concentration, and energy intake calculation (61.5% of the included studies) also had a high frequency of use. According to the REDs CAT2 (14), the highest agreement was achieved in the study by Stenqvist et al. (22) using 80% of the scored indicators. Six studies used 60% (19–21, 25, 26, 74), two used 40% (18, 28), three used 20% (16, 23, 24) of the scored indicators, while one study did not include any of these scored markers, only the potential ones (27).
The calculation of energy availability, a direct etiological factor for developing REDs, was used in 46.2% of the included studies. Despite its simplicity and broad applicability, this marker has the disadvantage of a potentially significant risk of error in calculating energy intake and expenditure during physical activity. Thus, it should be evaluated in combination with other methods.
This summary of the markers used in REDs diagnosis may help future researchers focus on the most widely used markers when planning research and facilitate interpreting research results. Incorporating new tools into research and medical care will likely take some time. Therefore, it remains relevant to highlight the inconsistency of methods used in current studies.
Data availability statement
The original contributions presented in the study are included in the article/Supplementary Material, further inquiries can be directed to the corresponding author.
Author contributions
KD: Conceptualization, Data curation, Writing – original draft, Formal Analysis, Investigation, Methodology, Project administration, Visualization, Writing – review & editing. AP: Conceptualization, Supervision, Writing – review & editing, Visualization. AW: Data curation, Writing – review & editing, Formal Analysis. DP: Data curation, Writing – review & editing. MG: Supervision, Writing – review & editing, Conceptualization. MK: Supervision, Writing – review & editing, Conceptualization, Visualization.
Funding
The author(s) declare financial support was received for the research, authorship, and/or publication of this article.
The work was supported by the grant project with registration number MUNI/A/1470/2023 at Masaryk University Brno, Faculty of Sports Studies.
Conflict of interest
The authors declare that the research was conducted in the absence of any commercial or financial relationships that could be construed as a potential conflict of interest.
Publisher's note
All claims expressed in this article are solely those of the authors and do not necessarily represent those of their affiliated organizations, or those of the publisher, the editors and the reviewers. Any product that may be evaluated in this article, or claim that may be made by its manufacturer, is not guaranteed or endorsed by the publisher.
References
1. Mountjoy M, Sundgot-Borgen J, Burke L, Carter S, Constantini N, Lebrun C, et al. The IOC consensus statement: beyond the female athlete triad–relative energy deficiency in sport (RED-S). Br J Sports Med. (2014 Apr) 48(7):491–7. doi: 10.1136/bjsports-2014-093502
2. Malina RM, Spirduso WW, Tate C, Baylor AM. Age at menarche and selected menstrual characteristics in athletes at different competitive levels and in different sports. Med Sci Sports. (1978) 10(3):218–22.723515
3. Yeager KK, Agostini R, Nattiv A, Drinkwater B. The female athlete triad: disordered eating, amenorrhea, osteoporosis. Med Sci Sports Exerc. (1993) 25(7):775–7. doi: 10.1249/00005768-199307000-00003
4. Souza MJD, Nattiv A, Joy E, Misra M, Williams NI, Mallinson RJ, et al. 2014 female athlete triad coalition consensus statement on treatment and return to play of the female athlete triad: 1st international conference held in San Francisco, California, May 2012 and 2nd international conference held in Indianapolis, Indiana, May 2013. Br J Sports Med. (2014) 48(4):289. doi: 10.1136/bjsports-2013-093218
5. Sundgot-Borgen J, Meyer NL, Lohman TG, Ackland TR, Maughan RJ, Stewart AD, et al. How to minimise the health risks to athletes who compete in weight-sensitive sports review and position statement on behalf of the ad hoc research working group on body composition, health and performance, under the auspices of the IOC Medical Commission. Br J Sports Med. (2013) 47(16):1012–22. doi: 10.1136/bjsports-2013-092966
6. Hamer J, Desbrow B, Irwin C. Are coaches of female athletes informed of relative energy deficiency in sport? A Scoping Review. Women Sport Phys Act J. (2021) 29(1):38–46. doi: 10.1123/wspaj.2020-0062
7. Lodge MT, Ackerman KE, Garay J. Knowledge of the female athlete triad and relative energy deficiency in sport among female cross-country athletes and support staff. J Athl Train. (2022) 57(4):385–92. doi: 10.4085/1062-6050-0175.21
8. Loucks A. Energy availability, not body fatness, regulates reproductive function in women. Exerc Sport Sci Rev. (2003) 31:144–8. doi: 10.1097/00003677-200307000-00008
9. Heikura IA, Uusitalo ALT, Stellingwerff T, Bergland D, Mero AA, Burke LM. Low energy availability is difficult to assess but outcomes have large impact on bone injury rates in elite distance athletes. Int J Sport Nutr Exerc Metab. (2018) 28(4):403–11. doi: 10.1123/ijsnem.2017-0313
10. Sim A, Burns SF. Review: questionnaires as measures for low energy availability (LEA) and relative energy deficiency in sport (RED-S) in athletes. J Eat Disord. (2021) 9(1):41. doi: 10.1186/s40337-021-00396-7
11. Gould RJ, Ridout AJ, Newton JL. Relative energy deficiency in sport (RED-S) in adolescents—a practical review. Int J Sports Med. (2023) 44(4):236–46. doi: 10.1055/a-1947-3174
12. Areta JL, Taylor HL, Koehler K. Low energy availability: history, definition and evidence of its endocrine, metabolic and physiological effects in prospective studies in females and males. Eur J Appl Physiol. (2021) 121(1):1–21. doi: 10.1007/s00421-020-04516-0
13. Mountjoy M, Ackerman KE, Bailey DM, Burke LM, Constantini N, Hackney AC, et al. 2023 International Olympic Committee’s (IOC) consensus statement on relative energy deficiency in sport (REDs). Br J Sports Med. (2023) 57(17):1073–98. doi: 10.1136/bjsports-2023-106994
14. Stellingwerff T, Mountjoy M, McCluskey WT, Ackerman KE, Verhagen E, Heikura IA. Review of the scientific rationale, development and validation of the International Olympic Committee relative energy deficiency in sport clinical assessment tool: v.2 (IOC REDs CAT2)—by a subgroup of the IOC consensus on REDs. Br J Sports Med. (2023) 57(17):1109–21. doi: 10.1136/bjsports-2023-106914
15. Page MJ, McKenzie JE, Bossuyt PM, Boutron I, Hoffmann TC, Mulrow CD, et al. The PRISMA 2020 statement: an updated guideline for reporting systematic reviews. Br Med J. (2021) 372:n71. doi: 10.1136/bmj.n71
16. Hooper DR, Mallard J, Wight JT, Conway KL, Pujalte GGA, Pontius KM, et al. Performance and health decrements associated with relative energy deficiency in sport for division I women athletes during a collegiate cross-country season: a case series. Front Endocrinol. (2021) 12:524762. doi: 10.3389/fendo.2021.524762
17. Õnnik L, Mooses M, Suvi S, Haile DW, Ojiambo R, Lane AR, et al. Prevalence of triad–RED–S symptoms in high-level Kenyan male and female distance runners and corresponding control groups. Eur J Appl Physiol. (2022) 122(1):199–208. doi: 10.1007/s00421-021-04827-w
18. Torstveit MK, Fahrenholtz IL, Lichtenstein MB, Stenqvist TB, Melin AK. Exercise dependence, eating disorder symptoms and biomarkers of relative energy deficiency in sports (RED-S) among male endurance athletes. BMJ Open Sport Exerc Med. (2019) 5(1):e000439. doi: 10.1136/bmjsem-2018-000439
19. Keay N, Francis G, Entwistle I, Hind K. Clinical evaluation of education relating to nutrition and skeletal loading in competitive male road cyclists at risk of relative energy deficiency in sports (RED-S): 6-month randomised controlled trial. BMJ Open Sport Exerc Med. (2019) 5(1):e000523. doi: 10.1136/bmjsem-2019-000523
20. Stenqvist TB, Torstveit MK, Faber J, Melin AK. Impact of a 4-week intensified endurance training intervention on markers of relative energy deficiency in sport (RED-S) and performance among well-trained male cyclists. Front Endocrinol. (2020) 11:512365. doi: 10.3389/fendo.2020.512365
21. Keay N, Francis G, Hind K. Low energy availability assessed by a sport-specific questionnaire and clinical interview indicative of bone health, endocrine profile and cycling performance in competitive male cyclists. BMJ Open Sport Exerc Med. (2018) 4(1):e000424. doi: 10.1136/bmjsem-2018-000424
22. Stenqvist TB, Melin AK, Garthe I, Slater G, Paulsen G, Iraki J, et al. Prevalence of surrogate markers of relative energy deficiency in male Norwegian Olympic-level athletes. Int J Sport Nutr Exerc Metab. (2021) 31(6):497–506. doi: 10.1123/ijsnem.2020-0368
23. Mathisen TF, Heia J, Raustøl M, Sandeggen M, Fjellestad I, Sundgot-Borgen J. Physical health and symptoms of relative energy deficiency in female fitness athletes. Scand J Med Sci Sports. (2020) 30(1):135–47. doi: 10.1111/sms.13568
24. Civil R, Lamb A, Loosmore D, Ross L, Livingstone K, Strachan F, et al. Assessment of dietary intake, energy status, and factors associated with RED-S in vocational female ballet students. Front Nutr. (2018) 5:136. doi: 10.3389/fnut.2018.00136
25. Lee S, Moto K, Han S, Oh T, Taguchi M. Within-day energy balance and metabolic suppression in male collegiate soccer players. Nutrients. (2021) 13(8):2644. doi: 10.3390/nu13082644
26. Pritchett K, DiFolco A, Glasgow S, Pritchett R, Williams K, Stellingwerff T, et al. Risk of low energy availability in national and international level paralympic athletes: an exploratory investigation. Nutrients. (2021) 13(3):979. doi: 10.3390/nu13030979
27. Gibson-Smith E, Storey R, Ranchordas M. Dietary intake, body composition and iron status in experienced and elite climbers. Front Nutr. (2020) 7:122. doi: 10.3389/fnut.2020.00122
28. Kalpana K, Cherian KS, Khanna GL. Energy availability and RED-S risk assessment among Kho-Kho players in India. Sport Sci Health. (2022) 19:1–8. doi: 10.1007/s11332-022-00996-z
29. Limaye D, Shankar RP, Limaye V, Sydymanov A, Otzipka C, Ziesenis P, et al. Development of a quantitative scoring method for STROBE checklist. Acta Pol Pharm Drug Res. (2018) 75(5):1095–106. doi: 10.32383/appdr/84804
30. Sterne JA, Hernán MA, Reeves BC, Savović J, Berkman ND, Viswanathan M, et al. ROBINS-I: a tool for assessing risk of bias in non-randomised studies of interventions. Br Med J. (2016) 355. doi: 10.1136/bmj.i4919
31. Mountjoy M, Sundgot-Borgen J, Burke L, Carter S, Constantini N, Lebrun C, et al. The IOC relative energy deficiency in sport clinical assessment tool (RED-S CAT). Br J Sports Med. (2015) 49(21):1354–1354. doi: 10.1136/bjsports-2015-094873
32. Centers for Disease Control and Prevention. Body Mass Index: Considerations for Practitioners (2011). Available online at: https://www.cdc.gov/obesity/downloads/bmiforpactitioners.pdf.
33. Humphreys S. The unethical use of BMI in contemporary general practice. Br J Gen Pract. (2010) 60(578):696–7. doi: 10.3399/bjgp10X515548
34. Jeong SM, Lee DH, Rezende LFM, Giovannucci EL. Different correlation of body mass index with body fatness and obesity-related biomarker according to age, sex and race-ethnicity. Sci Rep. (2023) 13:3472. doi: 10.1038/s41598-023-30527-w
35. Mountjoy M, Sundgot-Borgen JK, Burke LM, Ackerman KE, Blauwet C, Constantini N, et al. IOC consensus statement on relative energy deficiency in sport (RED-S): 2018 update. Br J Sports Med. (2018) 52(11):687–97. doi: 10.1136/bjsports-2018-099193
36. Müller W, Fürhapter-Rieger A, Ahammer H, Lohman TG, Meyer NL, Sardinha LB, et al. Relative body weight and standardised brightness-mode ultrasound measurement of subcutaneous fat in athletes: an international multicentre reliability study, under the auspices of the IOC medical commission. Sports Med Auckl NZ. (2020) 50(3):597–614. doi: 10.1007/s40279-019-01192-9
37. Ackland TR, Lohman TG, Sundgot-Borgen J, Maughan RJ, Meyer NL, Stewart AD, et al. Current status of body composition assessment in sport: review and position statement on behalf of the ad hoc research working group on body composition health and performance, under the auspices of the I.O.C. Medical Commission. Sports Med Auckl NZ. (2012) 42(3):227–49. doi: 10.2165/11597140-000000000-00000
38. Mathisen TF, Ackland T, Burke LM, Constantini N, Haudum J, Macnaughton LS, et al. Best practice recommendations for body composition considerations in sport to reduce health and performance risks: a critical review, original survey and expert opinion by a subgroup of the IOC consensus on relative energy deficiency in sport (REDs). Br J Sports Med. (2023) 57(17):1148–58. doi: 10.1136/bjsports-2023-106812
39. Ackerman KE, Stellingwerff T, Elliott-Sale KJ, Baltzell A, Cain M, Goucher K, et al. #REDS (relative energy deficiency in sport): time for a revolution in sports culture and systems to improve athlete health and performance. Br J Sports Med. (2020) 54(7):369–70. doi: 10.1136/bjsports-2019-101926
40. Ackerman KE, Misra M. Neuroendocrine abnormalities in female athletes. In: Gordon CM, LeBoff MS, editors. The Female Athlete Triad: A Clinical Guide. Boston, MA: Springer (2015). p. 85–109. doi: 10.1007/978-1-4899-7525-6_6
41. De Souza MJ, Williams NI. Physiological aspects and clinical sequelae of energy deficiency and hypoestrogenism in exercising women. Hum Reprod Update. (2004) 10(5):433–48. doi: 10.1093/humupd/dmh033
42. Misra M, Miller KK, Almazan C, Ramaswamy K, Lapcharoensap W, Worley M, et al. Alterations in cortisol secretory dynamics in adolescent girls with anorexia nervosa and effects on bone metabolism. J Clin Endocrinol Metab. (2004) 89(10):4972–80. doi: 10.1210/jc.2004-0723
43. Pralong FP, Roduit R, Waeber G, Castillo E, Mosimann F, Thorens B, et al. Leptin inhibits directly glucocorticoid secretion by normal human and rat adrenal gland. Endocrinology. (1998) 139(10):4264–8. doi: 10.1210/endo.139.10.6254
44. Grinspoon SK, Baum HB, Kim V, Coggins C, Klibanski A. Decreased bone formation and increased mineral dissolution during acute fasting in young women. J Clin Endocrinol Metab. (1995) 80(12):3628–33. doi: 10.1210/jcem.80.12.8530611
45. Shapses SA, Heymsfield SB, Ricci TA. “Voluntary weight reduction increases bone turnover and loss.” In: Burckhardt P, Dawson-Hughes B, Heaney RP, editors. Nutritional Aspects of Osteoporosis: A Serono Symposia SA Publication. New York, NY: Springer (1998). p. 180–4. Proceedings in the Serono Symposia USA Series. doi: 10.1007/978-1-4612-2228-6_19
46. Morgan SL, Prater GL. Quality in dual-energy x-ray absorptiometry scans. Bone. (2017) 104:13–28. doi: 10.1016/j.bone.2017.01.033
47. Ihle R, Loucks AB. Dose-response relationships between energy availability and bone turnover in young exercising women. J Bone Miner Res. (2004) 19(8):1231–40. doi: 10.1359/JBMR.040410
48. Papageorgiou M, Elliott-Sale KJ, Parsons A, Tang JCY, Greeves JP, Fraser WD, et al. Effects of reduced energy availability on bone metabolism in women and men. Bone. (2017) 105:191–9. doi: 10.1016/j.bone.2017.08.019
49. Papageorgiou M, Dolan E, Elliott-Sale KJ, Sale C. Reduced energy availability: implications for bone health in physically active populations. Eur J Nutr. (2018) 57(3):847–59. doi: 10.1007/s00394-017-1498-8
50. Karlsson MK, Johnell O, Obrant KJ. Bone mineral density in weight lifters. Calcif Tissue Int. (1993) 52(3):212–5. doi: 10.1007/BF00298721
51. Fullmer S, Benson-Davies S, Earthman CP, Frankenfield DC, Gradwell E, Lee PSP, et al. Evidence analysis library review of best practices for performing indirect calorimetry in healthy and non-critically ill individuals. J Acad Nutr Diet. (2015) 115(9):1417–446.e2. doi: 10.1016/j.jand.2015.04.003
52. De Souza MJ, Koltun KJ, Williams NI. The role of energy availability in reproductive function in the female athlete triad and extension of its effects to men: an initial working model of a similar syndrome in male athletes. Sports Med. (2019) 49(2):125–37. doi: 10.1007/s40279-019-01217-3
53. O’Neill JER, Corish CA, Horner K. Accuracy of resting metabolic rate prediction equations in athletes: a systematic review with meta-analysis. Sports Med. (2023) 53(12):2373–98. doi: 10.1007/s40279-023-01896-z
54. Cunningham JJ. A reanalysis of the factors influencing basal metabolic rate in normal adults. Am J Clin Nutr. (1980) 33(11):2372–4. doi: 10.1093/ajcn/33.11.2372
55. Harris JA, Benedict FG. A biometric study of human basal metabolism. Proc Natl Acad Sci U S A. (1918) 4(12):370–3. doi: 10.1073/pnas.4.12.370
56. Owen O, Kavle E, Owen R, Polansky M, Caprio S, Mozzoli M, et al. A reappraisal of caloric requirements in healthy women. Am J Clin Nutr. (1986) 44(1):1–19. doi: 10.1093/ajcn/44.1.1
57. De Souza MJ, Hontscharuk R, Olmsted M, Kerr G, Williams NI. Drive for thinness score is a proxy indicator of energy deficiency in exercising women. Appetite. (2007) 48(3):359–67. doi: 10.1016/j.appet.2006.10.009
58. Staal S, Sjödin A, Fahrenholtz I, Bonnesen K, Melin AK. Low RMR ratio as a surrogate marker for energy deficiency, the choice of predictive equation vital for correctly identifying male and female ballet dancers at risk. Int J Sport Nutr Exerc Metab. (2018) 28(4):412–8. doi: 10.1123/ijsnem.2017-0327
59. Sterringer T, Larson-Meyer DE. RMR ratio as a surrogate marker for low energy availability. Curr Nutr Rep. (2022) 11(2):263–72. doi: 10.1007/s13668-021-00385-x
60. Cunningham JJ. Body composition as a determinant of energy expenditure: a synthetic review and a proposed general prediction equation. Am J Clin Nutr. (1991) 54(6):963–9. doi: 10.1093/ajcn/54.6.963
61. Martin B, Golden E, Carlson OD, Egan JM, Mattson MP, Maudsley S. Caloric restriction: impact upon pituitary function and reproduction. Ageing Res Rev. (2008) 7(3):209–24. doi: 10.1016/j.arr.2008.01.002
62. Elliott-Sale KJ, Tenforde AS, Parziale AL, Holtzman B, Ackerman KE. Endocrine effects of relative energy deficiency in sport. Int J Sport Nutr Exerc Metab. (2018) 28(4):335–49. doi: 10.1123/ijsnem.2018-0127
63. Harvey CB, O’Shea PJ, Scott AJ, Robson H, Siebler T, Shalet SM, et al. Molecular mechanisms of thyroid hormone effects on bone growth and function. Mol Genet Metab. (2002) 75(1):17–30. doi: 10.1006/mgme.2001.3268
64. Welsh KJ, Soldin SJ. How reliable are free thyroid and total T3 hormone assays? Eur J Endocrinol. (2016) 175(6):R255–63. doi: 10.1530/EJE-16-0193
65. Russell W, Harrison RF, Smith N, Darzy K, Shalet S, Weetman AP, et al. Free triiodothyronine has a distinct circadian rhythm that is delayed but parallels thyrotropin levels. J Clin Endocrinol Metab. (2008) 93(6):2300–6. doi: 10.1210/jc.2007-2674
66. Dipla K, Kraemer RR, Constantini NW, Hackney AC. Relative energy deficiency in sports (RED-S): elucidation of endocrine changes affecting the health of males and females. Horm Athens Greece. (2021) 20(1):35–47. doi: 10.1007/s42000-020-00214-w
67. Sale C, Elliott-Sale KJ. Nutrition and athlete bone health. Sports Med Auckl NZ. (2019) 49(Suppl 2):139–51. doi: 10.1007/s40279-019-01161-2
68. Freedman LS, Commins JM, Moler JE, Willett W, Tinker LF, Subar AF, et al. Pooled results from 5 validation studies of dietary self-report instruments using recovery biomarkers for potassium and sodium intake. Am J Epidemiol. (2015) 181(7):473–87. doi: 10.1093/aje/kwu325
69. Willett W, Stampfer MJ. Total energy intake: implications for epidemiologic analyses. Am J Epidemiol. (1986) 124(1):17–27. doi: 10.1093/oxfordjournals.aje.a114366
70. Schoeller DA. Limitations in the assessment of dietary energy intake by self-report. Metab Clin Exp. (1995) 44:18–22. doi: 10.1016/0026-0495(95)90204-X
71. Ndahimana D, Kim EK. Measurement methods for physical activity and energy expenditure: a review. Clin Nutr Res. (2017) 6(2):68–80. doi: 10.7762/cnr.2017.6.2.68
72. Welk G. Physical Activity Assessments for Health-Related Research. Champaign, IL: Human Kinetics (2002). p. 269. Available online at: http://catalog.hathitrust.org/api/volumes/oclc/49376240.html (accessed August 30, 2023).
73. Torstveit MK, Ackerman KE, Constantini N, Holtzman B, Koehler K, Mountjoy ML, et al. Primary, secondary and tertiary prevention of relative energy deficiency in sport (REDs): a narrative review by a subgroup of the IOC consensus on REDs. Br J Sports Med. (2023) 57(17):1119–26. doi: 10.1136/bjsports-2023-106932
74. Õnnik L, Mooses M, Suvi S, Haile DW, Ojiambo R, Lane AR, et al. Correction to: prevalence of triad–RED-S symptoms in high-level Kenyan male and female distance runners and corresponding control groups. Eur J Appl Physiol. (2022) 122(1):209. doi: 10.1007/s00421-021-04836-9
75. Schofield K, Thorpe H, Sims S. Compartmentalised disciplines: why low energy availability research calls for transdisciplinary approaches. Perform Enhanc Health. (2020) 8:100172. doi: 10.1016/j.peh.2020.100172
Keywords: REDs, relative energy deficiency in sport, athletes, markers, low energy availability
Citation: Dvořáková K, Paludo AC, Wagner A, Puda D, Gimunová M and Kumstát M (2024) A literature review of biomarkers used for diagnosis of relative energy deficiency in sport. Front. Sports Act. Living 6:1375740. doi: 10.3389/fspor.2024.1375740
Received: 24 January 2024; Accepted: 17 June 2024;
Published: 12 July 2024.
Edited by:
Justin Roberts, Anglia Ruskin University, United KingdomReviewed by:
Naama W. Constantini, Shaare Zedek Medical Center, IsraelRobert Percy Marshall, University Hospital Halle, Germany
© 2024 Dvořáková, Paludo, Wagner, Puda, Gimunová and Kumstát. This is an open-access article distributed under the terms of the Creative Commons Attribution License (CC BY). The use, distribution or reproduction in other forums is permitted, provided the original author(s) and the copyright owner(s) are credited and that the original publication in this journal is cited, in accordance with accepted academic practice. No use, distribution or reproduction is permitted which does not comply with these terms.
*Correspondence: Kristýna Dvořáková, NDYxNzAxQG1haWwubXVuaS5jeg==