 Lukas Masur
 Florian Brand2
 Peter Düking
- 1Department of Sports Science and Movement Pedagogy, Technische Universität Braunschweig, Braunschweig, Germany
- 2Clinic for Trauma Surgery and Orthopedics, Städtisches Klinikum Braunschweig, Braunschweig, Germany
Introduction: Monitoring internal load is crucial for athletes but often requires invasive methods for muscle-related parameters, limiting practicality. Infrared thermography (IRT) related parameters might overcome this limitation. This systematic review aimed to examine the available literature on the response of IRT related parameters to (non-)sport specific exercise and reveal relationships with internal load parameters in athletic populations.
Methods: Four scientific databases were systematically searched (February 2024) with keywords related to IRT, load, and sports disciplines. Risk of bias was evaluated using QUADAS-2. Main inclusion criteria for studies were i) reporting of IRT related parameters and other internal load parameters prior/post (non-)sport specific exercise ii) inclusion of least Tier 2 athletes ≥ 18 years. After identifying n = 10,538 studies, 13 articles (n = 231 participants) were included.
Results: Following (non-)sport specific exercise in athletic populations, the majority of relevant studies showed a decrease in IRT related parameters within 15 min, while studies showed an increase in IRT related parameters following 30 min, 24 h, 48 h, and 72 h after exercise cessation. Relationships between alterations in IRT related parameters and other internal load parameters are inconsistent across the literature.
Conclusion: While the majority of studies show an increase in IRT related parameters following (non-)sport specific exercise, relationships with other internal load parameters and underlying physiological mechanisms evoking IRT related alterations are not conclusively revealed in athletic populations. Future research needs to assess the relationship of IRT related parameters especially with inflammatory parameters in athletic populations following (non-)sport specific exercise. Practitioners might assess IRT related parameters in conjunction with other load parameters.
1 Introduction
Quantifying internal load by monitoring of various parameters holds a key role to individualize training procedures to advert fatigue, mitigate the risk of illness and injury, and optimizing performance outcomes (1). In this context, internal load pertains to an individual's psychophysiological response to the external load, which can be defined as the executed mechanical work (1). Depending on the bodily system at question, different methodologies are available to practitioners to assess internal load of athletes (2–4). However, these methodologies are often intrusive and/or time-consuming, particularly when muscle related parameters should be evaluated (4, 5). This limits the assessment of muscle related parameters in practice. Consequently, other approaches are needed which overcome these limitations.
To assess muscle related parameters, non-invasive infrared thermography (IRT) following exercise (6) is increasingly used in athletic populations (7–10) as well as in the medical literature (8, 11). IRT is a non-radiating, contact-free, and non-invasive approach to measure skin temperature and derive different parameters (e.g., skin temperature asymmetries, changes in skin temperature) (12). While healthy subjects are anticipated to maintain thermal equilibrium under neutral conditions (13), the metabolic, biomechanical, and physiological demands associated with training and competitive activities may elicit fluctuations in skin temperature after exercise cessation (12). The underlying mechanisms of the change of body surface radiation during and after exercise relies on several muscular and physiological factors, including increased ATP-production, neuronal responses, vasomotor adjustments and inflammatory processes (14–18). The specifics of these mechanisms, including their dependence on exercise type, are eloquently explained elsewhere (14, 17, 18).
Given the link between IRT and physiological mechanisms, research explored whether changes in skin temperature are associated with physiological parameters. Studies indicated that IRT-related parameters correlate with performance metrics, such as maximal oxygen uptake and heart rate (19, 20). Information about skin temperature alterations following exercise has been used to detect skeletal muscle overload and fatigue in athletic populations (21). Additionally, it was shown that if IRT related parameters are used to identify players at potential risk, injuries could be reduced in elite soccer players (21, 22).
However, despite isolated studies, there is no systematic review available in the literature on the response of IRT related parameters in response to (non-)sport specific exercise. To provide a stronger evidence base to inform sports practice and future research, the aim of this article was to systematically review available literature on the response of IRT related parameters to (non-)sport specific exercise and relationship with internal load parameter.
2 Methods
2.1 Study design
To be considered for inclusion, IRT related parameters must have been calculated from infrared thermographic images and must have been captured either pre and post, or only post (non-)sport specific exercise or competition in compliance to the Glamorgan Protocol (2) and/or the contemporary consensus statement recommendations delineated by Thermographic Imaging in Sports and Exercise Medicine (TISEM) for the measurement of human skin temperature (23). Studies were excluded if they did not align with these scientific recommendations.
Studies that assessed IRT related parameters preceding or concurrently with exercise, which involved consciously or unconsciously manipulated experimental conditions (e.g., environmental temperature), or which assessed methodological differences while obtaining IRT related parameters were out of the scope of this article and therefore excluded. Investigations where training was coupled with a manipulating experimental intervention (e.g., use of ergogenic aids, assessment of recovery procedures) were excluded.
2.2 Study populations
All investigations involving adult, healthy, able-bodied trained/developmental (at least Tier 2) team sport or individual sport athletes (24), regardless of sex or gender were included. As age is considered an influencing factor on thermographic parameters (25), and it has been demonstrated that skin temperature stabilizes after puberty (26), this review focuses on investigations incorporating athletes with a mean age of ≥18 years. Research involving non-human participants or participants with a mean age below 18 years was excluded. Studies with injured team sport players which are e.g., in the return to sport or return to play procedures were excluded.
2.3 Outcomes
In order to be included, the study must have examined IRT related parameters following (non-) sport specific exercise and the relationship between IRT related parameters (e.g., skin temperature; surface radiation temperature; skin temperature asymmetries) and at least one other internal load parameter in either the time, frequency or concentration domain (e.g., heart rate, ratings of perceived exertion, lactate). Accordingly, studies that measured skin temperature but did not integrate IRT-related parameters and/or internal load parameters were excluded.
2.4 Publication status and language
Only full-length original articles published in English in peer-reviewed journals will be considered, omitting “grey” literature such as conference abstracts, dissertations, theses, or reports. In addition, the reference lists of articles initially included were examined for additional publications of potential relevance. Articles published in other languages were excluded.
2.5 Search strategy
In accordance with the Preferred Reporting Items for Systematic Reviews and Meta-Analyses (PRISMA) guidelines (27) and the PRISMA 2020 Checklist (Supplementary Table S1), we conducted a systematic search of Ovid MEDLINE In-Process and Other Non-Indexed Citations, CINAHL, EMBASE, and Web of Science (with no restrictions on publication date) in February 2024 to identify potentially relevant articles using the search criteria outlined in Supplementary Table S2. The development of search terms and medical subject headings (MeSH) was conducted in collaboration with a skilled librarian. In addition, reference lists of identified articles were screened to detect pertinent articles that might have been failed to notice using this search profile.
2.6 Selection of articles
After importing potentially relevant articles into Citavi 6 (QSR International, Burlington, MA, USA) and removing duplicates, one of the authors screened the titles and abstracts based on our inclusion criteria, while a second investigator independently validated those evaluations. Subsequently, both individuals thoroughly reviewed the full texts of the relevant articles to assess eligibility (with awareness of the journals and authors involved). Discrepancies were resolved through discussion between authors, until a consensus was reached.
2.7 Data extraction and analysis
As previously performed (28), the process of data extraction from each article identified was divided into the following steps: (1) study characteristics by the publication details (authors, journal, date), sports, participants (mean age, number, sex), level of performance; (2) study-defined training or competition characteristics, data and time point related to internal load parameters; (3) data and time points related to thermographic parameters, analyzed body region of the thermographic assessment; (4) methodological approaches of the thermographic analysis by extracting the camera type, methodological analysis method of thermographic parameters; (5) statistical analysis.
2.8 Data synthesis
To evaluate the magnitude of the effects as performed in previously published research (29), percentage changes (Δ%) were calculated and illustrated in Figure 2, Tables 3 and 4 for study outcomes using the following equation:
Mpost represents the mean value after (long-term) training or competition and Mpre the baseline mean value.
Depicted mean values were calculated to summarize results of studies using standard equation, as follows:
2.9 Assessment of methodological quality
As recommended by Whiting et al. (30) and employed in similar research (11, 31), two experienced raters independently assessed the methodological quality using the QUADAS-2 scale, which comprises two domains: risk of bias and applicability (30, 32). The risk of bias domain evaluates items such as “patient or sample selection”, “index test”, “reference standard”, and “flow and timing”. The applicability domain assesses parameters including “sample selection”, “index test”, and “reference standard”. Regarding phase two of QUADAS-2, we tailored our review by omitting signal questions pertaining to blinding, as recommended in the official background document for objective index tests (30). Informed by fundamental principles, research, and recommendations (30, 32), we incorporated an additional signal question concerning patient/sample selection: “Does the study delineate inclusion and exclusion criteria for the selection process?”. Appropriate criteria were derived from Fernandez-Cuevas et al., 2015 (25) and involve medical history (injury, diseases, operations), intake factors (drug treatment, medicaments, alcohol, tobacco, stimulants) and application factors (ointments, cosmetics, therapies). Disagreements between raters were resolved through consensus.
3 Results
3.1 Study characteristics
The compilation of records identified and examined is illustrated in Figure 1. A total of n = 10,538 studies were identified (PubMed n = 8,254; EMBASE n = 826, CINAHL n = 970, Web of Science n = 488). 13 articles conformed to our inclusion criteria, including 231 participants (193 males, 28 females; 10 non-disclosed participants; Age range: 18 to 41 years). Ten of 13 studies included n = 188 tier 3 athletes (3, 4, 7, 9, 12, 33–37) and three included n = 43 tier 2 athletes (38–40).
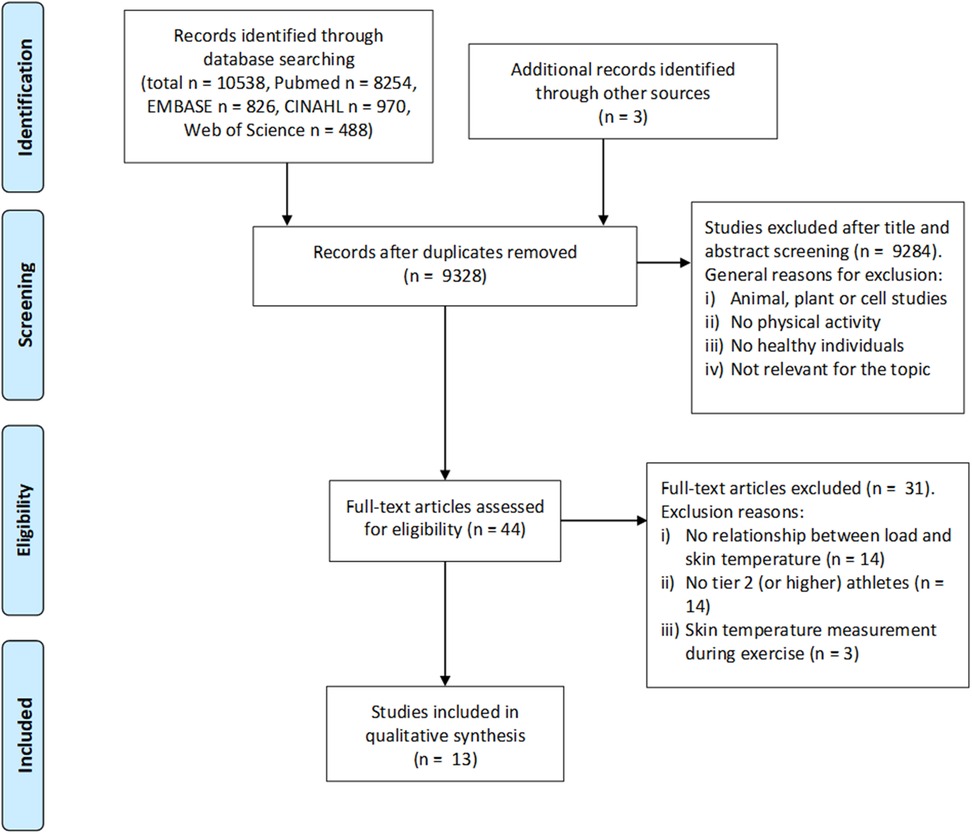
Figure 1. Process of study selection, from initial identification as potentially relevant to inclusion.
Eleven (7, 9, 12, 33–40) of 13 studies were published in between 2019 and 2024. Six studies were conducted in soccer (3, 4, 9, 12, 33, 36), three in endurance sports such as half-marathon (38), marathon (39), triathlon (40), two in judo (7, 37), one in sprinting (34) and one examined sprinters and endurance athletes (triathletes and long-distance runners) (35).
Tables 1, 2 summarize study characteristics including e.g., training or competition characteristics, load parameter description and methodological approaches.

Table 1. Characterization of the studies analyzed.
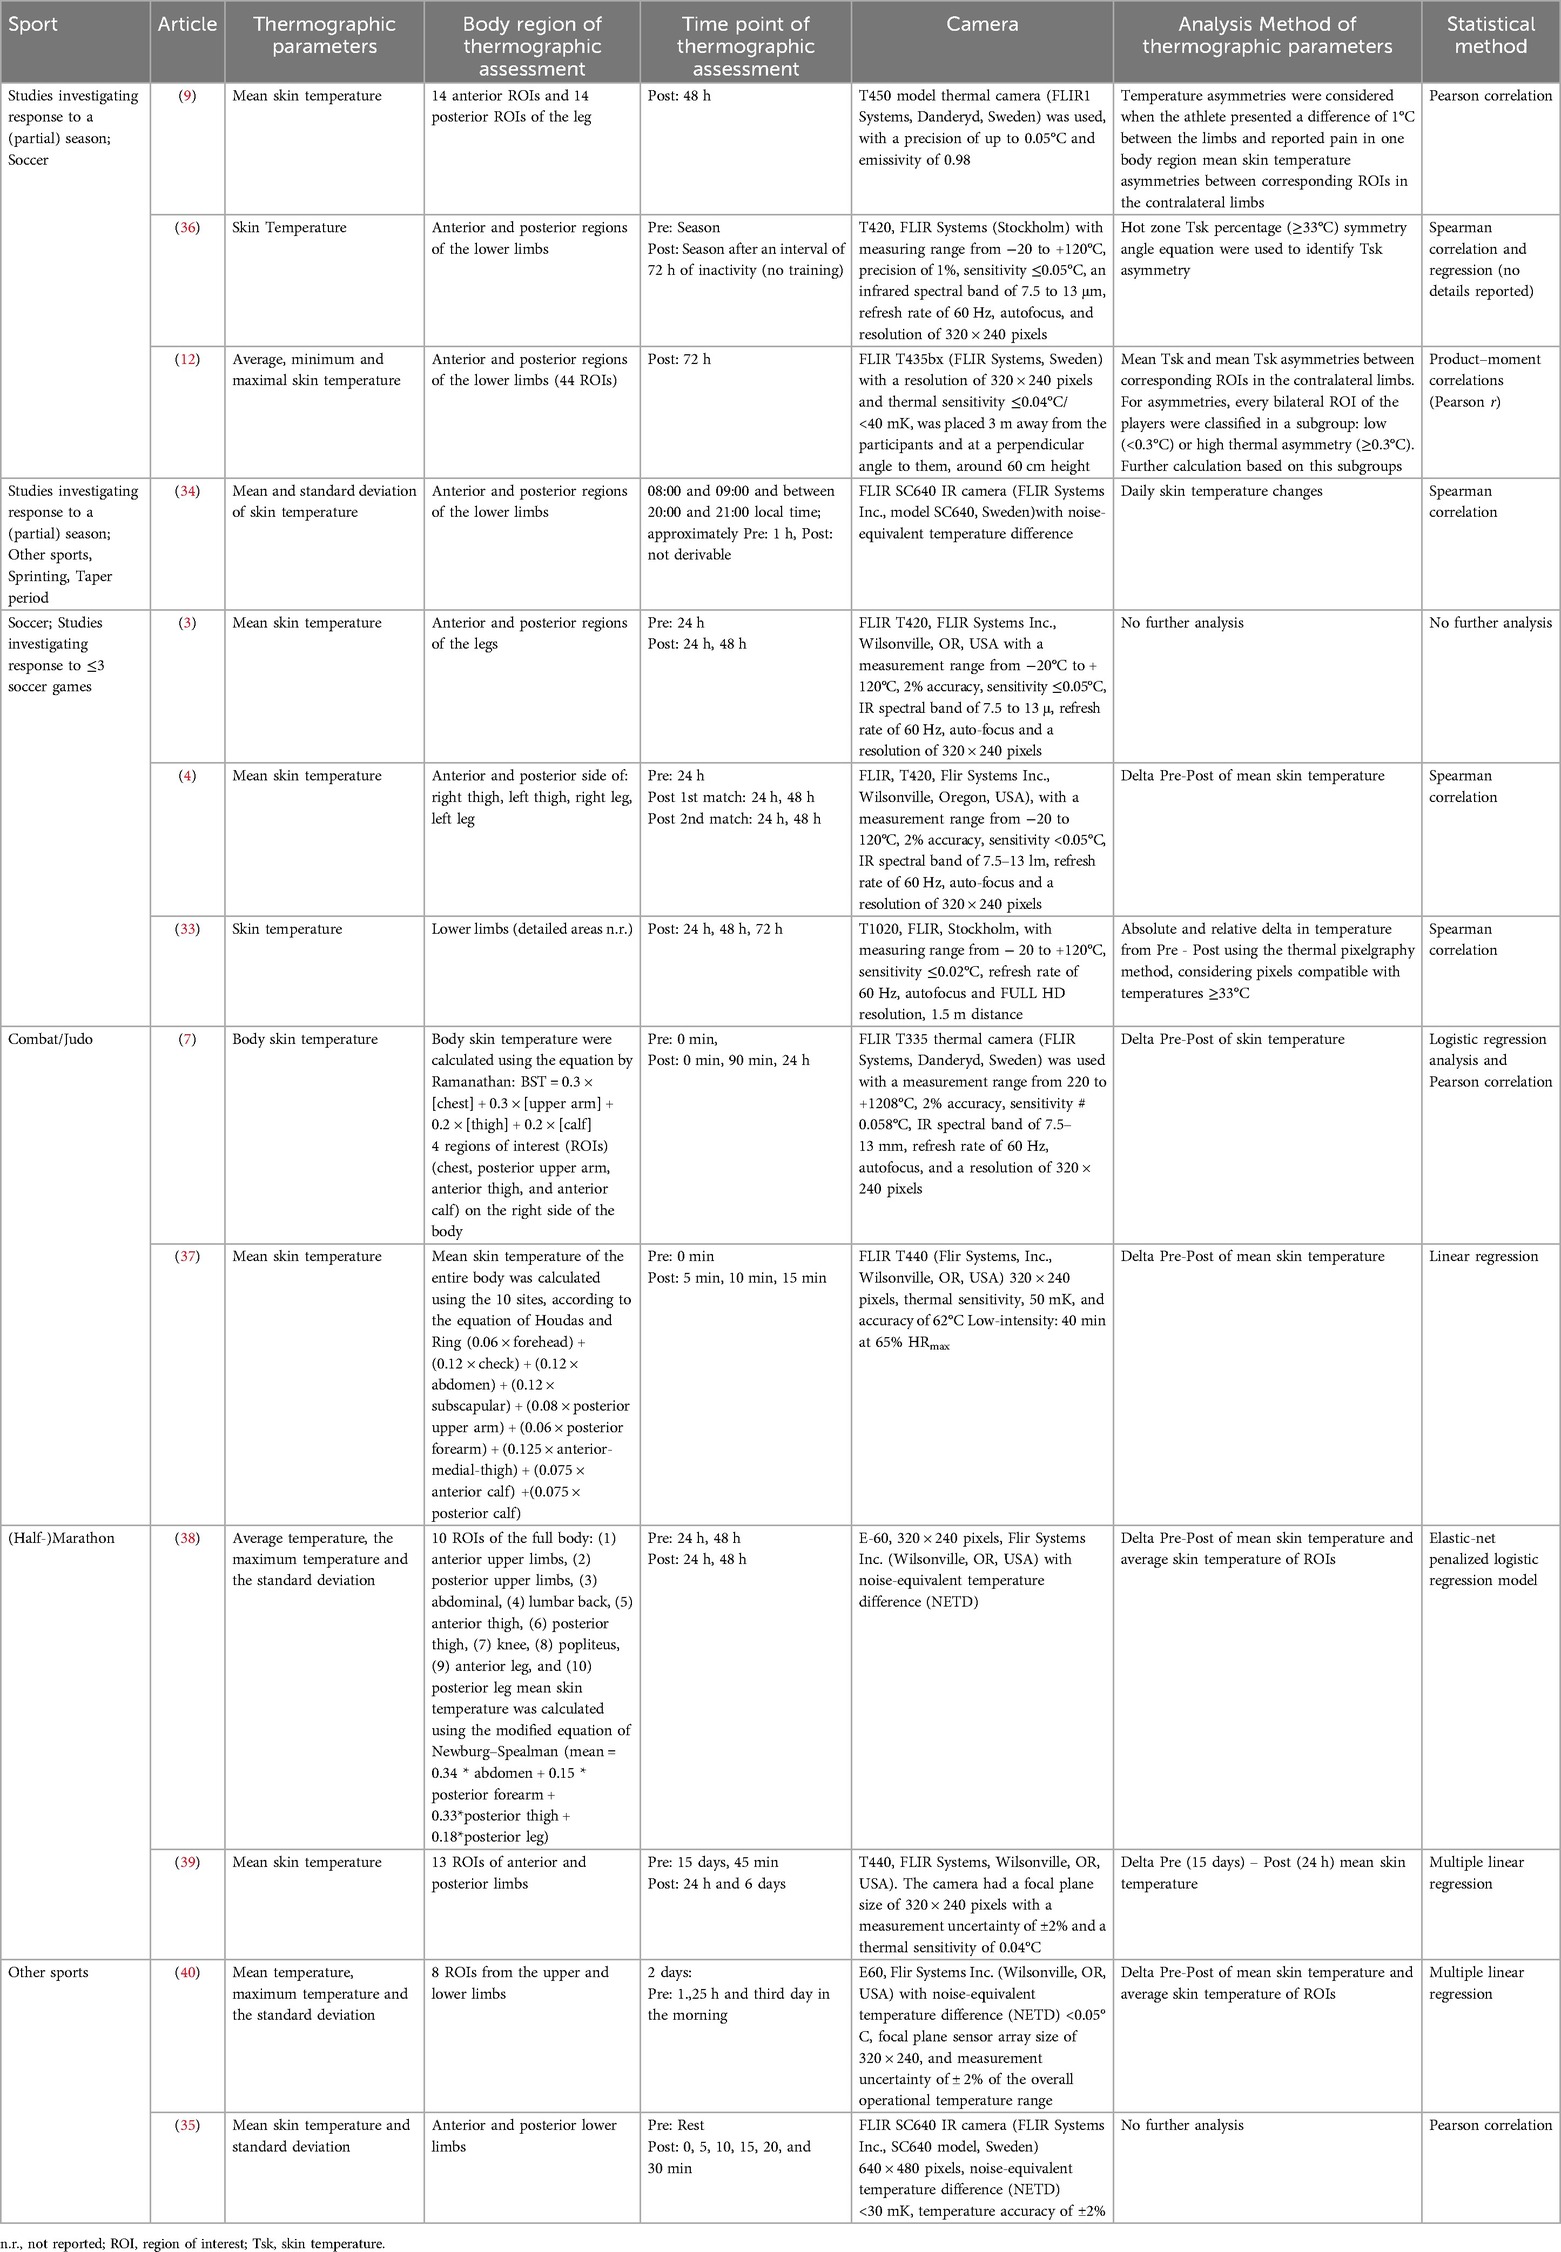
Table 2. Characterization of infrared thermography assessment.
Due to the variability in intervention periods and thereby methodological approaches (resulting in e.g., different statistics), studies were categorized based on the intervention time: (i) studies which conducted a single exercise, training session or investigating response to ≤ 3 soccer games (n = 9) (3, 4, 7, 33, 35, 37–40) and (ii) studies which encompassed frequent assessment of parameters across (at least parts of) a competitive season (n = 4) (9, 12, 34, 36).
3.2 Methodological approaches of infrared thermography
Regions of interest (ROIs) for IRT assessment included lower limbs only (n = 9) (3, 4, 9, 12, 33–36, 39), whole body (n = 3) (7, 37, 38), upper and lower limbs (n = 1) (40). The most assessed IRT related parameter was the mean skin temperature of different regions of interest (ROIs) [n = 7 (4, 7, 33, 37–40);]. Seven out of 13 studies analyzed differences in IRT related parameter between pre and post exercise and three studies investigated temperature asymmetries of contralateral ROIs (9, 12, 36). One study investigated daily IRT related parameter changes (34), while two studies conducted no further analysis (3, 35). Evaluation of IRT related parameters includes thermal pixelgraphy method (n = 1) (33), hot zone IRT related parameter percentage method (n = 1) (36) or averaging temperatures of the whole body by employing established equations (n = 3) (7, 37, 38). Additionally, one study investigated the relationship between load parameters and the post-training skin thermal patterns of the athletes (7). Carvalho et al. (9) used a cut-off value of 1°C difference in Tsk between contralateral limbs and the report of pain in one body region for further analysis. Majano et al. (12) grouped participants depending on thermal asymmetry in contralateral ROI of players with thresholds set at < 0.3°C for low asymmetry and ≥ 0.3°C for high asymmetry. Rodriguez Junior et al. (36) grouped participants according to their total distance traveled in half.
3.3 Response of IRT to (non-)sport specific exercise and relationship with internal load
Figures 2 and 3 summarize the response of IRT-related parameters to (non-)sport specific exercise.
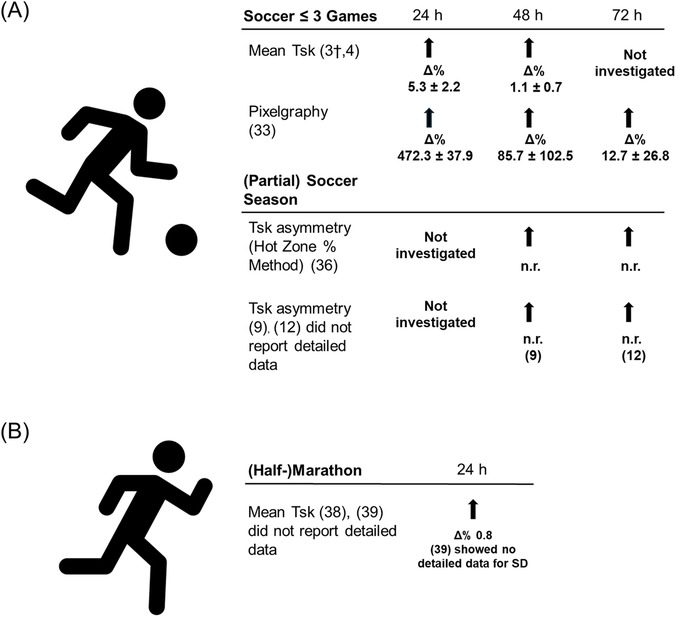
Figure 2. Changes in skin temperature in soccer and (half-)marathon. (A) Soccer ≤3 games and (partial) soccer season. (B) (Half-)Marathon. Δ% percentage changes based on mean values prior and after training or competition (self-calculated). †Single case study. Abbreviations: n.r., not reported in the study; Tsk, Skin temperature.

Figure 3. Changes in skin temperature in combat sports and other sports. (A) Combat sport. (B) Other sports (treadmill test, triathlon, sprint). Δ% percentage changes based on mean values prior and after training or competition (self-calculated). #calculation based on 6 ROIs, as dataset only includes 6 ROIs with a Tsk increase. Abbreviations: n.r., not reported in the study; Tsk, Skin temperature.
Tables 3–5 represent the response of IRT related parameters following (non-)sport specific exercise and the relationship with internal load parameters.
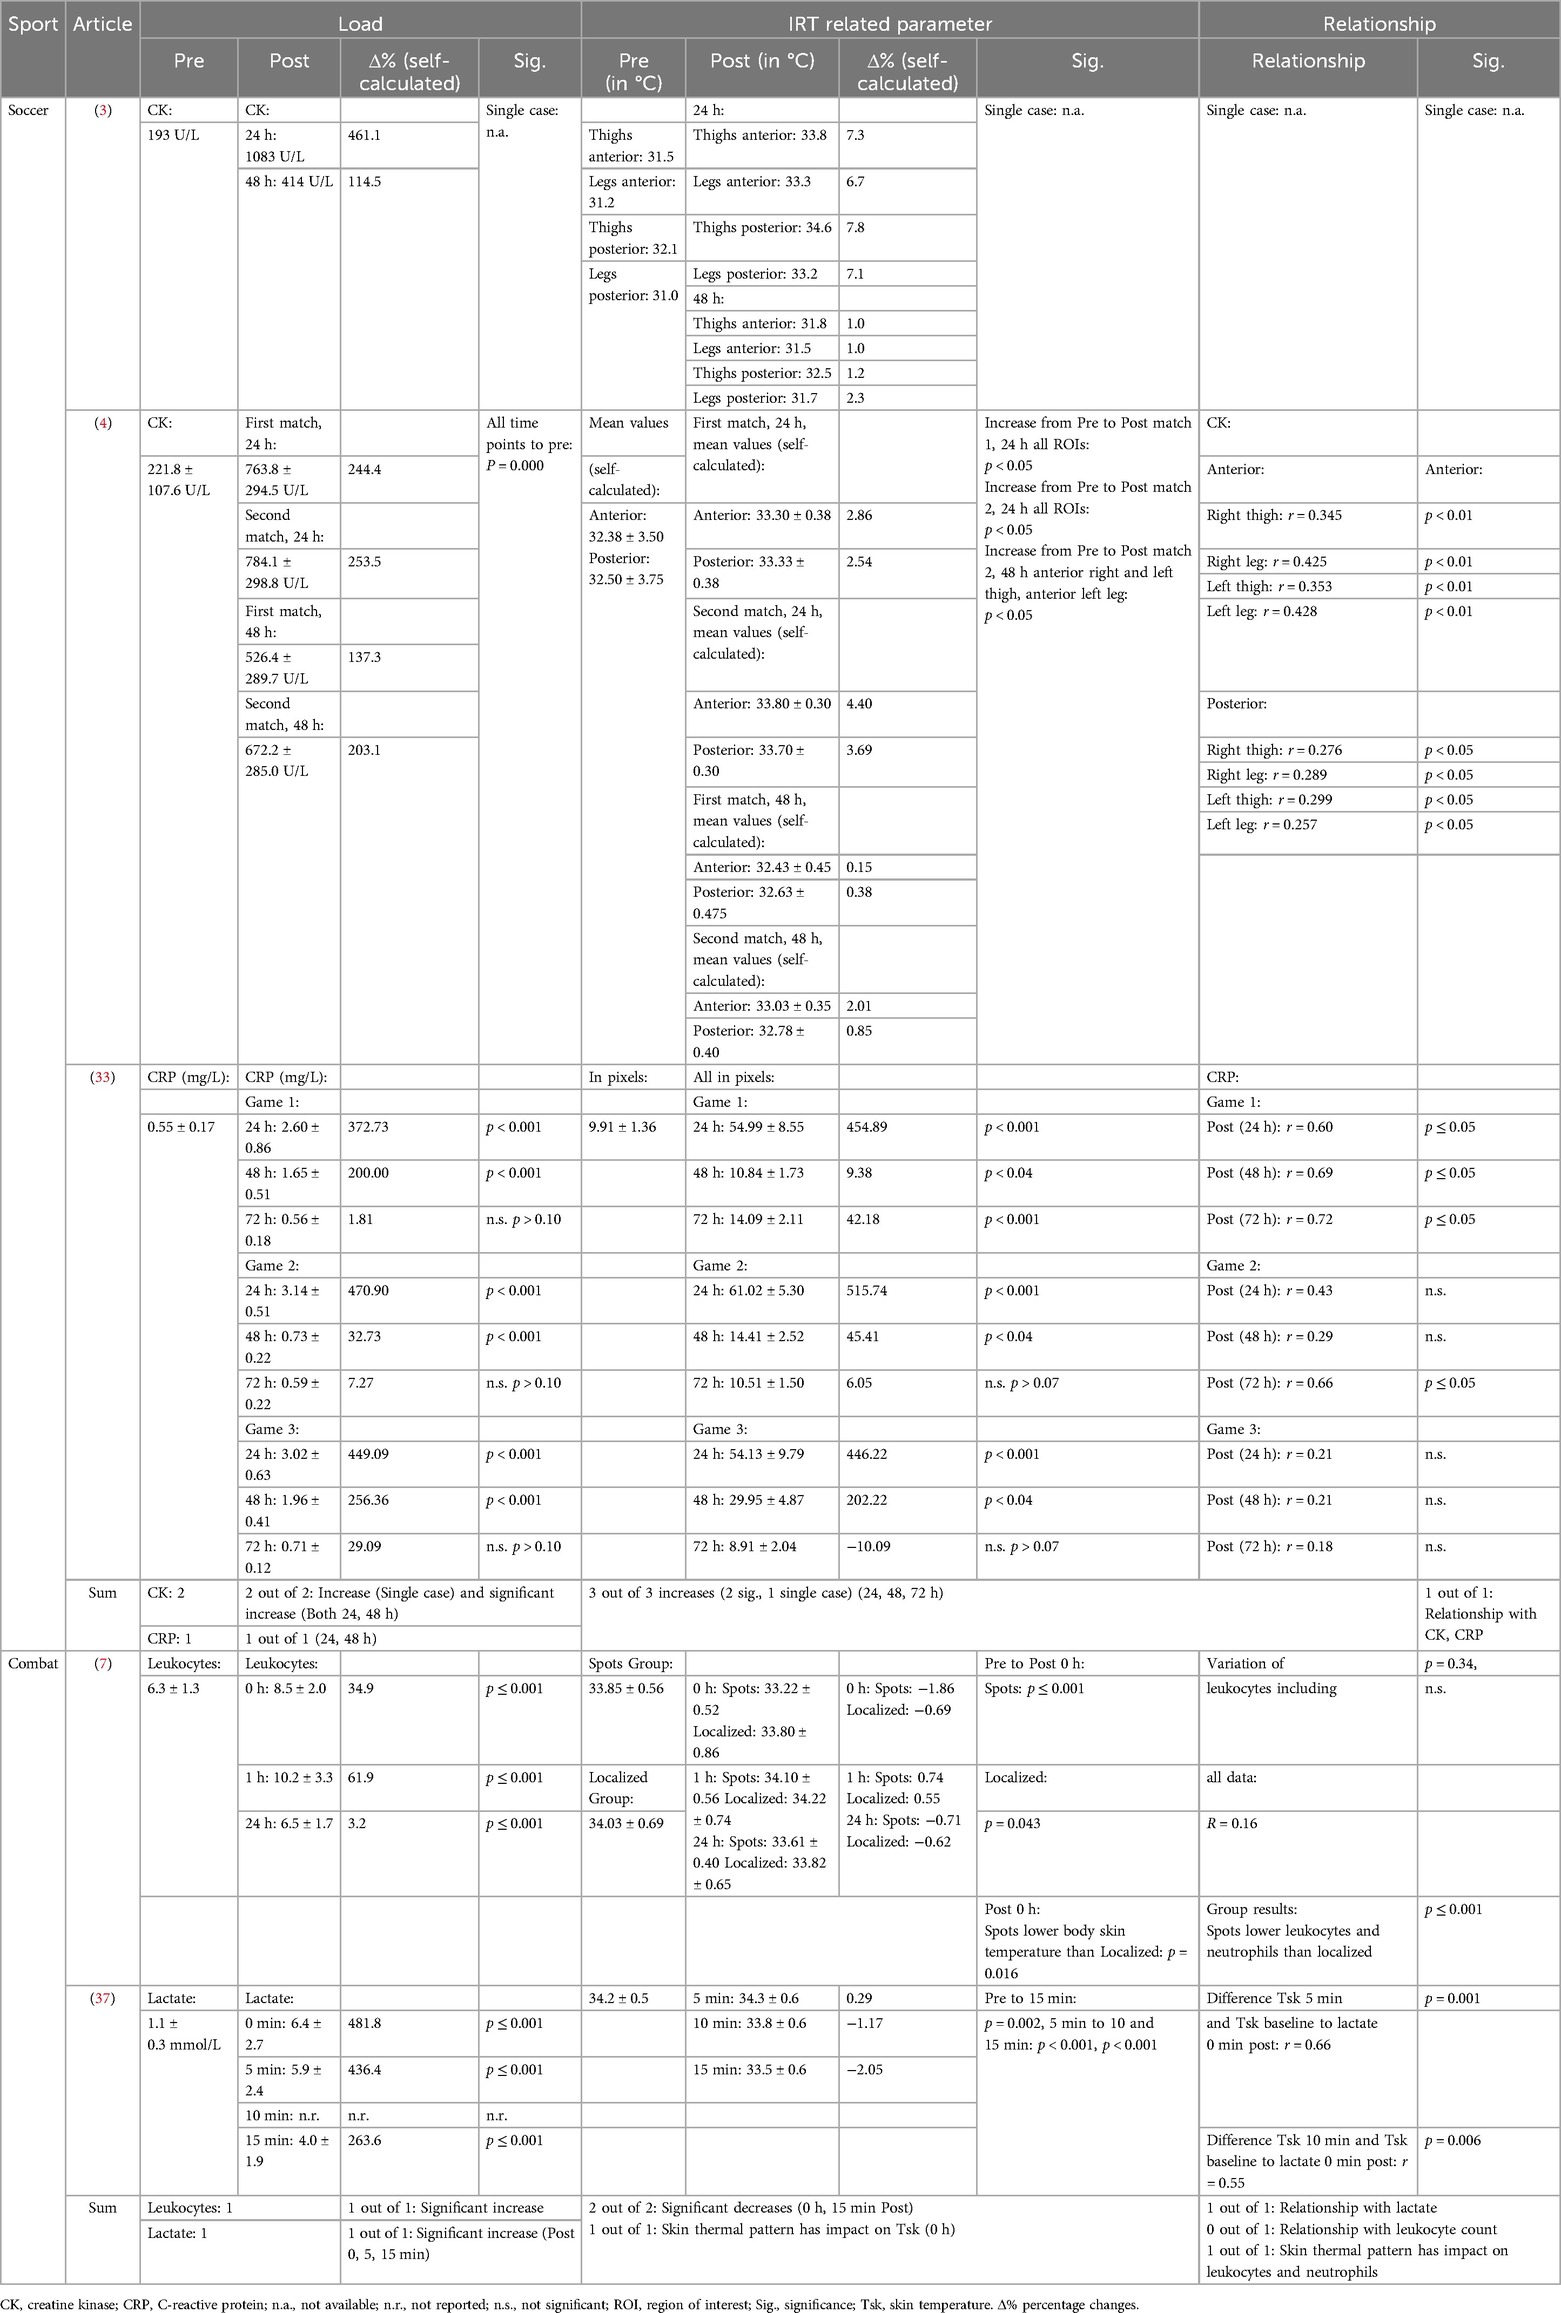
Table 3. Infrared related parameter response and relationship with load parameter of studies in soccer investigating response to ≤3 soccer games and combat sport.
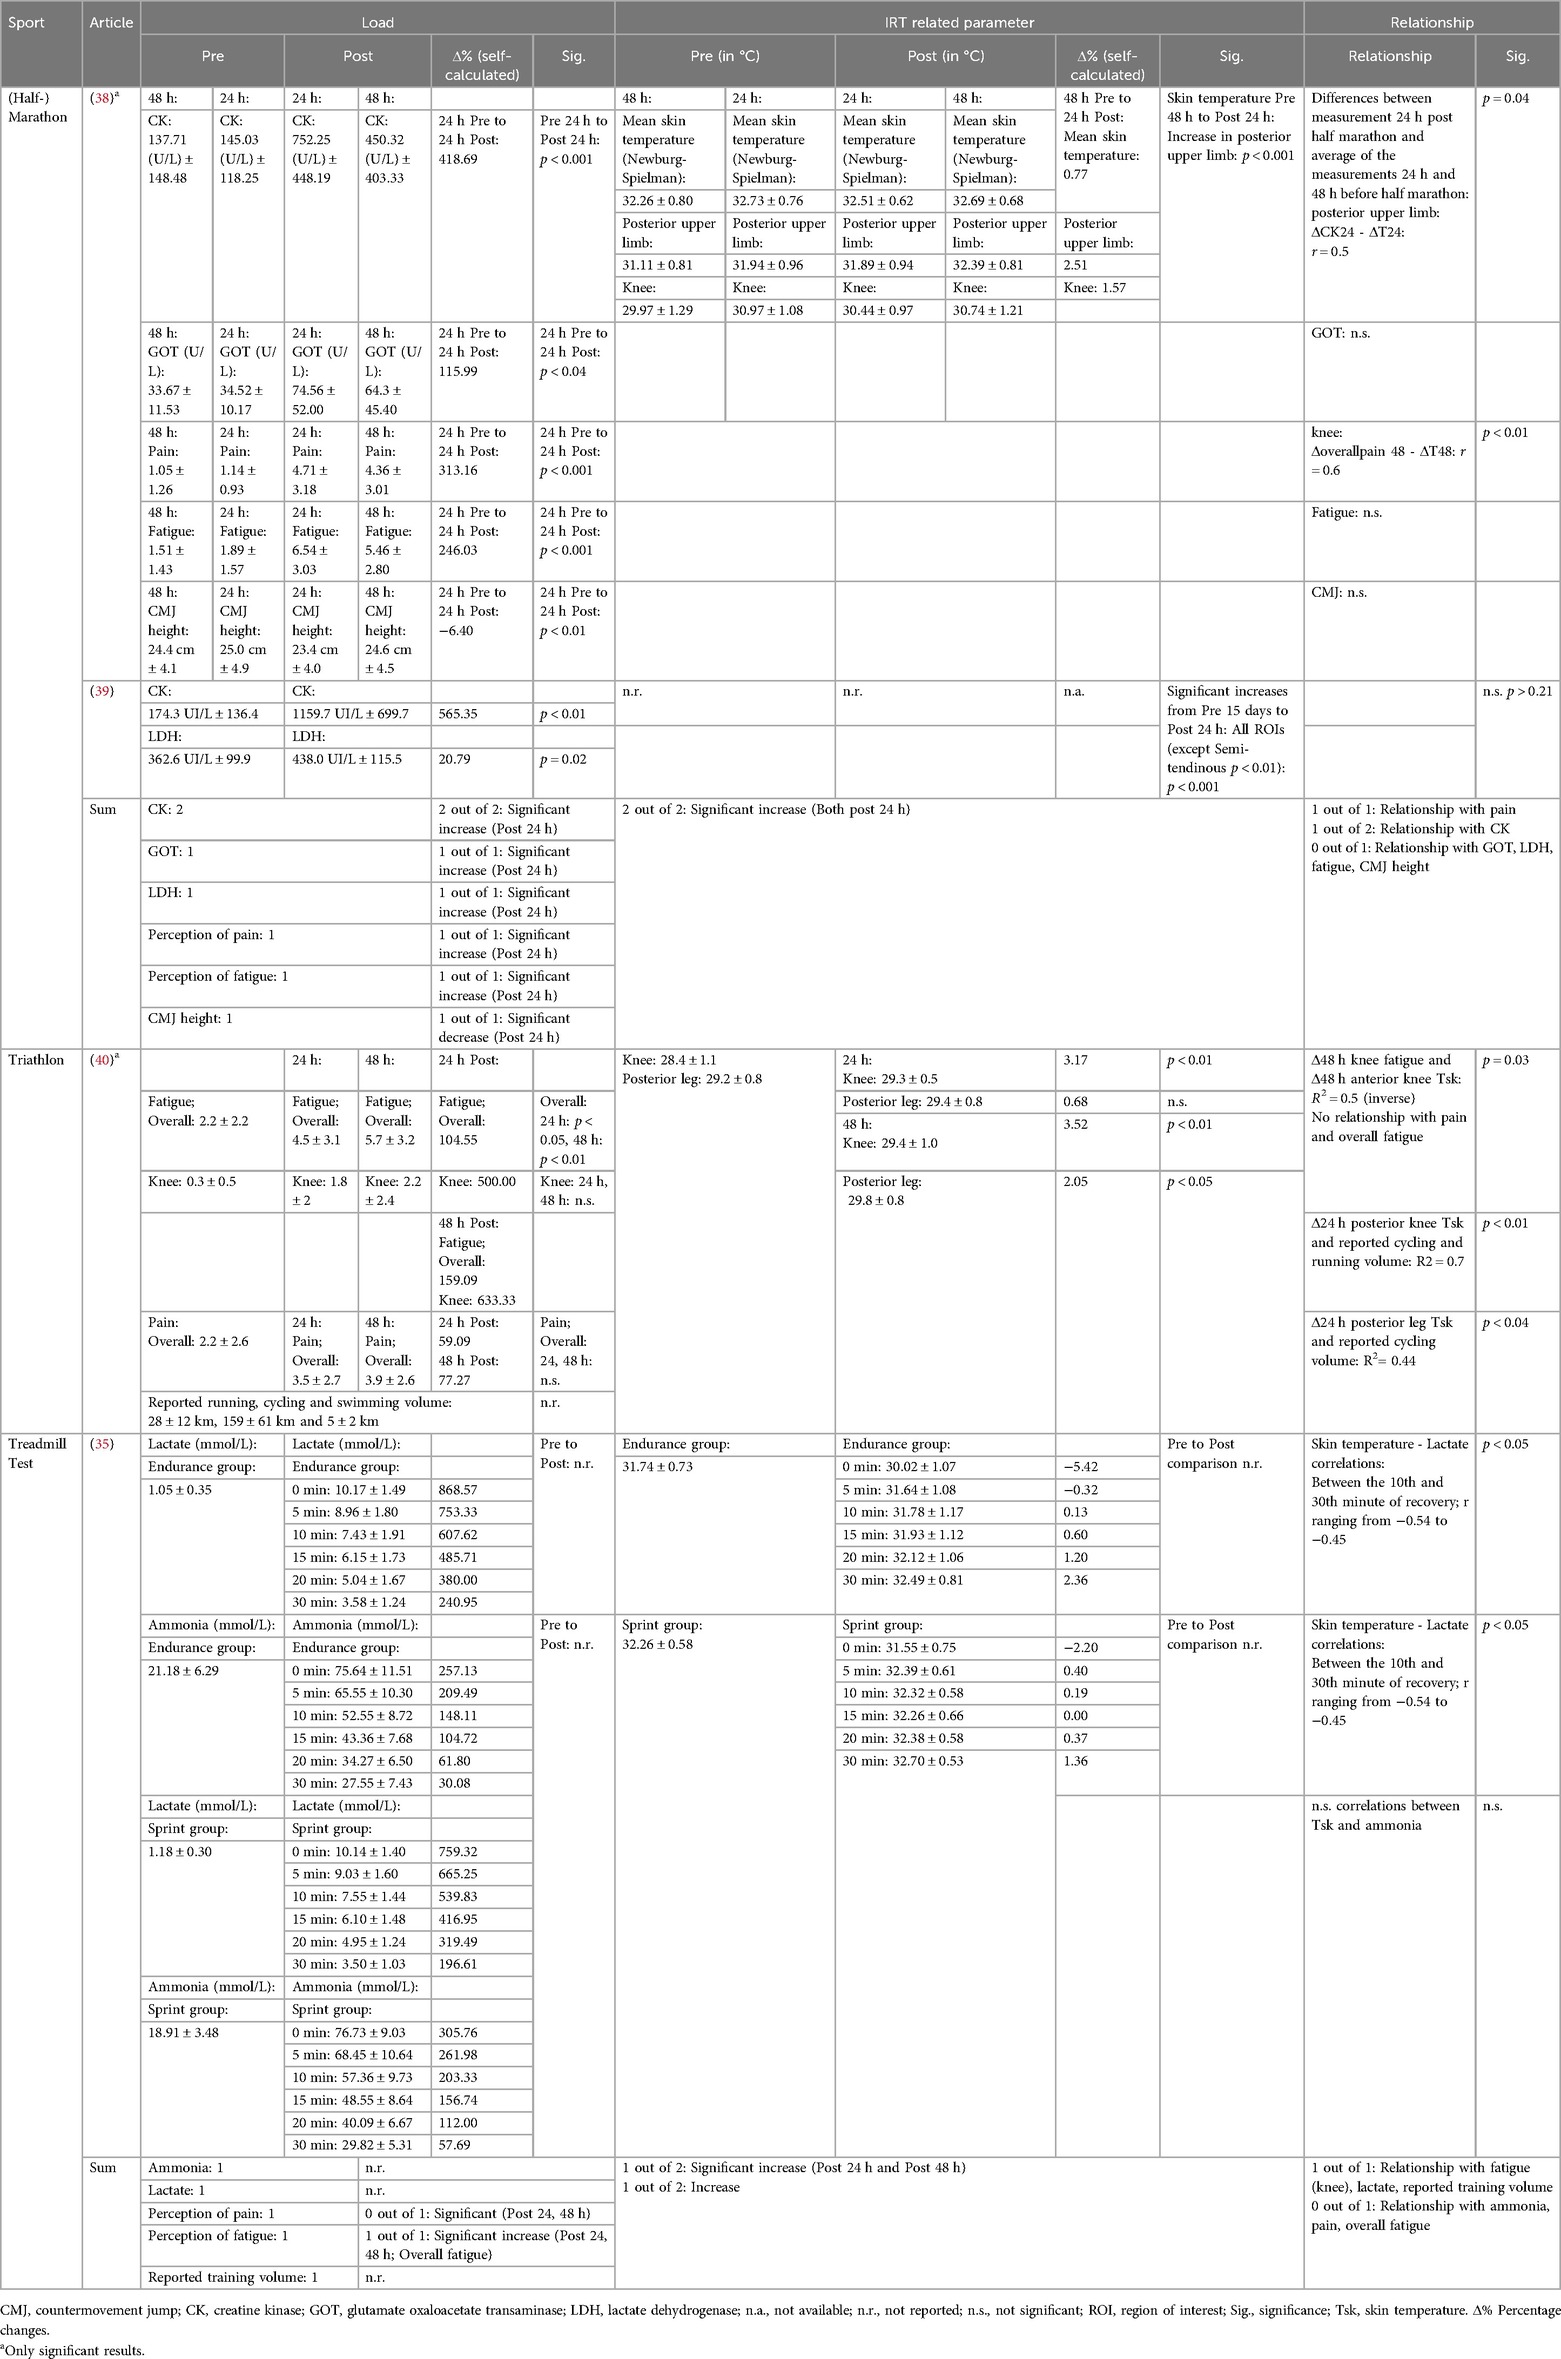
Table 4. Infrared related parameter response and relationship with load parameter for studies in (half-) marathon, triathlon and treadmill test.
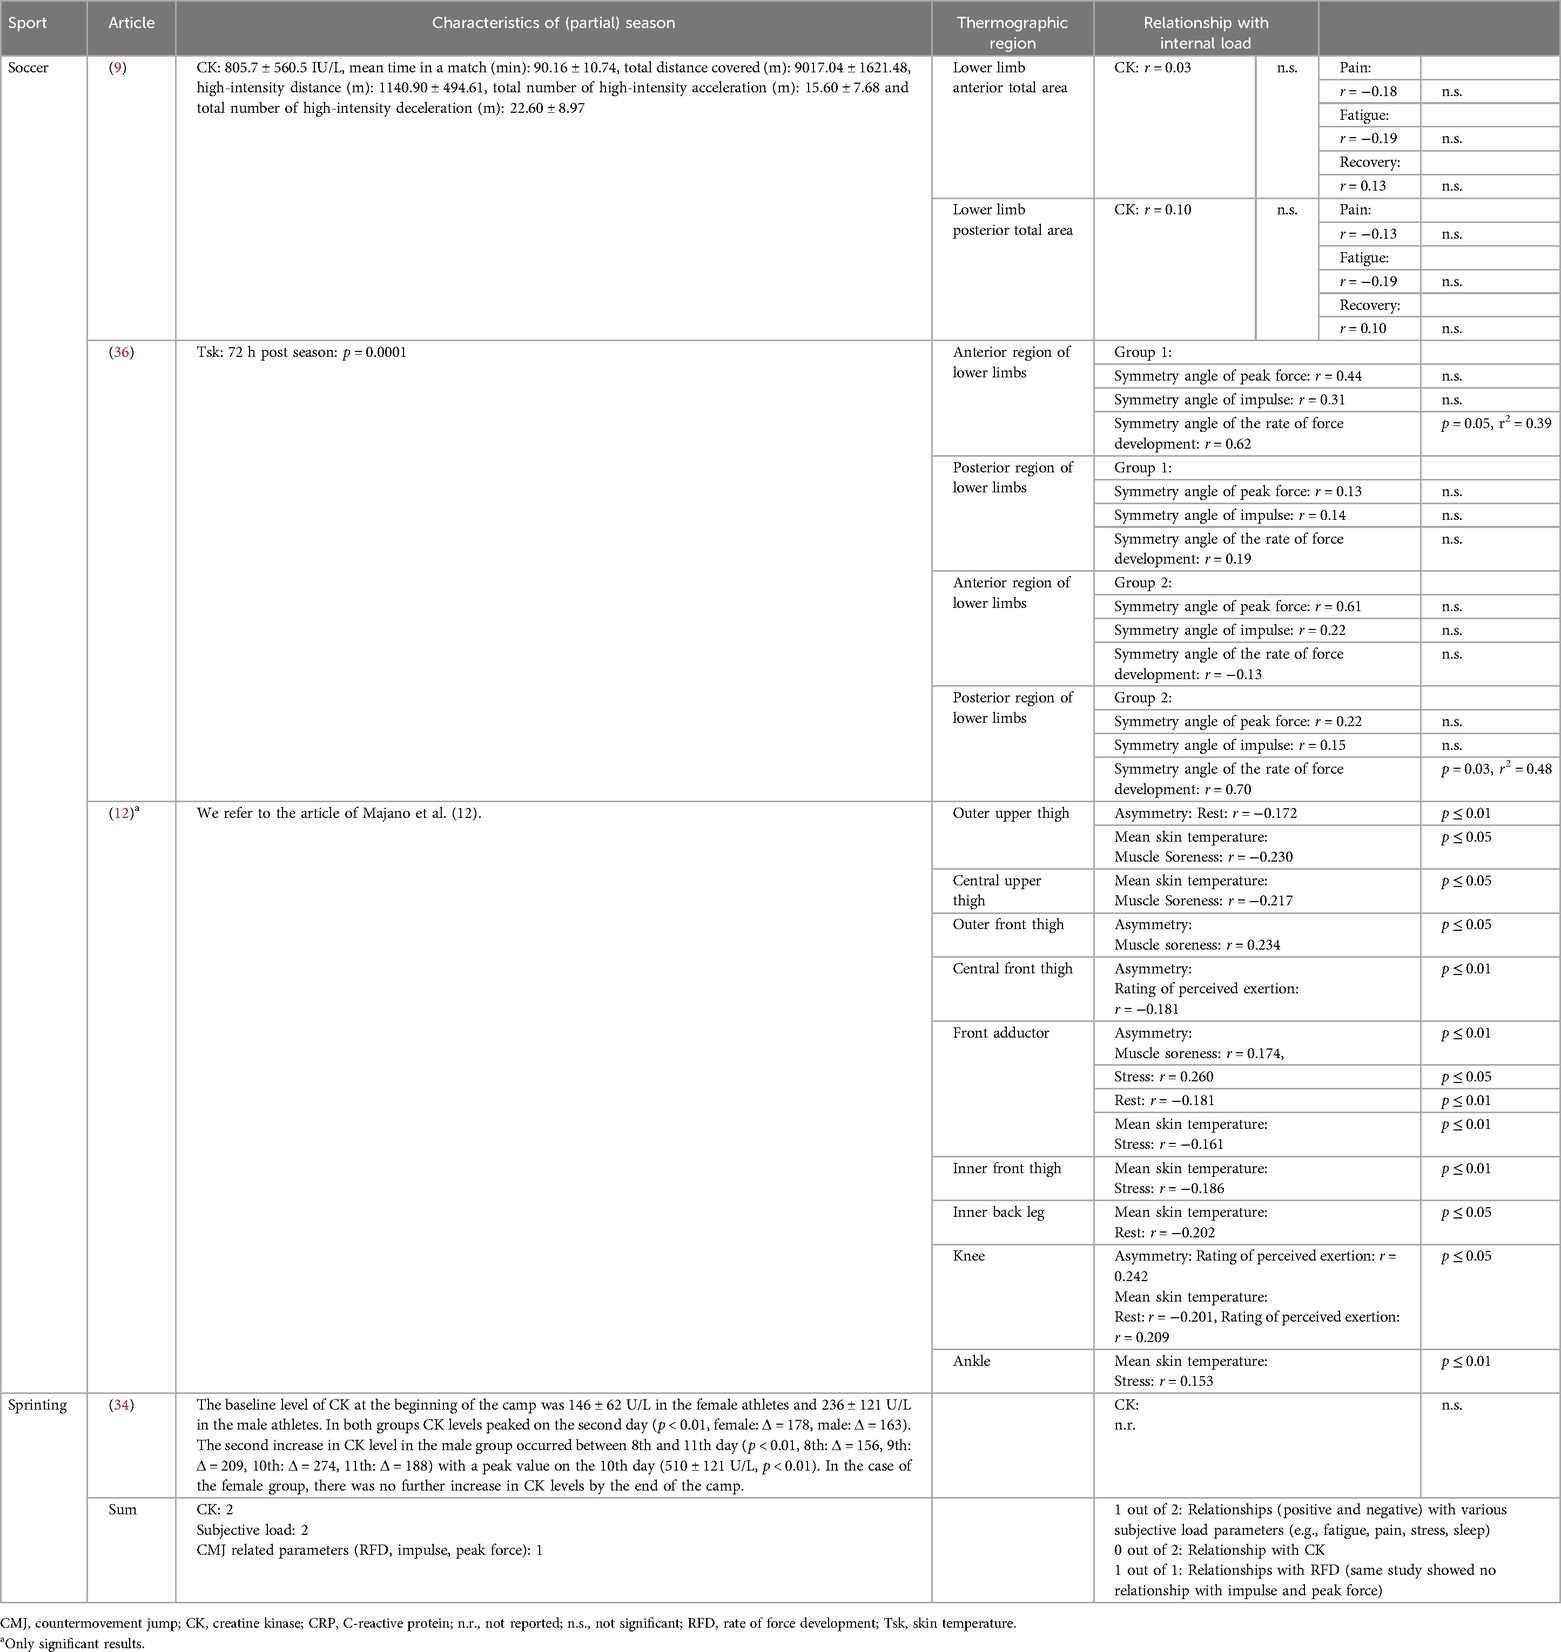
Table 5. Characteristics of (partial) season and relationship with internal load parameter in studies investigating response to a (partial) season.
3.4 Risk of bias
Table 6 summarizes the risk of bias according to QUADAS-2.
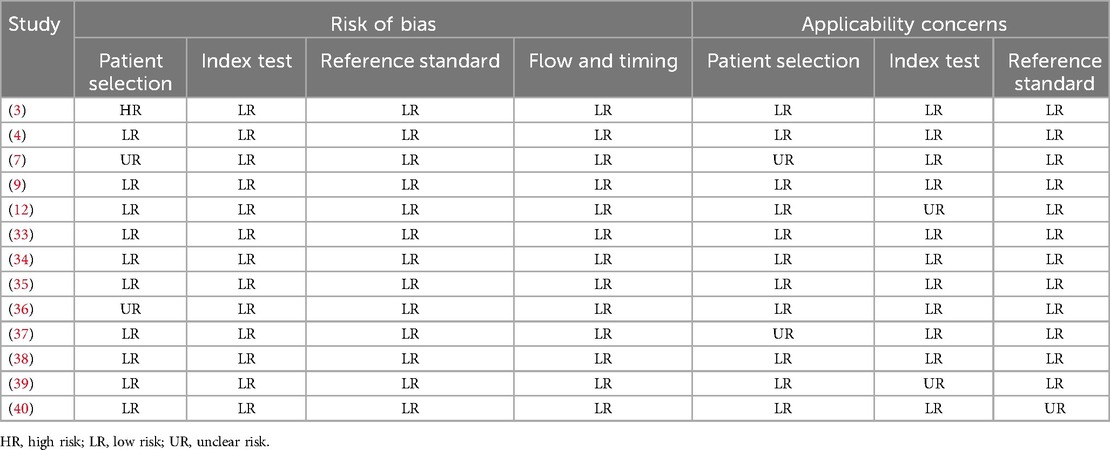
Table 6. Risk of bias assessment.
The first domain pertaining patient or participant selection indicates one study (3) with a high risk. De Andrade Fernandes (3) conducted a single-case study. Two studies were classified as unclear risk: Brito et al. (7) did not provide information of medical history, which could have been a part of the applied TISEM Checklist. Rodrigues Júnior (36) et al. utilized inclusion and exclusion criteria, but omitted information about application factors such as ointments or therapies. Applicability concerns regarding patient selection were categorized as unclear risk in studies by Brito et al. (7) and Gomes Moreira et al. (37), due to the potential inclusion of athletes under the age of 18, as indicated by the reported standard deviation of participants’ ages. The remaining 11 studies (3, 4, 7, 9, 12, 33–40) incorporate athletes who were suitable for the research question. In the second domain referring to the index test, all 13 studies (3, 4, 7, 9, 12, 33–40) showed a low risk of bias, while there are two studies with unknown risk of applicability concerns. The study of Rojas-Valverde (39) was classified as unclear for applicability, as they reported a cleaning and drying process before IRT assessment but did not provide information about the drying method. Majano et al. (12) classified body areas of every athlete depending on asymmetries on training days. Therefore, a one body part could be classified in low asymmetry group and another part could be classified in high asymmetry group. As there is no additional evidence supporting this methodological approach, it was classified as unclear.
Regarding the reference standard, all 13 studies (3, 4, 7, 9, 12, 33–40) applied parameters, which encompasses defined load states of the athletes and therefore showed no risk of bias. The investigation of Priego-Quesada (40) was classified as unclear risk of concerns in terms of applicability, as they analyzed reported volumes of running and cycling load without providing information how these volumes were recorded.
The fourth domain “Flow and Timing” reflected no risk of bias of any study, since there was no delay or follow-up periods between the index and reference tests.
4 Discussion
The aim of this article was to systematically review available literature on the response of IRT related parameters to (non-)sport specific exercise and relationship with internal load parameters. The main results are:
1. 11 out of 13 studies were published between 2019 and 2024, indicating rising interest in research around IRT related parameters following (non-)sport specific exercise in athletic populations.
2. Following (non-) sport-specific exercise in athletic populations, the majority of relevant studies showed a decrease in IRT related parameters within 15 min (n = 3) (7, 35, 37), while studies showed an increase in IRT related parameters following 30 min (n = 1) (35), 24 h (n = 5) (3, 4, 38–40), 48 h (n = 7) (3, 4, 9, 12, 33, 36, 40), and 72 h (n = 3) (9, 12, 33, 36) after exercise cessation.
3. Relationships between alterations in IRT related parameters and other internal load parameters are inconsistent across the literature. Synthetization of literature is impaired due to variety in used methodological approaches (e.g., calculated IRT related parameters, time points of measurement, assessed internal load parameters).
4.1 Soccer
4.1.1 Studies investigating IRT related parameter response to ≤ 3 soccer games and relationship with other internal load parameters
Studies show a response in investigated IRT related parameters (i.e., change in mean Tsk; mean change after 24 h: 5.3%, after 48 h: 1.1%) (3, 4) and change in Tsk using thermal pixelgraphy method (mean change 24 h: 472.3%, after 48 h: 85.7%, after 72 h: 12.7%) (33) 24 h, 48 h and 72 h following a soccer match.
Studies investigating a relationship between mean Tsk and CK (24 and 48 h: anterior leg; mean r = 0.388, p ≤ 0.01; posterior leg; mean r = 0.280, p ≤ 0.05) (4) as well as Tsk evaluated through the thermal pixelgraphy method and CRP after one game (24 h post: r = 0.60, p ≤ 0.05; 48 h post: r = 0.69, p ≤ 0.05; 72 h post: r = 0.72, p ≤ 0.05) and after 2 consecutive games (72 h post: r = 0.66, p ≤ 0.05) (33).
Studies examined a relationship between mean Tsk and CK at a specific time point (24 and 48 h: anterior leg; mean r = 0.388, p ≤ 0.01; posterior leg; mean r = 0.280, p ≤ 0.05) (4) as well as Tsk evaluated through the thermal pixelgraphy method and CRP after one game (24 h post: r = 0.60, p ≤ 0.05; 48 h post: r = 0.69, p ≤ 0.05; 72 h post: r = 0.72, p ≤ 0.05) and with CRP after 2 consecutive games (72 h post: r = 0.66, p ≤ 0.05) (25).
While these studies show that soccer games evoke alterations in IRT related parameters (with 24 h post showing the highest alteration) which seem to have a relationship with CK and CRP, literature is still scarce and further research on response of IRT related parameters and relationship with internal load parameters is needed.
4.1.2 Studies investigating infrared thermography related parameters response to a (partial) season and relationship with other internal load parameters
Three studies investigated IRT related parameters (9, 12, 36) and showed that Tsk asymmetries using the “hot zone percentage method” (72 h post season: p = 0.0001) (36) and mean Tsk asymmetries (mean Tsk asymmetry over entire season: 1.58 ± 0.84) (9, 12) are altered 72 h after a competitive season (36) and 48 h (9) after soccer matches. Majano et al. (12) (72 h after soccer matches) did not represent altered data for Tsk asymmetries.
While a study investigating ≤ 3 soccer games showed a positive relationship between IRT related parameters and CK (4), a finding which is further supported by a single case study (3), the study of de Carvalho (9) indicated no relationship between CK and IRT related parameter (48 h after soccer matches: mean r = 0.07, no p-values available) (9). We can only speculate on the reasons for this difference, but the study of de Carvalho (9) exclusively included thermographic images in the data analysis that exhibited Tsk asymmetries of ≥1.0°C, while e.g., Majano et al. (12) utilized a Tsk of 0.5°C to distinguish between athletes indicating a high or low Tsk response. While it was previously argued to use Tsk asymmetries of ≥1.0°C as abnormal side-to-side difference (5, 25, 41), due to advancements in IRT device accuracy, nowadays a lower temperature difference is often used (25).
Two studies (9, 12) assessed relationship between Tsk related parameters and subjective load parameters such as perception of pain, recovery, stress or rest. One (12) out of two showed a relationship between subjective parameters. Majano et al. (12) reported positive correlations between mean skin temperature and muscle soreness (central upper thigh, outer front thigh: r = 0.230, p ≤ 0.05, respectively), RPE (knee: r = 0.209, p ≤ 0.05) and stress (ankle: r = 0.153, p ≤ 0.01) as well as for thermal asymmetry between bilateral ROIs and muscle soreness (outer front thigh: r = 0.234, p ≤ 0.05; front adductor: r = 0.174, p ≤ 0.01) and RPE (knee: r = 0.242, p ≤ 0.05). They indicated negative correlations between mean skin temperature and rest (inner back leg: r = −0.202, p ≤ 0.05; knee: r = −0.201, p ≤ 0.05), as well as between thermal asymmetry in bilateral ROIs and rest quality (outer upper thigh: r = −0.172, p ≤ 0.01) and RPE (central front thigh: r = −0.181, p ≤ 0.01) (12). While we can only speculate on the reasons for this difference, Carvalho et al. (9) exclusively included athletes who reported pain scores above a threshold of 4, while the study of Majano did not use a threshold for pain scores (12). The difference in the used thresholds for pain scores in the studies (9, 12) could explain the different results.
A strong correlation between Tsk asymmetries and rate of force development assessed using a countermovement jump (mean r = 0.66, mean r2 = 0.44, mean p = 0.04) were examined following a competitive soccer season (36). The same study did not find relationships between the calculated impulse and peak force.
Collectively, but taken into consideration that literature is scarce, studies show that IRT related parameters are altered following a (partial) soccer season, which is in line with literature investigating IRT related parameters response to ≤3 soccer games. IRT related parameters seem to have a relationship with internal load such as subjective parameters and RFD measured by CMJs in studies investigating a (partial) soccer season. Interestingly, relationships between CK and IRT related parameters could not be established in studies investigating a (partial) soccer season, which could be due to different methodological approaches. However, as literature is scarce, more research is needed on the response of IRT related parameters and their relationship with internal load parameters.
4.2 (Half-)marathon
2 out of 2 studies showed elevations in IRT related parameters [Differences in mean skin temperature and ROIs (38, 39)], 24 h after a (half-)marathon in upper and/or lower leg muscles compared to time points prior to the competition (i.e., 48 h prior or 15 days prior) (38, 39).
Relationships between IRT related parameters and CK are non-conclusive following a (half-)marathon. While one study (38) showed a relationship between mean Tsk and CK (24 h post and average of 24 and 48 h post half-marathon, respectively; posterior upper limb: r = 0.5, p = 0.04) after a half-marathon, another could not identify a relationship between differences in mean Tsk and CK (p > 0.21) 24 h after exercise cessation (39). While we can only hypothesize on the reasons for the absence of a relationship in the study of Rojas-Valverde (39), Pérez-Guarner et al. (38) collected IRT related parameter data 24 and 48 h before a half-marathon, whereas Rojas-Valverde (39) analyzed IRT related parameter data from 15 days prior to a marathon.
Additionally, the hot environment in the study of Rojas-Valverde et al. (39) could confound Tsk results. There is evidence indicating that hot conditions may impair physiological responses (42), suggesting that Tsk could also be affected. Future research is required to understand how environmental conditions could impact Tsk responses.
Mean Tsk indicated a relationship with perception of overall pain (48 h post and average of 24 and 48 h post half-marathon: r = 0.6, p < 0.01) (38). Other analysis of the herein included articles did not show a relationship of mean Tsk with lactate dehydrogenase (39), glutamate oxaloacetate transaminase, fatigue, and CMJ height (38) following a (half-)marathon.
Collectively, there is evidence that IRT related parameters are altered 24 h after a (half-)marathon, yet synthetization of relationships with other internal load parameters is impaired due to low number of studies with different methodological approaches.
4.3 Combat sports
Two studies (7, 37) investigated IRT related parameters following combat sports and their relationship with other internal load parameters are difficult to summarize as they use different methodological approaches (e.g., measured IRT related parameters, internal load parameters, exercises).
Out of all studies in this review, the study of Brito et al. (7) reported different skin thermal patterns denoted as “spots” (SPT) and “localized” (LOC). The study showed lower temperatures for SPT and LOC immediately post training (7).
The study of Gomes Moreira et al. shows that skin temperature changes differ with respect to the region of interest in the minutes after cessation of exercise (37). While 7 regions of interest show an increase in skin temperature following 5 min of exercise (without an increase of mean skin temperature), 15 min post exercise 19 out of 26 regions of interest show a significant decrease in temperature (37). Gomes Moreira et al. thereby argues that post-training epithelial temperature is sensitive to organic variations and proposes that IRT related parameters can be applied as an indication of the intensity exerted after exertion (37), yet more studies are required to strengthen this assumption.
One of the main results of Brito et al. (7) is that skin thermal pattern, and not body skin temperature, defined by the equation of Ramanathan (43), correlates with internal load parameters. Specifically, Brito et al. (7) showed that a spotted skin pattern has a lower skin temperature (p = 0.016), blood leukocytes and neutrophils concentration (p ≤ 0.001) post-training compared to a localized skin thermal pattern. While skin thermal patterns have been investigated in other studies with athletic populations e.g., during exercise (44, 45), Brito et al. (7) acknowledges that more studies are needed which investigate the relationship between skin thermal pattern and immune response following exercise.
The main result of the study of Gomes Moreira et al. (37) shows that concentration of blood lactate at the end of a judo specific incremental test can be explained by the mean Tsk variation 5 (r = 0.66, p = 0.001) and 10 min (r = 0.55, p = 0.001) after the test. While literature is scarce, further investigations in athletic populations are needed, IRT related parameters could be useful to determine lactate post exercise non-invasively.
4.4 Other sports
Following a non-specific treadmill test, sprint and endurance athletes showed lower mean Tsk immediately after, (Tsk change in%; endurance group: −5.42 at 0 min, −0.32 at 5 min; sprinter group: −2.20 at 0 min) and a rise in mean Tsk 30 min post exercise (Tsk change in%; endurance group: 2.36 at 30 min, sprinter group: 1.36 at 30 min) (35). After treadmill testing, IRT related parameters indicated a relationship with lactate between the 10th and 30th minute after the testing (r ranging from −0.54 to −0.45, p < 0.05), but no relationship with ammonia (35).
In a training camp, triathletes showed an increase in all ROIs (Tsk change in%, e.g., knee: after 24 h: 3.17, after 48 h: 3.52; posterior leg: after 24 h: 0.68, 48 h: 2.05). IRT related parameters indicated an inverse relationship with the perception of knee fatigue (differences in knee fatigue and anterior knee Tsk: R2 = 0.5, p = 0.03) after two days of training, while no relationships were indicated with perception of pain and overall fatigue (40).
During a 10 day training camp in sprinters which included not further specified “very high intensity and low volume training”, a study noted a significant, continuous decrease in IRT related parameters (skin temperature) measured in the morning and evening for both genders (baseline: males 33.7 ± 0.4°C, females 32.8 ± 0.6°C; day 4: males 32.7 ± 0.3°C, females 31.8 ± 0.6°C, p < 0.05) (34). This downward trend persisted in males from day 6 till the end of the study and females from day 8 to the 10th day (p < 0.01) (34). While the authors (34) indicated an increase in CK concentration in male and female athletes on day two (p < 0.01) and a second CK concentration increase in male athletes between day 8 and 11 (p < 0.01), they did not exhibit a correlation between IRT related parameter and CK.
4.5 Limitations
This systematic review highlighted concerns about the lack of well-designed, and appropriately reported research in this field as indicated by our risk of bias assessment, as several studies neglected to provide transparent and complete information on methodological standardization. In accordance with Fernández-Cuevas et al. (25) and Moreira et al. (23), appropriate measurements, adherence to operational standards and consistent reporting are essential to ensure the interpretability of data across studies. As systematic reviews rely on the available research, this inconsistency in reporting represents a notable limitation. An additional limitation is the exclusion of studies involving participants under the age of 18, which may have led to the omission of insightful research. This exclusion criterion was established before the search process due to the potential influence of puberty on skin temperature (26). Accordingly, further research is required to investigate post-exercise skin temperature variations across different age groups, as suggested by Fernández-Cuevas et al. (25). Finally, our results only allow limited conclusions regarding the applicability of IRT to assess internal load in sports practice due to an inconsistency in employed methodological approaches (e.g., in assessed IRT parameters, blood-based parameters) and more research is needed which elucidated physiological mechanisms resulting in an alteration in IRT related parameters.
4.6 Recommendations for future research
The present review reveals that more studies are being performed on the use of IRT to assess internal load in different athletic populations since 2019 and that different IRT related parameters are altered following training and/or competition in athletic populations. Physiological mechanisms explaining IRT alterations in athletic populations following training and/or competition are not fully elucidated and need further investigations. From a physiological perspective, micro-damage to muscle cells leads to the release of damage-associated molecular patterns that stimulates resident cells to produce pro-inflammatory mediators (14). These mediators induce vasodilation and alter vessel permeability, increasing blood flow and promote edema (14). Additionally, stimulated endothelial cells express cell adhesion molecules and produce chemoattractant mediators, leading to the infiltration of leukocytes (14, 17, 46). The accumulation of leukocytes is a significant source of cytokines such as TNF-α, interleukin-1β and interleukin-6 (17). Research suggest that these cytokines exhibit pyrogenic properties (47, 48). In consequence, the primary inflammatory responses stimulate phagocytosis and the activation of the complement system to augment tissue repair (14, 16, 17, 46, 49, 50). These pathways may enhance local metabolic rates, substrate utilization, and energy generation, facilitating heat transfer from deeper tissue layers to the body surface, ultimately raising skin temperature (3, 6, 8, 33). Consequently, especially inflammatory parameters (such as CRP, pentraxin-3, prostaglandins, interleukins, TNF-α) (14–16, 49, 51, 52) need to be assessed in future studies.
As some studies in our review did not describe external load to which athletes were exposed in detail, comparisons between studies are impaired. To better compare future studies, we recommend researchers to report details on performed exercises which (depending on the sport) e.g., can include derivatives of GPS-data such as velocity, or accelerations. Additionally, future studies should control or at least report potential effect of factors known to confound IRT, such as food intake prior to image taking (25, 53), or body mass index (54). Our review reveals that different parameters can be calculated from IRT, including e.g., differences of mean Tsk, Tsk asymmetry, calculations of entire body skin temperature. While it is currently still unclear which IRT related parameters has the best relationships with other internal load parameters, it seems recommendable to assess and report a variety of IRT related parameters. To advance our understanding, we recommend also to report such relationships between IRT related parameters and other internal load variables if the relationship is non-existing.
5 Conclusions
Quantifying internal loads holds a key role to individualize training procedures, yet is often impaired e.g., due to invasiveness of methodological approaches, a limitation which might be overcome by IRT related parameters. Our systematic review reveals that the majority of relevant studies showed a decrease in IRT related parameters within 15 min, while increases in IRT related parameters are reported following 30 min, 24 h, 48 h, and 72 h after exercise cessation. Synthetization of the literature regarding relationship of IRT related parameters with other internal load parameters is impaired due to variety in used methodologies and is thereby non-conclusive across different sports. Future studies should carefully follow established recommendations to standardize IRT analyses and available literature. It seems recommendable to investigate the relationships with parameters known to elicit temperature in more detail. Athletes and coaches might detect changes in IRT related parameters following exercise cessation, but detailed physiological mechanisms leading to such change are currently unclear and it seems recommendable to use IRT parameters in conjunction with other load parameters.
Data availability statement
The original contributions presented in the study are included in the article/Supplementary Material, further inquiries can be directed to the corresponding author.
Author contributions
LM: Data curation, Software, Visualization, Writing – original draft, Writing – review & editing, Funding acquisition, Investigation. FB: Conceptualization, Resources, Writing – review & editing. PD: Project administration, Supervision, Validation, Writing – review & editing.
Funding
The author(s) declare financial support was received for the research, authorship, and/or publication of this article. We acknowledge funding for the open access publication fees by the TU Braunschweig.
Conflict of interest
The authors declare that the research was conducted in the absence of any commercial or financial relationships that could be construed as a potential conflict of interest.
Publisher's note
All claims expressed in this article are solely those of the authors and do not necessarily represent those of their affiliated organizations, or those of the publisher, the editors and the reviewers. Any product that may be evaluated in this article, or claim that may be made by its manufacturer, is not guaranteed or endorsed by the publisher.
Supplementary material
The Supplementary Material for this article can be found online at: https://www.frontiersin.org/articles/10.3389/fspor.2024.1479608/full#supplementary-material
References
1. Schwellnus M, Soligard T, Alonso J-M, Bahr R, Clarsen B, Dijkstra HP, et al. How much is too much? (part 2) international Olympic committee consensus statement on load in sport and risk of illness. Br J Sports Med. (2016) 50:1043–52. doi: 10.1136/bjsports-2016-096572
2. Ammer K. The glamorgan protocol for recording and evaluation of thermal images of the human body. Thermol Int. (2008) 18:125–44.
3. de Andrade Fernandes A, Pimenta EM, Moreira DG, Sillero-Quintana M, Marins JCB, Morandi RF, et al. Effect of a professional soccer match in skin temperature of the lower limbs: a case study. J Exerc Rehabil. (2017) 13:330–4. doi: 10.12965/jer.1734934.467
4. de Andrade Fernandes A, Pimenta EM, Moreira DG, Sillero-Quintana M, Marins JCB, Morandi RF, et al. Skin temperature changes of under-20 soccer players after two consecutive matches. Sport Sci Health. (2017) 13:635–43. doi: 10.1007/s11332-017-0394-1
5. Barnes RB. Thermography of the human body. Science. (1963) 140:870–7. doi: 10.1126/science.140.3569.870
6. Bradford CD, Cotter JD, Thorburn MS, Walker RJ, Gerrard DF. Exercise can be pyrogenic in humans. Am J Physiol Regul Integr Comp Physiol. (2007) 292:R143–9. doi: 10.1152/ajpregu.00926.2005
7. Brito CJ, Moreira DG, Ferreira JJ, Díaz-de-Durana AL, Miarka B, Marins JCB, et al. Immune response related with skin thermal pattern in judokas: a new application for infrared thermography? J Strength Cond Res. (2020) 34:2886–94. doi: 10.1519/JSC.0000000000002672
8. Całkosiński I, Dobrzyński M, Rosińczuk J, Dudek K, Chrószcz A, Fita K, et al. The use of infrared thermography as a rapid, quantitative, and noninvasive method for evaluation of inflammation response in different anatomical regions of rats. Biomed Res Int. (2015) 2015:972535. doi: 10.1155/2015/972535
9. de Carvalho G, Girasol CE, Gonçalves LGC, Guirro ECO, de Jesus GR. Correlation between skin temperature in the lower limbs and biochemical marker, performance data, and clinical recovery scales. PLoS One. (2021) 16:e0248653. doi: 10.1371/journal.pone.0248653
10. Cooper C, Booth A, Varley-Campbell J, Britten N, Garside R. Defining the process to literature searching in systematic reviews: a literature review of guidance and supporting studies. BMC Med Res Methodol. (2018) 18:85. doi: 10.1186/s12874-018-0545-3
11. dos Santos Bunn P, Miranda MEK, Rodrigues AI, de Souza Sodré R, Neves EB, Da Bezerra Silva E. Infrared thermography and musculoskeletal injuries: a systematic review with meta-analysis. Infrared Phys Technol. (2020) 109:103435. doi: 10.1016/j.infrared.2020.103435
12. Majano C, Garcia-Unanue J, Fernández-Cuevas I, Escamilla-Galindo V, Alonso-Callejo A, Sanchez-Sanchez J, et al. Association between physical demands, skin temperature and wellbeing status in elite football players. Sci Rep. (2023) 13:13780. doi: 10.1038/s41598-023-40396-y
13. Marins JCB, Fernandes AA, Cano SP, Moreira DG, Da Silva FS, Costa CMA, et al. Thermal body patterns for healthy Brazilian adults (male and female). J Therm Biol. (2014) 42:1–8. doi: 10.1016/j.jtherbio.2014.02.020
14. Alessandri AL, Sousa LP, Lucas CD, Rossi AG, Pinho V, Teixeira MM. Resolution of inflammation: mechanisms and opportunity for drug development. Pharmacol Ther. (2013) 139:189–212. doi: 10.1016/j.pharmthera.2013.04.006
15. Du Clos TW. Function of C-reactive protein. Ann Med. (2000) 32:274–8. doi: 10.3109/07853890009011772
16. Serhan CN, Savill J. Resolution of inflammation: the beginning programs the end. Nat Immunol. (2005) 6:1191–7. doi: 10.1038/ni1276
17. Peake JM, Neubauer O, Della Gatta PA, Nosaka K. Muscle damage and inflammation during recovery from exercise. J Appl Physiol (1985). (2017) 122:559–70. doi: 10.1152/japplphysiol.00971.2016
18. Hillen B, Pfirrmann D, Nägele M, Simon P. Infrared thermography in exercise physiology: the dawning of exercise radiomics. Sports Med. (2020) 50:263–82. doi: 10.1007/s40279-019-01210-w
19. Chudecka M, Lubkowska A. Temperature changes of selected body’s surfaces of handball players in the course of training estimated by thermovision, and the study of the impact of physiological and morphological factors on the skin temperature. J Therm Biol. (2010) 35:379–85. doi: 10.1016/j.jtherbio.2010.08.001
20. Chudecka M, Lubkowska A. The use of thermal imaging to evaluate body temperature changes of athletes during training and a study on the impact of physiological and morphological factors on skin temperature. Hum Mov. (2012) 13:33–9. doi: 10.2478/v10038-012-0002-9
21. Gómez-Carmona P, Fernández-Cuevas I, Sillero-Quintana M, Arnaiz-Lastras J, Navandar A. Infrared thermography protocol on reducing the incidence of soccer injuries. J Sport Rehabil. (2020) 29:1222–7. doi: 10.1123/jsr.2019-0056
22. Côrte AC, Pedrinelli A, Marttos A, Souza IFG, Grava J, José Hernandez A. Infrared thermography study as a complementary method of screening and prevention of muscle injuries: pilot study. BMJ Open Sport Exerc Med. (2019) 5:e000431. doi: 10.1136/bmjsem-2018-000431
23. Moreira DG, Costello JT, Brito CJ, Adamczyk JG, Ammer K, Bach AJE, et al. Thermographic imaging in sports and exercise medicine: a delphi study and consensus statement on the measurement of human skin temperature. J Therm Biol. (2017) 69:155–62. doi: 10.1016/j.jtherbio.2017.07.006
24. McKay AKA, Stellingwerff T, Smith ES, Martin DT, Mujika I, Goosey-Tolfrey VL, et al. Defining training and performance caliber: a participant classification framework. Int J Sports Physiol Perform. (2022) 17:317–31. doi: 10.1123/ijspp.2021-0451
25. Fernández-Cuevas I, Bouzas Marins JC, Arnáiz Lastras J, Gómez Carmona PM, Piñonosa Cano S, García-Concepción MÁ, et al. Classification of factors influencing the use of infrared thermography in humans: a review. Infrared Phys Technol. (2015) 71:28–55. doi: 10.1016/j.infrared.2015.02.007
26. Kolosovas-Machuca ES, González FJ. Distribution of skin temperature in Mexican children. Skin Res Technol. (2011) 17:326–31. doi: 10.1111/j.1600-0846.2011.00501.x
27. Moher D, Liberati A, Tetzlaff J, Altman DG. Preferred reporting items for systematic reviews and meta-analyses: the PRISMA statement. Ann Intern Med. (2009) 151:264–9, W64. doi: 10.7326/0003-4819-151-4-200908180-00135
28. Teixeira JE, Forte P, Ferraz R, Branquinho L, Silva AJ, Monteiro AM, et al. Integrating physical and tactical factors in football using positional data: a systematic review. PeerJ. (2022) 10:e14381. doi: 10.7717/peerj.14381
29. Saidi K, Abderrahman AB, Hackney AC, Bideau B, Zouita S, Granacher U, et al. Hematology, hormones, inflammation, and muscle damage in elite and professional soccer players: a systematic review with implications for exercise. Sports Med. (2021) 51:2607–27. doi: 10.1007/s40279-021-01522-w
30. Whiting PF, Rutjes AWS, Westwood ME, Mallett S, Deeks JJ, Reitsma JB, et al. QUADAS-2: a revised tool for the quality assessment of diagnostic accuracy studies. Ann Intern Med. (2011) 155:529–36. doi: 10.7326/0003-4819-155-8-201110180-00009
31. Giurgiu M, Kolb S, Nigg C, Burchartz A, Timm I, Becker M, et al. Assessment of 24-hour physical behaviour in children and adolescents via wearables: a systematic review of free-living validation studies. BMJ Open Sport Exerc Med. (2022) 8:e001267. doi: 10.1136/bmjsem-2021-001267
32. Whiting PF, Weswood ME, Rutjes AWS, Reitsma JB, Bossuyt PNM, Kleijnen J. Evaluation of QUADAS, a tool for the quality assessment of diagnostic accuracy studies. BMC Med Res Methodol. (2006) 6:9. doi: 10.1186/1471-2288-6-9
33. Duarte W, Rodrigues Júnior JL, Paula LV, Chagas MH, Andrade AGP, Veneroso CE, et al. C-Reactive protein and skin temperature of the lower limbs of Brazilian elite soccer players like load markers following three consecutive games. J Therm Biol. (2022) 105:103188. doi: 10.1016/j.jtherbio.2022.103188
34. Korman P, Kusy K, Kantanista A, Straburzyńska-Lupa A, Zieliński J. Temperature and creatine kinase changes during a 10d taper period in sprinters. Physiol Meas. (2021) 42:124001. doi: 10.1088/1361-6579/ac3d76
35. Korman P, Kusy K, Straburzyńska-Lupa A, Kantanista A, Quintana MS, Zieliński J. Response of skin temperature, blood ammonia and lactate during incremental exercise until exhaustion in elite athletes. Sci Rep. (2024) 14:2237. doi: 10.1038/s41598-024-52374-z
36. Rodrigues Júnior JL, Duarte W, Falqueto H, Andrade AGP, Morandi RF, Albuquerque MR, et al. Correlation between strength and skin temperature asymmetries in the lower limbs of Brazilian elite soccer players before and after a competitive season. J Therm Biol. (2021) 99:102919. doi: 10.1016/j.jtherbio.2021.102919
37. Gomes Moreira D, José Brito C, de Almeida Ferreira JJ, Bouzas Marins JC, de López Díaz Durana A, Couceiro Canalejo J, et al. Lactate concentration is related to skin temperature variation after a specific incremental judo test. J Strength Cond Res. (2021) 35:2213–21. doi: 10.1519/JSC.0000000000003095
38. Pérez-Guarner A, Priego-Quesada JI, Oficial-Casado F, Cibrián Ortiz de Anda RM, Carpes FP, Palmer RS. Association between physiological stress and skin temperature response after a half marathon. Physiol Meas. (2019) 40:34009. doi: 10.1088/1361-6579/ab0fdc
39. Rojas-Valverde D, Gutiérrez-Vargas R, Sánchez-Ureña B, Gutiérrez-Vargas JC, Priego-Quesada JI. Relationship between skin temperature variation and muscle damage markers after a marathon performed in a hot environmental condition. Life (Basel). (2021) 11:725. doi: 10.3390/life11080725
40. Priego-Quesada JI, Oficial-Casado F, Gandia-Soriano A, Carpes FP. A preliminary investigation about the observation of regional skin temperatures following cumulative training loads in triathletes during training camp. J Therm Biol. (2019) 84:431–8. doi: 10.1016/j.jtherbio.2019.07.035
41. Feldman F, Nickoloff EL. Normal thermographic standards for the cervical spine and upper extremities. Skeletal Radiol. (1984) 12:235–49. doi: 10.1007/BF00349505
42. No M, Kwak H-B. Effects of environmental temperature on physiological responses during submaximal and maximal exercises in soccer players. Integr Med Res. (2016) 5:216–22. doi: 10.1016/j.imr.2016.06.002
43. Ramanathan NL. A new weighting system for mean surface temperature of the human body. J Appl Physiol. (1964) 19:531–3. doi: 10.1152/jappl.1964.19.3.531
44. Ludwig N, Trecroci A, Gargano M, Formenti D, Bosio A, Rampinini E, et al. Thermography for skin temperature evaluation during dynamic exercise: a case study on an incremental maximal test in elite male cyclists. Appl Opt. (2016) 55:D126–30. doi: 10.1364/AO.55.00D126
45. Merla A, Mattei PA, Di Donato L, Romani GL. Thermal imaging of cutaneous temperature modifications in runners during graded exercise. Ann Biomed Eng. (2010) 38:158–63. doi: 10.1007/s10439-009-9809-8
46. Peake JM, Suzuki K, Wilson G, Hordern M, Nosaka K, Mackinnon L, et al. Exercise-induced muscle damage, plasma cytokines, and markers of neutrophil activation. Med Sci Sports Exerc. (2005) 37:737–45. doi: 10.1249/01.MSS.0000161804.05399.3B
47. Vybíral S, Bárczayová L, Pešanová Z, Janský L. Pyrogenic effects of cytokines (IL-1β, IL- 6, TNF-α) and their mode of action on thermoregulatory centers and functions. J Therm Biol. (2005) 30:19–s. doi: 10.1016/j.jtherbio.2004.06.003
48. Dinarello CA, Cannon JG, Wolff SM, Bernheim HA, Beutler B, Cerami A, et al. Tumor necrosis factor (cachectin) is an endogenous pyrogen and induces production of interleukin 1. J Exp Med. (1986) 163:1433–50. doi: 10.1084/jem.163.6.1433
49. Du Clos TW. Pentraxins: structure, function, and role in inflammation. ISRN Inflamm. (2013) 2013:379040. doi: 10.1155/2013/379040
50. Du Clos TW. C-reactive protein reacts with the U1 small nuclear ribonucleoprotein. The J Immunol. (1989) 143:2553–9. doi: 10.4049/jimmunol.143.8.2553
51. Caprio V, Badimon L, Di Napoli M, Fang W-H, Ferris GR, Guo B, et al. pCRP-mCRP dissociation mechanisms as potential targets for the development of small-molecule anti-inflammatory chemotherapeutics. Front Immunol. (2018) 9:1089. doi: 10.3389/fimmu.2018.01089
52. Braig D, Nero TL, Koch H-G, Kaiser B, Wang X, Thiele JR, et al. Transitional changes in the CRP structure lead to the exposure of proinflammatory binding sites. Nat Commun. (2017) 8:14188. doi: 10.1038/ncomms14188
53. Shlygin GK, Lindenbraten LD, Gapparov MM, Vasilevskaia LS, Ginzburg LI, Sokolov AI. Radiotermometricheskoe issledovanie tkaneĭ v nachal'nyĭ reflektornyĭ period spetsificheskogo dinamicheskogo deĭstviia pishchi. Med Radiol (Mosk). (1991) 36:10–2.2034096
Keywords: individualization, precision training, muscle, inflammation, signature
Citation: Masur L, Brand F and Düking P (2024) Response of infrared thermography related parameters to (non-)sport specific exercise and relationship with internal load parameters in individual and team sport athletes—a systematic review. Front. Sports Act. Living 6:1479608. doi: 10.3389/fspor.2024.1479608
Received: 12 August 2024; Accepted: 8 October 2024;
Published: 13 December 2024.
Edited by:
Pedro Forte, Higher Institute of Educational Sciences of the Douro, PortugalReviewed by:
José Eduardo Teixeira, Instituto Politécnico da Guarda, PortugalNadhir Hammami, University of Jendouba, Tunisia
Copyright: © 2024 Masur, Brand and Düking. This is an open-access article distributed under the terms of the Creative Commons Attribution License (CC BY). The use, distribution or reproduction in other forums is permitted, provided the original author(s) and the copyright owner(s) are credited and that the original publication in this journal is cited, in accordance with accepted academic practice. No use, distribution or reproduction is permitted which does not comply with these terms.
*Correspondence: Lukas Masur, bHVrYXMubWFzdXJAdHUtYnJhdW5zY2h3ZWlnLmRl