 Heather K. Vincent1*†Kyle Coffey1Aiden Villasuso2
 Kevin R. Vincent1,†Sharareh Sharififar1Lydia Pezzullo1
 Ryan M. Nixon1,†
- 1Exercise and Functional Fitness Laboratory, Department of Physical Medicine and Rehabilitation, University of Florida, Gainesville, FL, United States
- 2Department of Applied Physiology and Kinesiology, University of Florida, Gainesville, FL, United States
Introduction: Foot strike pattern is often associated with running related injury and the focus of training and rehabilitation for athletes. The ability to modify foot strike pattern depends on awareness of foot strike pattern before being able to attempt change the pattern. Accurate foot strike pattern detection may help prevent running related injury (RRI) and facilitate gait modifications and shoe transitions. The purposes of this study were to determine the accuracy of self-reported foot strike pattern among endurance runners, to identify what factors were predictive of accurate foot strike detection and recent RRI.
Methods: This was a retrospective, cross-sectional study which included endurance runners (N = 710; 51.5% female; 35.4 ± 15.5 years; 51.6% were training competitively at the time of testing) with different running injury histories. Runners self-reported foot strike pattern [rearfoot, non-rearfoot (mid or forefoot), or “don't know”] and information about shoewear specifics. All runners performed a single session of running at self-selected speed on an instrumented treadmill with 3D motion capture and high-speed filming that verified actual foot strike. Logistic regression was used to predict accuracy of foot strike detection and RRI.
Results: Overall accuracy of foot strike detection was low (42.7%; p < 0.01). Self-reported foot strike was 28.3% for rearfoot, 47.0% for nonrearfoot forefoot strike and 24.6% did not know. Biomechanical analyses actually showed that 34% of rearfoot strikers accurately detected rearfoot strike, while 69.5% of non-rearfoot strikers self-reported accurate non-rearfoot strike (p < 0.05). Runners who “did not know” their strike had the highest prevalence of RRI compared to runners who self-reported nonrearfoot or rearfoot strike (73% vs. 56% and 58%; p < .001). After accounting for several variables, shoe heel-to-toe drop was a consistent predictor of accurate strike detection [OR = 0.93 (0.88–0.99); p = 0.026] and RRI in last six months [OR = 1. 1 (1.01–1.17); p = 0.018]. RRI were also predicted by recent shoe change [OR = 2.8 (1.7–4.6); p < 0.001].
Discussion: Accurate detection of actual foot strike by endurance runners varies by the actual foot strike type determined during testing and is associated shoe characteristics. These findings demonstrate the importance of accurately identifying foot strike pattern and recommending footwear as a factor if planning to use retraining to alter foot strike pattern.
1 Introduction
Foot strike patterns during running have garnered considerable attention over the last 15 years as potential contributors to running related injury (RRI) and economy. In general, rearfoot strike pattern occurs when initial foot contact is made on the heel or rear one-third of the foot, whereas nonrearfoot striking involves initial contact on the front half of the foot that may be followed by heel contact (1). Among recreational and competitive runners, the predominant foot strike type is rearfoot, with lower prevalence in the nonrearfoot or mixed strike patterns (2–4). It has been suggested that foot strike pattern affects the mechanical properties and functioning of the lower extremity joints such as the ankle, knee and hip, and soft tissue complexes such as the gastrocnemius-Achilles tendon (5–7). Low quality evidence also suggests that foot strike pattern may be associated with running-related injuries (RRI) but this relationship is still evolving (8). Foot strike pattern has the potential to influence how forces are absorbed and disseminated along the kinetic chain. Both rearfoot strike and forefoot strike may be related to specific injuries depending on the study (9). The combination of foot strike pattern and loading responses to repetitive collisions with the ground (ground reaction force, load rate) (10, 11), coupled with kinematic features of running (12, 13) can stimulate beneficial or deleterious changes in soft tissue and bone depending on the mechanical and force-generating factors. Cross sectional and prospective evidence suggests that RRI prevalence is high, ranging from 49% to 92% depending on the study (14–17). Further, it has been reported that rearfoot strikers have running-related repetitive injury prevalence that is twice that of forefoot strikers, and lower variability of foot contact angle which may amplify localized tissue loading RRI risk (18).
One common practice to address RRI as part of a gait retraining approach is to adjust foot strike and potentially modify stresses along the kinetic chain (6, 19–21). Typically, foot strike change involves shifting from rearfoot to non-rearfoot pattern in an attempt to mitigate vertical loading rates, to offload mechanical stresses along the lower extremity, to prepare for transition to minimalist shoes, or to improve contraction of posterior leg muscles and mechanical efficiency (6, 19, 20, 22). The strategy of promoting a non-rearfoot strike pattern is founded on the potential of improving a number of mechanical parameters such as tibial acceleration, patellofemoral stress, ankle joint stiffness, average vertical loading rate, and peak loading rate (22–25). However, in addition to the possibility that there are beneficial effects to adopting a nonrearfoot strike pattern, whether such a strategy can in fact be part of gait retraining is dependent on whether runners are aware of their running pattern before they attempt to modify their pattern. Our anecdotal observations of over two thousand runners in our running medicine program have revealed that runners who have not purposefully attended to their gait form, have never had form evaluated and who have never seen themselves run are not often accurate with estimating how they interact with the ground. This observation, important to both patients and clinicians, contributed in part to the development of this research question that addresses a large gap in the literature: determining the relationship between foot strike detection accuracy and the prevalence of RRI.
Extrinsic factors, such as running shoe characteristics, can modulate the interaction of the foot with the ground and thereby influencing foot strike pattern (26, 27). Shoe features such as weight, heel height, midsole cushion and heel-to-toe drop and material properties can affect lower limb posture and dynamics, particularly at initial collision, or by altering stance time (28, 29). Shoe selection has been associated with foot strike pattern in some investigations, where “minimal” style of shoes promote a more non-rearfoot initial contact than traditional running shoes, which promote more ankle dorsiflexion and knee flexion at initial contact (27, 30). Systematic reviews indicate that increased shoe sole thickness may also decrease plantar sensation (31) which can make it more challenging for runners to be aware of, or adjust foot strike pattern due to attenuation of afferent feedback during loading.
The primary purpose of this study was to determine the accuracy of self-reported foot strike pattern among endurance runners, and the secondary purpose was to identify what individual and shoe wear factors were predictive of accurate foot strike detection and recent RRI. It was hypothesized that (1) the overall foot strike detection accuracy would be low, particularly among rearfoot striking runners who wear shoes with high heel height or relatively high heel-to-toe drop, and (2) runners who did not accurately detect foot strike pattern would report higher prevalence of RRI than accurate detectors.
2 Materials and methods
2.1 Study design
The study design was a retrospective cross-sectional. This study and all its procedures followed the guidelines for the Declaration of Helsinki's Protection of Human Subjects and was approved by the University of Florida Institutional Review Board (#202401340). The recommended format for observational studies, described by the statement in strengthening the reporting of observational studies in epidemiology (STROBE), is used here (32). The Study Flow Diagram is shown in Figure 1.
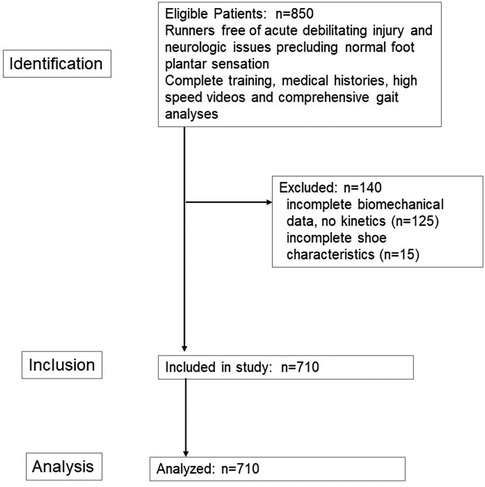
Figure 1. STROBE study flow diagram for observational studies.
2.2 Setting
The Exercise and Functional Fitness Laboratory is located in a quaternary health care facility. Data from all runners who obtained running analyses for performance and injury prevention services were pulled for analysis from January 2016 to December 2022.
2.3 Participants
Of all the runners who sought clinical gait services during this time (N = 850) a total of 710 were eligible and had complete data available for analysis. All runners provided written informed consent to allow their data to be stored in our institutional research databank. Inclusion criteria were: aged 12–77 years (spanning from middle school cross country to older master runner), all races and ethnicities, both sexes and different levels of experience. Exclusion criteria were: (1) the presence of any current (at the time of testing) or recent (during the 6 months prior to testing) traumatic debilitating musculoskeletal injury (ankle sprain, hamstring strain, stress fracture or Anterior cruciate ligament rupture); (2) Pre-existing chronic neurological conditions that interfere with normal plantar surface sensitivity or proprioception (conditions such as peripheral neuropathies or previous traumatic damage to nerves innervating the lower extremities). If any runner had a history of a stress fracture related to running, a minimum of 6 months was required to ensure the runner has been medically cleared and was returning to training. All runners had been training to run in a competitive event for running which was a minimum of 20 km per week with the event being a minimum 5 km distance. Minimum average weekly program typical running distance of this population sample was 33.2 ± 2.6 km.
2.3.1 Characteristics
Runner characteristics included the following: demographic and anthropometric characteristics, run training history (volume, type, years of experience), shoe wear, and current training status for competition (yes, no). The make and model of running shoe was collected from each participant and specifications included heel height (cm), heel-to-toe drop (cm) and shoe weight (oz for standard size 9, 10 women's and men's, respectively) (33). Injuries were defined as being the underlying cause of musculoskeletal pain which limited or led to the cessation of running (distance, velocity, duration, or training) for at least 7 days, or interfered with at least three consecutive training sessions, or led to the participants having to consult a physician about the symptoms related to running (34). Information about RRI was collected from each participant including location and type of pain, and whether or not they had experienced any previous RRI within the last 6 months prior to testing. Injuries were classified as either a bony or soft tissue injury.
Based on recommendations to identify injury risks (33), additional questions included: (1) have you purposely tried to change your foot strike over the last 6 months? (yes, no); (2) have you changed your running shoe wear type over the last 6 months? (yes, no); and (3) do you use any additional insert(s) in your shoe? (yes, no). Runners were asked to choose what type of foot strike they perceived they adopt when running. Choices included “rearfoot”, “non-rearfoot” (“mid-foot” or “forefoot”) or “don't know”.
2.4 Instrumentation and data collection
A standard analytic process was performed and select variables were presented at foot strike during the gait cycle, such as sagittal joint angles (35, 36). Motion capture during running at self-selected speed was captured using a high-speed, seven-camera 3D optical motion analysis system (Motion Analysis Corp, Santa Rosa, CA, USA) that sampled at 200 Hz and was synchronized with force plate data collected from an instrumented treadmill (AMTI, Watertown, MA; USA) at 1,200 Hz.
2.4.1 Testing procedure
Retroflective markers were affixed bilaterally over the acromion processes of the shoulders, mid-distance between the acromion and elbow lateral epicondyles (tricep muscle belly), lateral epicondyle of the elbow, mid-distance between lateral epicondyle of elbow and radial styloid process on posterior surface of forearm, mid-distance between styloid processes of radius and ulnar (dorsal wrist), posterior superior iliac spine, anterior superior iliac spine, mid-distance between ASIS and patella (anterior thigh), medial and lateral condyles of the femur, tibial tuberosity, medial and lateral malleoli, calcaneus, lateral to the head of the fifth metatarsal, and medial to the base of the hallux (37). One offset marker was placed on the right scapular inferior angle. Prior to data collection, a static calibration trial was performed to generate the computer model of the runner in the software (Cortex, Motion Analysis Corp, Santa Rosa, CA, USA). The medial knee and ankle markers were removed for all running conditions to prevent the markers from being accidentally knocked off the skin during the testing.
Participants ran for 8 min during an acclimation period at a pace defined as a “pace used for long run distance training”. Kinematic and kinetic data were obtained at this time to ensure that each runner's gait had stabilized. Between minute 9 and 10, a 10-s sample of data was recorded (average of 12–14 strides). Slow-motion videos were also captured for reference in the sagittal and frontal planes (Casio Elixim; Casio America, Inc., Dover, NJ. USA).
2.4.2 Data processing
Marker data were filtered at 9 Hz with a fourth-order, low-pass Butterworth filter. Bone models were created for every runner with an individual center of mass (COM) location using the methods of de Leva et al. (38) using commercially-available software (Visual3D, C-Motion, Inc; Germantown, MD). A complete gait cycle was defined at the commencing with initial foot contact (0%) and completed at the subsequent ground contact of the same foot (100%). A 20N threshold was used to set the initial foot contact and toe-off events (36). Joint angles at initial contact for the ankle, knee, hip and pelvis were also determined (traces provided in Figure 2). Based on the foot markers, the ankle angle at foot strike was calculated as the angle between the foot segment and the ground at initial contact relative to the standing angle. The reference point for joint angles was established at 90° as vertical for the knee and hip and 0° as horizontal for the ankle angle. The pelvis was developed from the anterior and posterior superior iliac spine markers, and the anterior inclination was expressed relative to the horizontal as 0°of anterior tilt (35, 36).
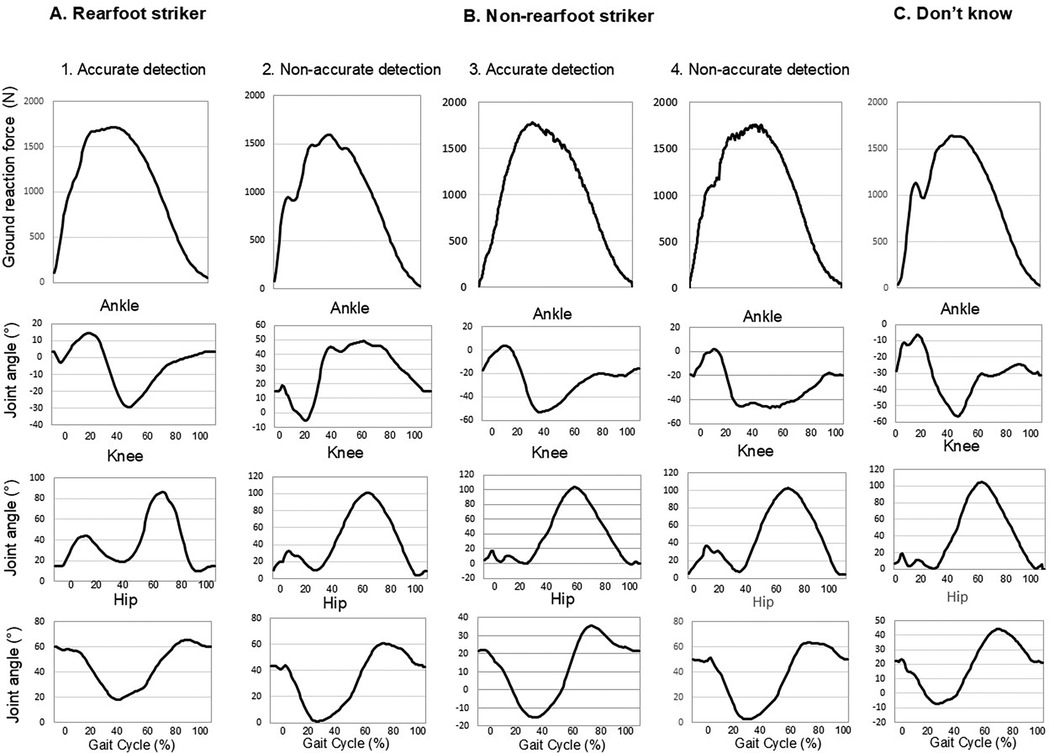
Figure 2. Sample ground reaction force (GRF) curves shown for a runner in each of the five groups during stance (A1) Rearfoot accurate, (A2) Rearfoot non-accurate, (B3) Non-rearfoot accurate, (B4) Non-rearfoot non-accurate and (C) Don't know.) GRF are expressed in N. The serial panels beneath each GRF trace are joint motion curves during an entire gait cycle. GRF and motion values were sampled at 100 Hz.
Temporospatial characteristics including cadence (steps/min−1) and the vertical displacement of the COM (the difference between the minimal and maximal vertical height of the COM during a gait cycle), and stride width (the medial-lateral distance between the proximal end position of the foot at foot strike to the proximal end position of the foot at the next contralateral foot strike) were calculated. Stance time was determined as the time (in seconds) that each foot was in contact with the treadmill. All of the temporospatial data and biomechanical parameters above are provided to demonstrate the consistency of performance of this runner cohort with other published studies. These variables were calculated using commercially available software (Visual3D, C-Motion, Inc; Germantown, MD and MatLab, Mathorks; Natick MA; USA). Bone models were developed for each runner with the individual COM location using the method described by de Leva (38). The marker tracking data from the bone models were used to calculate the temporal spatial parameters and joint angles. Right and left side values for these measures were averaged and reported in the results.
Force data were collected from the instrumented treadmill at a frequency of 1,200 Hz. GRF data were low pass filtered at frequency cutoff of 40 Hz using a 4th order Butterworth filter. The peak vertical component of the peak ground reaction force (GRF). Vertical average loading rate (VALR) was calculated as the angle of the slope for the force-time signal the slope of the ΔF/Δt of the most linear portion of the force curve, where ΔF is the change of vertical force and Δt is the change of time between 20%–80% of the first rise to the initial peak of the vertical GRF (39). When no initial peak was present based on computer-generated tracings, VALR was defined as vertical GRF at 13% of stance (40). Vertical leg stiffness was estimated using the following: Kvert = Fmax/Δy, where Fmax was the peak vertical force and Δy was the maximum vertical displacement of the COM (41) that occurred during the entire gait cycle.
Actual foot strike type pattern for each participant was determined by the initial contact point with the treadmill, using the initial contact angle between the foot segment and the horizontal ground at foot initial contact. A single investigator (HKV) reviewed all the sagittal view of high-speed reference video recordings obtained at 300 fps using a high-speed camera (Casio Elixim; Casio America, Inc., Dover, NJ. USA) and visually confirmed foot strike pattern (9). Rearfoot strike pattern was defined as when the initial point of contact was by the confirmed if the point of initial contact was on the heel or on the rear one third of the plantar surface of the foot, and non-rearfoot strike was defined as when the point of contact at confirmed if the initial contact point was on the front two thirds of the plantar surface of the foot (1).
2.4.3 Runner categorization
Based on the combination of foot strike and accuracy of foot strike detection, runners were then placed into five categories for statistical analysis: Rearfoot accurate, Rearfoot non-accurate, Non-rearfoot accurate, Non-rearfoot non-accurate and Don't know.
2.5 Statistical considerations
Statistical analyses were performed using SPSS version 29.0 (IBM, Armonk NY). Normality of the data (skewness, kurtosis) was confirmed using Shapiro-Wilk tests, and descriptive statistics were calculated for all variables and demographic characteristics. Analyses of covariance (ANCOVA) were performed on the five runner groups to test for differences in demographic, anthropometric and training history continuous variables. Covariates were age and running velocity. Chi-square tests (χ2) were used to determine if there were group differences in categorical variables (demographics, accuracy of foot strike type, RRI by detection accuracy). ANCOVAs were used to test group differences for biomechanical variables, where the between-group factor was foot strike accuracy (Rearfoot accurate, Rearfoot non-accurate, Non-rearfoot accurate, Non-rearfoot non-accurate and Don't know). Covariates were age and running velocity. If significant group differences were detected, Tukey post hoc tests were used to determine where group differences existed. For non-parametric and parametric tests, significance was established at p < 0.05. The eta squared (η2) were provided to show the effect sizes for continuous variables; values of 0.01, 0.06 and 0.14 represented negligible to small, medium and large effects (42).
Logistic regression was used to determine the risk factors which may predict accurate detection of foot strike pattern and history of RRI in the last year. The choice of factors to be entered into the model were based on previous work showing age and BMI affected running biomechanics (36, 43), and on the potential impact of the running shoe characteristics. As such, factors first entered into the model were age and BMI, followed by shoe characteristics (heel height, heel-to-toe drop, weight), responses to ‘Have you tried to change foot strike type? and ‘Have you changed running shoes in the last 6 months?’, and running speed. Odds risk (OR) values were obtained for each variable entered into the regression models. a priori alpha levels were established at 0.05 for all statistical tests.
3 Results
3.1 Runner and shoe characteristics
The key demographics were similar among the five groups of runners based on accuracy of self-reported foot strike pattern (Table 1). The weekly distance, however, was lowest in the non-rearfoot non-accurate group (p = 0.001). The non-rearfoot, accurate strikers used shoe inserts least frequently (p = .005), and wore shoes that had, on average, a lighter weight, lower heel-to-toe drop, and lower heel height than the other groups (all p < 0.05). Fewer runners in the non-rearfoot, accurate group had the lowest prevalence of RRI (p = 0.001). The effect sizes were all considered small.
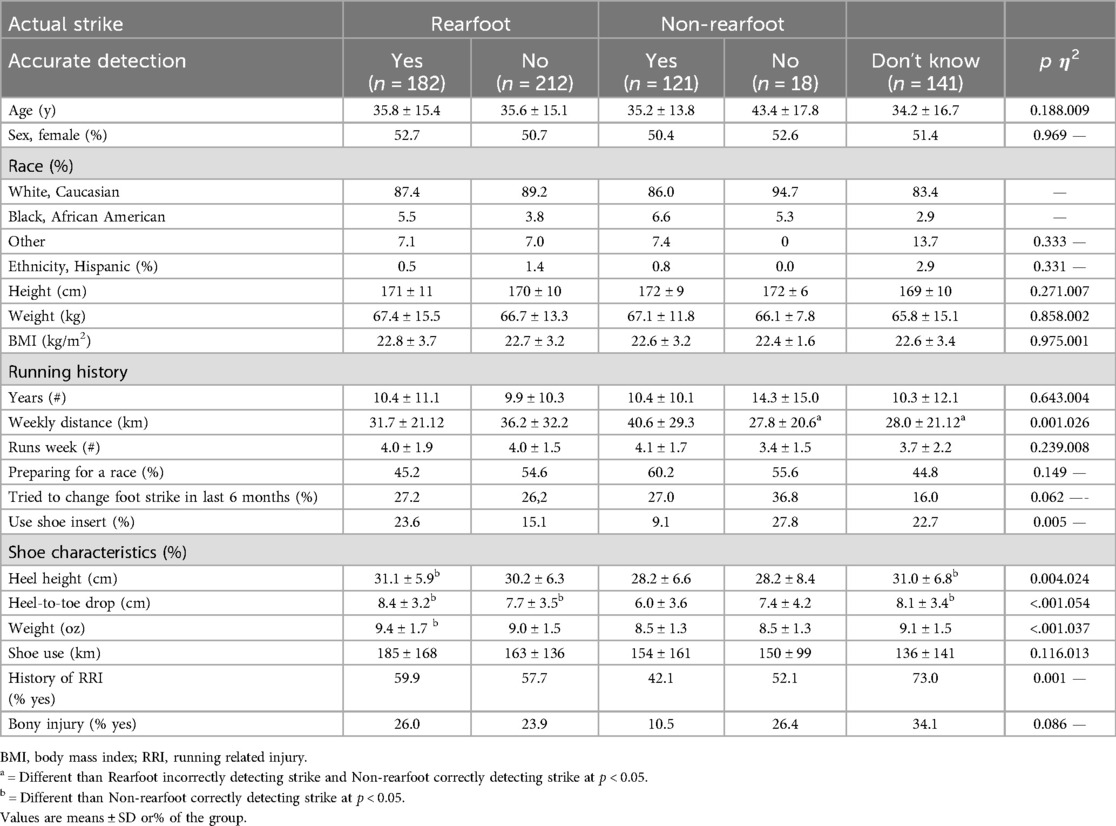
Table 1. Characteristics of runners categorized by self-reported foot strike pattern, irrespective of accuracy (N = 710).
3.2 Foot strike detection accuracy
Overall, of the 710 runners, 28% and 47% of runners self-reported their foot strike patterns as rear foot and non-rearfoot, respectively, with 25% indicating they did not know what their pattern was. The actual foot strike distribution was that 76% of runners were rearfoot strikers and 25% were non-rearfoot strikers (Figure 3). Only 34% of rearfoot strikers accurately detected foot strike pattern, however, 70% of non-rearfoot strikers detected actual foot strike accurately. Of the runners who did not know their strike pattern, 81% were actually rearfoot striking and 19% were non-rearfoot striking.
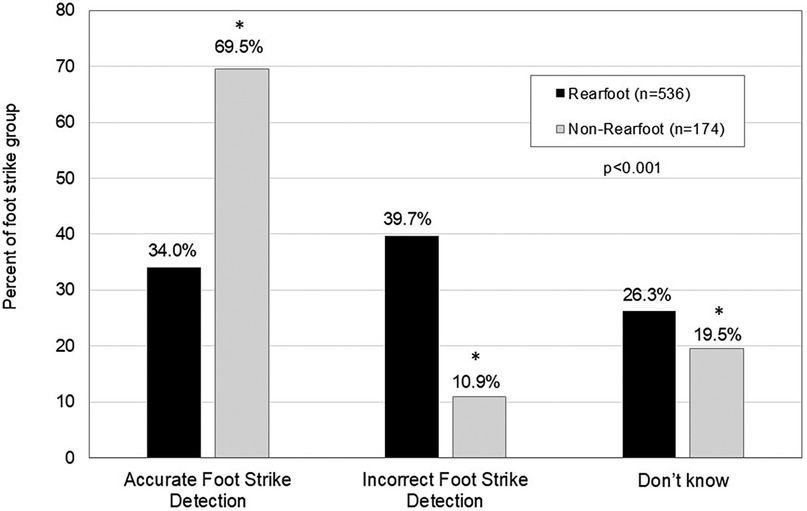
Figure 3. Accurate self-report detection of habitual foot strike type. Values are expressed as% correct based on actual foot strike pattern. *denotes different than rearfoot strikers at p < 0.05.
3.2.1 Key biomechanical variables
Table 2 provides key biomechanical variables by accuracy of self-reported foot strike patterns. The mean running velocity was 2.7 ± 0.5 m/s, with no difference among groups (range 2.7–2.8 m/s; p = 0.308). In the non-rearfoot strikers, irrespective of accuracy, mean ankle joint angles were lower (more plantar flexed position) and knee joint angles were lower (more flexed knee position) at initial foot contact compared to the other three groups (both p < 0.001). Cadence and stance time were different in the non-rearfoot accurate runners than rearfoot accurate runners and those who didn't know their strike (p = 0.001). Peak vertical GRF values were higher in the non-rearfoot accurate runners compared to rearfoot runners irrespective of accuracy (p < 0.05). Effect sizes were considered medium for ankle angle at foot strike and large for VALR. Figure 2 provides the sample joint motion traces for the ankle, knee, and hip for each of the five study groups during a typical gait cycle.
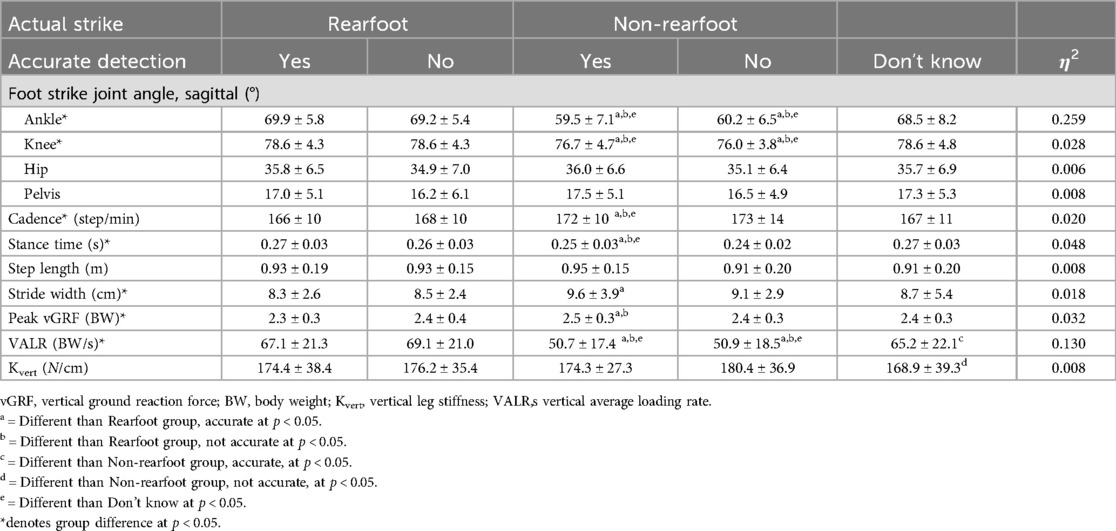
Table 2. Key mechanical variables of running by accuracy of self-reported foot strike pattern. Biomechanical values are the average of right and left sides and are expressed as means ± SD.
3.2.2 Running related injury history and foot strike pattern
The overall prevalence of RRI in the last 6 months was greatest among the runners who didn't know their habitual foot strike and lowest among the non-rearfoot accurate strikers (Figure 4; p < 0.001). The proportion of runners who reported soft tissue injuries were 11%–18% less among the non-rearfoot accurate runners compared to rearfoot strikers (p = 0.016).
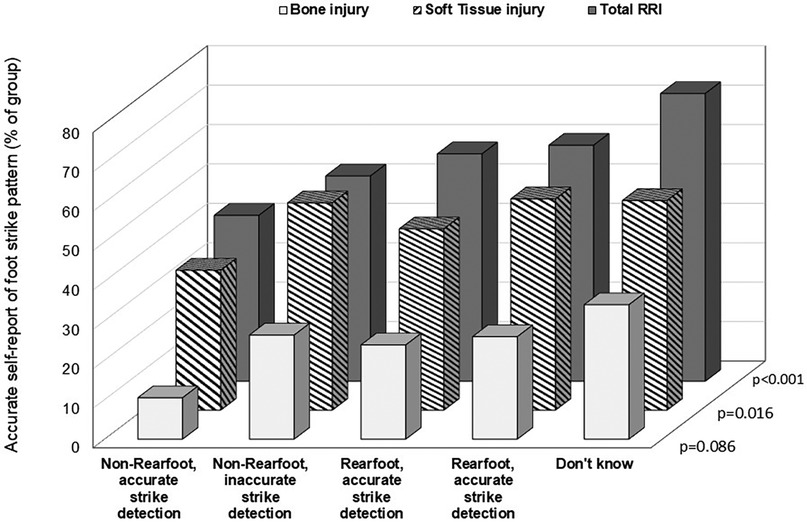
Figure 4. Prevalence of reported running-related injuries (RRI) by accuracy of self-report foot strike detection. Values are shown as percent of the group for total RRI, soft tissue injuries and bone injuries. Soft tissue injuries include: Achilles tendinopathy, Iliotibial band syndrome, hamstring strain pain, patellofemoral pain, plantar foot pain, flexor hallucis longus tendinopathy, posterior tibialis tendinopathy, low back pain, and Hoffa's fat pad inflammation. Bone injuries included: medial tibial stress syndrome, stress fractures of the tibia, fibula, metatarsals, cuneiforms, navicular, femur, and pelvis.
3.2.3 Regression analyses
After accounting for age, BMI, running speed, and years of experience, purposefully trying to change foot strike type (yes) was associated with an increased OR for accurately detecting actual foot strike [OR = 1.51 (95% CI = 1.010, 2.352); p = 0.045](Table 3A). Higher heel-to-toe drop values were associated with lower likelihood of accurate foot strike detection [OR = 0.931 (95% CI 0.875–0.991); p = 0.026] (Table 3A). Changing shoe types over the previous 6 months and higher heel-to-toe drop values were both associated with having a RRI (OR = 2.79 and OR = 1.09, respectively; p < 0.05).
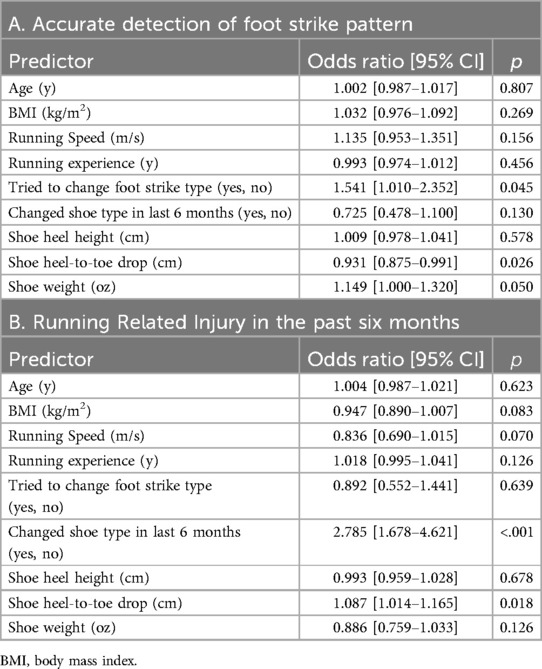
Table 3. Regression models to predict accurate detect foot strike pattern (3A) and predict history of running related injury (RRI) in the last six months (3B).
4 Discussion
A key finding of this analysis was that rearfoot striking runners were the least likely to be able to accurately detect foot strike patterns, especially when shoes had a higher heel-to-toe drop or greater weight. Non-rearfoot strikers with accurate detection of strike had the lowest prevalence of total and soft tissue RRI compared to the other groups. Factors that were contributors to accurate detection of foot strike patterns included higher shoe heel-to-toe drop, greater shoe weight and purposefully trying to change foot strike type over the previous months. Recent RRI were predicted by changing shoe type over the last 6 months and shoe heel-to-toe drop. Our hypotheses were supported in part by these findings. Awareness of foot strike pattern, when coupled with running shoes of lower weight and drop, may reduce the likelihood of an RRI potentially due to better sensory input from the ground, which can help alter foot strike pattern and limb mechanics.
A previous study examined runners (N = 60) who had been formally trained in being able to change running technique and showed there was an overall higher accuracy of strike detection at 68.3% (rearfoot strikers in traditional shoes were correct 90.9% of time, and anterior foot strikers were correct 58% of the time) compared to the current study (30). The technique-based training in this earlier study included more runners formally trained in specific methods such as Chi or Pose, which may improve awareness of foot contact patterns. In contrast, related studies show that recreational runners also have poor knowledge of foot arch type and dynamic pronation, as only 48.9% were able to correctly identify arch pattern and 10% correctly identified overpronation (44).
A recent systematic review with and meta-analysis reported that foot strike pattern was closely related to ankle angle at initial contact, low ankle dorsiflexion, negative work at the ankle and knee, vertical stiffness and load rate (7). We found that greater plantarflexion and knee flexion angle occurred at initial foot contact with corresponding lower VALR among non-rearfoot strikers. Further, leg stiffness was lowest among runners who did not know how they struck the ground. Stride width was highest among non-rearfoot runners who correctly self-reported foot strike pattern. The current findings are in agreement with systematic review which reported that sagittal plane kinematics differ slightly between runners of either forefoot or rearfoot strike patterns and load rates (3). Further, rearfoot strikers demonstrated higher vertical stiffness which is consistent with the observation that impact loading can be modulated by greater vertical compliance, which can be achieved in part through ankle plantarflexion and knee flexion (7, 45). Ankle dorsiflexion may facilitate eccentric muscle actions of the anterior tibialis (45), and knee flexion excursion during early stance (46), which may be related to energy absorption and modulation of stiffness. A few possibilities exist to explain our other findings above. First, some runners in each group who had recovered from recent RRI were transitioning in real-time to a new foot strike pattern to reduce injury risk and may not have yet established a consistent running pattern. Alternatively, runners may alter gait characteristics including reducing ankle dorsiflexion to help offset the pain (47), which can bilaterally alter features of gait (48). Second, with different RRI histories and acuity of injury, some runners in each group may have had residual or asymmetric gait mechanical variability related to the previous injury type (49). Further, current or recent injuries are related to higher variability in foot strike index, knee-ankle-foot movement coupling, and lower trunk-pelvis coupling; 73% of injured runners have mechanical variability in at least one mechanical variable (49). Thus, even if the foot strike pattern was self-reported accurately, mean values of mechanical characteristics may contain the variability from injuries that washed out statistical significance.
Misjudging strike pattern has implications for successful adoption of retraining programs, and may influence shoe selection (44). Specifically, runners who can more accurately detect foot strike pattern are likely going to be successful with responding to therapy cues and modifying foot strike pattern compared to runners who lack this ability. One study found that runners who have poor understanding of foot strike and foot mechanics or who have pain or discomfort may choose heavier shoes with more cushioning and thicker heels to reduce discomfort (44). A change in footwear may lead to reduction in pain, however heavier shoes and different heel-to-toe drop may affect foot strike pattern which is associated with RRI. Conversely, runners who wish to transition from shoes with high cushioning or energy absorptive properties compared to minimalist shoes may enhance RRI risk due to the challenge of managing impact loading through the musculoskeletal system which has not adapted to a less absorptive shoe (30). It has been shown that highly cushioned maximalist shoes induce 7%–14% greater VALR and 6%–12% higher impact loading peaks compared to traditional running shoes especially at faster speeds (50). Further, stance time is prolonged with use of shoes with thick midsoles compared to thinner soles (28), a trait that may challenge adoption of faster turnover with gait retraining.
Shoe characteristics are related to foot strike pattern (11, 27, 51). Progressively increasing heel-to-toe drop acutely in the laboratory from 0 mm to 8 mm induced a reduction in knee flexion angle and increased ankle dorsiflexion angle at initial contact during overground running, ankle excursion in the sagittal plane, and reduced loading rates, while increasing load rates while treadmill running (52). In a large prospective, intervention study of runners (only a quarter of whom had experience with low drop shoes) who were provided shoes of different heel-to-toe drop heights, it was found that “low drop” shoes of ≤6 mm were associated with a 52% lower hazard ratio for RRI among occasional novice runners and a 67% elevated risk for RRI among regularly trained runners over 6 months (53) The main conclusions of these papers were that acute reduction of hoe drop was related to lower treadmill loading rates (52), and that the long-term effect of shoe drop was “neutral” on incidence of RRI (53). These previous studies included runners with widely varied running experience and weekly training levels, and categorized experience with “low drop” shoes as being less than <10 mm, which was greater in the current study (53). Differences in definitions in shoe wear, coupled with variable testing surfaces and different training levels likely contributed to divergent findings in these previous studies.
A potential interpretation of the current findings could be that positioning a foot in a shoe with an elevated heel contributes to the sensation of being front loaded on the plantar surface (mid-to-forefoot), which in turn may create the sensation that the runner is already running on the forefoot. This sensation may be enhanced with customized or off-the-shelf-shoe inserts, as excessive material between the plantar surface and the ground can compromise sensation (29). Rearfoot strikers who are encouraged to land without the heel contacting the ground during retraining may find it difficult to sense when they are actually achieving this therapeutic goal. In contrast, habitual non-rearfoot strikers who wear lighter shoes with less drop may have better sensory input from the ground, which in turn can help modify foot strike pattern and subsequently, limb mechanics. It has been proposed that these modifications in stiffness and loading are achieved through a motor learning effect, or a “central control strategy”, that promotes increased stiffness modulation at the knee and less stiffness at the ankle (54). Gait retraining involves repeated practice with cues and feedback on specific techniques including faster cadence and shorter stance time, with soft, non-rearfoot strikes to possibly dampen impact loading and ground reaction forces (55–57). Whether or not success of foot strike modification persists with different types of shoewear has yet to be determined. What is known is that runners respond to shoes with less heel-to-toe drop by shortening stance time, slower shank retraction velocity, and greater vertical stiffness compared to heavier shoes with more drop (29). These responses reflect altered movement control with loading which can influence load attenuation during running. Moreover, afferent feedback may be processed more quickly after foot strike, leading to shorter stance and faster cadence. There is variability in how runners respond and develop movement strategies to gait retraining cues (58). Different types of shoe modifications may facilitate proprioception and foot strike change for runners who need different types of sensorial input.
4.1 Limitations, strengths and future directions
This was a cross-sectional study, and to establish causation between foot strike pattern and RRI, a longitudinal design would be necessary. This retrospective study was limited by the factors which had been measured at the time of data collection, but did not include other characteristics which may influence, or be indicative of, foot strike pattern such as: foot plantar pressures, and that may impact the perception of foot strike, are arch type or shape (59), actual contact area of the foot in the shoe (60), shoe materials, parallel use of multiple shoes (61), and individual degree of wear based on mileage used (62). This study was able to use logistic regression for multiple factors across a large sample. Therefore, the findings may be generalized to the greater running population across the lifespan.
The findings from this study provide the foundation for exploring the need to modify foot strike pattern and if this is possible as part of routine gait retraining. Future work can include computer modeling methods to identify likely muscle activation changes and biomechanical outcomes in relation to foot strike patterns and shoe characteristics. Incorporation of electromyogram measures concurrent with motion testing would add important insight into neuromotor functions of running with different shoe wear and RRI and discriminate responsiveness to gait retraining. Prospective studies will provide additional clarity as to whether foot strike pattern and type of shoe are related to the development of specific RRI.
4.2 Conclusion
Accurate foot strike detection is challenging for endurance runners across the age span. Contributors to incorrect detection include greater shoe heel-to-toe drop. Reported recent shoe change, and overall injury rates were lowest among accurate non-rearfoot strikers and predictive of RRI. This information may guide clinicians and coaches on how to manage, rehabilitate and train endurance runners.
Data availability statement
The raw data supporting the conclusions of this article will be made available by the authors, without undue reservation.
Ethics statement
The studies involving humans were approved by University of Florida Institutional Review Board. The studies were conducted in accordance with the local legislation and institutional requirements. Written informed consent for participation in this study was provided by the participants' legal guardians/next of kin.
Author contributions
HV: Writing – original draft, Writing – review & editing, Conceptualization, Data curation, Formal Analysis, Funding acquisition, Investigation, Methodology, Resources, Supervision, Visualization. KC: Writing – original draft, Writing – review & editing. AV: Data curation, Formal Analysis, Funding acquisition, Writing – review & editing. KV: Conceptualization, Data curation, Formal Analysis, Funding acquisition, Resources, Visualization, Writing – original draft, Writing – review & editing. SS: Conceptualization, Data curation, Formal Analysis, Investigation, Methodology, Writing – original draft, Writing – review & editing. LP: Data curation, Formal Analysis, Investigation, Supervision, Visualization, Writing – original draft, Writing – review & editing. RN: Conceptualization, Data curation, Formal Analysis, Investigation, Methodology, Supervision, Validation, Writing – original draft, Writing – review & editing.
Funding
The author(s) declare financial support was received for the research, authorship, and/or publication of this article. This project was supported in part by the UF Strategic Funding Initiative (H and K Vincent).
Conflict of interest
The authors declare that the research was conducted in the absence of any commercial or financial relationships that could be construed as a potential conflict of interest.
Publisher's note
All claims expressed in this article are solely those of the authors and do not necessarily represent those of their affiliated organizations, or those of the publisher, the editors and the reviewers. Any product that may be evaluated in this article, or claim that may be made by its manufacturer, is not guaranteed or endorsed by the publisher.
References
1. Bovalino SP, Kingsley MIC. Foot strike patterns during overground distance running: a systematic review and meta-analysis. Sports Med Open. (2021) 7(1):82. doi: 10.1186/s40798-021-00369-9
2. Patoz A, Lussiana T, Gindre C, Hébert-Losier K. Recognition of foot strike pattern in Asian recreational runners. Sports (Basel). (2019) 7(6):147. doi: 10.3390/sports7060147
3. Almeida MO, Davis IS, Lopes AD. Biomechanical differences of foot-strike patterns during running: a systematic review with meta-analysis. J Orthop Sports Phys Ther. (2015) 45(10):738–55. doi: 10.2519/jospt.2015.6019
4. Larson P, Higgins E, Kaminski J, Decker T, Preble J, Lyons D, et al. Foot strike patterns of recreational and sub-elite runners in a long-distance road race. J Sports Sci. (2011) 29(15):1665–73. doi: 10.1080/02640414.2011.610347
5. Li L, Wu K, Deng L, Liu C, Fu W. The effects of habitual foot strike patterns on the morphology and mechanical function of the medial gastrocnemius-achilles tendon unit. Bioengineering (Basel). (2023) 10(2):264. doi: 10.3390/bioengineering10020264
6. Zhang C, Deng L, Zhang X, Wu K, Zhan J, Fu W, et al. Effects of 12-week gait retraining on plantar flexion torque, architecture, and behavior of the medial gastrocnemius in vivo. Front Bioeng Biotechnol. (2024) 12:1352334. doi: 10.3389/fbioe.2024.1352334
7. Xu Y, Yuan P, Wang R, Wang D, Liu J, Zhou H. Effects of foot strike techniques on running biomechanics: a systematic review and meta-analysis. Sports Health. (2021) 13(1):71–7. doi: 10.1177/1941738120934715
8. Burke A, Dillon S, O’Connor S, Whyte EF, Gore S, Moran KA. Risk factors for injuries in runners: a systematic review of foot strike technique and its classification at impact. Orthop J Sports Med. (2021) 9(9):23259671211020283. doi: 10.1177/23259671211020283
9. Goto H, Torii S. Foot strike patterns and running-related injuries among high school runners: a retrospective study. J Sports Med Phys Fitness. (2022) 62(12):1668–74. doi: 10.23736/S0022-4707.22.13445-6
10. Kulmala J-P, Korhonen MT, Kuitunen S, Suominen H, Heinonen A, Mikkola A, et al. Which muscles compromise human locomotor performance with age? J R Soc Interface. (2014) 11(100):20140858. doi: 10.1098/rsif.2014.0858
11. Lieberman DE, Venkadesan M, Werbel WA, Daoud AI, D'Andrea S, Davis IS, et al. Foot strike patterns and collision forces in habitually barefoot versus shod runners. Nature. (2010) 463(7280):531–5. doi: 10.1038/nature08723
12. Lopes AD, Mascarinas A, Hespanhol L. Are alterations in running biomechanics associated with running injuries? A systematic review with meta-analysis. Braz J Phys Ther. (2023) 27(4):100538. doi: 10.1016/j.bjpt.2023.100538
13. Louw M, Deary C. The biomechanical variables involved in the aetiology of iliotibial band syndrome in distance runners—a systematic review of the literature. Phys Ther Sport. (2014) 15(1):64–75. doi: 10.1016/j.ptsp.2013.07.002
14. Crunkhorn ML, Toohey LA, Charlton P, Drew M, Watson K, Etxebarria N. Injury incidence and prevalence in elite short-course triathletes: a 4-year prospective study. Br J Sports Med. (2024) 58(9):470–6. doi: 10.1136/bjsports-2023-107327
15. Nielsen R, Ramskov D, Blacket CT, Malisoux L. Running-related injuries among more than 7000 runners in 87 different countries: the garmin-RUNSAFE running health study. J Orthop Sports Phys Ther. (2024) 54(2):133–41. doi: 10.2519/jospt.2023.11959
16. Fokkema T, Varkevisser N, de Vos RJ, Bierma-Zeinstra SMA, van Middelkoop M. Factors associated with running-related injuries in recreational runners with a history of running injuries. Clin J Sport Med. (2023) 33(1):61–6. doi: 10.1097/JSM.0000000000001076
17. Ramskov D, Rasmussen S, Sørensen H, Parner ET, Lind M, Nielsen R. Interactions between running volume and running pace and injury occurrence in recreational runners: a secondary analysis. J Athl Train. (2022) 57(6):557–63. doi: 10.4085/1062-6050-0165.21
18. Paquette MR, Milner CE, Melcher DA. Foot contact angle variability during a prolonged run with relation to injury history and habitual foot strike pattern. Scand J Med Sci Sports. (2017) 27(2):217–22. doi: 10.1111/sms.12647
19. Napier C, Cochrane CK, Taunton JE, Hunt MA. Gait modifications to change lower extremity gait biomechanics in runners: a systematic review. Br J Sports Med. (2015) 49(21):1382–8. doi: 10.1136/bjsports-2014-094393
20. Miller EM, Crowell MS, Morris JB, Mason JS, Zifchock R, Goss DL. Gait retraining improves running impact loading and function in previously injured U.S. Military cadets: a pilot study. Mil Med. (2021) 186(11-12):e1077–87. doi: 10.1093/milmed/usaa383
21. Barton CJ, Bonanno DR, Carr J, Neal BS, Malliaras P, Franklyn-Miller A, et al. Running retraining to treat lower limb injuries: a mixed-methods study of current evidence synthesised with expert opinion. Br J Sports Med. (2016) 50(9):513–26. doi: 10.1136/bjsports-2015-095278
22. Clansey AC, Hanlon M, Wallace ES, Nevill A, Lake MJ. Influence of tibial shock feedback training on impact loading and running economy. Med Sci Sports Exerc. (2014) 46(5):973–81. doi: 10.1249/MSS.0000000000000182
23. Yong JR, Silder A, Montgomery KL, Fredericson M, Delp SL. Acute changes in foot strike pattern and cadence affect running parameters associated with tibial stress fractures. J Biomech. (2018) 76:1–7. doi: 10.1016/j.jbiomech.2018.05.017
24. Anderson LM, Bonanno DR, Hart HF, Barton CJ. What are the benefits and risks associated with changing foot strike pattern during running? A systematic review and meta-analysis of injury, running economy, and biomechanics. Sports Med. (2020) 50(5):885–917. doi: 10.1007/s40279-019-01238-y
25. Wei RX, Au IPH, Lau FOY, Zhang JH, Chan ZYS, McPhail AJC, et al. Running biomechanics before and after pose® method gait retraining in distance runners. Sports Biomech. (2021) 20(8):958–73. doi: 10.1080/14763141.2019.1624812
26. Hannigan JJ, Pollard CD. Differences in running biomechanics between a maximal, traditional, and minimal running shoe. J Sci Med Sport. (2020) 23(1):15–9. doi: 10.1016/j.jsams.2019.08.008
27. Goss DL, Gross MT. Relationships among self-reported shoe type, footstrike pattern, and injury incidence. US Army Med Dep J. (2012):25–30.23007933
28. Zhang Z, Lake M. A re-examination of the measurement of foot strike mechanics during running: the immediate effect of footwear midsole thickness. Front Sports Act Living. (2022) 4:824183. doi: 10.3389/fspor.2022.824183
29. Chambon N, Delattre N, Guéguen N, Berton E, Rao G. Is midsole thickness a key parameter for the running pattern? Gait Posture. (2014) 40(1):58–63. doi: 10.1016/j.gaitpost.2014.02.005
30. Goss DL, Lewek M, Yu B, Ware WB, Teyhen DS, Gross MT. Lower extremity biomechanics and self-reported foot-strike patterns among runners in traditional and minimalist shoes. J Athl Train. (2015) 50(6):603–11. doi: 10.4085/1062-6050.49.6.06
31. Sun X, Lam WK, Zhang X, Wang J, Fu W. Systematic review of the role of footwear constructions in running biomechanics: implications for running-related injury and performance. J Sports Sci Med. (2020) 19(1):20–37.32132824
32. von Elm E, Altman DG, Egger M, Pocock SJ, Gøtzsche PC, Vandenbroucke JP, et al. The strengthening the reporting of observational studies in epidemiology (STROBE) statement: guidelines for reporting observational studies. J Clin Epidemiol. (2008) 61(4):344–9. doi: 10.1016/j.jclinepi.2007.11.008
33. Vincent HK, Vincent KR. Evaluation of the injured runner. In. Harrast MA, editor. Clinical Care of the Runner: Assessment, Biomechanical Principles, and Injury Management. New York, NY: Elsevier (2020). p. 19–26.
34. Yamato TP, Saragiotto BT, Lopes AD. A consensus definition of running-related injury in recreational runners: a modified delphi approach. J Orthop Sports Phys Ther. (2015) 45(5):375–80. doi: 10.2519/jospt.2015.5741
35. Vincent HK, Massengill C, Harris A, Chen C, Wasser JG, Bruner M, et al. Cadence impact on cardiopulmonary, metabolic and biomechanical loading during downhill running. Gait Posture. (2019) 71:186–91. doi: 10.1016/j.gaitpost.2019.04.022
36. Vincent HK, Kilgore JE, Chen C, Bruner M, Horodyski M, Vincent KR. Impact of body mass index on biomechanics of recreational runners. PM R. (2020) 12(11):1106–12. doi: 10.1002/pmrj.12335
37. Kadaba MP, Ramakrishnan HK, Wootten ME. Measurement of lower extremity kinematics during level walking. J Orthop Res. (1990) 8(3):383–92. doi: 10.1002/jor.1100080310
38. de Leva P. Joint center longitudinal positions computed from a selected subset of chandler’s data. J Biomech. (1996) 29(9):1231–3. doi: 10.1016/0021-9290(96)00021-8
39. Tenforde AS, Ruder MC, Jamison ST, Singh PP, Davis IS. Is symmetry of loading improved for injured runners during novice barefoot running? Gait Posture. (2018) 62:317–20. doi: 10.1016/j.gaitpost.2018.03.043
40. Willy R, Pohl MB, Davis IS. Calculation of vertical load rates in the absence of vertical impact peaks. Paper Presented at: American Society of Biomechanics Meeting. Published online August 8, 2008.
41. McMahon TA, Cheng GC. The mechanics of running: how does stiffness couple with speed? J Biomech. (1990) 23(Suppl 1):65–78. doi: 10.1016/0021-9290(90)90042-2
42. Cohen J. Statistical Power Analysis for the Behavioral Sciencesv. 2nd ed. New York, NY: Routledge (1988).
43. Hahn H, Vincent KR, Herman DC, Chen C, Zdziarski LA, Morgan C, et al. Biomechanical, metabolic and cardiopulmonary responses of masters recreational runners during running at different speeds. Res Sports Med. (2017) 25(2):118–31. doi: 10.1080/15438627.2017.1282359
44. Hohmann E, Reaburn P, Imhoff A. Runner’s knowledge of their foot type: do they really know? Foot (Edinb). (2012) 22(3):205–10. doi: 10.1016/j.foot.2012.04.008
45. Johnson CD, Davis IS. What differentiates rearfoot strike runners with low and high vertical load rates? Gait Posture. (2022) 96:149–53. doi: 10.1016/j.gaitpost.2022.05.019
46. Shih YO, Teng HL, Powers CM. Lower extremity stiffness predicts ground reaction force loading rate in heel strike runners. Med Sci Sports Exerc. (2019) 51(8):1692–7. doi: 10.1249/MSS.0000000000001963
47. Fox A, Ferber R, Saunders N, Osis S, Bonacci J. Gait kinematics in individuals with acute and chronic patellofemoral pain. Med Sci Sports Exerc. (2018) 50(3):502–9. doi: 10.1249/MSS.0000000000001465
48. Hamstra-Wright KL, Jones MW, Courtney CA, Maiguel D, Ferber R. Effects of iliotibial band syndrome on pain sensitivity and gait kinematics in female runners: a preliminary study. Clin Biomech (Bristol). (2020) 76:105017. doi: 10.1016/j.clinbiomech.2020.105017
49. Blyton SJ, Snodgrass SJ, Pizzari T, Birse SM, Likens AD, Edwards S. The impact of previous musculoskeletal injury on running gait variability: a systematic review. Gait Posture. (2023) 101:124–33. doi: 10.1016/j.gaitpost.2023.01.018
50. Kulmala JP, Kosonen J, Nurminen J, Avela J. Running in highly cushioned shoes increases leg stiffness and amplifies impact loading. Sci Rep. (2018) 8(1):17496. doi: 10.1038/s41598-018-35980-6
51. Cheung RTH, Wong RYL, Chung TKW, Choi RT, Leung WWY, Shek DHY. Relationship between foot strike pattern, running speed, and footwear condition in recreational distance runners. Sports Biomech. (2017) 16(2):238–47. doi: 10.1080/14763141.2016.1226381
52. Chambon N, Delattre N, Guéguen N, Berton E, Rao G. Shoe drop has opposite influence on running pattern when running overground or on a treadmill. Eur J Appl Physiol. (2015) 115(5):911–8. doi: 10.1007/s00421-014-3072-x
53. Malisoux L, Chambon N, Urhausen A, Theisen D. Influence of the heel-to-toe drop of standard cushioned running shoes on injury risk in leisure-time runners: a randomized controlled trial with 6-month follow-up. Am J Sports Med. (2016) 44(11):2933–40. doi: 10.1177/0363546516654690
54. Hamill J, Gruber AH, Derrick TR. Lower extremity joint stiffness characteristics during running with different footfall patterns. Eur J Sport Sci. (2014) 14(2):130–6. doi: 10.1080/17461391.2012.728249
55. Zimmerman WO, Bakker EWP. Reducing vertical ground reaction forces: the relative importance of three gait retraining cues. Clin Biomech (Bristol, Avon). (2019) 69:16–20. doi: 10.1016/j.clinbiomech.2019.06.014
56. Vincent HK, Vincent KR. Healthy running habits for the distance runner: clinical utility of the American college of sports medicine infographic. Curr Sports Med Rep. (2022) 21(12):463–9. doi: 10.1249/JSR.0000000000001019
57. Sara LK, Gaudette LW, De Souza Junior JR, Tenforde AS, Wasserman L, Johnson CD. Cues to land softly and quietly result in acute reductions in ground reaction force loading rates in runners. Gait Posture. (2024) 109:220–5. doi: 10.1016/j.gaitpost.2024.02.008
58. van Gelder LMA, Barnes A, Wheat JS, Heller BW. Runners’ responses to a biofeedback intervention aimed to reduce tibial acceleration differ within and between individuals. J Biomech. (2023) 157:111686. doi: 10.1016/j.jbiomech.2023.111686
59. Wegener C, Burns J, Penkala S. Effect of neutral-cushioned running shoes on plantar pressure loading and comfort in athletes with cavus feet: a crossover randomized controlled trial. Am J Sports Med. (2008) 36(11):2139–46. doi: 10.1177/0363546508318191
60. Wiegerinck JI, Boyd J, Yoder JC, Abbey AN, Nunley JA, Queen RM. Differences in plantar loading between training shoes and racing flats at a self-selected running speed. Gait Posture. (2009) 29(3):514–9. doi: 10.1016/j.gaitpost.2008.12.001
61. Malisoux L, Ramesh J, Mann R, Seil R, Urhausen A, Theisen D. Can parallel use of different running shoes decrease running-related injury risk? Scand J Med Sci Sports. (2015) 25(1):110–5. doi: 10.1111/sms.12154
Keywords: running, foot strike, running shoe, biomechanics, gait
Citation: Vincent HK, Coffey K, Villasuso A, Vincent KR, Sharififar S, Pezzullo L and Nixon RM (2024) Accuracy of self-reported foot strike pattern detection among endurance runners. Front. Sports Act. Living 6:1491486. doi: 10.3389/fspor.2024.1491486
Received: 4 September 2024; Accepted: 25 November 2024;
Published: 11 December 2024.
Edited by:
Ernst Albin Hansen, University College Absalon, DenmarkReviewed by:
Jayishni Maharaj, Griffith University, AustraliaAmitabh Gupta, Western Sydney University, Australia
Copyright: © 2024 Vincent, Coffey, Villasuso, Vincent, Sharififar, Pezzullo and Nixon. This is an open-access article distributed under the terms of the Creative Commons Attribution License (CC BY). The use, distribution or reproduction in other forums is permitted, provided the original author(s) and the copyright owner(s) are credited and that the original publication in this journal is cited, in accordance with accepted academic practice. No use, distribution or reproduction is permitted which does not comply with these terms.
*Correspondence: Heather K. Vincent, aGt2aW5jZW50QHVmbC5lZHU=
†These authors have contributed equally to this work