 Seunghun Lee
 Min-Chang Kim
- Institute of Disability Sport Science, Korea National Sport University, Seoul, Republic of Korea
Introduction: This study provides essential information for wheelchair basketball coaches and players to enhance tactical applications and training for improved performance. By examining the latest trends in sports classification and performance factors influencing game outcomes, this study presents a comparative analysis across different levels of international wheelchair basketball play.
Methods: To achieve this objective, major game factors were examined by analyzing descriptive statistics from each year regarding recent trends in sports class composition and the playing time of each class, followed by group difference tests. A total of 209 official game records from 24 teams participating in major international wheelchair basketball tournaments were analyzed. Group differences were tested in terms of sports class composition, playing time, and performance metrics.
Results: First, scoring factors directly affecting game results were compared between groups. The difference test showed that the success rates of 2-point (50.73%) and 3-point (31.41%) shots differed significantly, while the free throw success rate did not. Significant differences were also found in the number of assists (22.94), defensive rebounds (27.38), and steals (5.95). Second, the medal group was compared with the non-medal group. The average sports class composition per quarter was significantly higher in the medal group (1QSC: 14.00, 2QSC: 13.96, 3QSC: 13.98, 4QSC: 13.96) than in the other group (1QSC: 13.89, 2QSC: 13.89, 3QSC: 13.85, 4QSC: 13.88). In terms of playing time differences by class, medal group players showed longer participation: 2.5-point (22:21), 4.0-point (14:46), 3.0-point (19:05), and 1.5-point (16:15). Third, from 2012 to 2022, trends in sports class composition and quarterly playing time have evolved. In 2022, the average playing time of 1.5-point and 4.0-point athletes decreased by about 4 min compared to 2012, while the playing time of 4.5-point athletes increased by approximately 5 min and that of 3.0-point athletes increased by about 2 min.
1 Introduction
Wheelchair basketball (WB) is one of the most popular official events in the Paralympic Games (PG). Since 1964, when it was selected as an official game event at the Tokyo PG, WB has spread worldwide for over 60 years. Furthermore, the PG are held quadrennially, while world championship games (WC) and regional international competitions continue to be held under the supervision of the International Wheelchair Basketball Federation (IWBF) to encourage para-athletes to participate and compete to achieve their potential.
From 2012 to 2022, about 27 countries participated in the WC and PG of WB. As of 2024, members of the IWBF include 24 in Africa, 21 in America, 28 in Asia and Oceania, and 36 in Europe, with about 289 players from 109 countries. Wheelchair basketball leagues are actively conducted around the globe, including Europe, North America, Asia, and so forth (1).
As WB events have become common and developed, para-athletes' personal skills and team performances in WC and PG have improved significantly. As a result, global competitiveness is intense, with more diversified strategies required more than ever before in preparation for each competition (2).
Basketball games have a fast transition between offense and defense, requiring fast and delicate judgment because the game result may be changed within seconds. To secure winning and outstanding team performance, the optimized team of players is organized for each game (3). Particularly in contemporary basketball, roles are divided explicitly among 5 players for specific strategies and tactics, which definitely decide the victory and defeat of the game. An athlete's skill is essential in team sports, but the team's organization and tactics are also vital to winning (4–6).
Similarly, in WB, player selection can factor in winning. Still, due to the “Sports Classification System”, it has to be organized differently than in basketball. In particular, due to the decreasing number of international competition games and changes in the classification of para-athletes, the major national teams (the United States of America, Great Britain, Australia, etc.) are no longer relying on individual performance but on team cohesion and tactics to win matches. Furthermore, the overall trend of principal countries is to select the national team by identifying the appropriate combination of players and the sum of their classifications to maximize performance and teamwork. In other words, to formulate a strategy, match analysis of WB needs to assess the match factors that affect the match results, and the factor analysis related to each player's sports class points as a significant part of the team performance characteristics (5).
In general, basketball playing styles and roles change depending on international trends and training methods (7). For example, Štrumbelj et al. (8) points out that ever since 2001, when the shot clock changed from 30 s to 24 s, the numbers of team offenses, earning scores, and two-point shots have increased during the 10 seasons, whereas the number of 3-point shots has decreased. As the number of three-point attempts in international basketball increased in 2010, and as offensive and defensive transitions became faster, teams have demanded players to attack using space and defend in various patterns (9). Players are given multiple roles, and many different training methods are applied flexibly in line with international trends.
Similar to the changes in basketball mentioned above, WB has also seen changes in the rules and how the game gets played. For example, the sports classification in WB was changed to the evidence-based form in the 2016 Rio PG, and the new minimum impairment criteria were applied in the 2021 Tokyo PG. Factors affecting sports performance in para sports include participants' classification, health condition, and training method, among which classification factors vary significantly by a player's function. Therefore, understanding the sports classification factors and playing time among countries known for the central team's performance will be vital in deciding strategies.
Although such research is not relatively active in WB, the game operation is similar to that of ordinary basketball. Thus, strategies may be established based on similar analytic approaches for game performance improvement. Previous studies in WB focused on physical abilities and analyses of victory and defeat based on team records (10–13).
Additionally, sports class factors, a deciding characteristic for WB, are significant elements in analytic approaches for game performance improvement. However, previous studies on the sport class of WB focused on kinematics and differences in skills and physical functions related to each player's points in terms of sports medicine (14–18). As in previous studies, such analyses on individual players' physical functions and abilities have limitations in understanding major factors affecting WB game performance.
Given the limitations of previous research, as mentioned earlier, the association among sports performance, sports-class composition (classification), and match results need to be investigated. In previous studies, variables other than sports-class and playing time (offense, defense, turnovers, etc.) were used to analyze the difference in performance between the top and bottom groups (13, 16). However, since WB limits the number of points that can be played (within 14 points) to minimize the type of impairment that affects performance, it is important to compare the combination of points and playing time per quarter for each group. In addition, as of the Rio PG, the International Paralympic Committee introduced an evidence-based classification for each para sport (19), and some of the classes were adjusted in wheelchair basketball, which resulted in a tendency for the number of points to fluctuate. For this reason, this study aims to analyze the key factors influencing WB performance by examining national performance characteristics and the composition of sports classes, dividing players into high- and low-performing groups based on official records from central international men's WB competitions, by diagnosing the primary variables and identifying trends in sports class composition and performance factors.
Ultimately, this study provides essential information for WB coaches and players to enhance tactical application and training for improved performance. By examining the latest trends in sports classification and the performance factors that impact game outcomes, this study will present a comparative analysis across different levels of play in international WB.
2 Method
2.1 Data collection
This study analyzes the changes in “sport classification composition” and “playing time by classification” between high-performing and non-high-performing groups in WB. As the sport undergoes changes due to the recent application of evidence-based classification led by the IPC, the analysis explores key competitive variables to identify emerging trends.
To analyze the performance details of international wheelchair basketball games, this study selected the official records of 209 games among 24 teams that participated in major international wheelchair basketball games from August 30, 2012, to June 20, 2023 (n = 418). To achieve the objectives of this study, data were collected from the IWBF WC and PG held in London (2012) and Rio (2016) before the introduction of evidence-based classification, as well as from the IWBF WC and PG after the introduction of this classification. Additionally, as most research on the IWBF's rules and classification has been conducted since the 2010s, score sheets from the 2010 Games were likewise collected.
This study gathered data from publicly official records on the IWBF's website (https://iwbf.org/, accessed on 12 March 2024). Furthermore, the researcher obtained the sports class composition for each quarter through videos on the IWBF and FIBA's official websites and YouTube. However, as shown in Table 1, the researcher removed those that did not have uploaded videos or did not accurately display the official results.
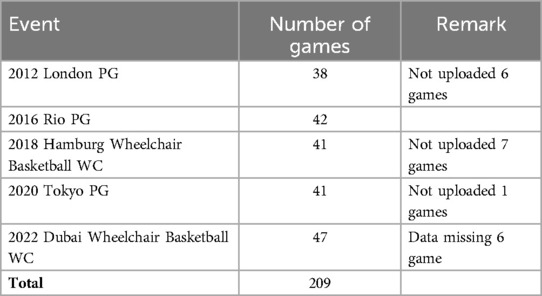
Table 1. Number of 2012–2022 WC and PG.
2.2 Data processing
First, descriptive statistics analysis was performed on collected match records with calculated average and standard deviation. To understand the differences between the groups that determine the level of competition in sports, this analysis distinguished between countries that won medals in each sport and those that did not. Medal-winning countries are fewer in number in each competition, but they represent superior performance and inspire other countries regarding strategy and tactics.
Second, the non-parametric statistics technique, “Mann–Whitney U-Test”, was performed to verify differences in the match results, sports class composition, and playing time (see Table 2) using the IBM SPSS 27.0 program. The Mann–Whitney U-test is a non-parametric test that compares the means of samples with the same population characteristics and determines the difference between two sample means (20). In this study, the Mann–Whitney U-test was applied to identify nonparametric differences in the number of medal-winning and non-medal-winning countries participating in the International Wheelchair Basketball Games and to identify nonparametric differences in the outcomes of competitions and the classification between groups. Since the difference in number between the medal group and the other group was significant and the basic assumption of parametric statistics (normality test) failed, the non-parametric statistics method was applied instead. The statistical significance level was set to.05.
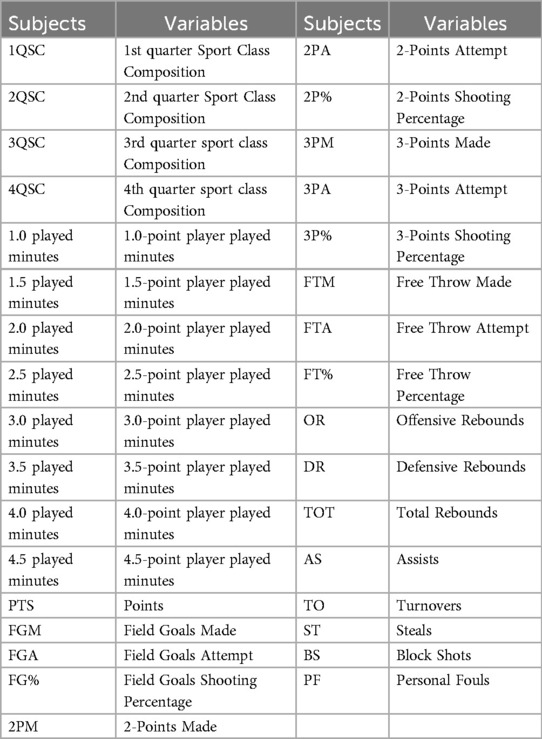
Table 2. Research subjects and variables.
Third, trends were analyzed in international wheelchair basketball games each year. Game trends were analyzed based on the descriptive statistics of annual match records. Specifically, trend analysis is used to identify the records of para-athletes and teams to check the performance contents of national athletes and to set target standards to promote performance in international sports competitions (19). Therefore, the trend information applied in this study can be used to compose the WB line-up and training by checking trends in the performance of principal countries in international wheelchair basketball competitions.
3 Results
3.1 Descriptive statistics
Descriptive statistics are presented in Table 3. As for results depending on the sports classes, sports classes competing in each quarter were given almost 14 points. The playing time of each sports class was 17:44 min for players of 1.0 points, 18:53 min for players of 1.5 points, 17:46 min for players of 2.0 points, 18:47 min for players of 2.5 points, 21:12 min for players of 3.0 points, 15:02 min for players of 3.5 points, 16:52 min for players of 4.0 points, and 17:55 min for players of 4.5 points. In general, players of 1.5 points, 2.5 points, and 3.0 points were given longer playing time than others. In a review of game results, the average score of each game was 61.94. The successful field shots and attempts were 26.50 and 59.94, respectively. The successful 2-point shots and attempts were 24.64 and 52.35, respectively. The successful 3-point shots and attempts were 1.86 and 7.61, respectively. The successful free throws and attempts were 7.09 and 12.35, respectively. The offense rebounds and defense rebounds per game were 8.22 and 26.22. The assists, steals, block shots, turnovers, and errors were 19.61, 5.13, 0.85, 12.25, and 15.60, respectively.
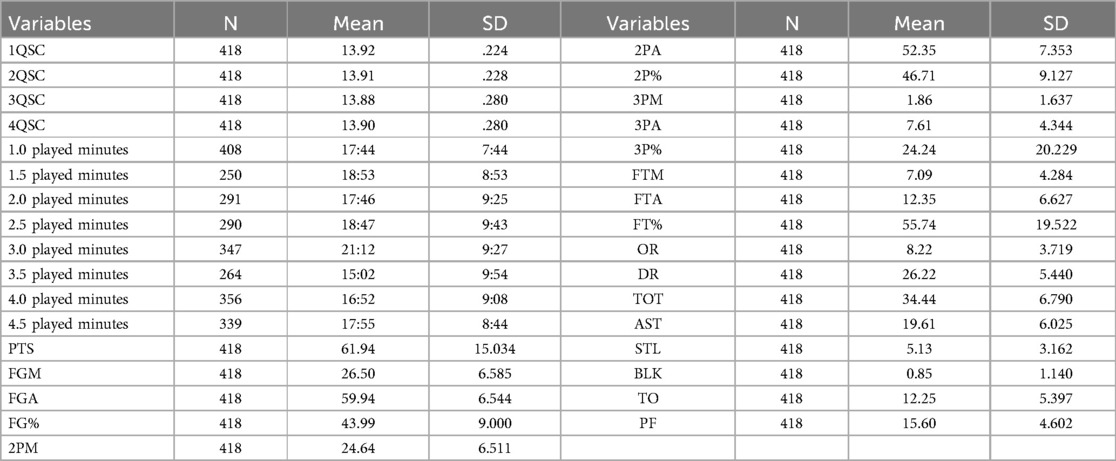
Table 3. Descriptive statistics on game (2012 to 2022).
3.2 Difference test
3.2.1 Composition and playing time by sports class between groups
The second set of research findings is about the difference in match records between the groups from 2012 to 2022 in Tables 4, 5. Given the difference in test results between groups, particularly regarding the sport class, the medal group showed a higher level of points in the average quarterly rating (1Q: 14 points, 2Q: 13.96 points, 3Q: 13.98 points, 4Q: 13.96 points) than the other group (1Q: 13.89 points, 2Q: 13.89 points, 3Q: 13.85 points, 4Q: 13.88 points), and the difference was significant. In addition, the playing time depending on the points of the medal group was as follows: 2.5 points (22:21), 3.0 points (19:05), 2.0 points (17:51), 4.5 points (17:34), 1.0 points (16:37), 1.5 points (16:15), 3.5 points (14:55), and 4.0 points (14:46) in order. That of the other group was as follows: 3.0 points (22:04), 1.5 points (19:21), 1.0 points (18:08), 4.5 points (18:03), 2.0 points (17:45), 4.0 points (17:38), 2.5 points (16:49), and 3.5 points (15:05) in order. The difference in playing time between the medal group and the other group was in the order of 2.5 points (p = .001), 4.0 points (p = .001), 3.0 points (p = .002), and 1.5 points (p = .025). This shows that the difference in playing time was significant.
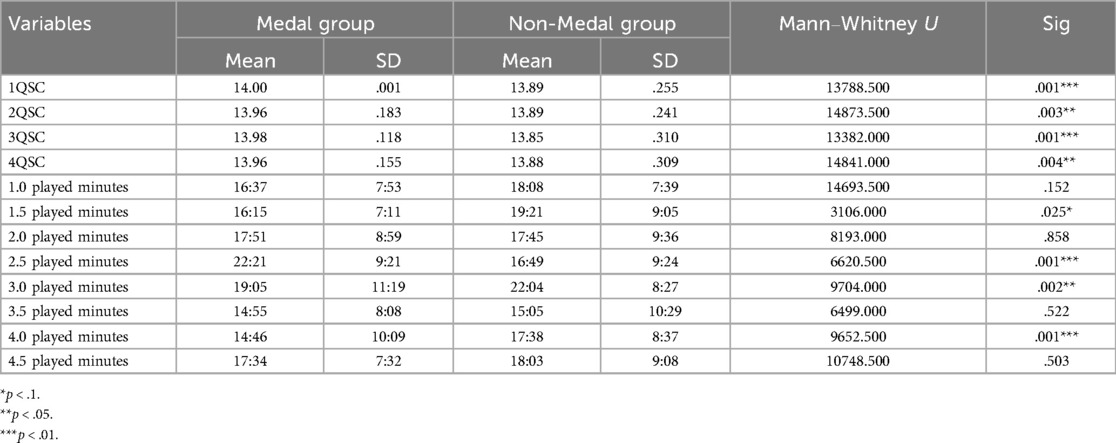
Table 4. Difference test depending on the quarterly sport class composition and playing time in groups.
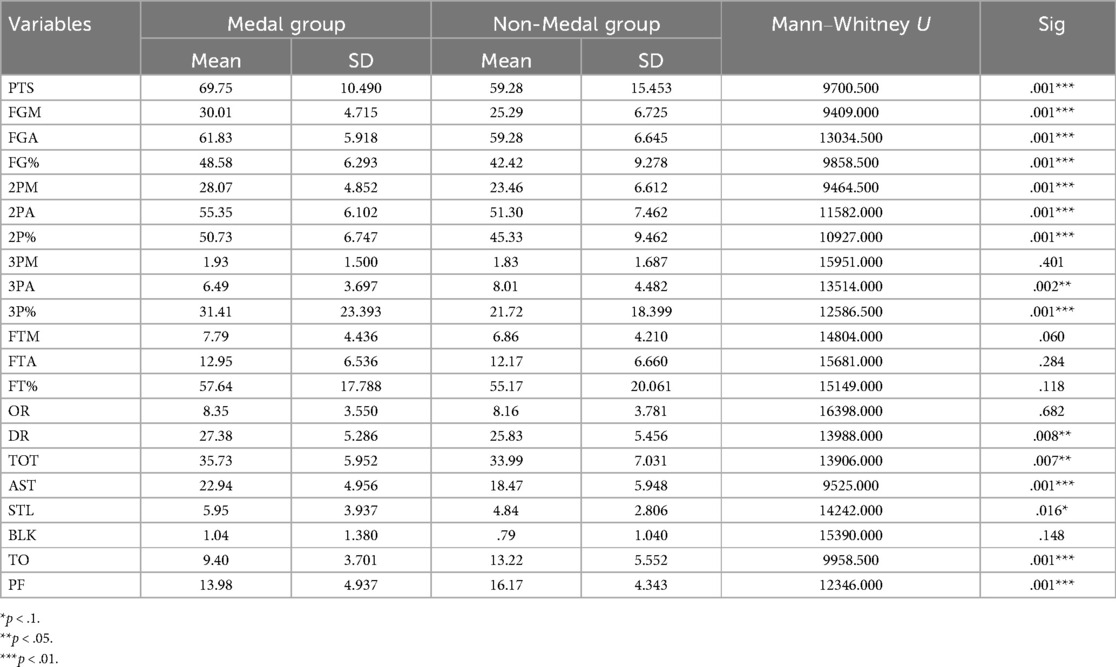
Table 5. Difference test on game results in groups (2012 to 2022).
3.2.2 Composition and playing time by sports class between groups
Given the results in Table 6, the success rates of 2-point and 3-point shots showed a considerable difference except for the free throw success rate. The most significant difference was observed in the 3-point shot success rate (p = .001): that of the other group was 1.83 out of 8.01 attempts, while that of the medal group was 1.93 out of 6.49 attempts. This means that the success rate of the medal group (31.41%) was 9.69% higher than that of the other group (21.72%). As for the success rate of 2-point shots (p = .001), the other group was 23.46 out of 51.30 attempts, while that of the medal group was 28.07 out of 55.35 attempts. This means that the success rate of the medal group (50.73%) was 5.4% higher than that of the other group (45.33%). In contrast, the free throw success rate of the other group was 6.86 out of 12.17 attempts, while that of the medal group was 7.79 out of 12.95 attempts. Thus, the success rate of the medal group (57.64%) was 2.47% higher than that of the other group (55.17%), which means that the difference is statistically insignificant. The average offense rebounds, defense rebounds, steals, and block shots in each WB game were 8.22, 26.22, 19.61, 5.13, and 0.85, respectively. As these records were comparatively analyzed regarding game performance between the medal group and the other group, the difference in assist, defense rebound, and steal was significant. First, the number of assists (p = .001) in the medal group (22.94) was 4.47 more than that in the other group (18.47), which is a significant difference. The number of defense rebounds (p = .008) in the medal group (27.38) was 2 points more than that in the other group (25.38), which is a significant difference. The number of steals (p = .016) in the medal group (5.95) was 1.11 points higher than that in the other group (4.84), which is a significant difference. The number of turnovers (p = .001) in the medal group (9.40) was 3.82 points less than that of the other group (13.22), which is a significant difference. The number of fouls (p = .001) in the medal group (13.98) was 2.19 points less than that of the other group (16.17), which is a significant difference.
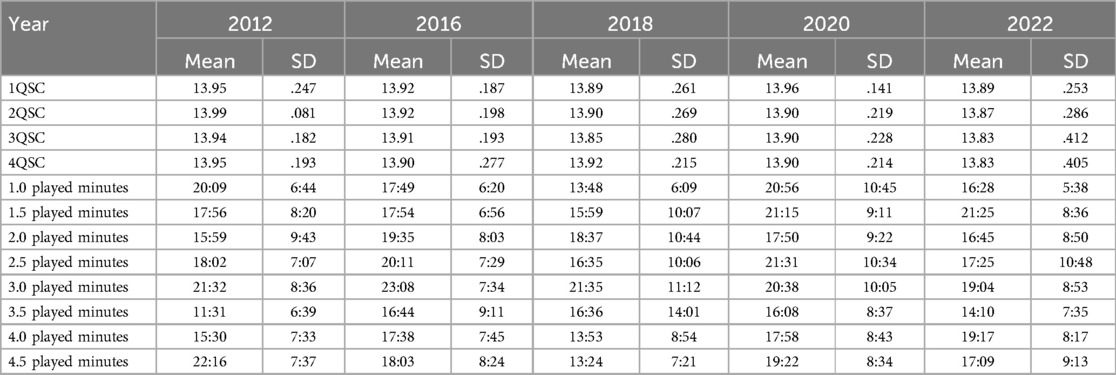
Table 6. The quarterly sport class composition trend and playing minutes from 2012 to 2022.
3.3 Trend analysis
The third set of research findings is about the trend in descriptive statistics of match records from 2012 to 2022 in Table 7. As to changes depending on the sports class, the quarterly sports class composition tended to decrease. As to the playing time, depending on the range of points, that of 1.0 points, 2.5 points, 3.0 points, and 4.5 points decreased, while that of 1.5 points, 2.0 points, 3.5 points, and 4.0 points increased. As to the playing time, depending on the range of points, that of 1.0 points, 2.5 points, 3.0 points, and 4.5 points decreased, while that of 1.5 points, 2.0 points, 3.5 points, and 4.0 points increased. Notably, the playing time of WB players of a mild case (4.5 points) decreased by about 5:07 min. In contrast, the number of players with 3.5 and 4.0 points increased by as much as 3:09 min and 3:47 min, respectively.
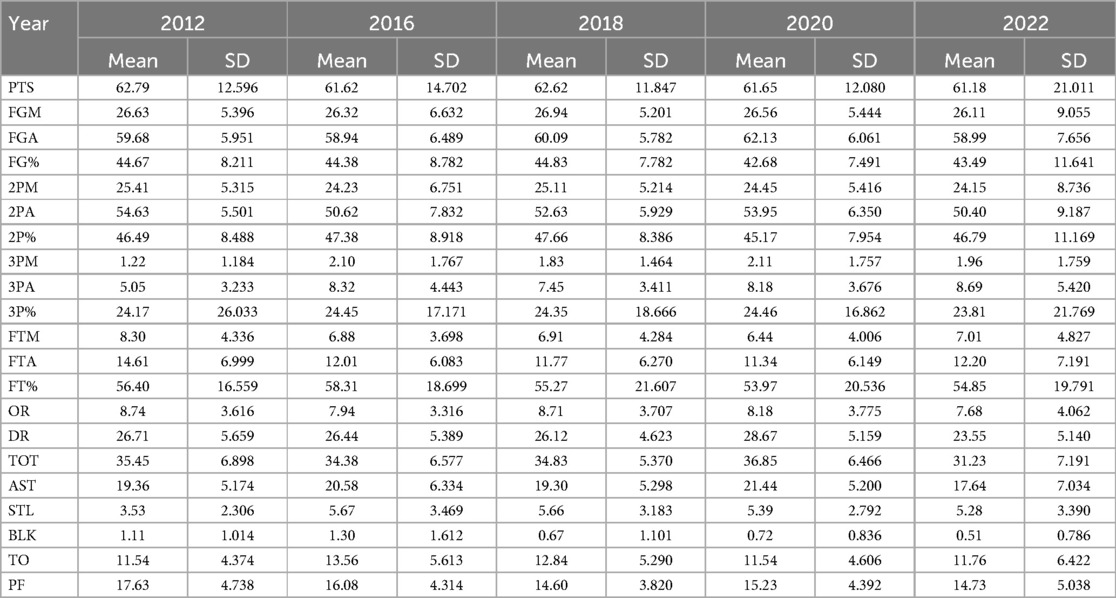
Table 7. Game trend results from 2012 to 2022.
As time passed, one competition after another, the general scores and numbers of field shots, 2-point shots, free throws, rebounds, assists, block shots, and personal fouls decreased. In contrast, 3-point shot success rates and numbers of attempts, steals, and turnovers increased.
Mainly, 3-point shot successes and attempts increased as much as 0.74 and 3.64, respectively, in 2022 compared to 2012. The 2-point shot success rate also increased. Steals increased by as much as 1.75 and turnovers by 0.22 in 2022 compared to 2012.
4 Discussion
This study provides valuable insights for WB coaches to develop tactics and for players to enhance their performance by examining the latest trends in sports classification and performance that influence international WB at different performance levels. To achieve the objective of this study, official records and video games of 209 PG and WC were collected, and 418 match records in total were analyzed, including the ratings for each country. Furthermore, a non-parametric test, the Mann–Whitney U-test, was applied to examine differences in performance between groups. Additionally, trend analysis was conducted to identify players' progression in playing time by sports classes and performance over time. Firstly, match records of IWBF games from 2012 to 2022 were analyzed, and the results are as follows: Scoring factors directly affecting the game results were compared between the groups (see Figure 1). The result shows that the success rate of 2-point and 3-point shots was significantly different except for the free throw success rate, and the numbers of assists, defense rebounds, and steals were significantly different. This result shows that the medal group used various offensive tactics that contributed to scoring and hindered the other team from having opportunities for secondary scoring through defense rebounds and quick transitions. Prior research in basketball game analysis has shown that modern basketball prefers a fast-paced, aggressive style. That play is strongly associated with higher success rates in three-pointers, steals, and rebounds (21–23). As suggested by the results of this study, the international WB events show similar trends to those of basketball. Furthermore, the game performance showed differences in terms of defense rebound and steal, which contribute to switching the other team's scoring attempts into our team's offense opportunities, as well as assists that are directly related to scoring, just as in basketball games (12, 23–25). The difference in turnovers and fouls was also significant between the outstanding and the other groups. In addition, the medal group recorded fewer turnovers and fouls than the other group. According to the research, turnovers increase the probability of giving the other team opportunities to win a score, and it is known that turnovers increase the likelihood for the other team to win a score and cut off the flow of our team's offense on turnovers (26–28). If a particular player has many fouls and needs to prepare for free throw opportunities thoroughly, the player can be an easy target for the other team to score. The result of this study also shows that the medal group recorded smaller numbers of turnovers and fouls than the other group. Thus, compared to the non-medal group, the performers are making and attempting more shots that directly affect scoring (2-points, 3-points, and free throws), and they have a higher frequency of defensive rebounds and steals that contribute to taking control of the game. They also have fewer turnovers and mistakes, a sign of a team that plays a steady game and performs well.
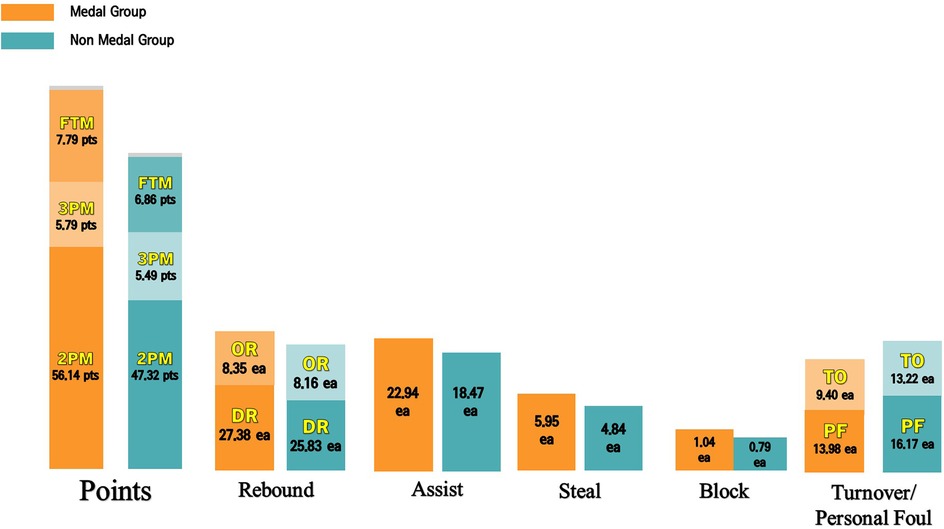
Figure 1. Game trend results from 2012 to 2022.
Second, as for the difference between the groups depending on the sports class and game performance, the para-athlete's composition in each quarter depending on the sports class was as follows: the class of 13.92 points for 1 quarter, 13.91 points for 2 quarters, 13.88 points for 3 quarters, and 13.90 points for 4 quarters. As the medal group was compared with the other group, the average composition of the other group of para-athletes in quarters was higher than that of the medal group (1Q: 14 points, 2Q: 13.96 points, 3Q: 13.98 points, 4Q: 13.96 points) than the other group (1Q: 13.89 points, 2Q: 13.89 points, 3Q: 13.85 points, 4Q: 13.88 points), and the difference was significant. As to the difference between groups in sports performance, the difference in playing time between the medal group and the other group was in the order of 2.5 points (p = .001), 4.0 points (p = .001), 3.0 points (p = .002), and 1.5 points (p = .025). This shows that the difference in playing time was significant. In the medal group, the participation rate of players was even among different points. The class of 2.5 points participated in games about 4:30 min longer than the other group. The class of 2.5 points is considered significant since it can maintain the most stable posture among low classes of points and is highly capable of passing and shooting (29, 30).
Lastly, given the general trend in 2012 to 2022 international competitions, the sports class consideration in quarterly participation decreased. As to the playing time, depending on the range of points, that of 1.0 points, 3.0 points, and 4.5 points decreased while that of 1.5 points, 2.0 points, 3.5 points, and 4.0 points increased. Notably, the playing time of WB players of a mild case (4.5 points) decreased by about 4:21 min. In contrast, the playing time of players with 3.5 and 4.0 points increased as much as 2:39 min and 3:47 min, respectively. Notably, the playing time of the classes of 4.5 points and 1.0 points significantly decreased (see Figure 2).

Figure 2. Comparison of playing time by sport class between 2012 and 2022.
In WB, players of 4.5 points are of the mild case and play various roles in the team with relatively high motor abilities such as scoring and dribbling (29, 31). The playing time of players of 4.5 points decreased probably because the IWBF minimum disability criteria were revised in applying evidence-based sport classification as directed by the IPC after 2016 (31, 32). Among WB players attending the Tokyo PG held in 2021, sport classification was conducted again among players of 4.0 and 4.5 points. Except for 75% of the players who proved qualified among the 134, the rest had to undergo a reexamination. Some players with 4.5 points failed to meet the revised minimum disability criteria and thus could not attend the Tokyo PG (33). Further, players of 1.0 points have the most severe disability among WB players and, therefore, have limitations in wheelchair manipulation and moving speed. As WB advances, pursuing a fast pace has led to revisions. The roles of players of low points who had to play for less time were transferred to players of relatively high points, and the sports class of participant players was affected as a result (see Figure 3).
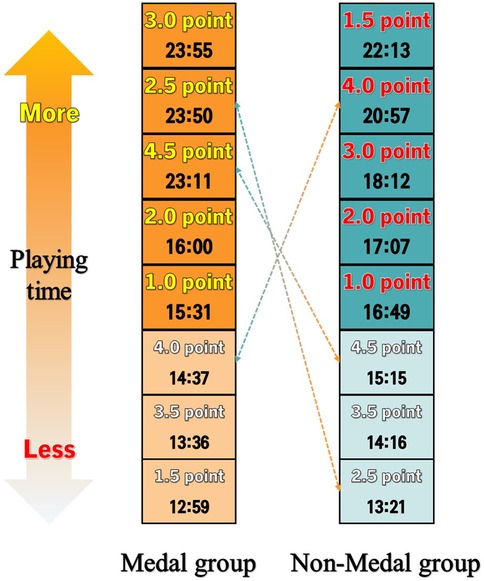
Figure 3. Comparison of playing time depending on the sport class in each group in 2022.
This study is significant because it examines the characteristics of WB games and analyzes trends in major game performance factors and sports class composition among major countries of excellent game performance, making visualized data available more efficiently and faster. It is expected that the findings of this study can be utilized effectively for game performance strategies that align with the most significant trend. In addition, this study will likely contribute to future studies on game performance in WB games. By analyzing the performance of WB and other para sports, this study aims to contribute to the growing field research supporting the development of these sports.
The limitations of this study are as follows. First, data were collected solely from official game records, and the analysis focused on objective factors centered around sport classification. Moreover, the scope of data collection was limited to the PG and WC, which restricted the range of available match data. Therefore, future studies should include position-specific analyses in addition to sport classifications, and explore key performance factors by incorporating data beyond official records—such as interviews with coaches involved in tactical decision-making. Furthermore, expanding the dataset to include recent tournaments and continental competitions would provide a more comprehensive understanding of performance in wheelchair basketball. In conclusion, we hope that future research will contribute to the development of effective strategies and efficient team compositions that reflect the unique characteristics of wheelchair basketball.
5 Conclusion
This study offers valuable insights for WB coaches to develop effective strategies and for players to enhance their performance by analyzing recent trends in sport classification and performance at the international level. The IPC continues to revise the classification system over specific periods to ensure fair competition and facilitate the participation of athletes with various types of impairments. As a result, countries are required to re-evaluate athlete classifications and select national representatives accordingly. This study confirmed that playing time varies across tournaments depending on the athletes' classifications, and this has a decisive impact on the selection of starting lineups. In high-performing countries, understanding the composition of classification points and their relation to playing time is a key factor in strategic planning.
Data availability statement
The original contributions presented in the study are included in the article/Supplementary Material, further inquiries can be directed to the corresponding author.
Author contributions
SL: Conceptualization, Data curation, Formal analysis, Investigation, Methodology, Project administration, Resources, Writing – original draft, Writing – review & editing. M-CK: Project administration, Resources, Software, Supervision, Validation, Visualization, Writing – review & editing.
Funding
The author(s) declare that no financial support was received for the research and/or publication of this article.
Conflict of interest
The authors declare that the research was conducted in the absence of any commercial or financial relationships that could be construed as a potential conflict of interest.
Generative AI statement
The author(s) declare that no Generative AI was used in the creation of this manuscript.
Publisher's note
All claims expressed in this article are solely those of the authors and do not necessarily represent those of their affiliated organizations, or those of the publisher, the editors and the reviewers. Any product that may be evaluated in this article, or claim that may be made by its manufacturer, is not guaranteed or endorsed by the publisher.
References
1. International Wheelchair Basketball Federation. (2024). Available at: https://iwbf.org/the-game/ (Accessed March 12, 2024).
2. De Bosscher V. The Global Sporting Arms Race: An International Comparative Study on Sports Policy Factors Leading to International Sporting Success. Oxford: Meyer & Meyer Verlag (2008). p. 122–4.
3. Grassetti L, Bellio R, Di Gaspero L, Fonseca G, Vidoni P. An extended regularized adjusted plus-minus analysis for lineup management in basketball using play-by-play data. IMA J Manag Math. (2021) 32(4):385–409. doi: 10.1093/imaman/dpaa022
4. Lin CC, Lin JF, Yu CC, Lee TQ. Determination of basketball types with grey analysis. 2010 International Conference on Machine Learning and Cybernetics. IEEE (2010) 6. p. 2898–903. doi: 10.1109/ICMLC.2010.5580779
5. Liu L, Yin G, Sha K, Gao B. The study on the construction of WeChat public platform based on basketball teaching. Int Conf Educ Manage Comput Soc. Atlantis Press (2016). p. 338–41. doi: 10.2991/emcs-16.2016.81
6. Paulauskas R, Masiulis N, Vaquera A, Figueira B, Sampaio J. Basketball game-related statistics that discriminate between European players competing in the NBA and in the Euroleague. J Hum Kinet. (2018) 65:225–33. doi: 10.2478/hukin-2018-0030
7. Fox JL, Scanlan AT, Stanton R. A review of player monitoring approaches in basketball: current trends and future directions. J Strength Cond Res. (2017) 31(7):2021–9. doi: 10.1519/JSC.0000000000001964
8. Štrumbelj E, Vračar P, Robnik-Šikonja M, Dežman B, Erčulj F. A decade of euroleague basketball: an analysis of trends and recent rule change effects. J Hum Kinet. (2013) 38:183–9. doi: 10.2478/hukin-2013-0058
9. National Basketball Association. (2021) Available at: https://www.nba.com/news/3-point-era-nba-75/ (Accessed March 12, 2024).
10. Gómez AM, Molik B, Morgulec-Adamowicz N, Szyman JR. Performance analysis of elite women’s wheelchair basketball players according to team-strength, playing-time and players’ classification. Int J Perform Anal Sport. (2015) 15(1):268–83. doi: 10.1080/24748668.2015.11868792
11. Keil M. The Body Composition of Elite Wheelchair Basketball Players. [dissertation]. Loughborough: Loughborough University (2019). https://hdl.handle.net/2134/10136
12. Pietroniro A. The influence of general cognitive training on sport-specific performance in wheelchair basketball (Master’s thesis). University of Ontario Institute of Technology, Ontario (ON) (2018).
13. Zecchini M, Marco S, Zuccolotto P, Manisera M, Bernardi M, Cavedon V, et al. Statistical tool to select which players to put on the field during a wheelchair basketball championship. Sport Sci Health. (2023).
14. Brasile FM. Wheelchair basketball skills proficiencies versus disability classification. Adapt Phys Activ Q. (1986) 3(1):6–13. doi: 10.1123/apaq.3.1.6
15. da Silva Santos S, Krishnan C, Alonso AC, Greve JM. Trunk function correlates positively with wheelchair basketball player classification. Am J Phys Med Rehabil. (2017) 96(2):101–8. doi: 10.1097/PHM.0000000000000548
16. Gil SM, Yanci J, Otero M, Olasagasti J, Badiola A, Bidaurrazaga-Letona I, et al. The functional classification and field test performance in wheelchair basketball players. J Hum Kinet. (2015) 46:219–30. doi: 10.1515/hukin-2015-0050
17. Vanlandewijck YC, Evaggelinou C, Daly DJ, Verellen J, Van Houtte S, Aspeslagh V, et al. The relationship between functional potential and field performance in elite female wheelchair basketball players. J Sports Sci. (2004) 22(7):668–75. doi: 10.1080/02640410310001655750
18. Zacharakis E, Apostolidis N, Kostopoulos N, Bolatoglou T. Technical abilities of elite wheelchair basketball players. Sport J. (2012) 15(4):1–8.
19. Kim MC. Trend analysis of Korean and international competition records of S14 class swimmers with intellectual disabilities. Korean J Meas Eval Phys Educ Sport Sci. (2021) 23(2):27–37.
20. Ruxton GD. The unequal variance t-test is an underused alternative to Student’s t-test and the Mann–Whitney U test. Behav Ecol. (2006) 17(4):688–90. doi: 10.1093/beheco/ark016
21. Csataljay G, Hughes M, James N, Dancs H. Pace as an Influencing Factor in Basketball. Research Methods and Performance Analysis in Sport. New York: Routledge (2011). p. 178–87.
22. Ibañez SJ, García-Rubio J, Gómez MÁ, Gonzalez-Espinosa S. The impact of rule modifications on elite basketball teams’ performance. J Hum Kinet. (2018) 64:181–93. doi: 10.1515/hukin-2017-0193
23. Selmanović A, Milanović L, Brekalo M. Analysis of ball conversion in European and American professional basketball games. Proc 8th Int Sci Conf Kinesiol (2017). p. 406–10
24. Bazanov B, Võhandu P, Haljand R. Trends in offensive team activity in basketball. Balt J Sport Health Sci. (2006) 2(61):1–7. doi: 10.33607/bjshs.v2i61.590
25. Csátaljay G, James N, Hughes M, Dancs H. Analysis of influencing factors behind offensive rebounding performance in elite basketball. Int J Sports Sci Coach. (2017) 12(6):774–81. doi: 10.1177/1747954117738900
26. Han D, Hawkins M, Choi H. Analysis of different types of turnovers between winning and losing performances in men’s NCAA basketball. J Korea Soc Comput Inf. (2020) 25(7):135–42.
27. Sors F, Tomé Lourido D, Parisi V, Santoro I, Galmonte A, Agostini T, et al. Pressing crowd noise impairs the ability of anxious basketball referees to discriminate fouls. Front Psychol. (2019) 10:2380. doi: 10.3389/fpsyg.2019.02380
28. Tavares F, Gomes N. The offensive process in basketball–a study in high performance junior teams. Int J Perform Anal Sport. (2003) 3(1):34–9. doi: 10.1080/24748668.2003.11868272
29. Arroyo R, Alsasua R, Arana J, Lapresa D, Anguera MT. A log-linear analysis of efficiency in wheelchair basketball according to player classification. J Hum Kinet. (2022) 81:1–11. doi: 10.2478/hukin-2022-0022
30. National Wheelchair Basketball Federation. (2024) Available at: https://www.nwba.org/functionalclassification/ (Accessed March 12, 2024).
31. Fliess Douer O, Koseff D, Tweedy S, Molik B, Vanlandewijck Y. Challenges and opportunities in wheelchair basketball classification–A delphi study. J Sports Sci. (2021) 39(1):7–18. doi: 10.1080/02640414.2021.1883310
32. Kim DH, Shin J-Y, Kim Hyunseung H, Bong S. Analysis of determinants of Korean university basketball performance. Korea J Sport. (2022) 20(3):689–99.
33. International Wheelchair Basketball Federation. (2021). Available at: https://iwbf.org/2021/08/02/iwbf-to-implement-changes-to-classification-rules-and-regulations/ (Accessed March 12, 2024).
Keywords: wheelchair basketball, performance, classification, para sports, trend analysis, team sports
Citation: Lee S and Kim MC (2025) Performance analysis using the classification composition and match records in wheelchair basketball matches. Front. Sports Act. Living 7:1542023. doi: 10.3389/fspor.2025.1542023
Received: 9 December 2024; Accepted: 17 April 2025;
Published: 28 April 2025.
Edited by:
Yixiong Cui, Beijing Sport University, ChinaReviewed by:
Mário Cunha Espada, Instituto Politecnico de Setubal (IPS), PortugalMuhamad Noor Mohamed, Universiti Teknologi MARA, Malaysia
Copyright: © 2025 Lee and Kim. This is an open-access article distributed under the terms of the Creative Commons Attribution License (CC BY). The use, distribution or reproduction in other forums is permitted, provided the original author(s) and the copyright owner(s) are credited and that the original publication in this journal is cited, in accordance with accepted academic practice. No use, distribution or reproduction is permitted which does not comply with these terms.
*Correspondence: Min-Chang Kim, bWMyNjI4QGtuc3UuYWMua3I=