 Tessa L. Gallinger
 Brian R. MacIntosh
 Jared R. Fletcher
- 1Human Performance Laboratory, Faculty of Kinesiology, University of Calgary, Calgary, AB, Canada
- 2Canadian Paralympic Committee, Ottawa, ON, Canada
- 3Department of Health and Physical Education, Mount Royal University, Calgary, AB, Canada
Introduction: In individuals with Cerebral Palsy (CP), both muscle cross-sectional area and fascicle length are reduced, contributing to decreased muscle strength, muscle shortening velocity and muscle mechanical power output, particularly in the plantarflexor muscles. A proposed mechanism to target increased muscle mechanical power output is to incorporate high velocity training (HVT) in these individuals, to increase fascicle length via sarcomerogenesis. To determine the effects of HVT on changes in MG muscle fascicle length and that impact on changes to MG muscle force-length-velocity-power characteristics in young adults with CP.
Methods: 12 young adults with CP (GMFCS I or II, 22.8 ± 6.0 years) were randomly allocated (some crossover) to no training (CP-NT, n = 8), or training (CP-T, n = 8). 10 recreationally trained healthy adults (HA, 22.5 ± 2.8 years) served as controls. CP-T performed 10-week training of biweekly sessions consisting of progressive intensity 10 m sprints, plyometrics and agility tasks. Triceps surae muscle force-power-velocity relationships were quantified with isokinetic dynamometry and ultrasound imaging. Data are expressed relative to pre-intervention values.
Results: HVT resulted in a significant increase in fascicle length in CP-T (+1.92 ± 3.21 mm, p < 0.005) compared to a significant decrease in CP-NT (−1.63 ± 3.00 mm, p < 0.013). While HVT did not result in significant changes in maximal shortening velocity (Vmax) or maximal peak power output (Pmax), a large effect size for vmax following training in CP-T was seen (+45.2 ± 76.4%, d = 0.909, p = 0.452), in contrast to CP-NT (+2.9 ± 70.5%, d = 0.059, p = 1.00). HVT also resulted in a very large effect for Pmax in CP-T (+35.0 ± 49.1%, d = 1.093, p = 0.232), but only a small effect was observed in CP-NT (+7.8 ± 49.1%, d = 0.245, p = 1.00). HA had significantly greater Pmax (p < 0.001), longer resting and active fascicle lengths (p < 0.001) and greater muscle force (p < 0.001), compared to CP-T.
Discussion: HVT is a feasible training intervention to increase triceps surae muscle fascicle length in individuals with CP. HVT can partially mitigate losses in Pmax in CP compared to healthy adults. Longer HVT programs may be required to increase muscle mechanical power output in CP to levels observed in HA.
1 Introduction
Successful sport performance is largely dependent on production of muscular power, or an ability to achieve maximal force generation at high muscle shortening velocities. Muscular power is influenced by specific muscle-tendon properties that can be optimized through targeted training interventions. For individuals with cerebral palsy (CP) to compete at a high level in sport, it is critical to train in ways that enhance muscle architectural properties, leading to functional improvements. Due to an upper motor neuron lesion, individuals with CP present with a series of permanent movement disorders and secondary adaptations to muscle structure, function and composition1. This includes impaired muscle growth as early as 12 months after birth, impacting overall muscle volume (1). A reduced muscle volume may result from shorter muscle fascicle lengths and/or smaller physiological cross-sectional area (PCSA) (2), reducing the number of sarcomeres working in series and/or in parallel. While a muscle's PCSA is directly related to its force output, muscle length is an important determinant of a muscle's maximal shortening velocity (3). In CP, shorter muscle fascicle lengths have been found, compared to those of healthy adults (HA) without a neurological disorder (4, 5), where it appears that serial sarcomere number is reduced and/or longer sarcomere lengths are also present (6–8). These differences in muscle structure can contribute to muscle weakness, limited range of motion (ROM) and increased passive stiffness in even high functioning individuals with CP (9).
The muscle weakness observed in CP is typically more prevalent and pronounced in the distal muscle groups (10), adversely affecting ambulation. Specifically, reduced preferred and fast walking speeds, which have been correlated with decreased muscle strength, rate of force development and mechanical power generation at the ankle joint in CP (11–14). Increasing plantarflexor power may contribute to a greater velocity of the centre of mass at the end of the propulsive phase of running and jumping, as well as improving ambulation in CP (13, 14). A proposed mechanism to target improvements in muscular power, is to incorporate strength training with relatively high velocity contractions, with the intent to increase the number of sarcomeres in series (15). This process is referred to as sarcomerogenesis, where an increase in number of sarcomeres within a muscle fascicle, can generate a higher relative force for a given muscle shortening velocity (13, 16). Although it is now well understood that maximal effort and high-intensity exercise can be implemented safely, and without adverse effect on muscle spasticity (14, 17–20), studies incorporating high-velocity training (HVT) are limited. To date, only two studies have evaluated changes in fascicle length with HVT for people with high-functioning CP (Gross Motor Classification, GMFCS I-III) (13, 21). Moreau et al. (2013) observed increases in rectus femoris fascicle length, but not in the vastus lateralis muscle, following progressive isokinetic training at angular velocities of 30–120°•s−1. These slow movement velocities cannot be considered within our definition of true HVT (or sport-specific training velocity) as a comparison, individuals without a neurological disorder can reach knee extension velocities of 800°•s−1 during the push-off phase of a jump (22), and approximately 600°•s−1 during mid-stance sprint running (23, 24). Alternatively, Gillet et al. (2018) did include maximal short-distance sprint training (HVT), but this study reported no changes to medial gastrocnemius fascicle length following the intervention (21). Both studies did, however, observe increases in maximal strength, muscle power and total muscle volume, indicating a positive effect of resistance training on muscle cross-sectional hypertrophy in CP.
There appears to be potential to improve functional mobility of individuals with CP, as well as potential to change muscle architecture with training. However, the literature on sarcomerogenesis and/or use of HVT in CP is still limited, constraining our ability to prescribe specific and targeted training protocols. Additionally, a majority of studies have concentrated their assessments of function on joint moment data in CP, leaving gaps in our understanding of the specific skeletal muscle mechanical properties adaptations from exercise. Understanding how changes in fascicle length can alter the muscle's force-length and force-power-velocity relationships is critical to our understanding of how muscle mechanics influence movement and performance in individuals with CP. If mechanical power is to be maximized, then muscles should operate on the plateau of the force-length and the power-velocity curves (25). This knowledge could inform targeted training interventions in this population to optimize muscle function and improve muscle power output. In clinical situations, information about force-length and force-velocity properties could be used to determine the amount of muscle or tendon elongation is required to improve plantarflexion function during ambulation (26, 27). Therefore, the primary purpose of this study was to determine the effects of HVT on changes in MG muscle fascicle length and that impact on changes to MG muscle force-length-velocity-power characteristics in young adults with CP. We hypothesized that HVT would lead to increases in resting fascicle length and translate to increased triceps surae muscle power output.
2 Materials and methods
2.1 Participants
12 ambulatory participants with CP and 10 recreationally trained young healthy adults (HA) without a neurological disorder participated in this study. Participant characteristics can be found in Table 1. All participants were injury-free and had no lower limb surgery or botulinum neurotoxin A (Botox) injections within 6 months prior to the testing. Individuals training 3 or more times per week were defined as recreationally active (n = 8), and those who were identified as sedentary (n = 4) were not meeting Canada's Physical Activity Guidelines within the last 6 months. HA participants included those who were participating in sprint-agility training 3 or more times per week.
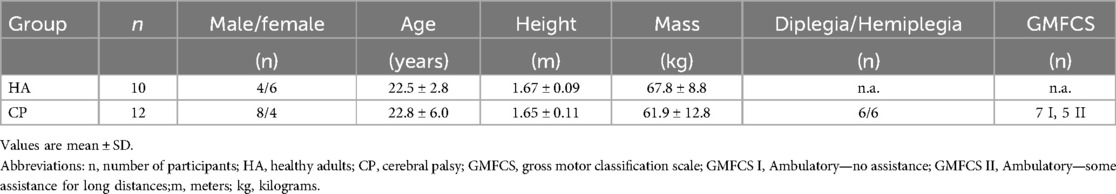
Table 1. Participant characteristics.
2.2 Interventions
To test the hypothesis that relatively high movement velocity, which we term “high velocity training” (HVT) here, would alter muscle architecture and muscle mechanical properties, the CP participants (n = 12) were randomly allocated in a cross-over design to either no training (CP-NT) (n = 6), or training (CP-T)(n = 6) for 10 weeks (Figure 1). The training program performed by the training group can be found in Figure 2. Within the CP-NT group, 2 participants dropped out of the study prior to the post assessment and 2 participants completed the training after serving first as a participant in the no-training (CP-NT) group. Within the CP-T group, 4 participants served as participants in the CP-NT group after completing the training. This resulted in 8 participants comprising each group, and each participant completed a pre and post intervention assessment 10 weeks apart. In cases where a crossover occurred, the first posttest assessment served as the pretest assessment for the subsequent condition. Following completion of interventions, the CP-T group (n = 8) and CP-NT group (n = 8) were compared to assess the effects of HVT on muscle architecture and muscle mechanics. In part 2 of the study, post-training results for the CP-T group (n = 8) were compared to a group of healthy adults (HA) (n = 10) who completed one testing assessment. Participants gave their informed written consent to participate in the experimental procedures prior to data collection. The University of Calgary Conjoint Health Research Ethics Board approved the experimental protocol (REB15-2026).
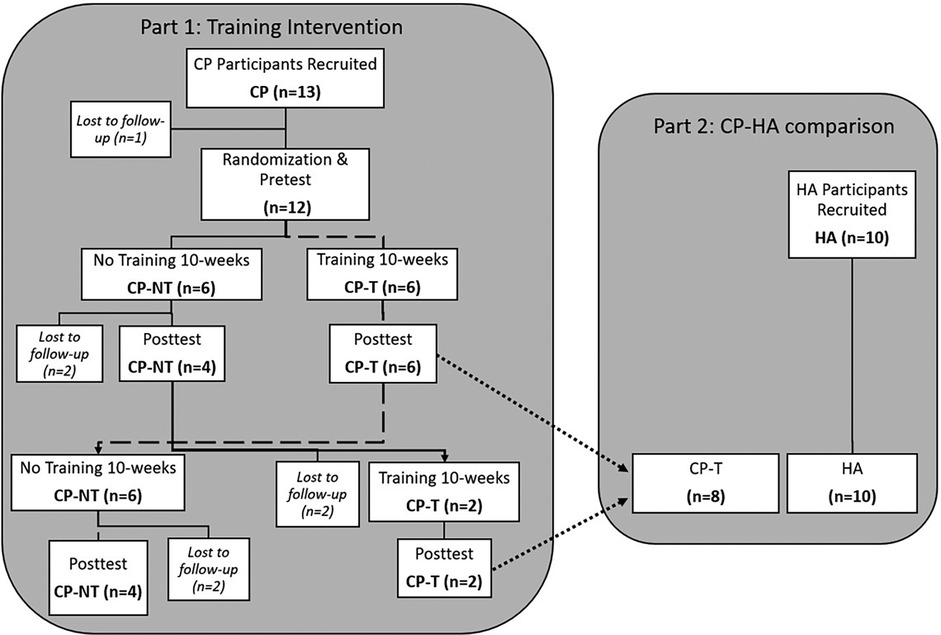
Figure 1. Flowchart depicting a cross-over design for the two-part study. Dashed line indicates the flow for pre and posttest assessments in the training group (CP-T), with a cross-over to the no-training intervention (CP-NT). Dotted line indicates CP-T comparison to HA. CP, cerebral palsy; NT, no training; T, training; HA, healthy adults.
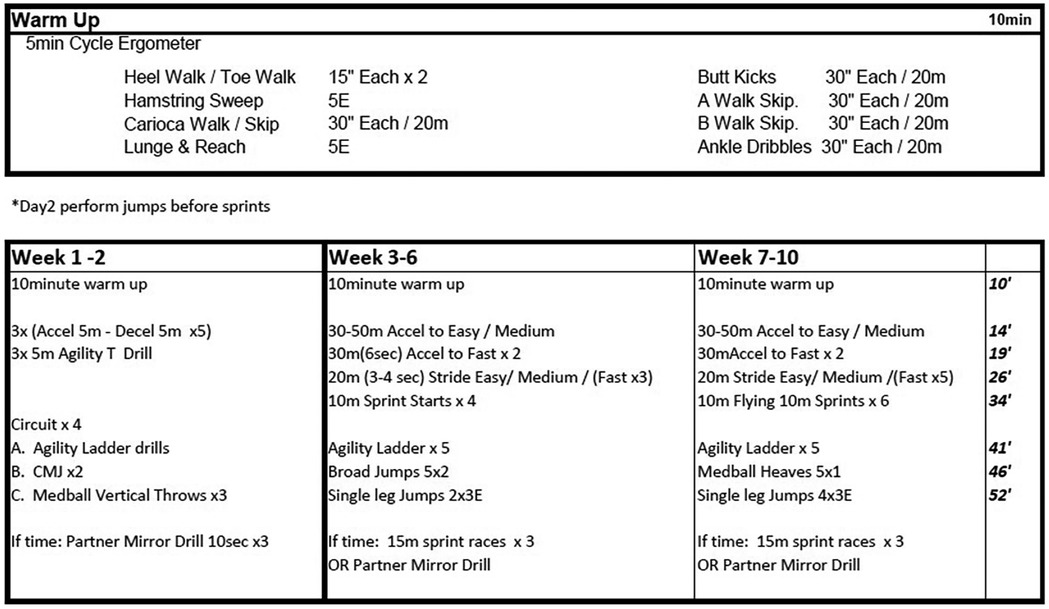
Figure 2. High-velocity training program for CP-T participants weeks 1-10. Multiplication values indicates number of sets completed, or number of repetitions x number of sets. Time allotted to each exercise set is on the right-hand side, displayed in minutes. m, meters; E, each leg; Accel, accelerations; Decel, decelerations; CMJ, countermovement jump;.
2.3 Muscle architecture
The experimental set up for the measurement of passive and active moments is shown in Figure 3. Participants were positioned on their side for passive measurements and prone for active measurements with one foot affixed to the dynamometer footplate (Biodex System 3, Shirley NY). Passive measurements were performed in the horizontal plane to remove any gravitational moments resulting from the weight of the footplate and the foot (28). The right foot was used unless the left leg was more affected in any of the CP participants. Images of the deep and superficial aponeuroses and medial gastrocnemius (MG) fascicles were acquired at 49 Hz using Ultrasound (12.5 MHz linear array, Philips Envisor, Eindhoven, Netherlands) imaging to a depth of 3 cm.
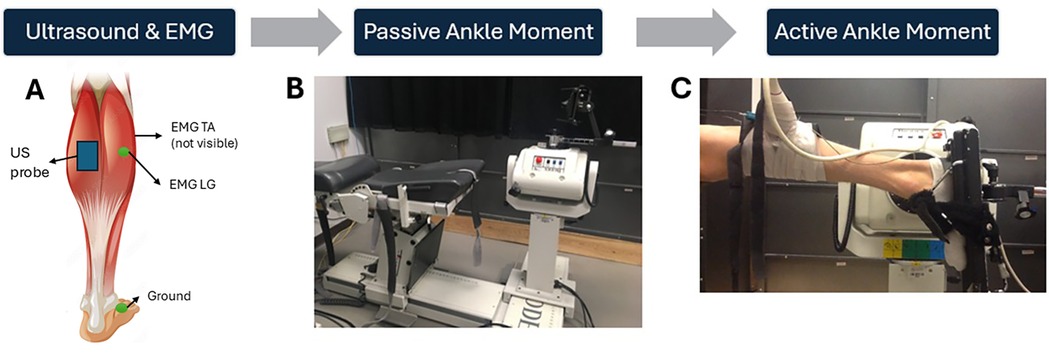
Figure 3. Experimental set-up. Placement of the ultrasound probe on the MG and sEMG electrodes on the LG and TA muscles, respectively (A) The measurement of passive moment, avoiding any passive moment due to the weight of the foot and gravity, by having participants side-lying during the passive assessments (B) Measurement of active ankle plantar flexor moment with the participant lying prone. (C) Adapted with permission from Muscle Stock Vector | Adobe Stock, File # 83745249 by blueringmedia, licensed under standard license, stock.adobe.com.
Two surface electromyography (EMG) electrodes (Norotrode 20 bipolar Ag-AgCl electrodes, Myotronics Inc, Kent, WA, USA) monitored muscle activation of the tibialis anterior (TA) and lateral gastrocnemius (LG) muscles, with a ground electrode over the medial malleolus. The ultrasound probe prevented monitoring EMG of the MG, so the LG was chosen as a surrogate (29). The EMG window length used to calculate RMS was 100 ms around the peak MVC (i.e., 50 ms prior to 50 ms after peak MVC). Muscle activation was defined as any EMG root mean square (RMS) exceeding three standard deviations (SD) from baseline noise (measured over a 3 s window prior to the trial); however, this criterion was not met in any passive trial. Co-activation of the TA muscle during the isokinetic and isometric MVC trials, was quantified relative to the LG muscle activation (TA:LG). Medial gastrocnemius fascicle length was measured during the passive and active trials using publicly available image analysis software (Image J, Baltimore, MD).
2.4 Muscle mechanics
2.4.1 Passive moment-fascicle length relationship
In the side lying position, passive rotation of the ankle by the dynamometer occurred through the full range of motion at 0.17 rad·s−1 to avoid initiating a stretch reflex (30), as confirmed by passive moment and EMG measurements. Maximal DF (0% relative ankle ROM) and maximal PF (100% relative ankle ROM) were determined with the dynamometer by having the participant actively dorsiflex and plantarflex the ankle. Fascicle length, passive ankle moment and absolute ankle angles were recorded at each participant's fixed relative percentage (0-20-40-60-80-100%) of ankle ROM. Passive moment at any ankle angle could then be estimated using a passive moment-fascicle length quadratic formula. Resting fascicle length at a common ankle angle of 105°, was also compared across CP and HA participants.
2.4.2 Active moment-fascicle length relationships
Isometric MVCs of the plantarflexors were completed by each participant at a fixed relative percentage (0-20-40-60-80-100%) of their ankle ROM 0% was considered full dorsiflexion and 100% was considered full plantarflexion. Participants were provided with a two-minute rest period between repetitions at each joint angle. The order of angle was randomized for each participant. Absolute ankle angles were recorded at each relative ankle angle, and the highest peak active isometric plantarflexion moment of 3 maximal efforts were analyzed. Active plantarflexion moment was calculated by subtracting the passive dorsiflexion moment measured at the corresponding fascicle length, thereby accounting for fascicle length changes (and reduced passive dorsiflexion moments) during contraction (31, 32). MG active fascicle length (the fascicle length associated with peak MVC at each angle), resting fascicle length (mm), pennation angle (deg) and muscle thickness (mm) were recorded at the ankle angle where peak isometric moment occurred. Mean data were obtained by averaging the measured variables across ankle angle (as a %ROM).
Muscle fascicle shortening (as a % of resting fascicle length) was calculated as:
[(resting fascicle length – active fascicle length)/resting fascicle length] · 100
2.4.3 Active moment-active power-angular velocity relationships
Following the isometric trials for the determination of participant-specific force-length relationships, a three-minute break was provided before participants performed isokinetic MVCs at six pre-determined angular velocities (30, 60, 120, 180, 300, 500°•s−1) in a randomized order. While the dynamometer was set at these pre-determined angular velocities, not all participants achieved those fixed absolute angular velocities. Therefore, the peak isokinetic angular velocity achieved was recorded for each trial, and fascicle length at peak isokinetic velocity was measured to calculate active moment at that peak measured angular velocity. Participants completed three MVCs consecutively per trial and were provided a two-minute rest period between trials at each angular velocity.
Muscle maximal power output (Pmax) and maximal angular velocity (ωmax) can be determined with estimation by fitting moment-angular velocity data to the Hill equation (33), or by linear regression analysis (34). The Hill equation yields a hyperbolic relationship between angular velocity and moment, but lacks precision at high and low velocities. Mid-range of the hyperbola appears to fit moment-angular velocity data well (34). In addition, the angular velocity at which maximal power occurs is termed optimal angular velocity (ωopt) and has been determined using moment-angular velocity data for both linear regression and fitting to the Hill equation (35, 36). Therefore, a linear regression equation was fit to the active moment-angular velocity data, using the measured peak isometric moment determined from the active moment-fascicle length relationship, as the y-intercept (Mo). Moment at any angular velocity (ω) can then be determined using the calculated slope (m) and y-intercept (Mo) according to the equation:
Peak angular velocity (rad•s−1) was estimated as the x-intercept of the fitted moment-angular velocity relationship, and can be calculated where moment = 0,
Peak angular velocity and peak moment (Mo) at peak angular velocity were recorded for all participants. Optimal velocity (ωopt) was determined as 50% of the estimated maximal angular velocity. Where, moment = mv + Mo, power can be calculated at any angular velocity as:
Peak power (Pmax) was calculated as the moment or force generated at ωopt:
This point also corresponds to where slope of the power-angular velocity relationship was equal to zero. Regression values were used instead of observed/measured values for the product of peak moment and the corresponding angular velocity.
2.4.4 Triceps surae moment arm
Triceps surae muscle moment arm (MA) for each participant was quantified using both the tendon travel method (37), and the visual method (38, 39). In a previous study, the visual method resulted in a smaller mean bias (0.8 mm, CI: −1.80 to 2.78 mm) between test/retest compared to the tendon travel method (6.2 mm, CI: −16.0 to 11.3 mm, 153 p < 0.001) (40). Therefore, only values from the visual method were used in the current study. Muscle force was then calculated as the ratio of the plantarflexion moment generated during the trial and the estimated triceps surae muscle MA.
Peak muscle force (Fmax) was calculated using the estimated MA and calculated peak moment (Mo):
2.4.5 Muscle force-power-velocity relationship
Peak muscle shortening velocity (Vmax) was calculated during peak isokinetic MVC as the change in fascicle length over contraction time:
ΔFascicle length = resting fascicle length – active fascicle length
Contraction time = Δtime at peak angular velocity ± 15 ms
Vmax = Δfascicle length/contraction time
Muscle shortening velocity, muscle force, and muscle power were expressed as a percentage of pre-intervention peak across all isokinetic trials and participants to assess the changes in the force-velocity regression relationships following the intervention period. This allowed for a clearer analysis of potential changes between the CP-T and CP-NT groups by reducing the variability observed in the raw data.
2.5 Statistics
Statistical analyses were conducted using JASP (Version 0.19.1; JASP Team, 2024). For all analyses a greenhouse-geisser correction was used where mauchlys test indicated that the assumption of sphericity was violated. The Holm post hoc analysis was used to test for significant differences. The a priori level of statistical significance was considered for p ≤ 0.05. Values are presented as mean ± SD.
2.5.1 Part I – training intervention
An independent t-test determined the differences between CP-T and CP-NT groups at baseline for age, height, and weight. To assess changes in the force-length relationship, a two-way repeated measures analysis of variance (ANOVA) was used to test for significant effects of group (CP-T or CP-NT) and time (pre and post-intervention) on ROM and measures at peak isometric MVC (muscle thickness, pennation angle, fascicle shortening percentage, active fascicle length, peak moment, peak force, and EMG RMS TA and LG). A three-way repeated measures ANOVA was used to test significant effects of group (CP-T and CP-NT), time (pre and post intervention), and percentage of ankle ROM (0%, 20%, 40%, 60%, 80%, 100%) on passive moment, resting fascicle length, percentage peak active force, and active fascicle length. Measured peak isometric moment and estimated isometric moment were compared across MVC trials using an independent t-test, as well as an assessment of the fit and slope of the moment-angular velocity relationships using the measured and estimated isometric moments. To assess changes in the force-velocity-power relationship, a two-way repeated measures ANOVA was used to test for significant effects of group (CP-T or CP-NT) and time (pre and post-intervention) on mean relative changes to Vmax, Vopt, Fmax, Pmax and slope of the force-velocity relationships. A three-way ANOVA was used to test significant effects of group (CP-T and CP-NT), time (pre and post intervention), and isokinetic angular velocity (30, 60, 90, 120, 300, 500°s−1) on mean relative muscle shortening velocity, muscle force and power output.
2.5.2 Part II – CP compared to HA
An independent t-test determined the differences for age, height, weight, ankle ROM, and moment arm. At peak isometric MVC, a one-way ANOVA compared groups on peak moment, muscle thickness, pennation angle, muscle fascicle shortening percentage, and EMG RMS for the LG and TA. A two-way repeated measures ANOVA was used to test significant effects of group (CP-T and HA) and percentage of ankle ROM (0, 20, 40, 60, 80, 100%) on passive moment, peak force, active fascicle length and resting fascicle length. A two-way repeated measures ANOVA was used to test significant effects of group (CP-T and HA) and isokinetic trial (30, 60, 90, 120, 300, 500°s−1) on peak force, peak velocity and peak power.
3 Results
3.1 Part I - training intervention
3.1.1 Participant characteristics
At baseline there were no significant differences between CP-NT and CP-T for age, height, or weight (Table 1). No significant group (CP-T and CP-NT)×time (pre and post intervention) interaction in maximum dorsiflexion angle, maximum plantarflexion angle, or total ROM was observed. A main effect of time on dorsiflexion angle was found for CP-NT, [F(1) = 10.5, p = 0.014].
3.1.2 Passive moment-length relationship
Passive ankle moment, during the passive rotation trial, did not result in any meaningful muscle activation above the baseline noise, confirming the absence of a stretch reflex and/or any active moments generated during the passive trials. There were no significant three-way group x time x ankle angle interactions for passive moment. There was a significant three-way group x time x ankle angle interaction for resting fascicle length (p = 0.038, Figure 4). Training resulted in an increased mean resting fascicle length at 40, 60, 80% and 100% of ROM in CP-T (p < 0.005), compared to a significantly shorter resting fascicle length at similar ankle ROM in CP-NT (p < 0.013).
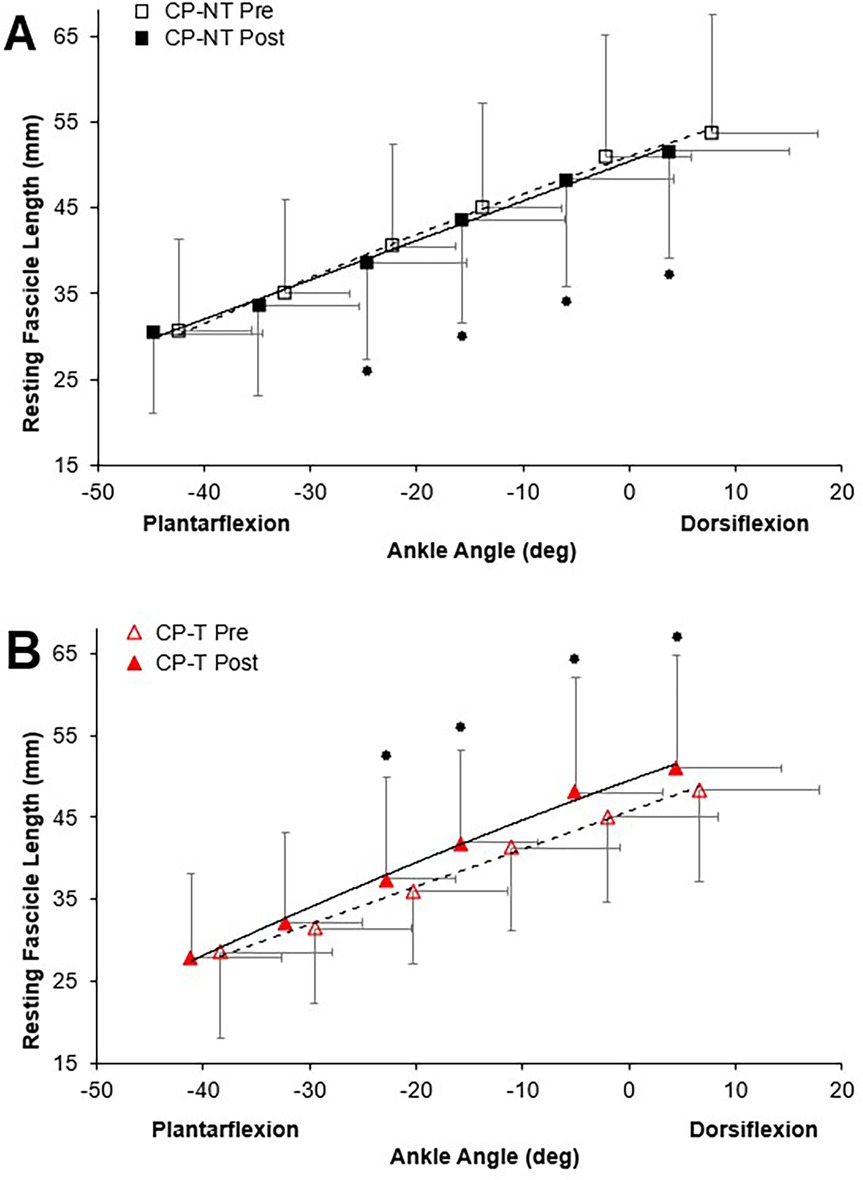
Figure 4. Resting fascicle length-angle relationships in the MG muscle for pre (dashed line, open symbol) and post (straight line, filled symbol) intervention during passive ankle rotation. Actual ankle angles are presented. Data are mean ± SD.  Indicates significant group x time x ankle angle interaction (p < 0.04). (A) CP-NT (black
  ,
,  ). (B) CP-T (red
  ,
,  ).
).
3.1.3 Muscle activation
Co-activation of the TA and LG were apparent during the isometric and isokinetic trials for the CP participants. There were no significant two-way group x time interactions for co-activation ratios calculated at peak isometric MVC, or main effects of group or time. EMG RMS for both LG and TA can be found in Table 2, along with the primary outcome measures at MVC for CP-T and CP-NT, pre and post intervention.
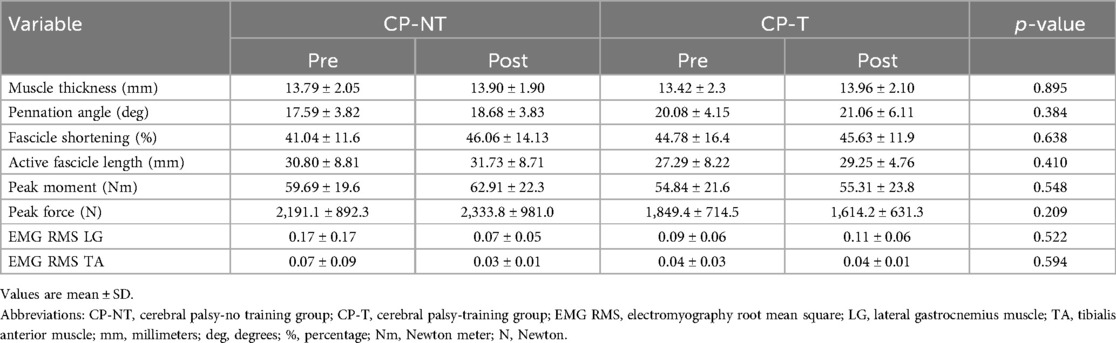
Table 2. Mean primary outcomes during MVCs for CP-T & CP-NT.
3.1.4 Force-length relationship
The muscle force-fascicle length relationship prior to and following the intervention period is shown in Figure 5. During the isometric MVCs, there were no significant three way group x time x ankle angle interactions for active fascicle length, or changes in percent peak force. A significant group x time interaction was demonstrated, indicating a significantly shorter average active fascicle length following the intervention period in CP-NT (p < 0.05), while remaining similar following the intervention period in CP-T (p = 0.814).
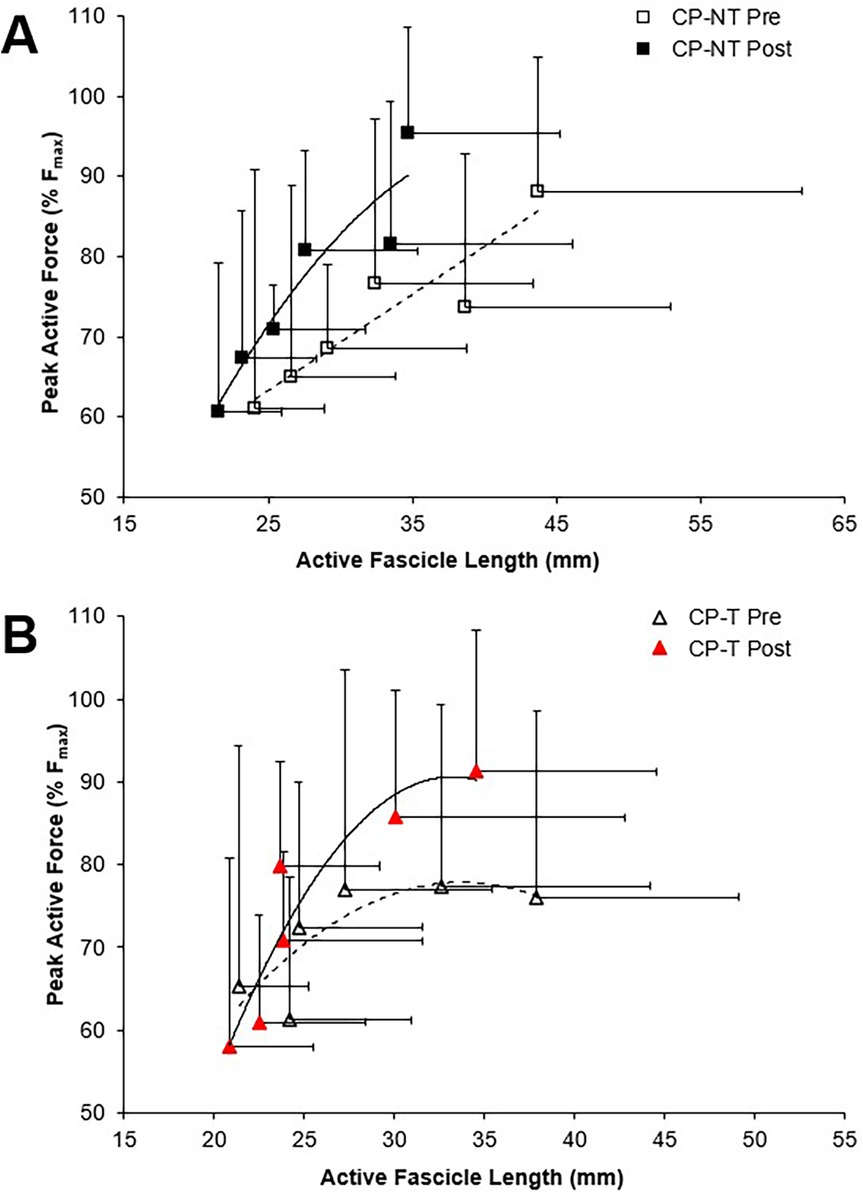
Figure 5. Force-length relationships for the MG muscle during pre (dashed line, open symbol) and post (straight line, filled symbol) intervention during isometric MVCs. Data are mean ± SD. Isometric force is presented as the percentage of peak active force. (A) CP-NT (black  ,
,  ) (B) CP-T (red
  ,
,  ).
).
3.1.5 Moment-power-angular velocity relationship
Using a linear regression to fit the measured moment-angular velocity data, the measured peak isometric moment was significantly higher than the estimated maximal isometric moment (mean difference = 22.4 ± 8.6 Nm, p < 0.004). In addition, when using the measured compared to estimated relationships, Pmax was significantly higher (mean difference = 25.8 ± 11.5 W, p = 0.003), along with a steeper slope of the moment-angular velocity data (mean difference = 5.9 ± 3.0 Nm·s·rad−1, p = 0.02). No significant differences were found in the calculated ωmax for measured compared to estimated relationships (mean difference = 0.376 ± 0.438 rad·s−1, d = 0.303, p = 0.398). The average fit of the linear regression relationship was similar when using the measured compared to estimated peak isometric moment (r2= 0.84 ± 0.08, r2 = 0.88 ± 0.07 for measured and estimated relationships, respectively, p = 0.127). Therefore, using the measured peak isometric moment to calculate the slope of the moment-angular velocity-power relationship was preferred.
3.1.6 Force-power-velocity relationship
To assess differences between groups for peak muscle shortening velocity (mm/s) and muscle force (N), muscle shortening velocity was expressed relative to pre-intervention (training or no-training) values (Figure 6). Vmax and Vopt were increased by 45.2 ± 76.4% following training in the CP-T group; however, this increase was not significantly different between groups (d = 0.909, p = 0.452). In contrast, Vmax was unchanged (+2.9 ± 70.5%, d = 0.059, p = 1.00) following the intervention period in CP-NT. A very large effect size was also observed in Vopt in CP-T following training (+22.6 ± 12.4%, d = 0.909, p = 0.452), compared to CP-NT (−1.5 ± 12.4%, d = 0.059, p = 1.00). There were no differences in Fmax between CP-T or CP-NT following the intervention (mean difference = −0.03 ± 0.1%, d = −0.117, p = 0.746), and the slope of the linear force-velocity relationship was similar between groups (mean difference = −0.14 ± 0.15, d = 0.342, p = 0.35).
Figure 6. Mean force-velocity (F-V) relationships for pre (dashed line symbol) and post (straight line) training in individuals with CP not performing the training (A) and in individuals with CP performing the training (B) each participant is represented by a different color. Force and muscle shortening velocity data are presented as a percentage of pre-training maximum (pre Fmax and pre- Vmax, respectively).
Force-velocity-power relationships for CP-T and CP-NT groups are shown in Figure 7. There was a very large effect size for Pmax following the intervention period in CP-T (35.0 ± 49.1%, d = 1.093, p = 0.232), and only a small effect observed following the intervention period in CP-NT (7.8 ± 49.1%, d = 0.245, p = 1.00). Training resulted in 5 of the 8 (62.5%) CP-T participants increasing their Pmax (mean change across 5 participants = 355.0 ± 349.9W). These increases were primarily due to increases in Vmax in all 5 participants. In the CP-NT, 2 of the 8 participants (25%) increased their Pmax (mean change across 2 participants = 1,179.0 ± 873.1W) following the 10-week no training period.
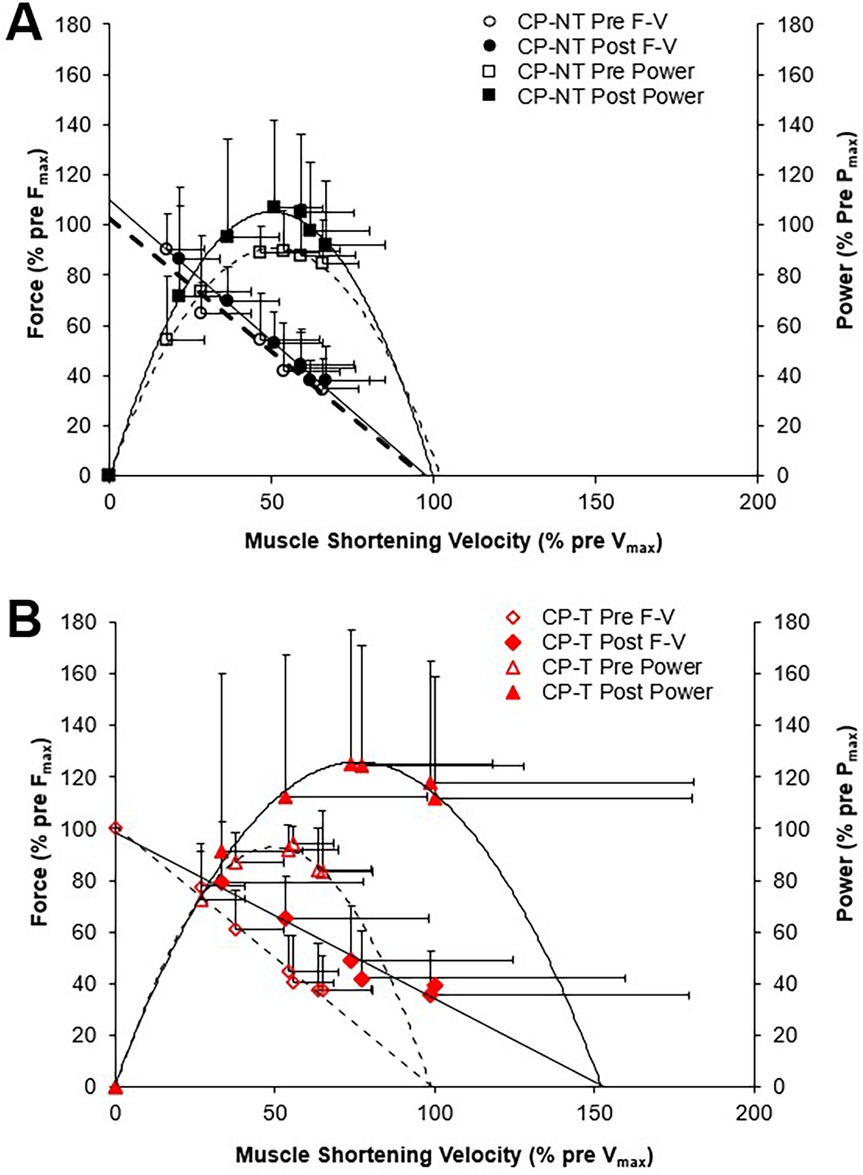
Figure 7. Mean force-velocity (F-V) from which mean power-velocity relationships were calculated. Power-velocity data were calculated from individual data shown in Figure 6 for the pre (dashed line, open symbol) and post (straight line, filled symbol) intervention periods. Data are mean ± SD. (A) CPNT (black □, ■), (B) CP-T (red Δ, ▲).
A three-way repeated measures ANOVA showed no three-way (group x time x isokinetic trial) interactions, no two-way (group x time, group x trial, trial x time) interactions, or main effect of group for muscle shortening velocity (p = 0.207), muscle force (p = 0.388), and muscle power (p = 0.239). A post hoc comparison for group x time indicated a moderate effect size for peak muscle shortening velocity following training in CP-T (22.3 ± 11.9%, d = 0.690, p = 0.484), compared to CP-NT which appeared unchanged (1.1 ± 11.9%, d = 0.035, p = 1.000). post-hoc analysis of group x time showed similar force levels pre to post intervention for CP-T (2.1 ± 3.2%, d = −0.117, p = 1.00) and CP-NT (5.1 ± 3.2%, d = −0.287, p = 1.00). post hoc comparison of group x time indicated a large effect size for mean peak power across the isokinetic MVCs in CP-T following training (28.3 ± 13.8%, d = 0.844, p = 0.302), and medium effect size observed in CP-NT following no-training (14.4 ± 13.8%, d = 0.431, p = 0.943).
3.2 Part II – comparing CP to HA
3.2.1 Participant characteristics
There were no significant differences between HA and CP-T groups for age (p = 0.651), height (p = 0.908) and weight (p = 0.509). Total ROM was significantly lower in CP-T compared to HA (CP-T: 45.6 ± 13.1°, HA: 67.22 ± 5.91°, p < 0.001). In addition, significant differences in maximum dorsiflexion (CP-T: 85.6 ± 9.8°, HA: 75.4 ± 4.11°, p < 0.005) and plantarflexion (CP-T: 131.2 ± 8.6°, HA: 142.6 ± 4.13°, p < 0.001). Triceps surae moment arm was significantly longer in healthy adults (35.4 ± 3.6 mm) compared to the CP-T group (29.1 ± 5.5 mm, p < 0.01).
3.2.2 Passive moment-length relationship
Passive moment was significantly higher in CP-T across all ankle angles compared to HA (p < 0.05). Co-activation ratio of the TA muscle to MG was significantly higher in the CP-T group (49.6 ± 34.0%) compared to HA (18.3 ± 12.2%, p = 0.014). There was a significant group x ankle angle interaction for resting fascicle length (p < 0.001), where fascicle length was significantly longer in HA compared to CP-T across all ankle angles (Figure 8).
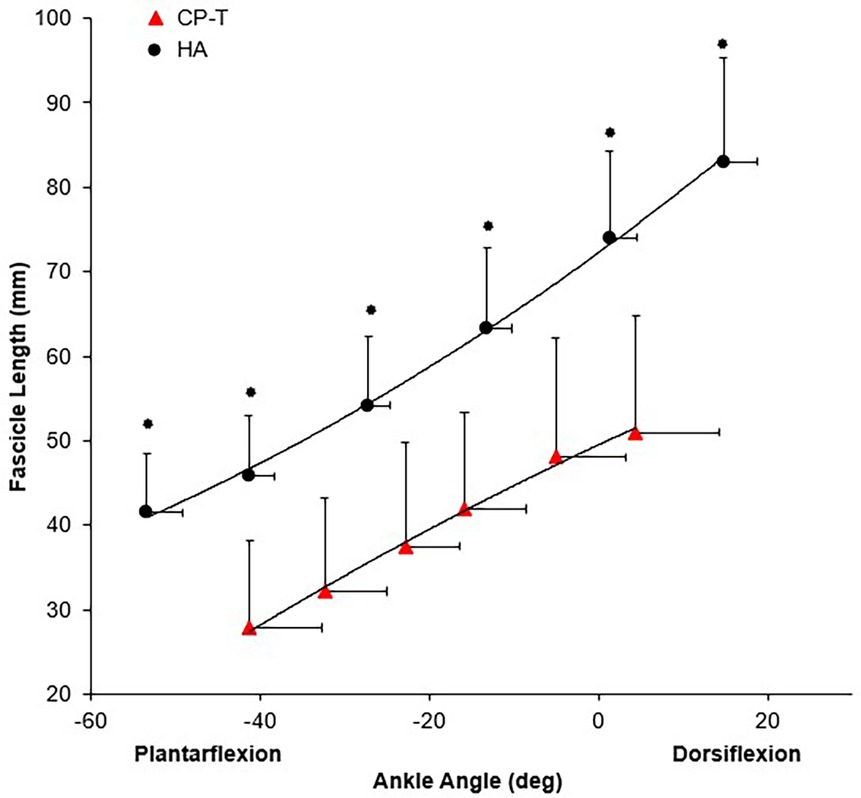
Figure 8. Mean resting fascicle length-angle relationship for CP-T ( ) and HA (
 ) for the MG muscle during passive ankle rotation. Data are mean ± SD for CP-T (n = 8) and HA (n = 10).
  Indicates significant group x ankle angle interaction (p < 0.001).
3.2.3 Active moment-length relationships
Mean primary outcomes for HA and CP-T during isometric MVCs are found in Table 3.
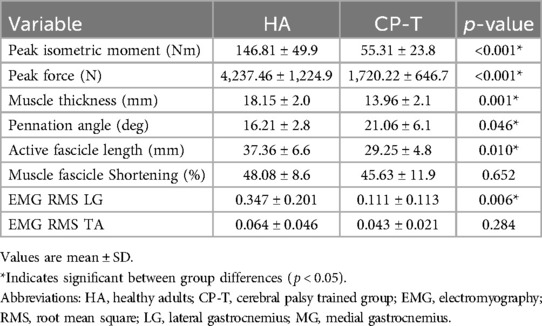
Table 3. Mean primary outcomes during isometric MVCs for HA and CP-T.
Peak active force and peak isometric moment were significantly higher across all ankle angles in HA compared to CP-T (p < 0.001), as was active fascicle length (p = 0.010). Force-length relationships for CP-T and HA can be found in Figure 9.
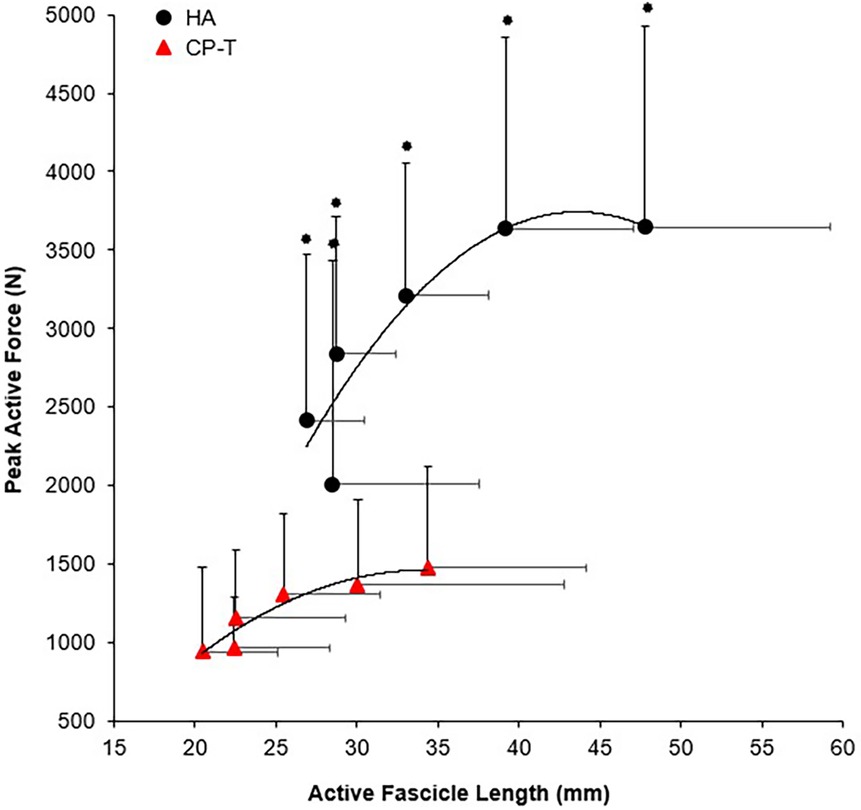
Figure 9. Fascicle force-length relationships of the MG muscle for CP-T ( ) and HA (●) during isometric MVCs. Data are mean ± SD for CP-T (n = 8) and HA (n = 10).
  Indicates significant group x ankle angle interaction (p < 0.001).
3.2.4 Moment-power-angular velocity relationships
There was a significant group x isokinetic trial interaction for ankle angular velocity (p < 0.01), moment (p < 0.01), and power (p < 0.02), indicating significantly higher outcomes across all isokinetic velocities for HA as compared to CP-T (Figure 10).
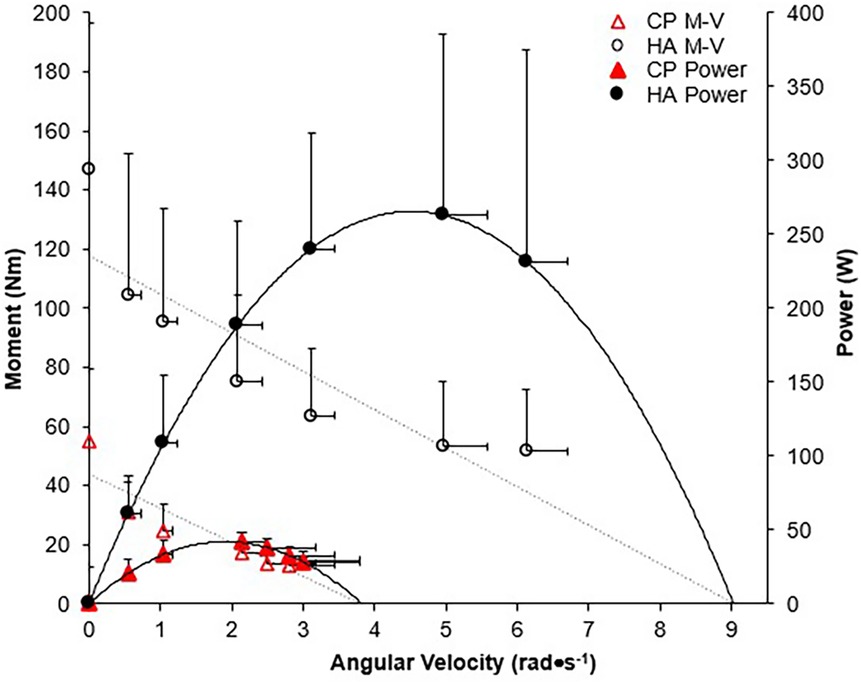
Figure 10. Moment-angular velocity (dotted line, open symbols) and power-angular velocity relationships (straight line, filled symbols) for CP-T ( ,
,  ) and HA (o, ●) during isokinetic MVCs. Power was calculated from the linear moment vs. angular velocity relationship, derived from mean participant data. Data are mean ± SD for CP-T (n = 8) and HA (n = 10).
4 Discussion
One of the first of its kind, this study measured the active triceps surae muscle force-length and force-velocity-power relationships following 10 weeks of high-velocity sprint and jump activities in young adults with CP. These relationships highlight the compromised isometric and velocity dependent force generation capability for young adults with CP, when compared to HA without a neurological disorder. One of the key findings was that HVT over a 10-week period resulted in a significantly increased resting fascicle length in participants with CP compared to pre-training (+1.92 mm, p < 0.005). Although our original hypothesis was that increases in fascicle length would result in increased muscle shortening velocities and muscle power outputs, no significant changes in these metrics were found.
4.1 Inter-individual variations with training
Research in HA (15), older adults (41) and stroke patients (20) have shown increases in muscle mechanical power output after resistance training with a focus on speed of movement during the resistance training. The literature suggests that increased fascicle length is a training-specific response to HVT like sprinting, as demonstrated by longer MG muscle fascicle lengths in elite sprinters (66.4 ± 13.2 mm) when compared to distance runners (53.6 ± 7.2 mm) (42). For elite sprinters, fascicle lengths are expected to exceed those observed in our HA data at similar ankle angles (61.9 ± 9.4 mm). Training specific responses to fascicle length were observed in the CP-T group, but large differences still remain when compared to HA (mean difference: −18.7 ± 5.1 mm, p = 0.001). Only two previous studies have evaluated changes in fascicle length with HVT for people with high-functioning CP (13, 21), and muscle fascicle length changes were inconsistent with the improvements in muscle power output observed in both studies. In Moreau et al. (2013), only the rectus femoris muscle had a differential adaptation in fascicle length in response to HVT, compared to no changes observed in the vastus lateralis muscle. Although this study suggests the use of HVT, the knee angular velocities reached during training (30–120°•s−1), did not meet those observed in other studies during self-selected walking pace in CP (180–220°•s−1) (26, 43). The lack of fascicle length change in the Gillet et al. (2018) study, could be attributed to the combination of HVT with heavier resistance exercises (slower velocity), and/or attributed to the low volume (2–3) high-velocity training exercises used in the protocol.
The variability observed among participants across training studies may stem from differences in training protocols, but can also be attributed to individual-specific adaptive responses to training stimuli (44, 45). Our training intervention in CP was no exception, with HVT resulting in considerable individual variations in change scores, as observed by the large range and standard deviations in values. The smallest worthwhile change (SWC) is indicated by a grey bar in Figure 11, where a level of 0.5 was used to ensure the SWC was higher than the calculated standard error of the mean (SEM= ). HVT resulted in structural improvements (increases in fascicle length) in 7 of the 8 participants, and functional improvements (increases in Pmax, Fmax and/or Vmax) in 5 of the 8 participants. 2 of the participants who had an increased fascicle length following the training period, did not demonstrate any significant functional improvements. This variation in response is not a result of adherence to the training sessions, or differences in intensity and volume for each participant, as all participants completed the same standardized HVT program with high (≥95%) adherence levels. It can be expected that a small proportion of participants will respond negatively or not at all to training, as the HERITAGE Family study by Barber et al. (2022) found the distribution of negative (low) training response scores to be approximately 4.5% across four phenotype traits (45). The results of this study were slightly higher, with approximately 12.5% (n = 1) of participants having a negative response to training.
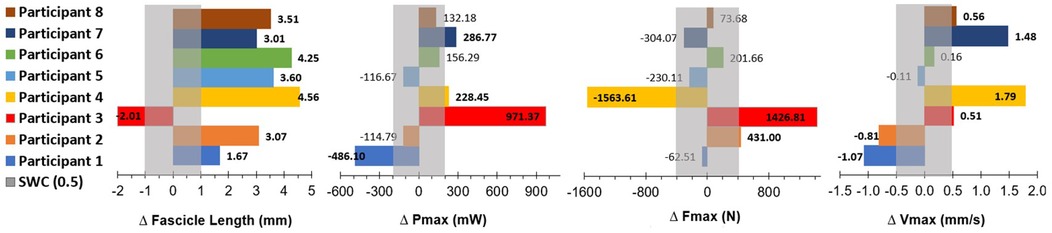
Figure 11. Data are pre-training values subtracted from post-training values (positive bold numbers indicate a change greater than the SWC after the intervention). SWC is indicated as the grey bar in each graph, and calculated as SWC = 0.5xSD. Pmax, peak power; mW, milliwatts; Fmax, peak isokinetic force; N, Newtons; Vmax, peak muscle shortening velocity; mm/s, millimeters per second; SWC, smallest worthwhile change (0.5*SD).
4.2 Force-length relationships
The force producing capability of muscle is influenced by several factors, and in this study, individuals with CP achieved an Fmax of only 36% relative to the HA group. These findings are supported by a significant reduction in triceps surae muscle MA (∼6.5 mm smaller), which would result in a decreased mechanical advantage of the triceps surae in producing effective moments during walking/running. A shorter MA would also result in a reduced muscle excursion for a given ankle joint rotation, allowing a slower muscle shortening velocity to achieve a given joint angular velocity. A slower muscle shortening velocity, while reducing maximal mechanical power output, would also reduce muscle activation needed to achieve a given muscle force. Our results revealed LG muscle activity to be significantly lower in CP-T (32% relative to HA, p = 0.006), along with a significantly higher plantarflexion co-activation ratio in CP-T (49.6% TA:LG) relative to the HA (18.3% TA:LG). The reduction in maximal ankle plantarflexion force may also be attributed to the increased passive force observed in the CP group, compared to HA. Other researchers have linked these differences in passive force to longer sarcomere lengths (6–8) and/or increased connective tissue and collagen deposition (6, 46).
The force-length relationship of muscle has been used in the literature as an indicator for longitudinal muscle fascicle growth (39, 47). A rightward shift in this relationship would indicate peak forces occurring at longer muscle lengths and suggest fascicle length has increased. This rightward shift was not observed in the force-length relationships for the CP-T or CP-NT groups (Figure 4), instead an upward shift in the CP-T group indicated participants were able to reach a higher percentage of their peak force at similar fascicle lengths following the training intervention. In the CP-NT group, a leftward shift resulted in peak force occurring at significantly shorter fascicle lengths following the intervention (p < 0.05), and aligns with data indicating a reduced resting fascicle length following the no-training period (p < 0.013). Considering whole muscle force-length relationships are accurately modelled as scaled sarcomeres, it's possible to relate these relationships to the sarcomere force-length relationship (48). The literature has suggested individuals with CP may have fewer sarcomeres in series for a given muscle length, and this would result in a relationship where sarcomeres operate on the descending region (longer sarcomere lengths) during contraction. This relationship was observed prior to interventions in 5 of the 8 CP participants (3 CP-T, 2 CP-NT), and not in any of the CP-T participants following training. Sarcomeres that operate on the ascending and plateau region of the relationship during contraction are considered to be at optimal length, as force capability is near maximal or maximal. This relationship was present in all (n = 8) CP-T participants following training, indicating an improvement in muscle force-length properties with HVT. It is also apparent that the CP-T group may be operating at shorter sarcomere lengths (on the ascending limb) during contraction, which may indicate an increase in number of sarcomeres in series (Figure 12).
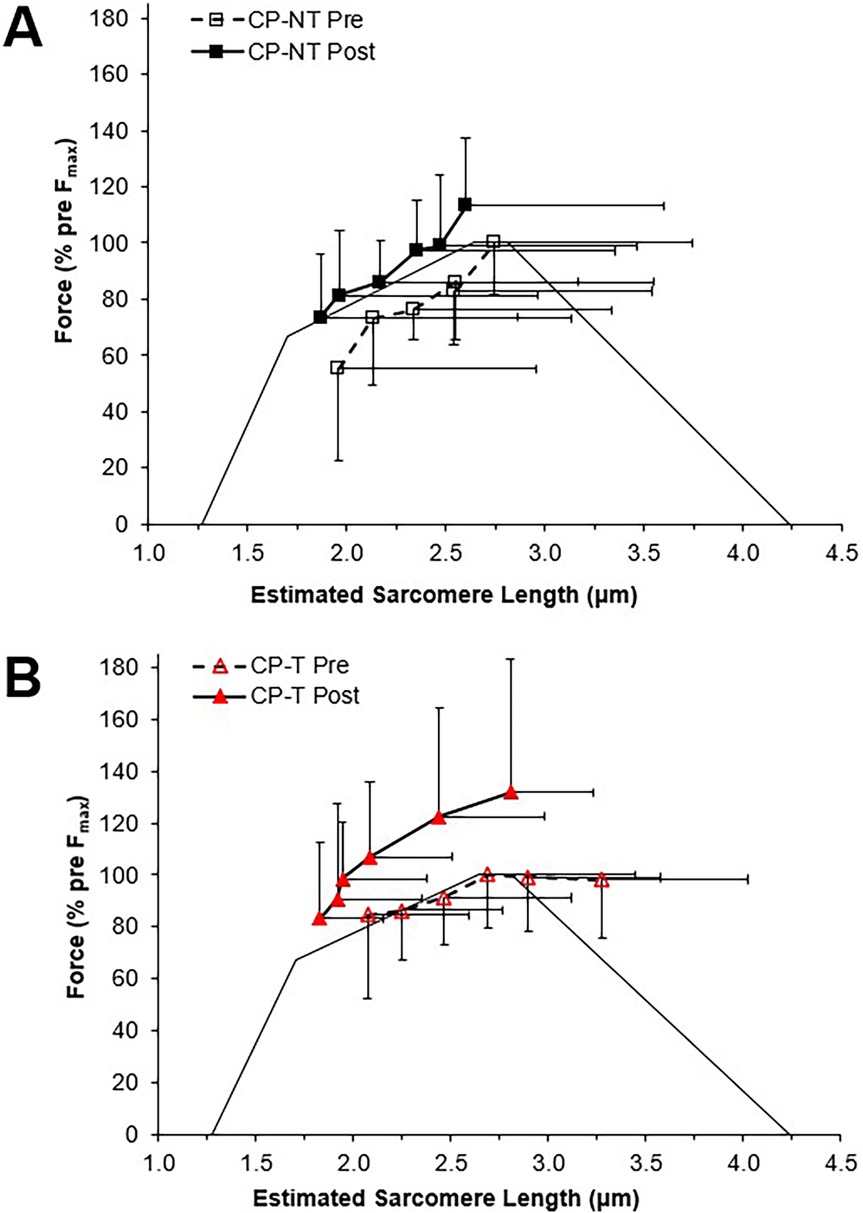
Figure 12. Estimated sarcomere force-length relationships for pre (dashed line, open symbol) and post (straight line, closed symbol) interventions. Data are mean ± SD. Active force is represented as a percentage of pre-intervention peak. (A) CP-NT ( ,
,  ). (B) CP-T (
 ,
,  ).
).
4.3 Force-velocity-power relationships
Our data confirm previous findings that individuals with CP produce a reduced MG force at higher velocities of movement (49) resulting in lower muscle power output. In addition, the maximum isokinetic angular velocity (estimated from a linear regression analysis) was significantly lower in the CP group (166.2 ± 43.2 deg•s−1), compared to the HA (351.0 ± 33.6 deg•s−1, p < 0.001). The goal with HVT would be to increase the muscles capability to shorten at higher velocities, which in turn would increase walking speeds and the ability to run and jump at higher (sport-specific) velocities. It is expected that a muscle with longer muscle fascicles will generate a greater force at the same absolute shortening velocity, as the shortening speed of each sarcomere in a fascicle would be relatively slower for a given speed of whole fiber shortening (13, 16). The mechanical power producing capability of a muscle can be evaluated through the force-velocity relationship, where increases in muscle force and/or muscle shortening velocity will result in increased peak power output. Therefore, an increased muscle fascicle length should result in a rightward shift of the force-velocity relationship, as observed following the training intervention in CP-T (estimated vmax increased by approximately 45%), but overall, no significant changes in Pmax, vmax and Fmax were observed. The variability in response between groups contributed to the lack of significant changes observed, and can be partially attributed to an increase in Pmax in 2 CP-NT participants following the 10-week (no-training) period. One of the two CP-NT participants reported completing training for an international para track cycling competition (change in Pmax = + 1,796.41 W) during the no-training period, which would have included training at high power outputs. The second CP-NT participant completed the training intervention first, and any post-intervention extracurricular activity or lagging performance improvements is unclear. The use of force-length and power-velocity relationships provided meaningful insights into the implications of HVT, suggesting this protocol will at the very least slow decrements observed in CP muscle structure and function, and more importantly, highlight performance improvements for CP-T participants.
4.4 Limitations
In this study, we focused specifically on the potential to increase MG fascicle lengths following HVT, with the notion that increased MG fascicle lengths would imply more sarcomeres in series. The latter has the potential to amplify MG muscle power output (the product of plantar flexor force and muscle-tendon shortening velocity) as a result of higher maximal shortening velocities. Because the aim of this study was to examine the impact of HVT on MG fascicle length changes, we did not specifically quantify the impact of other factors that might influence mechanical power output of the plantar flexors. For example, we did not specifically examine changes in Achilles' tendon properties as a result of HVT, which we acknowledge may also increase plantar flexor mechanical power output because tendons can return a portion of the mechanical strain energy stored during tendon stretch (50). Mechanical power output may also be elevated following HVT due to changes in neuromuscular activation (51) and/or total muscle volume (52). Future research incorporating direct assessments of these properties would provide a more comprehensive understanding of triceps surae function following HVT.
It is not possible to assume this training intervention only consisted of high velocity shortening contractions, as the participants were instructed to control their jump landings and decelerate after their sprints to minimize the chance of injury. Lengthening contractions under load have also been found to broaden the force-length relationship or the working range of muscle length in CP (53), which we can also not discount affecting the meaningful increase in fascicle lengths following the intervention period. Fascicle length increases were used to infer that increases in serial sarcomere number (sarcomerogenesis) were observed, but sarcomeres in series and sarcomere lengths were not directly measured in this study. This inference could be more substantial in this population, as sarcomere lengths have been found to be longer in individuals with CP (6–8). Visualizing and tracking muscle fascicles using ultrasound imaging can also be quite challenging in this population, due to altered muscle pathology (increased connective tissue and collagen deposition) (6, 46). These concerns are lessened in trained populations with higher muscle quality (54). To overcome these challenges, considerable care was taken, both in placement and individual ultrasound settings of depth, focus, power and gain to optimize the imaging of, and subsequent measurement of, individual MG fascicle lengths. Exemplar images of resting MG fascicles are shown in the Supplementary Material. The measurement of muscle fascicle lengths has been shown to be reliable across a broad range of experimental conditions (55), including in individuals with CP (56–59).
We did not directly measure muscle shortening via ultrasonography during the training intervention. We make the assumption that the joint angular velocities during the running, sprinting and jumping in this training program were truly high velocity, and above the maximal plantarflexion push-off velocities found in CP during walking (180–220°·s−1) (43).
Using exercises that could be implemented within the daily training environment was a priority for researchers of this study to be able to make realistic inferences on high-velocity training to changes to muscle architecture, and accompanying functional and performance changes. In a recent review of the literature, Davis et al. 2020 supported the development of exercise protocols using optimal training conditions (including exercise at an appropriately high velocity) in order to increase fascicle lengths by increasing the number of serial sarcomeres in spastic CP muscle (59). Specifically, the training protocols should satisfy the following: (1) involve eccentric exercise at relatively high velocity; (2) result in stretching of the muscle fascicles and (3) momentary deactivation of the stretched muscle (59). Our training protocol emphasized high-velocity muscle shortening (concentric) contractions, to stimulate increases in muscle fascicle length. It is important to acknowledge, that eccentric contractions could not be entirely eliminated during the HVT exercises, therefore, some fascicle stretch under load likely occurred. It is possible that the training conditions used in our study may not have satisfied all of these criteria, and thus been insufficient to observe structural or functional changes in all participants. Because we did not directly measure the stretching and activation of muscle during the training, the precise mechanisms for increased sarcomerogenesis with relatively high velocity training remains unknown. Some participants may have benefited from an increased frequency of sessions (> 2 sessions/week), or a longer training period (>10weeks). The variability in response of each group could also be attributed to our limitations to adequately control for training or physical activity performed outside of the training and control interventions. Lastly, the smaller sample size combined with high variability observed in our study may have precluded achieving statistically significant differences, particularly for the differences in Pmax across training and CP vs. HA groups. We have also reported effect sizes for this reason.
5 Conclusion
Although substantial differences between HA and CP remained after 10 weeks of HVT, our findings support the use of HVT as a viable intervention for improving muscle fascicle length, which may indicate an increase in sarcomeres in series in this population. Our study adds to the literature, how changes in fascicle length influence muscle function through force-length and force-velocity relationships of the plantarflexors in CP. Our approach prioritized exercises that are feasible in daily training environments, making the findings more applicable to the clinical management of CP. This practical application also allows practitioners the opportunity to broaden training prescriptions and target specific muscle architectural and functional changes. Additionally, our results highlight that high-functioning individuals with CP can safely perform maximal exertion exercises at high velocities, offering guidance for clinicians and strength & conditioning coaches aiming to incorporate this type of training. While promising architectural and functional adaptations to HVT were observed, future research should investigate prolonged training or the incorporation of movement-specific training and testing to further reduce the gap that exists between HA and CP. Overall, this study represents a key step toward more targeted and intensive training programs for individuals with CP, with the aim of improving both daily functioning and sport performance.
Data availability statement
The raw data supporting the conclusions of this article will be made available by the authors, without undue reservation.
Ethics statement
The studies involving humans were approved by The University of Calgary Conjoint Health Research Ethics Board. The studies were conducted in accordance with the local legislation and institutional requirements. Written informed consent for participation in this study was provided by the participants' legal guardians/next of kin.
Author contributions
TG: Conceptualization, Data curation, Formal analysis, Funding acquisition, Investigation, Methodology, Project administration, Resources, Software, Validation, Visualization, Writing – original draft, Writing – review & editing. BM: Conceptualization, Data curation, Formal analysis, Funding acquisition, Investigation, Methodology, Project administration, Resources, Software, Supervision, Validation, Visualization, Writing – original draft, Writing – review & editing. JF: Conceptualization, Data curation, Formal analysis, Funding acquisition, Investigation, Methodology, Project administration, Resources, Software, Supervision, Validation, Visualization, Writing – original draft, Writing – review & editing.
Funding
The author(s) declare that financial support was received for the research and/or publication of this article. The authors disclosed receipt of the following financial support for the research, authorship, and/or publication of this article: This work was supported by the Sport Science Association of Alberta (grant number 1043103) and the Natural Sciences and Engineering Research Council OF Canada (Grant #1032434 and RGPIN-2020-04817).
Acknowledgments
TLG was supported by the Alberta Association for Sport Science and Natural Sciences and Engineering Research Council (grant #1032434) to BRM supported the research. The funders had no role in study design, data collection and analysis, decision to publish, or preparation of the manuscript. This manuscript, including the related data, figures and tables have not been previously published, and this manuscript is not under consideration elsewhere.
Conflict of interest
The authors declare that the research was conducted in the absence of any commercial or financial relationships that could be construed as a potential conflict of interest.
Generative AI statement
The author(s) declare that no Generative AI was used in the creation of this manuscript.
Publisher's note
All claims expressed in this article are solely those of the authors and do not necessarily represent those of their affiliated organizations, or those of the publisher, the editors and the reviewers. Any product that may be evaluated in this article, or claim that may be made by its manufacturer, is not guaranteed or endorsed by the publisher.
Supplementary material
The Supplementary Material for this article can be found online at: https://www.frontiersin.org/articles/10.3389/fspor.2025.1558784/full#supplementary-material
Supplementary Figure S1 | Exemplar ultrasound images of resting MG fascicle lengths in a participant with CP (left) and a HA participant (right). Yellow dashed line shows the measured fascicle at rest.
References
1. Willerslev-Olsen M, Choe Lund M, Lorentzen J, Barber L, Kofoed-Hansen M, Nielsen JB. Impaired muscle growth precedes development of increased stiffness of the triceps surae musculotendinous unit in children with cerebral palsy. Dev Med Child Neurol. (2018) 60(7):672–9. doi: 10.1111/dmcn.13729
2. Lieber RL, Fridén J. Functional and clinical significance of skeletal muscle architecture. Muscle Nerve. (2000) 23(November):1647–66. doi: 10.1002/1097-4598(200011)23:11%3C1647::AID-MUS1%3E3.0.CO;2-M
3. Wickiewicz TL, Perrine JJ, Roy RR, Edgerton VR, Powell L, Thomas L, et al. Muscle architecture and force-velocity relationships in humans. J Appl Physiol Respir Environ Exerc Physiol. (1984) 57(2):435–43. doi: 10.1152/jappl.1984.57.2.435
4. Kruse A, Schranz C, Tilp M, Svehlik M. Muscle and tendon morphology alterations in children and adolescents with mild forms of spastic cerebral palsy. BMC Pediatr. (2018) 18(1):1–9. doi: 10.1186/s12887-018-1129-4
5. Cenni F, Bar-On L, Schless SH, Kalkman BM, Aertbelien E, Bruyninckx H, et al. Medial gastrocnemius muscle–tendon junction and fascicle lengthening across the range of motion analyzed in 2-D and 3-D ultrasound images. Ultrasound Med Biol. (2018) 44(12):2505–18. doi: 10.1016/j.ultrasmedbio.2018.07.012
6. Smith LR, Lee KS, Ward SR, Chambers HG, Lieber RL. Hamstring contractures in children with spastic cerebral palsy result from a stiffer extracellular matrix and increased in vivo sarcomere length. J Physiol. (2011) 589(10):2625–39. doi: 10.1113/jphysiol.2010.203364
7. Mathewson MA, Ward SR, Chambers HG, Lieber RL. High resolution muscle measurements provide insights into equinus contractures in patients with cerebral palsy. J Orthop Res. (2014) 33(1):33–9. doi: 10.1002/jor.22728
8. Leonard TR, Howard JJ, Larkin-Kaiser K, Joumaa V, Logan K, Orlik B, et al. Stiffness of hip adductor myofibrils is decreased in children with spastic cerebral palsy. J Biomech. (2019) 87:100–6. doi: 10.1016/j.jbiomech.2019.02.023
9. Kruse A, Schranz C, Svehlik M, Tilp M. Mechanical muscle and tendon properties of the plantar flexors are altered even in highly functional children with spastic cerebral palsy. Clin Biomech. (2017) 50(April):139–44. doi: 10.1016/j.clinbiomech.2017.10.019
10. Wiley ME, Damiano DL. Lower -extremity strength profiles in spastic cerebral palsy. Dev Med Child Neurol. (1998) 40:100–7. doi: 10.1111/j.1469-8749.1998.tb15369.x
11. Geertsen SS, Kirk H, Lorentzen J, Jorsal M, Johansson CB, Nielsen JB. Impaired gait function in adults with cerebral palsy is associated with reduced rapid force generation and increased passive stiffness. Clin Neurophysiol. (2015) 126(12):2320–9. doi: 10.1016/j.clinph.2015.02.005
12. Dallmeijer AJ, Baker R, Dodd KJ, Taylor NF. Association between isometric muscle strength and gait joint kinetics in adolescents and young adults with cerebral palsy. Gait Posture. (2011) 33(3):326–32. doi: 10.1016/j.gaitpost.2010.10.092
13. Moreau N, Holthaus K, Marlow N. Differential adaptations of muscle architecture to high-velocity versus traditional strength training in cerebral palsy. Neurorehabil Neural Repair. (2013) 27(4):325–34. doi: 10.1177/1545968312469834
14. van Vulpen LF, de Groot S, Rameckers E, Becher JG, Dallmeijer AJ. Improved walking capacity and muscle strength after functional power-training in young children with cerebral palsy. Neurorehabil Neural Repair. (2017) 31:1–15. doi: 10.1177/1545968317723750
15. Blazevich AJ, Gill ND, Bronks R, Newton RU, Gill ND. Training-specific muscle architecture adaptation after 5-wk training in athletes. Med Sci Sports Exerc. (2003) 35(12):2013–22. doi: 10.1249/01.MSS.0000099092.83611.20
16. Nasirzade A, Ehsanbakhsh A, Ilbeygi S, Sobhkhiz A, Argavani H, Aliakbari M. Relationship between sprint performance of front crawl swimming and muscle fascicle length in young swimmers. J Sports Sci Med. (2014) 13(3):550–6.25177181
17. Clark DJ, Condliffe EG, Patten C. Activation impairment alters muscle torque-velocity in the knee extensors of persons with post-stroke hemiparesis. Clin Neurophysiol. (2006) 117(10):2328–37. doi: 10.1016/j.clinph.2006.07.131
18. Fowler EG, Ho TW, Nwigwe AI, Dorey FJ. The effect of quadriceps femoris muscle strengthening exercises on spasticity in children with cerebral palsy. Phys Ther. (2001) 81(6):1215–23. doi: 10.1093/ptj/81.6.1215
19. Mockford M, Caulton JM. Systematic review of progressive strength training in children and adolescents with cerebral palsy who are ambulatory. Pediatr Phys Ther. (2008) 20(4):318–33. doi: 10.1097/PEP.0b013e31818b7ccd
20. Patten C, Condliffe EG, Dairaghi CA, Lum PS. Concurrent neuromechanical and functional gains following upper-extremity power training post-stroke. J Neuroeng Rehabil. (2013) 10(1):1. Available online at: Journal of NeuroEngineering and Rehabilitation. doi: 10.1186/1743-0003-10-1
21. Gillett JG, Lichtwark GA, Boyd RN, Barber LA. Functional anaerobic and strength training in young adults with cerebral palsy. Med Sci Sports Exerc. (2018) 50(8):1549–57. doi: 10.1249/MSS.0000000000001614
22. Bobbert M, Huijing P, Schenau G. Drop jumping II. The influence of dropping height on the biomechanics of drop jumping. Med Sci Sports Exerc. (1987) 18(4):339–46.
23. Bezodis IN, Kerwin DG, Salo AIT. Lower-limb mechanics during the support phase of maximum-velocity sprint running. Med Sci Sports Exerc. (2008) 40(4):707–15. doi: 10.1249/MSS.0b013e318162d162
24. Johnson MD, Buckley JG. Muscle power patterns in the mid-acceleration phase of sprinting. J Sports Sci. (2001) 19(4):263–72. doi: 10.1080/026404101750158330
26. Granata K, Abel M, Damiano DL. Joint angular velocity in spastic gait and the influence of muscle-tendon lengthening. J Bone Joint Surg. (2000) 82(2):174–86. doi: 10.2106/00004623-200002000-00003
27. Smeulders MJC, Kreulen M. Myofascial force transmission and tendon transfer for patients suffering from spastic paresis: a review and some new observations. J Electromyogr Kinesiol. (2007) 17(6):644–56. doi: 10.1016/j.jelekin.2007.02.002
28. Fletcher JR, MacIntosh BR. Estimates of achilles tendon moment arm length at different ankle joint angles: effect of passive moment. J Appl Biomech. (2018) 34:1–22. doi: 10.1123/jab.2016-0263
29. Fiebert IM, Applegate B, Spielholz NI, Parker IKL, Crabtree FG, Martin LA. A comparison of iEMG activity between the medial and lateral heads of the gastrocnemius muscle during partial weight bearing plantarflexion contractions at varying loads. Isokinet Exerc Sci. (2018) 8(2):65–72. doi: 10.3233/IES-2000-0036
30. Bar-On L, Kalkman BM, Cenni F, Schless SH, Molenaers G, Maganaris CN, et al. The relationship between medial gastrocnemius lengthening properties and stretch reflexes in cerebral palsy. Front Pediatr. (2018) 6(October):259. doi: 10.3389/fped.2018.00259
31. Hoffman B, Lichtwark GA, Carroll T, Cresswell AG. A comparison of two hill-type skeletal muscle models on the construction of medial gastrocnemius length-tension curves in humans in vivo. J Appl Physiol (1985). (2012) 113(1):90–6. doi: 10.1152/japplphysiol.00070.2012
32. MacIntosh BR, MacNaughton MB. The length dependence of muscle active force: considerations for parallel elastic properties. J Appl Physiol. (2005) 98(5):1666–73. doi: 10.1152/japplphysiol.01045.2004
33. Hill AV. The heat of shortening and the dynamic constants of muscle. Proc R Soc Lond B Biol Sci. (1938) 126(843):136–95. doi: 10.1098/rspb.1938.0050
34. Piazzesi G, Reconditi M, Linari M, Lucii L, Bianco P, Brunello E, et al. Skeletal muscle performance determined by modulation of number of myosin motors rather than motor force or stroke size. Cell. (2007) 131(4):784–95. doi: 10.1016/j.cell.2007.09.045
35. MacIntosh BR, Herzog W, Suter E, Wiley PJ, Sokolosky J. Human skeletal muscle fiber types and force: velocity properties. Eur J Appl Physiol. (1993) 67:499–506. doi: 10.1007/BF00241645
36. Tihanyi J, Apor P, Fekete G. Force-velocity-power characteristics and fiber composition in human knee extensor muscles. Eur J Appl Physiol Occup Physiol. (1982) 48(3):331–43. doi: 10.1007/BF00430223
37. An KN, Takahashi K, Harrigan TP, Chao EY. Determination of muscle orientations and moment arms. J Biomech Eng. (1984) 106(3):280. doi: 10.1115/1.3138494
38. Ichinose Y, Kawakami Y, Ito M, Fukunaga T. Estimation of active force-length characteristics of human vastus lateralis muscle.pdf. Acta Anat (Basel). (1997) 159(2–3):78–83. doi: 10.1159/000147969
39. Maganaris C. Force-length characteristics of the in vivo human gastrocnemius muscle. Clinical Anatomy. (2003) 16(3):215–23. doi: 10.1002/ca.10064
40. Gallinger TL, Fletcher JR, MacIntosh BR. Mechanisms of reduced plantarflexor function in cerebral palsy; smaller triceps surae moment arm and reduced muscle force. J Biomech. (2020) 110:109959. doi: 10.1016/j.jbiomech.2020.109959
41. McKinnon NB, Connelly DM, Rice CL, Hunter SW, Doherty TJ. Neuromuscular contributions to the age-related reduction in muscle power: mechanisms and potential role of high velocity power training. Ageing Res Rev. (2017) 35:147–54. doi: 10.1016/j.arr.2016.09.003
42. Abe T, Kumagai K, Brechue WF. Fascicle length of leg muscles is greater in sprinters than distance runners. Med Sci Sports Exerc. (2000) 32(6):1125–9. doi: 10.1097/00005768-200006000-00014
43. Kirk H, Geertsen SS, Lorentzen J, Krarup KB, Bandholm T, Nielsen JB. Explosive resistance training increases rate of force development in ankle dorsiflexors and gait function in adults with cerebral palsy. J Strength Cond Res. (2016) 30(10):2749–60. doi: 10.1519/JSC.0000000000001376
44. Pickering C, Kiely J. Do non-responders to exercise exist—and if so, what should we do about them? Sports Med. (2019) 49(1):1–7. doi: 10.1007/s40279-018-01041-1
45. Barber JL, Ruiz-Ramie JJ, Robbins JM, Gerszten RE, Leon AS, Rao DC, et al. Regular exercise and patterns of response across multiple cardiometabolic traits: the HERITAGE family study. Br J Sports Med. (2022) 56(2):95–100. doi: 10.1136/bjsports-2020-103323
46. De Bruin M, Smeulders MJ, Kreulen M, Huijing PA, Jaspers RT. Intramuscular connective tissue differences in spastic and control muscle: a mechanical and histological study. PLoS One. (2014) 9(6):e101038. doi: 10.1371/journal.pone.0101038
47. Proske U, Morgan DL. Muscle damage from eccentric exercise: mechanism, mechanical signs, adaptation and clinical applications. J Physiol. (2001) 537:333–45. doi: 10.1111/j.1469-7793.2001.00333.x
48. Lynn R, Morgan DL. Decline running produces more sarcomeres in rat vastus intermedius muscle fibers than does incline running. J Appl Physiol. (1994) 77(3):1439–44. doi: 10.1152/jappl.1994.77.3.1439
49. Damiano DL, Martellotta TL, Quinlivan JM, Abel MF. Deficits in eccentric versus concentric cerebral palsy. Med Sci Sports Exerc. (2000) 33(1):117–22. doi: 10.1097/00005768-200101000-00018
50. Blazevich AJ, Fletcher JR. More than energy cost: multiple benefits of the long achilles tendon in human walking and running. Biological Reviews. (2023) 98(6):2210–25. doi: 10.1111/brv.13002
51. Cormie P, Mcguigan MR, Newton RU. Developing Maximal Neuromuscular Power Part 1-Biological Basis of Maximal Power Production.
52. Chelly MS, Chérif N, Ben Amar M, Hermassi S, Fathloun M, Bouhlel E, et al. Relationships of peak leg power, 1 maximal repetition half back squat, and leg muscle volume to 5-m sprint performance of junior soccer players. J Strength Cond Res. (2010) 24(1):266–71. doi: 10.1519/JSC.0b013e3181c3b298
53. Reid S, Hamer P, Alderson J, Lloyd DG. Neuromuscular adaptations to eccentric strength training in children and adolescents with cerebral palsy. Dev Med Child Neurol. (2010) 52(4):358–63. doi: 10.1111/j.1469-8749.2009.03409.x
54. Fukumoto Y, Taniguchi M, Hirono T, Yagi M, Yamagata M, Nakai R, et al. Association of regional muscle thickness and Echo intensity with muscle volume, intramuscular adipose tissue, and strength of the quadriceps femoris. Clin Interv Aging. (2023) 18:1513–21. doi: 10.2147/CIA.S424504
55. Kwah LK, Pinto RZ, Diong J, Herbert RD. Reliability and validity of ultrasound measurements of muscle fascicle length and pennation in humans: a systematic review. J Appl Physiol. (2013) 114:761–9. doi: 10.1152/japplphysiol.01430.2011
56. Liu W, Wu HD, Ling YT, Shea QTK, Nazari V, Zheng YP, et al. Reliability and validity of assessing lower-limb muscle architecture of patients with cerebral palsy (CP) using ultrasound: a systematic review. J Clin Ultrasound. (2023) 51(7):1212–22. doi: 10.1002/jcu.23498
57. Mohagheghi AA, Khan T, Meadows TH, Giannikas K, Baltzopoulos V, Maganaris CN. Differences in gastrocnemius muscle architecture between the paretic and non-paretic legs in children with hemiplegic cerebral palsy. Clin Biomech (Bristol, Avon). (2007) 22(6):718–24. doi: 10.1016/j.clinbiomech.2007.03.004
58. Moreau NG, Teefey SA, Damiano DL. In vivo muscle architecture and size of the rectus femoris and vastus lateralis in children and adolescents with cerebral palsy. Dev Med Child Neurol. (2009) 51(10):800–6. doi: 10.1111/j.1469-8749.2009.03307.x
Keywords: sarcomerogenesis, neurological disorder, power, sprint agility, force-length, force-velocity, para sport
Citation: Gallinger TL, MacIntosh BR and Fletcher JR (2025) Muscle fascicle length adaptations to high-velocity training in young adults with cerebral palsy. Front. Sports Act. Living 7:1558784. doi: 10.3389/fspor.2025.1558784
Received: 11 January 2025; Accepted: 23 April 2025;
Published: 13 May 2025.
Edited by:
Lorenzo Rum, University of Sassari, ItalyReviewed by:
Francesco Cenni, University of Jyväskylä, FinlandAmir A. Mohagheghi, Brunel University London, United Kingdom
Copyright: © 2025 Gallinger, MacIntosh and Fletcher. This is an open-access article distributed under the terms of the Creative Commons Attribution License (CC BY). The use, distribution or reproduction in other forums is permitted, provided the original author(s) and the copyright owner(s) are credited and that the original publication in this journal is cited, in accordance with accepted academic practice. No use, distribution or reproduction is permitted which does not comply with these terms.
*Correspondence: Jared R. Fletcher, amZsZXRjaGVyQG10cm95YWwuY2E=