 Ben Csiernik
 Mikaeli Cavell2
 Nick Wattie
- 1Faculty of Health Sciences, Ontario Tech University, Oshawa, ON, Canada
- 2Athletics Department, Ontario Tech University, Oshawa, ON, Canada
The purpose of this study was to examine the differences and similarities in shooting and scoring trends between collegiate women's hockey, and professional men's and women's hockey. A multinomial logistic regression using shot data from the Ontario University Athletics women's hockey league, Professional Women's Hockey League, and the National Hockey League revealed statistically significant differences, indicating that each league has unique shooting patterns. Understanding that each league has different shooting and scoring profiles is relevant to coaches, who may benefit from using normative data from their own leagues to support decision making, rather than results from other leagues.
Introduction
With increased data availability, advanced analytics have become an integral part of high level sport (1, 2). Despite analytics being used among professional organizations and conducted in public forums (i.e., blogs), research in ice hockey has lagged behind relative to other more global sports. Currently, the National Hockey League (NHL) and the Professional Women's Hockey League (PWHL) record event tracking data, including shot location and outcomes, that are accessible via an application programming interface, making some event data accessible to the public. Importantly, limitations surrounding data availability has made it difficult to analyze ice hockey at the professional level to the same degree as other sports. For example, publicly available tracking data in football that is not available in ice hockey currently includes passing events, allowing for greater opportunities for analysis (3). These differences are further compounded when analyzing sub-elite level sport (i.e collegiate ice hockey), where all event data must be manually recorded as no publicly available data exists.
To date, when comparing sub-elite athletes to professional ice hockey athletes, most research has focused on physiological differences (4, 5) rather than tactical considerations and approaches. While this is undoubtedly important, it is equally as important for coaches to understand the skill and tactical differences that exist between these groups so they can appropriately guide athlete development, and team performance. Previous work examining men's and women's football has identified that notable differences exist in shooting and scoring behavior (6, 7). Specifically, research has shown that in professional football, women have distinctive shooting and scoring patterns when compared to men, where women have a greater shooting conversion percentage, score more goals per game, and take shots with higher quality by shooting from closer to the net and the midline of the pitch (6, 7). Despite this line of inquiry seen in football, limited research exists examining this difference in ice hockey (8). Therefore, the purpose of this study is to examine the similarities and differences in shooting and scoring patterns between collegiate women's hockey, professional women's hockey, and professional men's hockey.
Methods
Shot information, including the X and Y location of the shot, and the shot outcome, was collected for three leagues: the Ontario University Athletics (OUA) women's hockey league, the Professional Women's Hockey League (PWHL), and the NHL. No data from men's collegiate hockey was included due to a lack of data availability. Unblocked shot attempts, which include shot attempts stopped by the goaltender, or are shot wide of the net, from the OUA were recorded from games between 2023 and 2025. Unblocked shot attempts from the PWHL were retrieved from Gilles Dignard's public database from the 2023–2024 season1, and unblocked shot attempts from the NHL were retrieved from MoneyPuck.com for the 2023–2024 season2. Given that the NHL features more teams and games per year, a sample of NHL games matching the number of OUA games was used. All shot attempts towards an empty net (with no goaltender currently on the ice) were excluded from the analysis, as shot behavior is modified by the absence of a defending goaltender. Additionally, all shots originating from below the goal line were excluded due to uncertainty surrounding how shot data was collected. Lastly, all shot data across the three leagues includes all even strength, power play, and penalty kill opportunities.
To compare shooting patterns, shot attempts from each league were binned into one of nine scoring zones (Figure 1), similar to original zones created by WAR on Ice3. These zones were originally created based on goal scoring frequencies in the NHL. Using these nine categories (which collapse left and right zones of the ice), the number of shot attempts occurring in each zone was totaled for each team in every game. In total, shots from 192 complete games were analyzed from the OUA and NHL, and 72 games from the PWHL. To compare league shooting similarities, a multinomial logistic regression was used where the league was the dependent variable, and each shooting zone was used as independent variables. Checking model assumptions revealed independence between variables and leagues, and predictive probabilities correctly identified games belonging to the NHL 64.8% of the time, the OUA 69.8% of the time, and the PWHL 53.% of the time. Results were interpreted using marginal effects to allow for the comparison of shot patterns between leagues by zone. In each case, summing the marginal effects of each unique shot zone across the three leagues results in a value of 0. Therefore, leagues showing nearly identical shooting trends would have similar marginal effects. In the case where no differences existed across the three leagues in a scoring zone, the marginal effect would be near zero for each league. After Bonferroni adjustment was applied to account for multiple tests across zones, the statistical significance threshold was p < .002. Marginal effects were created using the “marginaleffects” package in R, while all data cleaning and visualizations were conducted using the “tidyverse” package using R statistical software (9–11). This project received research ethics exemption from Ontario Tech University (#18783).
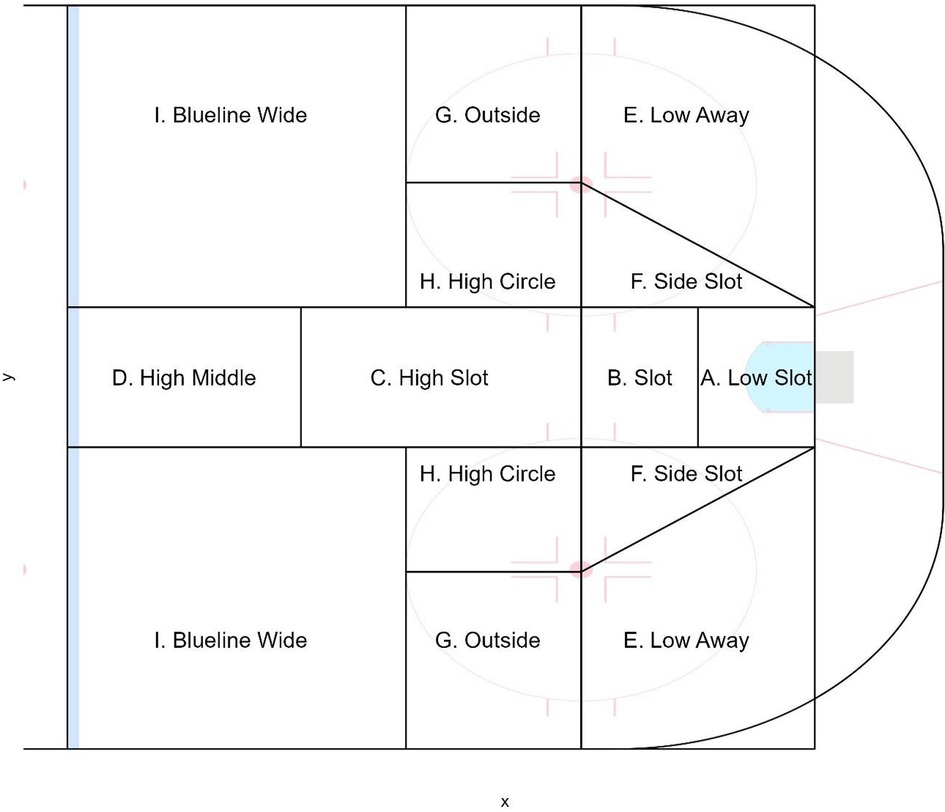
Figure 1. Scoring zone chart.
Results
In total, 6,088 PWHL shot attempts, 15,930 NHL shot attempts, and 14,078 OUA shot attempts (13,978 included in the regression analysis), were included. The number of shots and goals seen per 1,000 unblocked shot attempts, as well as the results from the multinomial logistic regression model are found in Table 1.
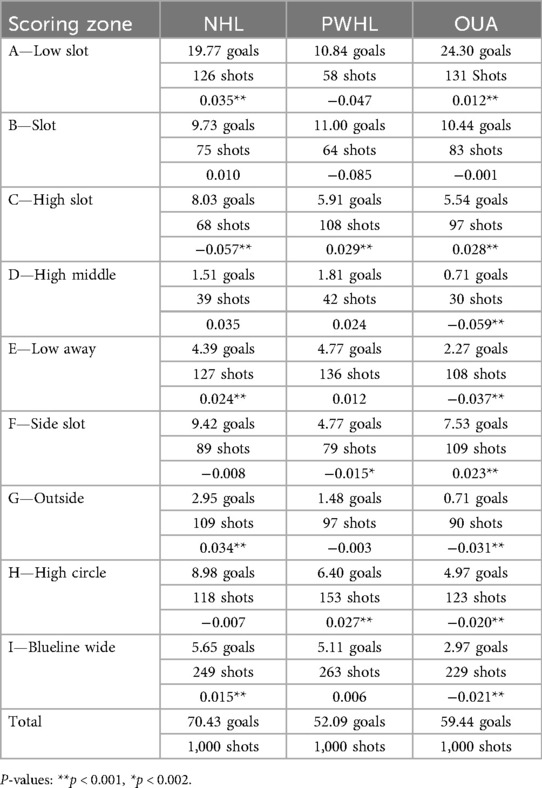
Table 1. Goals and unblocked shot attempts by zone per 1,000 unblocked shot attempts, and marginal effects.
The results from the multinomial logistic regression model, and the adjusted goal and shooting rates, highlight that there are distinctive shot patterns exhibited across the three leagues examined. Across the leagues, a number of shooting zones demonstrated statistically significant differences, indicating that shot volume differs by league across the zones. When comparing the OUA with the PWHL in contrast to the NHL, only the high slot zone shared similar marginal effects between the two women's leagues relative to the men's league.
The number of goals and shots from each league and shooting zone per 1,000 unblocked shot attempts can also be found in Table 1. Despite differences in shot volume patterns, the OUA and the PWHL shared similar scoring characteristics in the High Slot, and demonstrated similar shooting percentages in the High Slot, the Side Slot, and the High Circle (Table 2). In these specific zones, the OUA and the PWHL took a similar, or much greater number of unblocked shots from these areas relative to the NHL, despite scoring approximately 50% less from these same areas, highlighting a difference in shooting efficiency in the NHL relative to the two women's leagues. Additionally, both the percentage of shots from each zone (shot share), and the percentage of goals for each zone (goal share), can be found by league in Table 3. In each case, summing the shot share, and goal share from each zone will total to 100 percent rounded, accounting for all shots in the datasets.
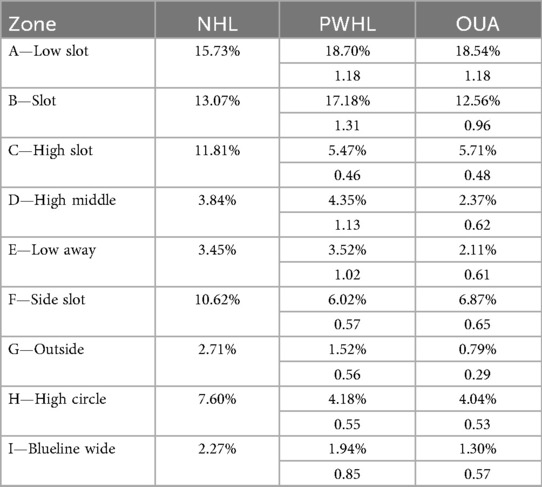
Table 2. Shooting percentage, and women's leagues shooting percentage ratio to NHL.
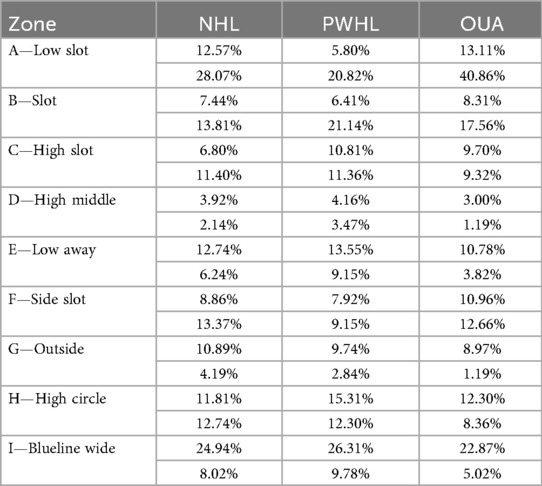
Table 3. Shot share, and goal share by league and zone.
Discussion
The purpose of this study was to empirically compare shooting and goal scoring between collegiate women's hockey, professional women's hockey, and professional men's hockey. As demonstrated in Table 1, while some similarities existed between leagues, there are clear differences in shot location, and shooting and goal scoring patterns across the three leagues. The results from this analysis demonstrate that both shot opportunity and goal scoring differ between the men's and women's leagues, suggesting that specific considerations are necessary on a per league basis.
Overall, differences exist between leagues regardless of the measurement used to evaluate shooting behavior, including shooting and scoring frequencies, shot share, goal share, and shooting percentage. Beyond the significant differences between the three leagues, an interesting trend emerged in goal scoring and its potential downstream impact on shooting behavior. In the High Slot, Side Slot, and High Circle, men's professional hockey players demonstrated a shooting percentage that was at least 54% greater (range 54%–116%) than that of the two women's leagues. For example, NHL players scored on 11.81% of their shots in the High Slot, while only 5.47% and 5.71% of shots from that same zone were goals in the PWHL and OUA, respectively. Interestingly, with the exception of the Side Slot area for the PWHL, the women's hockey leagues took more shots from those zones than NHL players, despite the notable difference in shooting percentage. While the reason for this trend is unclear, plausible explanations exist. First, it may be possible that the defensive approaches seen in women's hockey lead to players shooting from these areas more, as they may be contested differently relative to the NHL. While some published research in men's ice hockey has examined tactical structures using spatiotemporal data, the lack of data availability in women's hockey remains a limiting factor for analysis and interpretation of the current findings (12). Secondly, these findings could be explained by a form of survivorship bias, where women's hockey athletes and coaches may be influenced by the scoring trends exhibited in men's professional hockey. For example, athletes and coaches may see a high number of goals from the High Slot and High Circle areas in the NHL, and assume that these areas may provide equal value in women's ice hockey. Currently, limited published literature exists examining how tactical approaches are taught in women's hockey, though some evidence exists identifying that youth ice hockey coaches learn through mentorship and formal education programs (13, 14). However, it is uncertain if this mentorship and education is informed by appropriate and applicable data sources. Future research should examine specifically where coaches and women's ice hockey athletes learn from in order to better understand what influences player and coaching tactics. Given that the scoring and shooting rates differ as strongly as they do between women's and men's hockey, further examination is necessary to evaluate if changing offensive tactical approaches would lead to greater overall goal scoring in women's ice hockey.
Despite the differences seen in shooting behaviors, some important similarities existed between leagues. First, for each league, the greatest number of goals, and highest shooting percentages, came from the low slot and the slot. This finding is unsurprising, as research across multiple sports (ice hockey, soccer) have found that proximity to the net is the strongest predictor of goal scoring probability (2, 6). Secondly, the blueline wide zone featured the greatest number of shots across each league despite having one of the lowest shooting percentages for each respective league. This high shot volume is partly explained by this zone representing the largest geographical area, but likely also has tactical implications for each league. Collectively, when examining shooting and scoring behaviors, both similarities and distinct differences exist across leagues.
Limitations
While this paper serves as an important first step in comparing and contrasting elite men's and women's ice hockey with sub-elite women's ice hockey, there are some limitations worth addressing. First, the comparison zones used in this study are adapted from professional men's hockey, and as such, may not be equally representative if they were created from women's professional data. Despite this and differences seen in shot conversion, both women's leagues showed some similarity in goal share in each zone, when taking into account the number of shots, that support the original design of these shooting zones created by WAR on ice. Further, the data used in this study examines shooting and scoring distributions at a general level, and did not include other variables that could influence scoring (e.g., shot velocity), or contextual information, such as if a shot was preceded by a pass crossing the midline, which has been shown to increase the probability of a shot resulting in a goal (15). Collectively, future work should examine contextual factors (e.g., score effects, team level effects), as well as other task constraints (e.g., defensive/offensive structures, and playing styles) to gather a more conclusive understanding of the differences and similarities across leagues. Lastly, it is important note that future research should explore these relationships with larger datasets across multiple seasons.
Conclusion
Collectively, this work demonstrates likely differences in shooting and scoring trends across women's collegiate, women's professional, and men's professional hockey. Acknowledging how each league is uniquely successful is important, as normative data should be used to inform coaches’ pedagogical and tactical decisions. Clear opportunity exists for coaches and athletes who are willing to use league specific data to inform their offensive approach, while acknowledging that implementing tactical approaches from other leagues may not be applicable.
Data availability statement
The raw data supporting the conclusions of this article will be made available by the authors, without undue reservation.
Author contributions
BC: Writing – original draft, Writing – review & editing. MC: Writing – original draft, Writing – review & editing. KN: Writing – original draft, Writing – review & editing. NW: Writing – original draft, Writing – review & editing.
Funding
The author(s) declare that no financial support was received for the research and/or publication of this article.
Conflict of interest
The authors declare that the research was conducted in the absence of any commercial or financial relationships that could be construed as a potential conflict of interest.
Generative AI statement
The author(s) declare that no Generative AI was used in the creation of this manuscript.
Any alternative text (alt text) provided alongside figures in this article has been generated by Frontiers with the support of artificial intelligence and reasonable efforts have been made to ensure accuracy, including review by the authors wherever possible. If you identify any issues, please contact us.
Publisher's note
All claims expressed in this article are solely those of the authors and do not necessarily represent those of their affiliated organizations, or those of the publisher, the editors and the reviewers. Any product that may be evaluated in this article, or claim that may be made by its manufacturer, is not guaranteed or endorsed by the publisher.
Footnotes
1. ^https://docs.google.com/spreadsheets/d/16GcIISv3FISAA7xuZNDV8glzQklZyDCDbPJYnOjymus
2. ^https://moneypuck.com/data.htm
3. ^http://blog.war-on-ice.com/new-defining-scoring-chances/index.html
References
1. Goes FR, Meerhoff LA, Bueno MJO, Rodrigues DM, Moura FA, Brink MS, et al. Unlocking the potential of big data to support tactical performance analysis in professional soccer: a systematic review. Eur J Sport Sci. (2021) 21(4):481–96. doi: 10.1080/17461391.2020.1747552
2. Nandakumar N, Jensen ST. Historical perspectives and current directions in hockey analytics. Annu Rev Stat Appl. (2019) 6:19–36. doi: 10.1146/annurev-statistics-030718-105202
3. Xiao L, Xiangyu C, Song G, Carrilho D, Clemente FM, Bo H, et al. Do contextual factors cause differences in passing performance between men and women? A network metrics analysis of the 2022 men’s and 2023 women’s FIFA world cups using mixed linear models. Int J Perform Anal Sport. (2025):1–22. doi: 10.1080/24748668.2025.2531627
4. Douglas AS, Rotondi MA, Baker J, Jamnik VK, Macpherson AK. A comparison of on-ice external load measures between subelite and elite female ice hockey players. J Strength Cond Res. (2022) 36(7):1978. doi: 10.1519/JSC.0000000000003771
5. Vigh-Larsen JF, Beck JH, Daasbjerg A, Knudsen CB, Kvorning T, Overgaard K, et al. Fitness characteristics of elite and subelite male ice. J Strength Cond Res. (2019) 33(9):2352–60. doi: 10.1519/JSC.0000000000003285
6. Bransen L, Davis J. Women’s football analyzed: interpretable expected goals models for women. AI for sports analytics (AISA) workshop. International Joint Conference on Artificial Intelligence (2021).
7. Worville T. Explained: How Different are Men’s and Women’s Football? New York, NY: The New York Times (2020). Available online at: https://www.nytimes.com/athletic/1756375/2020/04/20/womens-vs-mens-football-the-trends/
8. Gonzalez-Rodenas J, Mitrotasios M, Armatas V, Aranda R. Effects of gender, age and match status on the creation of shooting opportunities during the U17, U20 and senior FIFA world cup: a multilevel analysis. J Human Sport Exerc. (2023) 18(4):941–53. doi: 10.14198/jhse.2023.184.17
9. Arel-Bundock V. marginaleffects: Predictions, Comparisons, Slopes, Marginal Means, and Hypothesis Tests (2021). doi: 10.32614/CRAN.package.marginaleffects
10. R Core Team. R: A Language and Environment for Statistical Computing. [Computer Software]. Vienna: R Foundation for Statistical Computing (2022). Available online at: https://www.R-project.org/
11. Wickham H, Averick M, Bryan J, Chang W, McGowan LD, François R, et al. Welcome to the tidyverse. J Open Source Softw. (2019) 4(43):1686. doi: 10.21105/joss.01686
12. Arsenault J, Cunniff M, Tulsky E, Forbes JR. Spatial roles in hockey special teams. J Quant Anal Sports. (2024) 20(3):235–50. doi: 10.1515/jqas-2023-0019
13. Callary B, Werthner P, Trudel P. Exploring coaching actions based on developed values: a case study of a female hockey coach. Int J Lifelong Ed. (2013) 32(2):209–29. doi: 10.1080/02601370.2012.733974
14. Wright T, Trudel P, Culver D. Learning how to coach: the different learning situations reported by youth ice hockey coaches. Phys Ed Sport Pedag. (2007) 12(2):127–44. doi: 10.1080/17408980701282019
Keywords: performance, sport, tactics, behavior, strategy
Citation: Csiernik B, Cavell M, Nauboris K and Wattie N (2025) A comparison of shot selection and goal scoring between collegiate and professional women’s and men’s ice hockey. Front. Sports Act. Living 7:1648099. doi: 10.3389/fspor.2025.1648099
Received: 16 June 2025; Accepted: 30 September 2025;
Published: 20 October 2025.
Edited by:
Yiwei Wu, Beijing Sport University, ChinaReviewed by:
Sachin Narayanan, Florida State University, United StatesMaha Yazbeck, Lebanese American University—Byblos Campus, Lebanon
Copyright: © 2025 Csiernik, Cavell, Nauboris and Wattie. This is an open-access article distributed under the terms of the Creative Commons Attribution License (CC BY). The use, distribution or reproduction in other forums is permitted, provided the original author(s) and the copyright owner(s) are credited and that the original publication in this journal is cited, in accordance with accepted academic practice. No use, distribution or reproduction is permitted which does not comply with these terms.
*Correspondence: Ben Csiernik, YmVuLmNzaWVybmlrQG9udGFyaW90ZWNodS5uZXQ=