 Christin Ambaum
 Matthias W. Hoppe
- Exercise Science, Institute of Sport Science and Motology, Philipps University Marburg, Marburg, Germany
Introduction: Energy metabolism during sports and exercise involves both aerobic and anaerobic pathways, with anaerobic contribution playing a key role in various decisive moments during competition. However, unlike the aerobic contribution, quantifying the anaerobic contribution remains challenging due to the lack of a gold standard. This review aims to systematically assess the reliability and validity of different methods to quantify the aerobic-anaerobic energy contributions during sports and exercise, thereby clarifying the level of evidence supporting each method.
Methods: The search was conducted according to the Preferred Reporting Items for Systematic Reviews and Meta-Analyses (PRISMA) 2020 guidelines, including the databases PubMed, Web of Science, Cochrane Library, and BISp-surf on June 11, 2024. Studies quantifying and evaluating the aerobic-anaerobic energy contributions during sports and exercise in humans without diseases, injuries, or disabilities were deemed eligible. Methodological quality was assessed using the COSMIN checklist rating reliability, measurement error, and validity, whereby the overall score was determined using the worst-score-count method. A best-evidence synthesis was also performed to define the direction and level of evidence.
Results: Of the 2,120 studies identified, 34 met the eligibility criteria. Overall, five different methods to quantify aerobic-anaerobic energy contributions during sports and exercise were identified: (i) maximal accumulated oxygen deficit (MAOD), (ii) PCr-La-O2, (iii) critical power (CP), (iv) gross efficiency (GE), and (v) the bioenergetic model. Regarding their reliability and validity, the best-evidence synthesis demonstrated that evidence was strong for MAOD and limited to strong for CP and PCr-La-O2, and limited to conflicting for GE and the bioenergetic model. Additionally, the validation studies revealed, that the methods differ in terms of their applicability and precision to quantify the anaerobic alactic and lactic contribution.
Discussion: To quantify the aerobic-anaerobic energy contributions during sports and exercise, the MAOD emerged as the most evaluated method and the only one with strong evidence for both reliability and validity. However, as the PCr-La-O2 method is the only approach that can distinguish between anaerobic alactic and lactic contributions using direct physiological measures, it should be further evaluated.
1 Introduction
Energy metabolism during sports and exercise involves three main pathways: phosphocreatine (PCr) hydrolysis, fast glycolysis with lactate formation, and oxidative phosphorylation of different substrates (1). Their relative contributions are dynamically modulated by exercise intensity and substrate availability (1). Among these pathways, especially the anaerobic energy metabolism plays a key role in various decisive moments during competition: for example, during accelerations and counterattacks in intermittent sports, as well as breakaways and final sprints during endurance disciplines (2, 3). Despite its significance, quantification of the anaerobic contribution remains challenging. Unlike the aerobic contribution, which can be validly assessed by oxygen (O2) uptake and respiratory gas analyzers, anaerobic contribution lacks a universally accepted gold standard (4). Consequently, multiple approaches have been proposed to estimate anaerobic contribution across different exercise modalities, resulting in the development of various methods and methodological frameworks. However, since the aerobic and anaerobic energy systems are intricately interconnected, knowledge of both systems is necessary (5). With respect to the anaerobic energy contribution during sports and exercise, five different methods were frequently investigated.
The first method is the maximal accumulated oxygen deficit (MAOD). It is based on the principle that, during high-intensity exercise exceeding maximal oxygen uptake, the total energy demand surpasses the capacity of aerobic supply, necessitating anaerobic energy supply (6). Since there is a linear relationship between power output and oxygen uptake, the MAOD can be determined by subtracting the total measured oxygen uptake over the course of supramaximal exercise from the estimated accumulated oxygen demand (6). As a result, MAOD quantifies the difference between the estimated total oxygen demand and the actual oxygen uptake, reflecting the energy provided by anaerobic metabolic pathways (7).
The second method is the PCr-La-O₂ method. Contrary to MAOD, it describes the energy supply as the sum of three components: PCr breakdown, fast glycolysis, and oxidative phosphorylation (8). This method is fundamentally linked to the excess post-exercise oxygen consumption (EPOC), particularly the fast component (EPOCfast) (9, 10). Since the PCr-La-O₂ method accounts for PCr as a primary anaerobic energy source, it directly corresponds to EPOCfast, which is dominated by the replenishment of PCr and restoration of oxygen stores, requiring increased post-exercise oxygen uptake (11). Therefore, only the PCr-La-O₂ method allows for the distinction between anaerobic alactic and lactic energy contributions (12).
A third method is the critical power (CP) (13). It represents the highest sustainable power output that can be maintained over an extended time period and at which adenosine triphosphate (ATP) resynthesis is predominantly supported by oxidative phosphorylation (14). Below CP, oxygen uptake reaches a plateau, where ATP resynthesis is primarily driven aerobic. Contrary, exceeding CP leads to an increased reliance on fast glycolysis, accelerating muscular glycogen depletion and accumulation of lactate (15). Thus, the curvilinear power-time relationship used to define CP provides an estimate of the finite anaerobic work capacity (W'), reflecting the energy produced by PCr hydrolysis, fast glycolysis, and myoglobin oxygen stores (16). Therefore, the capacity to perform work above CP is limited.
The fourth method is the gross efficiency (GE). It allows to quantify the mechanical efficiency of muscular work during exercise, particularly during cycling. It is defined as the ratio of mechanical power output to metabolic power input (17). The power input can be calculated from the oxygen uptake and its equivalent. The aerobic power can be calculated from the metabolic power input and efficiency at which metabolic power is converted to mechanical power (16). Subsequently, the anaerobic mechanical power can be calculated by subtracting the aerobically ascribable mechanical power from the total power output produced.
The last approach is the bioenergetic model, which mathematically represents the contribution and interaction of the aerobic, lactic, and alactic metabolic pathways during exercise based on changing intensity and duration (18, 19). Using a hydraulic tank analogy, each energy system is modeled as a reservoir with specific capacities and flow rates. Aerobic metabolism responds more slowly but is sustained, while lactic and alactic systems react rapidly with limited capacity. Governed by differential equations, the model simulates energy system dynamics from oxygen uptake and power output data, allowing individualized estimation under variable-intensity conditions (18, 19).
Since the quantification of aerobic-anaerobic energy contributions is based on the methods used (16), the results completely underly its determinations. Consequently, it is essential to consider their reliability and validity. Taking this and the five described methods to estimate the energy contribution during sports and exercise into account, previous research has either investigated the reliability of one method or compared two methods in terms of their validity (20–24). Since the methods were introduced across different decades and have been modified to varying extents (4), there are disparities in the number of application- and evaluation-based studies. Preliminarily, based on the available studies, but without scientific evidence, MAOD seems to be the most commonly used and studied method in the field. With regard to overview studies, a limited number of narrative reviews have examined MAOD and CP in terms of their influencing factor and practical applications (4, 16, 25–27). Moreover, there is only one narrative review, discussing the advantages, limitations, and practical applications of MAOD, CP, and GE (16). Unfortunately, this review did not consider the PCr-La-O₂ method. While the narrative reviews provide detailed background information about the underlying energy metabolism (4, 16, 25–27), there is, to the best of our knowledge, no systematic review that highlights the evaluation and extracts the reliability and validity of the different methods yet.
Therefore, this systematic review aims to assess the reliability and validity of different methods to quantify the aerobic-anaerobic energy contributions during sports and exercise, thereby clarifying the level of evidence for each method.
2 Methods
2.1 Search strategy
The systematic review was conducted according to the Preferred Reporting Items for Systematic Reviews and Meta-Analyses (PRISMA) 2020 guidelines (28). The literature search included the databases PubMed, Web of Science, Cochrane Library, and BISp-surf and was completed on June 11, 2024. The PICO (P = Population, I = Intervention, C = Comparison, O = Outcome) scheme (28) was used to develop a search strategy: P = everyone who is suitable for sports and exercise, except for patients with diseases, injuries, or disabilities; I = methods to quantify aerobic-anaerobic energy contributions during sports and exercise; C = evaluation, reliability, or validity; O = proportion of aerobic-anaerobic supply. However, the component for Population (P) was excluded from the search term to make sure that all type of athletes were included. The subsequent search term was applied to all databases with no restrictions: (component model OR maximal accumulated oxygen deficit OR MAOD OR critical power OR CP OR gross efficiency OR GE OR metabolic power model OR Pmet OR VLamax OR PCr-La-O2 OR muscle biopsy OR MRI OR fast component OR EPOC fast) AND (sports OR exercise OR test) AND (evaluation OR reliability OR validity OR comparison OR relationship) AND (anaerobic). All results were converted into a citation manager (Clarivate Analytics, EndNote X9.2, London, UK) and transferred to a spreadsheet (Microsoft Office, Excel 2021, Redmond, USA). After duplicates were removed, titles, abstracts, and full texts were screened for eligibility criteria. Studies that were considered to be unfitting were eliminated. In addition, supplementary search was performed by reviewing the reference lists of the studies considered eligible. All methodological procedures were completed independently by two researchers. When disagreement arose, consensus was reached through discussion or the decision of a third researcher.
2.2 Eligibility criteria
To be included, the studies had to meet the eligibility criteria that were specified and agreed by both authors. The following criteria for screening titles and abstracts were:
- Written in English
- No systematic review or book section
- No patients, injured, disabled or animals, plans, microbiomes, and in vitro experiments
- Topic on energy contribution during sports and exercise
The criteria for full texts were as follows:
- Full text found
- Original study
- Quantification of aerobic-anaerobic energy contributions
- Evaluation of a method to quantify the former
2.3 Assessment of methodological quality
The methodological quality of the studies to investigate the reliability and validity was implemented using the Consensus-based Standards for the selection of health Measurement Instruments (COSMIN) checklist (29, 30) as recommended by Ma et al. (31). Of the checklist, boxes 6–9a were used for reliability, measurement error, criterion validity, and convergent validity, respectively. Each item was rated as 3 = very good; 2 = adequate; 1 = doubtful; 0 = inadequate; NA = not applicable. The overall quality and risk of bias of each study was subsequently rated based on the worst-score-count method, meaning that the lowest scoring item was decisive for the overall score (30).
2.4 Data extraction
Content of all included studies was summarized using the PICO scheme. Extracted information concerned (if applicable): P = number of participants, age, sex, type of sport, level; I = information about the setting of the study; C = description of used methods to quantify aerobic-anaerobic energy contributions; O = main results.
The mean differences and corresponding effect sizes (ES) according to Cohen's d were extracted directly from the studies, if available. Effect sizes were classified according to Cohen (32): trivial (<0.2), small (0.2 to <0.5), moderate (0.5 to <0.8), and large (≥0.8). For reliability and validity assessments, intraclass correlation coefficients (ICC), Pearson's correlation coefficient (r), and the coefficient of variation (CV) or typical error (TE) were considered. The magnitude of correlations was classified as (32): very small (<0.1), small (0.1 to <0.3), moderate (0.3 to <0.5), and large (≥0.5). ICC was classified accordingly: poor (<0.5), moderate (0.5 to <0.75), good (0.75 to <0.9), and excellent (≥0.9) (33). The CV values were interpreted as excellent (≤10%), good (10 to <20%), acceptable (20 to <30%), and poor (≥30%) (34).
Due to the heterogeneity of the included studies regarding the applied methods and their calculations, a meta-analysis was not possible to perform. Alternatively, a best-evidence synthesis was made to clarify the direction and level of evidence of the different methods. Therefore, the criteria according to Asker et al. (35) were used to set evidence as strong, moderate, limited, or conflicting (Table 1).
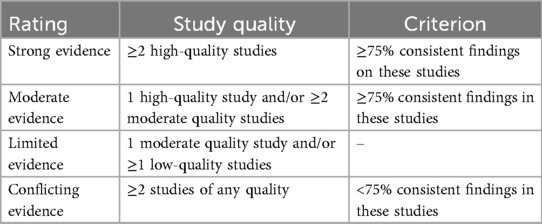
Table 1. Criteria for the best-evidence synthesis according to Asker et al. (35).
3 Results
A total of 2,120 studies were identified. After removing 373 duplicates, 1,747 articles were screened for titles and abstracts, whereby 1,567 did not meet the eligibility criteria. Of the remaining 180 full texts, 47 fulfilled the criteria. After excluding 13 application studies (22, 36–47), 34 studies were finally included. No additional studies were identified through screening the reference lists. The most common reason for the exclusion was an unsuitable study population (n = 891), followed by an unrelated topic to energy contribution during sports and exercise (n = 656), and the missing quantification of aerobic-anaerobic energy contributions (n = 112). Figure 1 shows the detailed selection process.
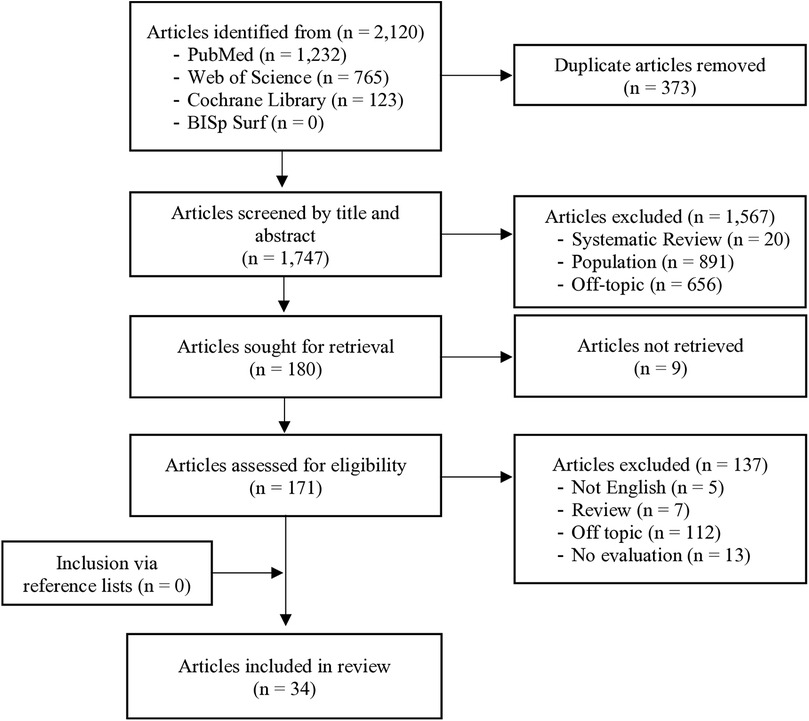
Figure 1. Flowchart of the literature search including the study selection process according to the PRISMA guidelines.
3.1 Study characteristics
Table 2 gives an overview of the study characteristics. Of the 34 studies included, five different methods to quantify aerobic-anaerobic energy contributions during sports and exercises were detected, namely: (i) MAOD, (ii) PCr-La-O2 method, (iii) CP, and (iv) GE. Less investigated was an identified fifth method, the so called (v) bioenergetic model.

Table 2. Study characteristics and results of the included studies using the PICO scheme.
In total, 22 studies investigated the reliability and 29 studies investigated the validity of the different methods. Precisely, for the MAOD, 10, 10, 12, and 16 studies evaluated the relative (21, 48–56) and absolute reliability (20, 48–50, 52, 56–60), as well as the criterion (20, 21, 48, 49, 52, 56–58, 61–64) and convergent validity (20, 21, 48, 49, 52, 53, 56–65), respectively. For the PCr-La-O2, the relative and absolute reliability were investigated by two studies (12, 66) and three articles reported the criterion and convergent validity (24, 67, 68). For the CP, one study assessed the absolute (64) and relative reliability (69), five (64, 70–73) and seven studies (64, 69–74) reported the criterion and convergent validity, respectively. All quality criteria for the GE were investigated by one study (75). For the bioenergetic model, absolute reliability and criterion and convergent validity were reported by two studies (18, 19).
3.2 Quality assessment
Table 3 presents the results of the methodological quality assessment for each method. In total, 22 studies investigated the reliability, of which 4, 14, 1, and 3 were rated as very good, adequate, doubtful, and inadequate quality, respectively. 29 studies assessed the validity with 24, 1, and 4 articles being rated as very good, doubtful, and inadequate quality.
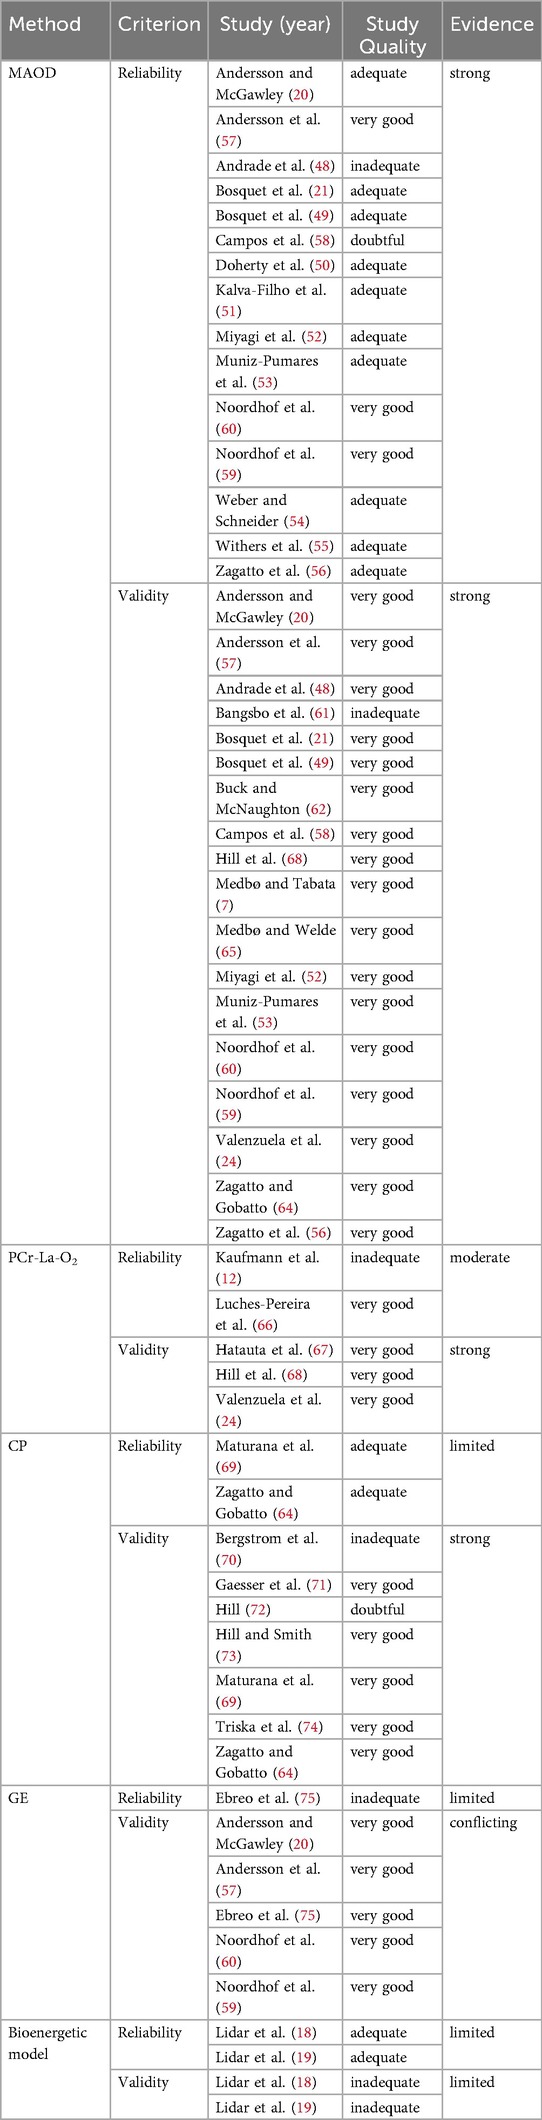
Table 3. Results of the methodological quality assessment and best-evidence synthesis.
For the MAOD, the relative reliability was rated as adequate and inadequate in 9 and 1 studies, respectively. Absolute reliability was very good, adequate, and doubtful for 3, 6, and 1 studies, respectively. Criterion validity was assessed as very good for 12 studies. For the convergent validity, the quality was rated as very good for 15 studies and as inadequate for 1 study. For the PCr-La-O2 method, relative and absolute reliability were rated as very good and inadequate, respectively. The criterion and convergent validity were assessed as very good in all 3 studies. For the CP, the relative and absolute reliability were adequate for both studies. The criterion validity was very good, doubtful, and inadequate for 3, 1, and 1 studies, respectively. The quality of the convergent validity was very good, doubtful, and inadequate for 5, 1, and 1 studies, respectively. For GE, reliability was rated as inadequate for one study and validity was very good for the same study. The two studies investigating the reliability for the bioenergetic model were rated as adequate, while the validity was inadequate for two studies.
3.3 Synthesis of results
3.3.1 MAOD
The MAOD was the most evaluated method to quantify the aerobic-anaerobic contributions. The reliability and validity were addressed by 15 and 16 studies, respectively. Studies that investigated the reliability mainly used graded exercise tests and several submaximal, constant-load tests with different intensities of maximum oxygen uptake (VO2max), or different time trials on a cycle ergometer or treadmill. In two studies, the tests were performed in a swimming pool and during table tennis. Therefore, participants were mainly male runners, cyclists, or recreationally active in sports, but also investigated were swimmers, biathletes and table tennis players. In addition to the conventional MAOD method, an alternative MAOD (MAODALT) and a backward extrapolation technique were also evaluated (48, 52, 56).
For the MAOD, and in terms of reliability, ICCs were poor to excellent and ranged from 0.26 to 0.97 (21, 49–51, 53–55, 57). CV was excellent between 6.8% and 8.6% and limits of agreement (LoA) ranged from 1.9–6.0% or 15.1-96 ml/kg O2 (20, 50, 58). For the MAODALT, ICC was good to excellent (0.77–0.96), CV was excellent (4.1–5.8%), and TE was low (9.13–12.60 ml/kg) (52, 56). The backward extrapolation technique showed a small ICC (0.26), a poor CV (46.2%), and TE of 24.8 ml/kg O2 (48).
In terms of validity, MAOD was evaluated with regard to various calculations, alternative methods and intensities. Zagatto and Gobatto (64) assessed the MAOD and three different CP models during 1 supra- and 4 submaximal tests with various intensities in table tennis. The studies of Bosquet et al. (21, 49) compared different calculations for the MAOD and CP proposed by Medbø (1988), Hill (1998), Morton (1996), Whipp (1986), and Monod and Scherrer (1965). Therefore, they used an incremental test on a treadmill as well as several constant-velocity tests with different intensities in relation to VO2max. Results show that the anaerobic contribution was significantly higher when calculated by Morton compared to Whipp or Hill with a large effect (p < 0.001; ES = 2.52–2.76) and was largely associated with them (r = 0.65–0.75; p < 0.05) (21). Additionally, the other study found that there was no significant difference between MAOD values derived from Medbø and Hill (p > 0.05) and also, that the small correlation was not statistically significant (r = 0.25; p > 0.05) (49). The method by Whipp showed largely lower estimations and a large effect for MAOD than the others (bias ± LoA: −29.6 ± 35.6 and −26.1 ± 23.8 ml/kg; p < 0.001, ES > 1.94). With regard to potential relations between the methods, correlations were small to moderate, but show no significant association between MAOD from Hill with other estimates (r = 0.21–0.33; p > 0.05) and no significant relationship between Whipp and Medbø (r = 0.33; p > 0.05) (49). In table tennis, the comparisons of the MAOD and CP models were neither large nor significant (r = 0.06–0.16; p > 0.05) (64). The anaerobic contribution calculated by three different MAOD calculations and the GE was compared by four studies (20, 57, 59, 60). Therefore, they included or excluded the y-intercept as a baseline metabolic rate and used 4- or 10-minutes submaximal exercise bouts for running or roller-skiing on a treadmill or for cycling on an ergometer. In two studies, Noordhof et al. (59, 60) found no significant differences between the four (10-Y, 4-Y, 4 + Y, GE) methods in cycling (p = 0.13) and skiing (p = 0.10). Furthermore, LoA between the methods were 10-Y vs. GE −3.01 ± 47.2 ml O2/kg, 4-Y vs. GE −10.4 ± 53.7 ml O2/kg, and 4 + Y vs. GE −8.87 ± 43.8 ml O2/kg. In contrast, Andersson et al. (57) found significantly lower estimations of anaerobic contribution by the 5 + YLIN method compared to the three other models (∼26%; p = 0.002). In the fourth study, the oxygen deficit was significantly lower with 4 + Y compared to 4-Y and GE/EC (ES = 0.64; p < 0.05) (20). The mean difference (bias) between the oxygen deficit estimated with the 4 + Y vs. 4-Y method was −6.3 ± 4.9 ml/kg, with the 4 + Y vs. GE/EC method −7.2 ± 1.2 ml/kg, and with the 4-Y vs. GE/EC method −1.0 ± 5.3 ml/kg, respectively. With regard to correlations, the oxygen deficits estimated with the 4 + Y vs. GE/EC method were highly and significantly correlated (r = 0.99; p < 0.05) (20). In another study, anaerobic contribution determined by conventional MAOD method and backward extrapolation technique was compared at different submaximal running intensities (48). No significant differences were found between the conventional MAOD values and backward technique values (p > 0.05). Additionally, a large correlation between conventional MAOD and backward extrapolation for absolute (r = 0.86) and relative (r = 0.85) MAOD was demonstrated (48). The MAOD was compared to an alternative model (MAODALT) in two studies during different cycling and running intensities (52, 56). Both studies could not ascertain significant differences for MAOD and MAODALT, except for intensities at 130% and 150% of VO2max (p ≤ 0.048). Moreover, all MAODALT values were largely significant correlated with MAOD (r = 0.54–0.68; p < 0.05), but Zagatto et al. (56) only found significant correlations at 100% (r = 0.49–0.59; p < 0.05) and 115% (r = 0.65–0.77; p < 0.05) of VO2max. With regard to intensities, MAODALT demonstrated the largest correlation with MAOD (r = 0.68; p < 0.01) and the greatest concordance at 115% VO2max (r = 0.73; p < 0.01) (52, 56). For the conventional MAOD, Muniz-Pumares et al. (53) showed that AOD at 112.5% of VO2max was significantly greater than AOD at 105% (p = 0.033) and AOD at 127.5% (p = 0.022) during cycling. There were no significant differences (p ≥ 0.05) between AOD at 105, 120, and 127.5% VO2max. There were two studies that compared the oxygen deficit with muscle biopsies (61, 63). They concluded that they relate extremely well and that the ATP turnover rate determined from the oxygen deficit or from muscle biopsies are similar (91.2 vs. 91.6 mmol ATP/kg wet weight). Three studies investigated the relationship between the MAOD and PCr-La-O2 method (24, 67, 68). Recreationally active males and females as well as runners performed several constant-power tests with different intensities and at least one incremental test on a cycle ergometer (24, 67) or a treadmill (68). The correlation for PCr-La-O2 and MAOD was very small and not significant (r = −0.06; p > 0.05), but also no significant difference was found between the calculated anaerobic contribution from PCr-La-O2 and MAOD method (44.6 ± 3.0% vs. 45.2 ± 5.1%; p = 0.79) (67). In contrast, the other two studies demonstrated largely significant correlations with a small to moderate effect between MAOD and PCr-La-O2 for every test duration and across test durations (r = 0.80–0.99; ES = 0.32–0.52; p ≤ 0.01) (24, 68). However, there was no interaction effect, but MAOD could be predicted from PCr-La-O2 (p ≤ 0.01) (24, 68).
3.3.2 PCr-La-O2
The PCr-La-O2 method was evaluated by two studies investigating the reliability and three studies addressing the validity. Recreationally active males and females as well as male state-level handball players participated in the reliability studies. The testing protocols involved either a knee-extensor exercise test at 100% and 110% of peak power or an intermittent running test. For the intermittent running test, both the PCr-La-O₂ model and the intermittent PCr-La-O₂ model were analyzed. In general, reliability was stronger for the 100% test than for the 110% test. ICC was moderate (0.71; p = 0.004) and poor (0.44; p = 0.085), CVs were excellent to poor (3.3–60.4%) and LoA were between 753.5 to −591.7 ml O₂ and 1,002.4 to −1,188.0 ml O₂ for the test at 100% and at 110%, respectively. Additionally, the standard error of measurement (SEM) ranged from 240.1 ml O₂ to 389.6 ml O₂ (66). For the conventional and intermittent PCr-La-O₂ model, the highest variability was found for the alactic contribution of the conventional (CV = 14.85%) and intermittent (CV = 9.98%) model. The overall anaerobic contribution showed low variability and excellent CVs for the conventional (CV = 7.49%) and intermittent model (CV = 8.95%). LoA varied across energy contributions, with the widest range observed for the anaerobic contribution of the intermittent model (−1,448 to 664 J/kg). The alactic contributions also showed notable variability, with LoA ranges of −368 to 439 J/kg and −1,707 to 988 J/kg, respectively (12).
The criterion and convergent validity were investigated in three studies, with AOD and MAOD being the comparators (24, 67, 68). A detailed discussion of the results was provided in the previous section.
3.3.3 CP
Concerning the CP, two and seven studies examined the reliability and validity of the method, respectively. One study assessed the absolute reliability during table tennis and compared the anaerobic contribution derived from three different critical power models (linear-f, linear-TB, nonlinear-2) (64). The second study used an incremental ramp test and five constant-power tests on a cycle ergometer to assess the relative reliability of CP. Therefore, CP and W' were estimated by five different mathematical models (CPexponential, CP3-hyperbolic, CP2-hyperbolic, CPlinear, and CP1/time) and five different numbers of time to exhaustion trials, resulting in 34 different combinations (69). Agreement for all W' values was good to excellent in both studies (ICC = 0.90, CCC = 0.78–0.99). Root mean square error (RMSE) ranged from 2.44 to 22.90 W and was lowest for CPlinear (2,3,4,5) and highest for CP1/time (1,2). The model that predicted data most accurately was the CP3-hyp(1,2,3,4,5), (R2 = 0.99, RMSE = 26.5 W).
In total, seven studies investigated the validity of CP. Mainly recreationally trained males, females and cyclists were included, but also table tennis players took part. The participant cohorts primarily included recreationally trained males, females, and cyclists, with table tennis players also included in one study. All tests were conducted on a cycle ergometer using both incremental and constant-intensity protocols, except for the study of Zagatto and Gobatto (64), which utilized supra- and submaximal table tennis-specific tests. Gaesser et al. (71) compared the anaerobic contribution estimated by five different CP models [3-parameter nonlinear, 2-parameter nonlinear, linear (P x t), linear (P), exponential] during cycling. Significant differences (p > 0.05) were observed between the models, with the three-parameter nonlinear model yielding the highest anaerobic contribution (58 ± 19 kJ) and the linear (P) model the lowest (18 ± 5 kJ). Additionally, the goodness of fit was significantly lower for the linear (P) model (R2 = 0.96 ± 0.03; p = 0.005) compared to all other models. Large correlations were found between anaerobic contribution estimates from the two linear models (r = 0.97; p < 0.001) and the two-parameter nonlinear model (r = 0.96–0.99; p < 0.001), whereas strong to small correlations were observed for the three-parameter nonlinear model (r = 0.25–0.64; p > 0.05-p < 0.01). With regard to other models, there was a significantly large correlation between the linear power-time relationship and the MAOD (r = 0.77; p < 0.01) (73). However, none of the W’ values were highly or significantly correlated with MAOD, anaerobic alactic (WPCr), anaerobic alactic energy contribution (WLa) or anaerobic energy contribution (WANAER) (r = 0.06–0.60; p > 0.05) during table tennis (64). Five studies investigated the convergent validity of CP. Therefore, different mathematical calculations (linear, nonlinear, hyperbolic, exponential) were compared. Bergstrom et al. (70) demonstrated highly significant differences between linear-TW, linear-P, nonlinear-2, nonlinear-3, and CP3min model (p < 0.001). Additionally, nonlinear-3 and nonlinear-2 models produced significantly higher estimates of anaerobic contributions than the linear-TW, linear-P and CP models (p < 0.05). The same result was shown by Gaesser et al. (71). Anaerobic contribution estimates differed significantly between the five models, of which the 3-parameter model provided the highest and the linear (P) model the lowest anaerobic contribution (58 ± 19 kJ vs. 18 ± 5 kJ; p < 0.008). Similarly, Hill (72) demonstrated that CP was highest when derived from the 3-parameter exponential model (209 ± 51 W), with significant differences observed among the three models (2-parameter model, 3-parameter hyperbolic model, 3-parameter exponential model) (p = 0.003). Precisely, anaerobic contribution was significantly higher when derived from the 3-parameter compared to the 2-parameter hyperbolic model (25.3 ± 13.2 vs. 20.4 ± 9.0 kJ; p = 0.048). However, in table tennis, W' was significantly higher when calculated from nonlinear-2 model compared to other models (linear-f, linear-TB, nonlinear-2) (p < 0.05) (64). In contrast to these findings, Triska et al. (74) demonstrated no significant differences for CP (p = 0.088–1.000) and W' (p = 0.054–0.615) between hyperbolic, linear work-time, and linear power-1/time models during cycling within laboratory or field conditions. Regarding the influence of model selection and exercise durations, one study observed that W′ was overestimated when derived from CPlinear- and CP1/time-model, particularly in trials lasting less than 10 minutes. Conversely, trials of approximately 20 minutes provided the most accurate estimation of W' (69).
3.3.4 GE
One study investigated the absolute and relative reliability as well as the criterion and convergent validity (75). Males and females with a minimum of six hours training per week performed one incremental cycling test and a cycling test with intensities of 50% and 80% or 100% of maximal aerobic power twice. The aim was to compare the anaerobic contribution between the conventional GE method and the backward extrapolation GE method (BGE). Mean CVs were excellent (7.8% and 9.8%) for BGE. For the anaerobic contribution, CVs were also excellent (3.5% vs. 2.9% and 6.8% vs. 5.0% for GE vs. BGE). LoA for GE vs. BGE were 3.6% vs. ±3.74% and ±4.2% vs. ±4.1% (75).
With regard to validity, GE and BGE demonstrated highly significant and large correlations after the first (r = 0.98; p = 0.01) and second trial (r = 0.80; p = 0.01), indicating high agreement between methods. Further, the GE was compared to different MAOD models (10-Y, 4-Y, 4 + Y, 5 + YLIN) in four studies (20, 57, 59, 60). They used 4-, 5- or 10-minutes submaximal exercise bouts for cycling on an ergometer as well as for running or roller-skiing on a treadmill. In two studies, there were no significant differences between the MAOD and GE methods in cycling (p = 0.13) and skiing (p = 0.10; w2 = 0.08) (59, 60). Additionally, LoA between MAOD and GE were between −10.4 and 53.7 ml O2/kg. Contrary, anaerobic contribution was significantly lower when estimated by a MAOD model (5 + YLIN) compared to GE (p = 0.002) (57). Similar results were demonstrated by Andersson and McGawley (20), where the oxygen deficit was significantly lower with 4 + Y compared to 4-Y and GE/EC (ES = 0.64; p < 0.05). The mean difference between the oxygen deficit estimated with the 4 + Y vs. GE/EC method was −7.2 ± 1.2 ml/kg and with the 4-Y vs. GE/EC method −1.0 ± 5.3 ml/kg. Moreover, the oxygen deficits estimated with the 4 + Y vs. GE/EC method were highly correlated (r = 0.99; p < 0.05) (20).
3.3.5 Bioenergetic model
Two studies invented and evaluated the bioenergetic model (18, 19). In the first study, 11 male cross-country skiers at national and international level performed 4 submaximal exercise tests and 2 self-paced roller-skiing sprint time trials (STT) on a treadmill. The aim was to compare four bioenergetic models (2TM-fixed, 2TM-free, 3TM-fixed and 3TM-free) estimating the aerobic and anaerobic contribution during sprint roller-skiing (18). For the second study, 14 well-trained cyclists performed one submaximal incremental cycling test, one maximal incremental cycling test, and two intermittent protocols with various power outputs to compare the measured and modelled metabolic energy supply (19).
The model-to-measurement mean difference (0.5) and TE of the anaerobic contribution were lower but not significant for the 2TM-free compared to the other models (TE = 0.6; p = 0.103). Additionally, the RMSE of anaerobic contribution were the lowest for the 2TM-free and the highest for the 3TM-fixed model (11.7% vs. 17.2%; 50.0–77.6 W vs. 104.1–106.1 W) (18). With regard to measured data, the RMSE for the aerobic contribution was 61.9 ± 7.9 W with LoA ranging from −124.8 W to 119.2 W (19).
Concerning the validity, over- and underprediction were highest by the 3TM-free model and by the 3TM-fixed model, respectively. The relative contribution from the alactic and lactic system to the total anaerobic contribution was 38.6% and 61.4% for the 3TM-free and 38.7% and 61.3% for the 3TM-fixed model, respectively (18). Furthermore, the modelled aerobic contribution shows a small underprediction compared to the measured aerobic contribution (8.6 ± 1.5%). In addition, there were significant differences (p ≤ 0.001–0.036) between modelled and measured data at several different stages during the intermittent protocol (19).
3.4 Best-evidence synthesis
Table 3 shows the result of the best-evidence synthesis, structured according to the different methods. For the MAOD, evidence of reliability was rated as strong based on 15 studies with very good (n = 3), adequate (n = 10), doubtful (n = 1), and inadequate (n = 1) study quality. Of the 16 studies assessing the validity, 15 studies were rated as very good and one study as inadequate, leading to overall strong evidence. Concerning the PCr-La-O2, there was moderate evidence for the reliability due to one study of very good quality and one of inadequate. Evidence for validity was strong based on three high-quality studies. In terms of the CP, two studies of adequate quality led to limited evidence for reliability. In contrast, evidence of validity was strong due to 5, 1, and 1 studies of very good, doubtful, and inadequate quality, respectively. Concerning the GE, one study of inadequate and very good quality led to limited and moderate evidence of reliability and validity, respectively. The evidence for the bioenergetic model was limited based on two studies of adequate quality for reliability and inadequate quality for validity.
4 Discussion
The aim of this systematic review was to assess the reliability and validity of different methods used to quantify the aerobic-anaerobic energy contributions during sports and exercise, and thereby clarify the level of evidence for each method. The main findings regarding reliability and validity were: (i) evidence was strong for MAOD, (ii) evidence was limited to strong for CP and PCr-La-O2, and (iii) evidence was limited to conflicting for GE and the bioenergetic model.
To our knowledge, this is the first systematic review to implement a best-evidence synthesis for this topic, aiming to establish an overview of the methodological quality and empirical support for each method. As expected, MAOD was clearly the most extensively investigated method. In general, MAOD emerged as the most evaluated method and the only one with strong evidence for both reliability and validity. In contrast, the reliability of CP, PCr-La-O₂, and GE has been minimally investigated, each with only two studies, resulting in at most moderate evidence. Reliability was generally less investigated than validity and was evaluated using stricter criteria, particularly concerning participant's stability, protocol consistency, and statistical analyses. However, reliability is essential for understanding measurement error and ensuring accurate interpretation of performance changes. Therefore, further research is warranted to clarify the reliability of the different methods used to quantify aerobic-anaerobic energy contributions during sports and exercise.
The first main finding of this study was that evidence was strong for MAOD in terms of reliability and validity. Among all evaluated methods, MAOD demonstrated the strongest evidence for reliability, supported by 15 studies of adequate to very good quality as well as consistent findings (Table 3). Except for the backward extrapolation technique, high ICCs along with low CVs and LoA indicate the method's robustness in repeated measurements. Thus, MAOD is a reliable method for quantifying the oxygen deficit and anaerobic contribution. The evidence for the validity of MAOD is equally supported. A notable strength of MAOD lies in its consistent methodological evaluation across multiple studies, the majority of which were rated as having very good study quality (Table 3). However, the results of the studies investigating the validity demonstrate that there are a few methodological aspects to consider when applying the MAOD. For instance, MAOD is highly sensitive to protocol configurations due to its dependence on accurate estimations of both aerobic demand and actual oxygen uptake. Several investigations have demonstrated that variables such as intensity, duration, and slope calculations used to construct the VO₂-exercise intensity relationship directly affect the reliability of the estimated oxygen demand (53, 62, 65). The standard protocol typically involves ten submaximal 10-minute bouts to generate a robust VO₂-power output regression, presenting a high physiological and logistical burden. Even small deviations in these parameters can alter the linearity assumption or affect steady-state conditions, thereby distorting the aerobic-anaerobic energy balance calculated by MAOD (60, 62). Another important aspect is the specificity of the exercise modality. While MAOD has been primarily assessed in controlled settings like treadmill or cycle ergometry, its extension to sport-specific or variable-intensity environments is limited. The only study to apply MAOD in a sport-specific context was conducted in tethered swimming (58). The requirement for constant intensity and steady-state conditions makes it difficult to apply in sports characterized by intermittent or technical movements. Since the MAOD is a two-component model only, it does not differentiate between anaerobic lactic and alactic energy contributions. Consequently, this may limit its interpretative value for performance diagnostics and resulting training recommendations. Nevertheless, MAOD offers the most reliable and valid framework for estimating anaerobic energy contributions among currently available methods.
The second main finding was that evidence was limited to strong for the CP and PCr-La-O2 concerning the reliability and validity (Table 3). Current evidence for the reliability of CP remains limited. Although two studies in cycling and table tennis reported good to excellent ICCs or CCCs, the small number and only adequate quality investigations limit the strength of this evidence. Notably, test protocols involving efforts under 10 minutes were associated with lower CCCs and a tendency to over- or underestimate CP, emphasizing the model's sensitivity to test duration. Since the CP model assumes a linear relationship between work and time above CP, this assumption only holds true within a specific time domain, typically between 2 and 15 minutes. Trials that are too short (<2 minutes) tend to overestimate anaerobic capacity and inflate W′, while longer trials (>20 minutes) may underestimate CP due to factors like fatigue, motivation, or pacing (69). Inconsistent or poorly distributed trial durations can lead to inaccurate curve fitting, distorting both CP and W′ estimates. In contrast, evidence supporting CP's validity is strong, based on five high-quality studies (Table 3). Findings consistently showed that hyperbolic or exponential models yield higher anaerobic estimates than linear ones, with three-parameter models outperforming two-parameter models in both accuracy and robustness (69–72). Unlike MAOD, CP requires fewer submaximal trials and therefore, reducing the methodological and participant's burden. However, the relationship between CP and MAOD is inconsistent. Hill and Smith (73) found significant correlations, Zagatto and Gobatto (64) did not, potentially due to differences in exercise modalities (cycling vs. table tennis). This shows that although CP has been widely validated in cycling, it shows reduced generalizability to sport-specific exercise. Similar to MAOD, CP is also a two-component model only that is not able to distinguish between anaerobic alactic and lactic energy contributions. However, the PCr-La-O2 is a three-component model and is currently the only method that is able to separate the anaerobic energy contribution into lactic and alactic share. This distinction is especially valuable because it enables direct quantification of anaerobic alactic (via EPOCfast) and lactic (via lactate accumulation) components. Since the alactic energy contribution is calculated from the fast component of the EPOC, it could only be assessed right after the end of an exercise. However, an intermittent PCr-La-O2 method was developed, which considers the aerobic phosphocreatine restoration during short breaks (76). Despite this strength, the current evidence for the reliability is moderate, based on two studies of contrasting quality. Both studies reported small CVs and moderate to excellent ICCs, supporting the method's overall reliability (12, 66). However, the anaerobic alactic and lactic components were found to be less reliable than the aerobic component, particularly in intermittent exercise protocols (12). This may be attributed to the method's dependence on VO₂ off-kinetics, which introduces variability when estimating the fast component of EPOC and therefore, affects the quantification of the alactic contribution. However, in terms of validity, evidence is strong. All three validation studies were of high quality and reported generally consistent findings (Table 3). Importantly, the PCr-La-O2 method is independent of submaximal pretests or threshold-based models and appeared less sensitive to exercise duration than MAOD, suggesting its robustness across short-duration efforts. Moreover, the method demonstrated consistent performance across both cycling and running protocols, and no sex differences were identified, supporting its broader applicability, but smaller evidence compared to MAOD. The methodological advantages and validation in multiple sports make it a promising tool for quantifying the anaerobic energy contribution validly in both laboratory and field-based settings, requiring more research and development.
The last main finding was that evidence was limited to conflicting for GE and the bioenergetic model. The reliability of GE has been evaluated in a single study (75), which was rated as inadequate, therefore resulting in overall limited evidence (Table 3). Nevertheless, the study reported excellent CVs and narrow LoA for the backward extrapolation technique during cycling, suggesting that this specific variant of GE may offer promising reliability. In terms of validity, the evidence for GE remains conflicting (Table 3). The inconsistencies regarding the comparison with MAOD likely stem from differences in protocols and calculations. GE typically uses only one submaximal exercise bout, thus offering a more practical and time-efficient solution. However, this simplicity may compromise accuracy, possibly leading to an overestimation of anaerobic energy contributions. Supporting this, the BGE method yielded higher anaerobic estimates than conventional GE, but its strong correlations and favorable reliability metrics suggest it could be a viable alternative. The bioenergetic model has similarly limited empirical support, with reliability and validity assessed in only two studies (18, 19), rated as adequate and inadequate, respectively (Table 3). It is based on a three-component energy system framework and includes a highly detailed parameterization of metabolic pathways. While this complexity allows for detailed modelling and the distinction between anaerobic alactic and lactic share, it may also favor measurement error. In particular, TE and RMSE were lowest for the two-component model compared to three-component models (Lidar et al., 2021). Importantly, while the model shows excellent agreement with measured aerobic metabolism, its estimations of anaerobic contribution remain inadequately validated. Both GE and the bioenergetic model demonstrate limited and inconsistent evidence, with some promising features, but overall lack sufficient validation for accurately assessing the anaerobic energy contribution.
5 Conclusion
To quantify aerobic-anaerobic energy contributions during sports and exercise, the MAOD has emerged as the most evaluated method and the only one with strong evidence for both reliability and validity. However, as the PCr-La-O2 method is the only approach that can distinguish between anaerobic alactic and lactic contributions using direct physiological measures, it should be further evaluated.
Data availability statement
The original contributions presented in the study are included in the article/Supplementary Material, further inquiries can be directed to the corresponding author.
Author contributions
CA: Writing – original draft, Formal analysis, Visualization, Methodology, Data curation, Writing – review & editing, Conceptualization, Investigation. MH: Supervision, Writing – review & editing, Conceptualization.
Funding
The author(s) declare that financial support was received for the research and/or publication of this article. Open Access funding provided by the Open Access Publishing Fund of Philipps-Universität Marburg.
Acknowledgments
The authors would like to thank Anika Krebs for her help regarding the literature search and quality assessment.
Conflict of interest
The authors declare that the research was conducted in the absence of any commercial or financial relationships that could be construed as a potential conflict of interest.
Generative AI statement
The author(s) declare that no Generative AI was used in the creation of this manuscript.
Any alternative text (alt text) provided alongside figures in this article has been generated by Frontiers with the support of artificial intelligence and reasonable efforts have been made to ensure accuracy, including review by the authors wherever possible. If you identify any issues, please contact us.
Publisher's note
All claims expressed in this article are solely those of the authors and do not necessarily represent those of their affiliated organizations, or those of the publisher, the editors and the reviewers. Any product that may be evaluated in this article, or claim that may be made by its manufacturer, is not guaranteed or endorsed by the publisher.
Supplementary material
The Supplementary Material for this article can be found online at: https://www.frontiersin.org/articles/10.3389/fspor.2025.1650741/full#supplementary-material
References
1. Kenney WL, Wilmore JH, Costill DL. Physiology of Sport and Exercise 6ed. Champaign, IL: Human Kinetics (2015). p. 648.
2. Almquist NW, Sandbakk Ø, Rønnestad BR, Noordhof D. The aerobic and anaerobic contribution during repeated 30-s sprints in elite cyclists. Front Physiol. (2021) 12:692622. doi: 10.3389/fphys.2021.692622
3. Bangsbo J, Mohr M, Krustrup P. Physical and metabolic demands of training and match-play in the elite football player. J Sports Sci. (2006) 24(7):665–74. doi: 10.1080/02640410500482529
4. Li Y, Niessen M, Chen X, Hartmann U. Overestimate of relative aerobic contribution with maximal accumulated oxygen deficit: a review. J Sports Med Phys Fitness. (2015) 55(5):377–82.25303069
5. Spriet LL. Exercise Metabolism. Cham: Springer International Publishing (2022). Anaerobic metabolism during exercise. p. 51–70.
6. Medbø JI, Mohn AC, Tabata I, Bahr R, Vaage O, Sejersted OM. Anaerobic capacity determined by maximal accumulated O2 deficit. J Appl Physiol (1985). (1988) 64(1):50–60. doi: 10.1152/jappl.1988.64.1.50
7. Medbø JI, Tabata I. Relative importance of aerobic and anaerobic energy release during short-lasting exhausting bicycle exercise. J Appl Physiol (1985). (1989) 67(5):1881–6. doi: 10.1152/jappl.1989.67.5.1881
8. di Prampero PE. Reviews of Physiology, Biochemistry and Pharmacology. Berlin, Heidelberg: Springer Berlin Heidelberg (1981). Energetics of muscular exercise. p. 143–222.
9. Artioli GG, Bertuzzi RC, Roschel H, Mendes SH, Lancha AH Jr, Franchini E. Determining the contribution of the energy systems during exercise. J Vis Exp. (2012) (61):1–5. doi: 10.3791/3413
10. Knuttgen HG. Oxygen debt after submaximal physical exercise. J Appl Physiol. (1970) 29(5):651–7. doi: 10.1152/jappl.1970.29.5.651
11. Haseler LJ, Hogan MC, Richardson RS. Skeletal muscle phosphocreatine recovery in exercise-trained humans is dependent on O2 availability. J Appl Physiol. (1999) 86(6):2013–18. doi: 10.1152/jappl.1999.86.6.2013
12. Kaufmann S, Latzel R, Beneke R, Hoos O. Reliability of the 3-component model of aerobic, anaerobic lactic, and anaerobic alactic energy distribution (PCr-LA-O2) for energetic profiling of continuous and intermittent exercise. Int J Sports Physiol Perform. (2022) 17(11):1642–48. doi: 10.1123/ijspp.2022-0115
13. Monod H, Scherrer J. The work capacity of a synergic muscular group. Ergonomics. (1965) 8(3):329–38. doi: 10.1080/00140136508930810
14. Jones AM, Vanhatalo A, Burnley M, Morton RH, Poole DC. Critical power: implications for determination of VO2max and exercise tolerance. Med Sci Sports Exerc. (2010) 42(10):1876–90. doi: 10.1249/MSS.0b013e3181d9cf7f
15. Chidnok W, Dimenna FJ, Bailey SJ, Vanhatalo A, Morton RH, Wilkerson DP, et al. Exercise tolerance in intermittent cycling: application of the critical power concept. Med Sci Sports Exerc. (2012) 44(5):966–76. doi: 10.1249/MSS.0b013e31823ea28a
16. Noordhof DA, Skiba PF, de Koning JJ. Determining anaerobic capacity in sporting activities. Int J Sports Physiol Perform. (2013) 8(5):475–82. doi: 10.1123/ijspp.8.5.475
17. Gaesser GA, Brooks GA. Muscular efficiency during steady-rate exercise: effects of speed and work rate. J Appl Physiol. (1975) 38(6):1132–9. doi: 10.1152/jappl.1975.38.6.1132
18. Lidar J, Andersson EP, Sundström D. Validity and reliability of hydraulic-analogy bioenergetic models in sprint roller skiing. Front Physiol. (2021) 12:726414. doi: 10.3389/fphys.2021.726414
19. Lidar J, Ainegren M, Sundström D. Development and validation of dynamic bioenergetic model for intermittent ergometer cycling. Eur J Appl Physiol. (2023) 123(12):2755–70. doi: 10.1007/s00421-023-05256-7
20. Andersson EP, McGawley K. A comparison between different methods of estimating anaerobic energy production. Front Physiol. (2018) 9:82. doi: 10.3389/fphys.2018.00082
21. Bosquet L, Delhors PR, Duchene A, Dupont G, Leger L. Anaerobic running capacity determined from a 3-parameter systems model: relationship with other anaerobic indices and with running performance in the 800 m-run. Int J Sports Med. (2007) 28(6):495–500. doi: 10.1055/s-2006-924516
22. Karsten B, Hopker J, Jobson SA, Baker J, Petrigna L, Klose A, et al. Comparison of inter-trial recovery times for the determination of critical power and w’ in cycling. J Sports Sci. (2017) 35(14):1420–25. doi: 10.1080/02640414.2016.1215500
23. Noordhof DA, de Koning JJ, Foster C. The maximal accumulated oxygen deficit method: a valid and reliable measure of anaerobic capacity? Sports Med. (2010) 40(4):285–302. doi: 10.2165/11530390-000000000-00000
24. Valenzuela JR, Riojas AE, McFARLIN BK, Vingren JL, Hill DW. Determining MAOD using a single exhaustive severe intensity test. Int J Exerc Sci. (2020) 13(4):702–13. doi: 10.70252/FBDS3074
25. Bangsbo J. Quantification of anaerobic energy production during intense exercise. Med Sci Sports Exerc. (1998) 30(1):47–52. doi: 10.1097/00005768-199801000-00007
26. Dotan R. A critical review of critical power. Eur J Appl Physiol. (2022) 122(7):1559–88. doi: 10.1007/s00421-022-04922-6
27. Hill DW. The critical power concept. A review. Sports Med. (1993) 16(4):237–54. doi: 10.2165/00007256-199316040-00003
28. Liberati A, Altman DG, Tetzlaff J, Mulrow C, Gotzsche PC, Ioannidis JP, et al. The PRISMA statement for reporting systematic reviews and meta-analyses of studies that evaluate health care interventions: explanation and elaboration. PLoS Med. (2009) 6(7):e1000100. doi: 10.1371/journal.pmed.1000100
29. Mokkink LB, Boers M, van der Vleuten CPM, Bouter LM, Alonso J, Patrick DL, et al. COSMIN Risk of bias tool to assess the quality of studies on reliability or measurement error of outcome measurement instruments: a delphi study. BMC Med Res Methodol. (2020) 20(1):293. doi: 10.1186/s12874-020-01179-5
30. Mokkink LB, de Vet HCW, Prinsen CAC, Patrick DL, Alonso J, Bouter LM, et al. COSMIN Risk of bias checklist for systematic reviews of patient-reported outcome measures. Qual Life Res. (2018) 27(5):1171–79. doi: 10.1007/s11136-017-1765-4
31. Ma LL, Wang YY, Yang ZH, Huang D, Weng H, Zeng XT. Methodological quality (risk of bias) assessment tools for primary and secondary medical studies: what are they and which is better? Mil Med Res. (2020) 7(1):7. doi: 10.1186/s40779-020-00238-8
32. Cohen J. Statistical Power Analysis for the Behavioral Sciences. 2 ed. Hillsdale, NJ: Lawrence Erlbaum Associates (1988). p. 567.
33. Koo TK, Li MY. A guideline of selecting and reporting intraclass correlation coefficients for reliability research. J Chiropr Med. (2016) 15(2):155–63. doi: 10.1016/j.jcm.2016.02.012
34. Aronhime S, Calcagno C, Jajamovich GH, Dyvorne HA, Robson P, Dieterich D, et al. DCE-MRI of the liver: effect of linear and nonlinear conversions on hepatic perfusion quantification and reproducibility. J Magn Reson Imaging. (2014) 40(1):90–8. doi: 10.1002/jmri.24341
35. Asker M, Brooke HL, Walden M, Tranaeus U, Johansson F, Skillgate E, et al. Risk factors for, and prevention of, shoulder injuries in overhead sports: a systematic review with best-evidence synthesis. Br J Sports Med. (2018) 52(20):1312–19. doi: 10.1136/bjsports-2017-098254
36. Buck D, McNaughton L. Maximal accumulated oxygen deficit must be calculated using 10-min time periods. Med Sci Sports Exerc. (1999) 31(9):1346–9. doi: 10.1097/00005768-199909000-00018
37. de Koning JJ, Noordhof DA, Lucia A, Foster C. Factors affecting gross efficiency in cycling. Int J Sports Med. (2012) 33(11):880–85. doi: 10.1055/s-0032-1306285
38. Dekerle J, Brickley G, Hammond AJ, Pringle JS, Carter H. Validity of the two-parameter model in estimating the anaerobic work capacity. Eur J Appl Physiol. (2006) 96(3):257–64. doi: 10.1007/s00421-005-0074-8
39. Gardner A, Osborne M, D'Auria S, Jenkins D. A comparison of two methods for the calculation of accumulated oxygen deficit. J Sports Sci. (2003) 21(3):155–62. doi: 10.1080/0264041031000070877
40. Gastin PB, Costill DL, Lawson DL, Krzeminski K, McConell GK. Accumulated oxygen deficit during supramaximal all-out and constant intensity exercise. Med Sci Sports Exerc. (1995) 27(2):255–63. doi: 10.1249/00005768-199502000-00016
41. Gastin PB, Lawson DL. Influence of training status on maximal accumulated oxygen deficit during all-out cycle exercise. Eur J Appl Physiol Occup Physiol. (1994) 69(4):321–30. doi: 10.1007/bf00392038
42. Hill DW, Vingren JL. Maximal accumulated oxygen deficit in running and cycling. Appl Physiol Nutr Metab. (2011) 36(6):831–8. doi: 10.1139/h11-108
43. Hill DW, Vingren JL. The effect of pedalling cadence on maximal accumulated oxygen deficit. Eur J Appl Physiol. (2012) 112(7):2637–43. doi: 10.1007/s00421-011-2240-5
44. Özyener F, Rossiter HB, Ward SA, Whipp BJ. Negative accumulated oxygen deficit during heavy and very heavy intensity cycle ergometry in humans. Eur J Appl Physiol. (2003) 90(1-2):185–90. doi: 10.1007/s00421-003-0870-y
45. Pouilly JP, Busso T. Accumulated oxygen deficit during ramp exercise. Int J Sports Med. (2008) 29(1):16–20. doi: 10.1055/s-2007-965068
46. Redkva PE, Miyagi WE, Milioni F, Zagatto AM. Anaerobic capacity estimated by the sum of both oxygen equivalents from the glycolytic and phosphagen pathways is dependent on exercise mode: running versus cycling. PLoS One. (2018) 13(9):1–11. doi: 10.1371/journal.pone.0203796
47. Scott CB, Roby FB, Lohman TG, Bunt JC. The maximally accumulated oxygen deficit as an indicator of anaerobic capacity. Med Sci Sports Exerc. (1991) 23(5):618–24. doi: 10.1249/00005768-199105000-00015
48. Andrade VL, Kalva-Filho CA, Ribeiro NX, Gobbi RB, de Arruda TB, Papoti M. Determination of maximum accumulated oxygen deficit using backward extrapolation. Int J Sports Med. (2021) 42(2):161–68. doi: 10.1055/a-1082-1372
49. Bosquet L, Duchene A, Delhors PR, Dupont G, Carter H. A comparison of methods to determine maximal accumulated oxygen deficit in running. J Sports Sci. (2008) 26(6):663–70. doi: 10.1080/02640410701744420
50. Doherty M, Smith PM, Schroder K. Reproducibility of the maximum accumulated oxygen deficit and run time to exhaustion during short-distance running. J Sports Sci. (2000) 18(5):331–38. doi: 10.1080/026404100402395
51. Kalva-Filho CA, Araújo MY, Silva A, Gobatto CA, Zagatto AM, Gobbi RB, et al. Determination of VO2-intensity relationship and MAOD in tethered swimming. Int J Sports Med. (2016) 37(9):687–93. doi: 10.1055/s-0035-1559696
52. Miyagi WE, de Poli RDB, Papoti M, Bertuzzi R, Zagatto AM. Anaerobic capacity estimated in a single supramaximal test in cycling: validity and reliability analysis. Sci Rep. (2017):7. doi: 10.1038/srep42485
53. Muniz-Pumares D, Pedlar C, Godfrey RJ, Glaister M. Accumulated oxygen deficit during exercise to exhaustion determined at different supramaximal work rates. Int J Sports Physiol Perform. (2017) 12(3):351–56. doi: 10.1123/ijspp.2015-0343
54. Weber CL, Schneider DA. Reliability of MAOD measured at 110% and 120% of peak oxygen uptake for cycling. Med Sci Sports Exerc. (2001) 33(6):1056–59. doi: 10.1097/00005768-200106000-00028
55. Withers RT, Vanderploeg G, Finn JP. Oxygen deficits incurred during 45-s, 60-s, 75-s and 90-s maximal cycling on an air-braked ergometer. Eur J Appl Physiol Occup Physiol. (1993) 67(2):185–91. doi: 10.1007/bf00376665
56. Zagatto AM, Bertuzzi R, Miyagi WE, Padulo J, Papoti M. MAOD Determined in a single supramaximal test: a study on the reliability and effects of supramaximal intensities. Int J Sports Med. (2016) 37(9):700–7. doi: 10.1055/s-0042-104413
57. Andersson EP, Björklund G, McGawley K. Anaerobic capacity in running: the effect of computational method. Front Physiol. (2021) 12:708172. doi: 10.3389/fphys.2021.708172
58. Campos EZ, Kalva CA, Silva MS, Arruda TB, Gobbi RB, Manchado-Gobatto FB, et al. Anaerobic contribution determined in free-swimming: sensitivity to maturation stages and validity. Front Sports Act Living. (2022) 4:4. doi: 10.3389/fspor.2022.760296
59. Noordhof DA, Danielsson ML, Skovereng K, Danielsen J, Seeberg TM, Haugnes P, et al. The dynamics of the anaerobic energy contribution during a simulated mass-start competition while roller-ski skating on a treadmill. Front Sports Act Living. (2021) 3:695052. doi: 10.3389/fspor.2021.695052
60. Noordhof DA, Vink AM, de Koning JJ, Foster C. Anaerobic capacity: effect of computational method. Int J Sports Med. (2011) 32(6):422–8. doi: 10.1055/s-0031-1271676
61. Bangsbo J, Gollnick PD, Graham TE, Juel C, Kiens B, Mizuno M, et al. Anaerobic energy production and O2 deficit-debt relationship during exhaustive exercise in humans. J Physiol. (1990) 422:539–59. doi: 10.1113/jphysiol.1990.sp018000
62. Buck D, McNaughton LR. Changing the number of submaximal exercise bouts effects calculation of MAOD. Int J Sports Med. (1999) 20(1):28–33. doi: 10.1055/s-2007-971087
63. Medbø JI, Tabata I. Anaerobic energy release in working muscle during 30 s to 3 min of exhausting bicycling. J Appl Physiol (1985). (1993) 75(4):1654–60. doi: 10.1152/jappl.1993.75.4.1654
64. Zagatto AM, Gobatto CA. Relationship between anaerobic parameters provided from MAOD and critical power model in specific table tennis test. Int J Sports Med. (2012) 33(8):613–20. doi: 10.1055/s-0032-1304648
65. Medbø JI, Welde B. Effect of computational method on cccumulated O2 deficit. Front Sports Act Living. (2022) 4:772049. doi: 10.3389/fspor.2022.772049
66. Luches-Pereira G, Kalva-Filho CA, Bertucci DR, de Carvalho CD, Barbieri RA, Papoti M. Reliability of anaerobic contributions during a single exhaustive knee-extensor exercise. Int J Sports Med. (2024) 45(5):359–68. doi: 10.1055/a-2207-2578
67. Hatauta S, Oki S, Nabekura Y. Validation of the AC[La]+EPOCfast method in sprinters and middle-distance runners. Int J Sports Med. (2024) 45(3):231–37. doi: 10.1055/a-2191-8508
68. Hill DW, Riojas AE, McFarlin BK, Vingren JL. An alternative to oxygen deficit as a way to quantify anaerobic contributions in running. J Hum Sport Exerc. (2020) 15(4):837–48. doi: 10.14198/jhse.2020.154.11
69. Maturana FM, Fontana FY, Pogliaghi S, Passfield L, Murias JM. Critical power: how different protocols and models affect its determination. J Sci Med. (2018) 21(7):742–47. doi: 10.1016/j.jsams.2017.11.015
70. Bergstrom HC, Housh TJ, Zuniga JM, Traylor DA, Lewis RW, Camic CL, et al. Differences among estimates of critical power and anaerobic work capacity derived from five mathematical models and the three-minute all-out test. J Strength Cond Res. (2014) 28(3):592–600. doi: 10.1519/JSC.0b013e31829b576d
71. Gaesser GA, Carnevale TJ, Garfinkel A, Walter DO, Womack CJ. Estimation of critical power with nonlinear and linear models. Med Sci Sports Exerc. (1995) 27(10):1430–38. doi: 10.1249/00005768-199510000-00012
72. Hill DW. The relationship between power and time to fatigue in cycle ergometer exercise. Int J Sports Med. (2004) 25(5):357–61. doi: 10.1055/s-2004-815838
73. Hill DW, Smith JC. A comparison of methods of estimating anaerobic work capacity. Ergonomics. (1993) 36(12):1495–500. doi: 10.1080/00140139308968017
74. Triska C, Tschan H, Tazreiter G, Nimmerichter A. Critical power in laboratory and field conditions using single-visit maximal effort trials. Int J Sports Med. (2015) 36(13):1063–68. doi: 10.1055/s-0035-1549958
75. Ebreo R, Passfield L, Hopker J. The reliability of measuring gross efficiency during high-intensity cycling exercise. Int J Sports Physiol Perform. (2020) 15(1):126–32. doi: 10.1123/ijspp.2018-0949
Keywords: capacity, creatine phosphate, lactate, performance, post-exercise oxygen consumption
Citation: Ambaum C and Hoppe MW (2025) Evaluation of methods to quantify aerobic-anaerobic energy contributions during sports and exercise — a systematic review and best-evidence synthesis. Front. Sports Act. Living 7:1650741. doi: 10.3389/fspor.2025.1650741
Received: 20 June 2025; Accepted: 2 September 2025;
Published: 25 September 2025.
Edited by:
Alejandro Santos-Lozano, Miguel de Cervantes European University, SpainReviewed by:
Tomasz Tytus Gabrys, University of West Bohemia, CzechiaRomana Romanov, Faculty of Sport and Tourism (Serbia), Serbia
Copyright: © 2025 Ambaum and Hoppe. This is an open-access article distributed under the terms of the Creative Commons Attribution License (CC BY). The use, distribution or reproduction in other forums is permitted, provided the original author(s) and the copyright owner(s) are credited and that the original publication in this journal is cited, in accordance with accepted academic practice. No use, distribution or reproduction is permitted which does not comply with these terms.
*Correspondence: Christin Ambaum, Y2hyaXN0aW4uYW1iYXVtQHVuaS1tYXJidXJnLmRl