 Edu Caro
 Manuel Lapuente-Sagarra3,†
 Toni Caparrós
- 1National Institute of Physical Education of Catalonia, University of Barcelona, Barcelona, Spain
- 2Federación Costarricense de Fútbol (FCRF), San José, Costa Rica
- 3FC Barcelona, Barcelona, Spain
- 4Sport Research Institute, Autonomous University of Barcelona (UAB), Bellaterra, Spain
- 5University Pablo de Olavide, Sevilla, Spain
Objective: This study aimed to examine the occurrence of submaximal intensity periods (SubMIPs) across several game-based drills according to area per player (ApP) and drill objective, and to compare them with values recorded in competitive matches.
Methods: Fourteen professional football players participated. Data from 1,558 game-based drills events and 247 competitive match records were analyzed using GPS technology. SubMIP events defined as efforts exceeding 85% of each player's 1 min maximal intensity period (MIP) per variable, were calculated for distance, acceleration density (AccDens), high-speed running (HSR), sprints, high metabolic load distance (HMLD), and mean metabolic power (MetPow). Game-based drills were categorized by ApP (<75 m2, 75–150 m2, >150 m2) and objective (possession, four small goals, regular goals).
Results: SubMIP AccDens events were more frequent in game-based drills than in matches, especially in possession drills with smaller ApP. Distance and MetPow events increased with ApP, but none of the game-based drills fully replicated match-level frequencies. HSR, HMLD, and sprint events occurred significantly more often in matches than in any drill.
Conclusions: ApP and drill objective strongly influence physical demands. Although game-based drills do not replicate all match demands, they can be tailored to target specific SubMIP variables. The SubMIP approach provides valuable insights into near-maximal efforts and supports the design of training sessions that optimise player conditioning through repeated high-intensity exposures.
Introduction
Game-based drills (hereafter “drills”) are widely used in football training since they combine the development of intermittent physical capacities with technical and tactical work and improve player motivation (1–3). In this manuscript, “drills” always denotes game-based drills and does not include isolated exercises (technical, physical, or of any other nature). Studies of these drills can address various aspects, from external and internal loads to the technical and tactical analyses of variables such as the number of completed passes and players’ spatial distribution (4–9).
Analyses of drills tend to focus on two key factors: area per player and drill objective (3, 4, 6, 7, 10, 11). According to previous studies, a larger ApP increases players’ lactate concentration, heart rate, rating of perceived exertion (RPE), total distance covered, frequency of sprints, high-intensity accelerations, high-intensity decelerations, and maximum speed (5, 6, 10, 12–14). By contrast, a smaller ApP increases the frequency of moderate accelerations and decelerations (2–3 m·s−2) (12, 13).
A change in ApP can also influence the frequency of technical actions such as interceptions, ball controls, dribbles and shots (8–10). The width and length of the drills seem to affect players’ tactical approaches: wider pitches encourage greater use of the wings and more team play, whereas narrower pitches encourage runs in behind the defenders and a more direct style of play (2). In terms of physical demands, wider pitches result in more accelerations and decelerations, whereas narrower pitches require more direct runs and longer distances at high speed (15–17).
Drill objectives also affect players’ physical, technical and tactical responses. Drills with scoring targets at each end of the pitch encourage players to run further at high speed; drills without such targets encourage players to move at a slow or moderate pace (3, 7). An increase in some physical variables has also been noted when smaller goals are used (7). Drills with no scoring target or with a scoring zone led to a higher RPE and higher mean and maximum heart rates (3). The scoring target of a drill can influence a team's tactics. Small goals placed along the end line, midway between the middle of the end line and each corner, increase the number of sideways passes and make the block less compact, whereas if there is only one scoring zone at each end of the pitch, players will be more direct in their play (8).
Studies comparing the physical demands of drills and competitive matches (18–21) show that drills allow players to reach values that are similar to or higher than mean levels in matches for variables such as distance covered and changes of pace (accelerations and decelerations), but not for distance covered at high speed (19, 21).
Most previous studies have compared mean demand in drills and competitive matches. Some studies have focused instead on maximal intensity periods (MIPs)—the periods, during matches or training drills, in which players exert the greatest physical effort. It has been observed that intensity levels are higher when the time windows are shorter (22–24). Comparisons between MIPs in drills and in competitive matches show that, when drills use small spaces, acceleration and deceleration values can be at least as high as during matches, but the values for distance covered, high-speed running (HSR) and sprints are lower (10, 12, 21, 25), except in 10v10 drills with two goalkeepers, in which MIP sprint values exceeded those recorded in matches (25). This shows that, although drills are effective for certain MIP metrics, they are inadequate for others, regardless of the time window used (12, 21, 26). A study on drills without goalkeepers found that the ApP required to replicate the demands of competitive matches over a period of 4 min was 77 m2 for accelerations and decelerations, 90 m2 for total distance, 187 m2 for HSR, and 366 m2 for sprints. ApP values in drills with goalkeepers were higher (27).
Recent analyses of MIP's using 1–10 min rolling windows show that true peaks occur in <1% of windows, whereas ≈95% of HSR/sprint and ≈85% of acceleration/deceleration/total-distance windows fall below the peak and vary by position. Thus, while MIPs capture maxima, they under-represent typical exposure for training prescription (28). Consequently, the use of MIPs as the main indicator for designing training drills for team sports has been questioned (18), since, although MIPs identify peak demands, they tend to underestimate the training intensity required to produce specific physiological adaptations, because of their focus on a single maximal intensity event (18, 29) and they ignore other passages of play in which intensity levels, though not at their peak, are still high (30, 31). Alternative indicators have been proposed to address this limitation. Submaximal intensity periods (SubMIPs), for example, allow near-peak demand to be analysed and are therefore better adapted to the intermittent nature of physical output in team sports (31–35). Consequently, threshold-based approaches that quantify exposures exceeding >85% of each player's 1 min peak reveal clear positional and temporal differences. This frequency-based perspective captures repeated near-peak exposures that drive adaptation and justifies using SubMIPs (>85% of the 1 min MIP) as a complement to MIPs (34).
The purpose of this study is: (i) to analyse players’ behaviour in drills using SubMIPs, with results broken down according to the ApP and drill objective; and (ii) to compare the results with those obtained in competitive matches.
Methods
Subjects
Fourteen male professional association football players from an Azerbaijan Premier League team took part in this study (weight: 73.74 ± 5.92 kg; height: 1.79 ± 0.05 metres; age: 23.86 ± 3.58 years). Informed consent was obtained in accordance with the Declaration of Helsinki (36) and approval was granted by the Ethics Committee of the Sports Council of Catalonia (number 035/CEICGC/2021).
Materials
GPS devices were used at all the training sessions and matches analysed in the study (STATSports Apex ProSeries; STATSports, Newry, Northern Ireland). All players used the same device at all times to ensure inter-device reliability (37). The devices had a maximum GPS sampling rate of 18 Hz and included a 600 Hz accelerometer, 10 Hz magnetometer and 400 Hz gyroscope. They weighed 45 g and measured 33 × 80 × 15 mm. Players wore a specially designed vest that held the device in place in the upper back area. The vests and devices had been tested and no significant differences were found between them and other devices that had already produced valid, reliable data for such variables as distance covered and peak speed over distances of 400 m, 128.5 m and 20 m (38). The devices and data were processed by the same duly trained and experienced person.
Data acquisition and processing
The devices were switched on 15 min before each data-collection session and the app STATSports Apex Live was used to check that they were connected. The data were then segmented according to whether they were collected during drills or competitive matches, then raw data were exported using STATSports software (v3.0.03112) and processed in R (RStudio, Boston, MA, USA). Filtering was applied to the horizontal speed trace to minimise high-frequency noise before numerical differentiation, as recommended to minimise noise without phase distortion and to improve agreement with criterion systems in team-sport GNSS data (39).
Speed signals were low-pass filtered with a 4th-order zero-phase Butterworth (forward–backward, filtfilt; fc = 0.75 Hz at 10 Hz sampling; W = 0.15), and instantaneous acceleration (first derivative of filtered speed) was further low-pass filtered with a 1st-order Butterworth (fc = 3.25 Hz; W = 0.65). Zero-phase filtering removes phase distortion; the effective magnitude response equals the square of the single-pass Butterworth (39).
We analysed the following variables: HSR (>19.8 km·h−1), sprints (>25.2 km·h−1), acceleration density (AccDens), mean metabolic power (MetPow), distance covered (measured in metres per minute), and high metabolic load distance (HMLD, >25.5 W·kg−1) (24, 25, 31). An individual reference value (100%) was defined as the mean of the three highest 1 min competition MIPs for each variable (per player) (31, 33, 35). SubMIPs were detected on 60 s rolling windows with a 0.1 s step (10 Hz), Above-threshold windows were merged only when they overlapped (the next window started before the previous one ended). Non-overlapping windows were counted as separate events. Data processing was performed in R (RStudio, Boston, MA, USA), applying a threshold of 85% of each player's individual reference for every variable to get the SubMIP threshold (31, 33). For each training drill, we extracted the number and duration of SubMIP events and stored all outputs in a database for subsequent statistical analyses. To ensure that drills and competitive-match values were comparable, the data were normalised by active duration and reported as event counts (events·min−1) and exposure time per drill and per match. Files not meeting GNSS quality criteria (≥8 satellites or no excessive dropouts) were excluded (24, 25, 31).
Competitive matches and drills: characteristics and inclusion criteria
Data were recorded in 15 matches played during the 2019/20 season, in which the team adopted a 5-3-2 formation: five defenders, three midfielders (two defensive, one attacking) and two forwards. Players were included only if they played for at least 45 min per half in at least three halves (31, 33, 40). Based on these criteria, 337 sets of data were obtained on individual player performance, of which 247 were useful for the analysis.
For the drills, a digital odometer was used to measure the length and width of the playing area to calculate the ApP . Only data for regular players, and not internal and external floaters, were used in the analysis, and only if the drills were conducted during a competition microcycle, rather than during pre-season training or weeks without a competitive match. In total, 1,612 individual records were obtained from the drills, of which 1,558 were included in the analysis. All training sessions were conducted under the same coaching staff, following a consistent methodology throughout the study period.
Drills were classified according to their ApP (< 75 m2, 75–150 m2 or >150 m2) and the type of objective (possession, four small goals per team along each end line (four small goals), or regular goals (5, 7, 11, 41) (Figure 1).
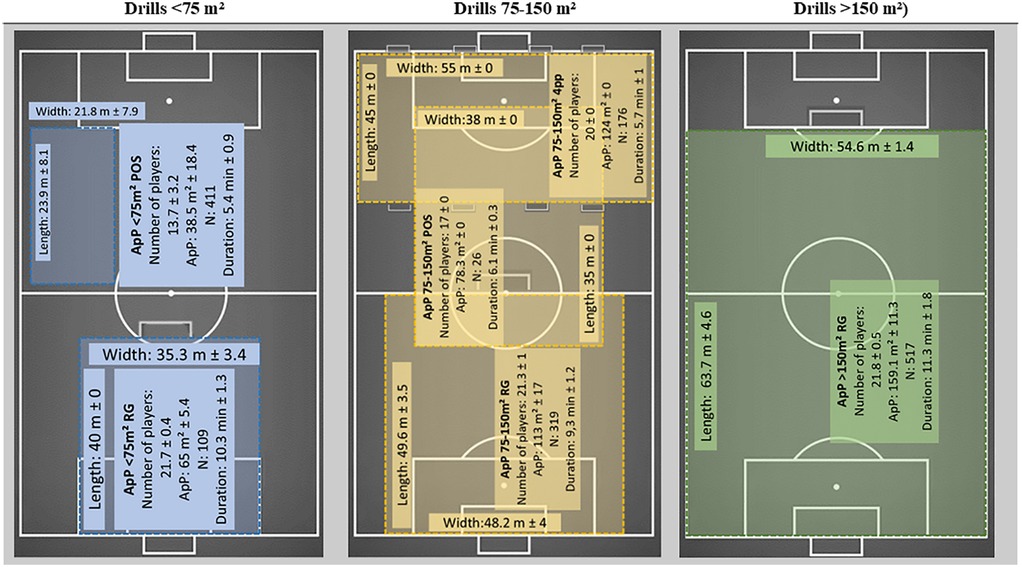
Figure 1. Six game-based drill formats grouped by area per player (ApP) category: <75 m2, 75–150 m2, >150 m2. Panels show mean ± SD for pitch length/width, number of players, ApP, bouts (N), and work-interval duration; dimensions were measured on-field with a digital odometer and ApP = (length × width) ÷ players. Objectives: POS, possession; RG, regular goals; 4SG, four small goals (two per team on each end line).
Six different drill formats were used:
• Possession drills with an ApP below 75 m2
• Possession drills with an ApP of 75–150 m2
• Regular goal drills with an ApP below 75 m2
• Regular goal drills with an ApP of 75–150 m2
• Regular goal drills with an ApP greater than 150 m2
• Four small goal drills with ApP 75–150 m2
Statistical analysis
Analyses were conducted in R (RStudio). For each indicator we reported descriptive statistics of central tendency and dispersion by ApP (m2) and drill objective. Outcome distributions were inspected Q–Q plots, and Shapiro–Wilk tests were reported descriptively.
To test differences, we fitted generalised linear models (GLMs; Gaussian family, identity link; stats::glm) for each outcome (events·min−1). We created a single factor condition = ApP × objective (e.g., “<75 m2 × possession”, “75–150 m2 × four small goals”). The reference level was the competitive match play. Thus, each model coefficient (β) represents the mean difference vs. competition on the original outcome scale (events·min−1 or min·min−1). For interpretability we also reported an effect size ES_d = β/σ (σ = residual SD from the model), with 95% CIs obtained by dividing the β CIs by σ. Pairwise comparisons among all conditions were obtained from estimated marginal means using Tukey's adjustment (emmeans; two-sided α = 0.05; 95% CIs). Model fit indices (AIC, BIC, log-likelihood, deviance, residual degrees of freedom, and residual SD) were recorded (42). Alongside p-values, we report standardized effect sizes for model coefficients and pairwise contrasts, computed as d = estimate/σ (σ = residual SD), with 95% CIs obtained by dividing the corresponding CIs by σ.
Results
Descriptive results
Distance events did not occur in regular goal drills with ApP < 75 m2 and were rare in possession drills with the same ApP. They occurred in all drills with ApP 75–150 m2 (highest in four small goals drills), occurred infrequently in regular-goal drills with ApP > 150 m2, and occurred more often in competitive matches than in any drill format (Table 1).

Table 1. Values are SubMIP events·min−1 (mean ± SD). N, number of individual player records per condition. Distance, events >85% of the 1 min MIP for total distance (m·min−1). AccDens, acceleration density (60 s rolling mean of |a|). HSR, high-speed running (>19.8 km·h−1). Sprint, sprint running (>25.2 km·h−1). HMLD, distance at metabolic power >25.5 W·kg−1. MetPow, mean metabolic power. ApP, area per player.
AccDens events occurred in all drill formats. In drills with an ApP of less than 75 m2 or 75–150 m2, they occurred most frequently in possession drills. In all six drill formats, AccDens events occurred more frequently than in competitive matches (Table 1).
HSR, HMLD and sprint events were practically non-existent in the drills (Table 1).
The drill type in which MetPow events occurred most frequently was in ApP 75–150 m2 with four small goals, followed by ApP > 150 m2 with regular goals drills, but in both cases they occurred less frequently than in competitive matches.
Generalized linear models
Generalized linear models revealed significant differences between conditions (ApP category × drill objective) across all performance metrics (Table 2).
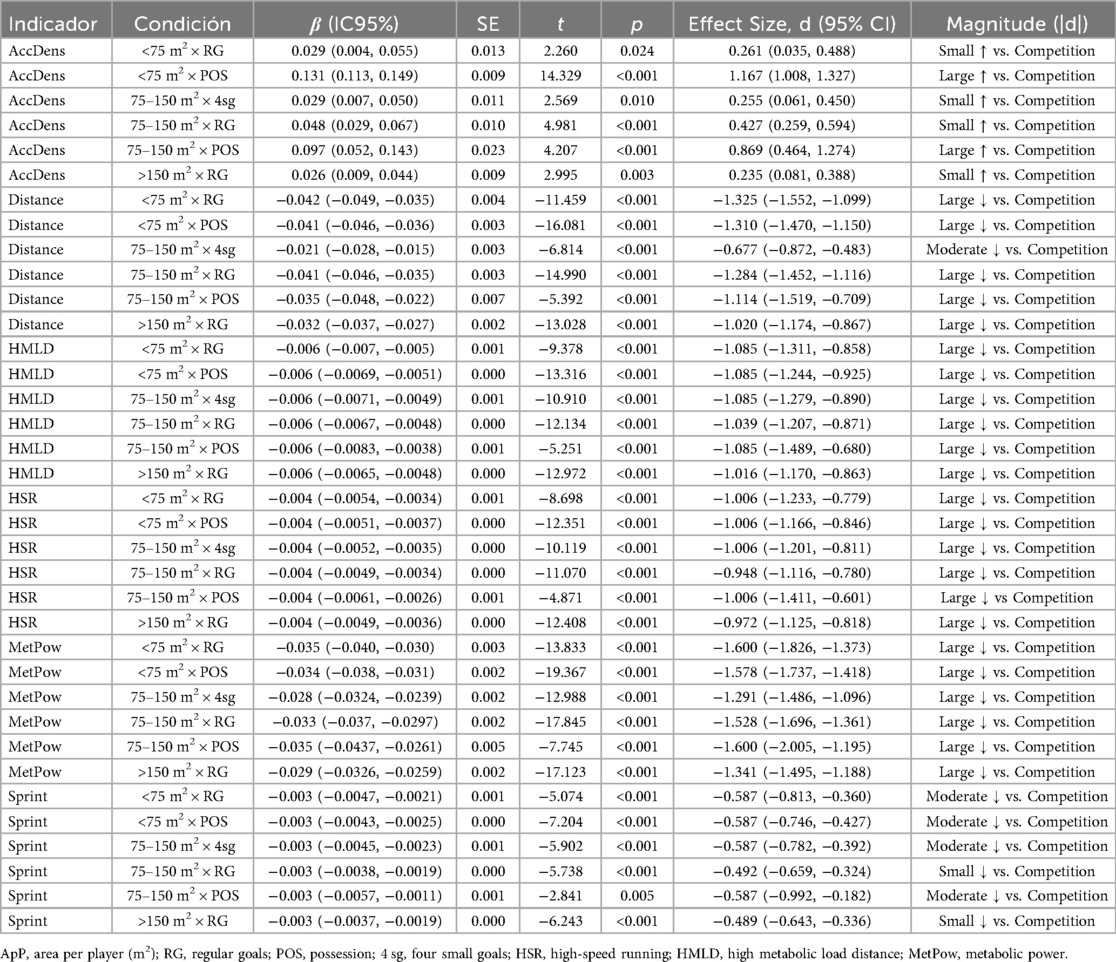
Table 2. Generalized linear models, indicator (units: events·min−1). Independent variable was the condition = ApP (m2) × drill objective, with Competition as the reference. Each β represents the mean difference vs. that reference (on the indicator's scale). ES_d = β/σ from the model (approximate 95% CIs obtained by dividing the β CIs by σ). Only terms with p < 0.05 are shown (two-sided, no multiplicity adjustment). Effect size reported as Cohen's d (σ = residual SD). Magnitude is classified by |d| thresholds: trivial <0.20; small 0.20–0.49; moderate 0.50–0.79; large ≥0.80; the sign of β (and d) indicates direction relative to Competition.
Distance events were more frequent in drills with larger ApP and in competitive matches, and less frequent in possession drills. AccDens events were higher in possession drills and lower in match play. HMLD, HSR and sprint events occurred more frequently during competitive matches than in any drills format.
MetPow events were higher in large-area drills (75–150 m2 four small goals; >150 m2 regular goals) but remained lower than in competitive matches. Model fit was adequate across outcomes (AIC −14,422 to −2,754; BIC −14,378 to −2,710; log-likelihood 1,385–7,219; deviance 0.034–22.487; residual SD σ 0.004–0.112), with AccDens exhibiting the largest residual dispersion (σ ≈ 0.112; deviance ≈ 22.49).
See Table 2 for full GLM outputs.
Effect sizes (d with 95% CIs) are reported alongside p-values; magnitudes were generally small–to–moderate between drill formats and larger for competition- vs. -drill contrasts (positive for AccDens, negative for distance, HMLD, HSR, sprint, and MetPow).
Post hoc comparisons using estimated marginal means revealed significant differences between ApP categories and drill objectives (Figure 2).
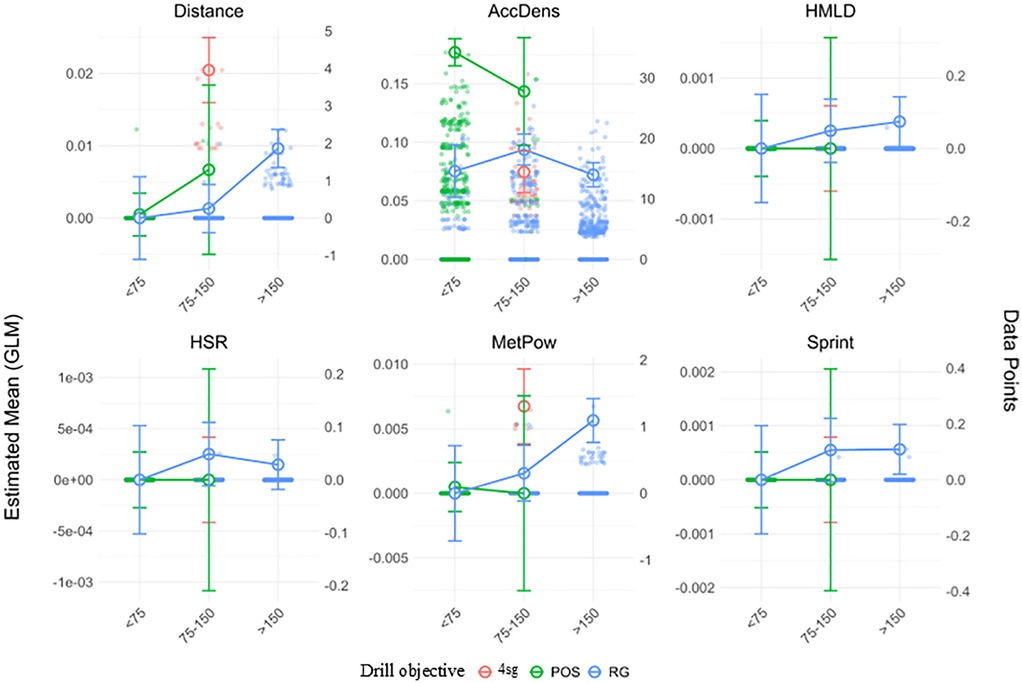
Figure 2. Estimated marginal means (±95% CI) of SubMIP event rates (events·min−1) for game-based drills by area per player (ApP: <75, 75–150, >150 m2) and drill objective. Lines/markers 4 sg (red), four small goals; POS (green), possession; RG (blue), regular goals. Semi-transparent dots show raw drill observations (jittered). Variables: Distance (m·min−1 AccDens, acceleration density; HSR, high-speed running (>19.8 km·h−1, Sprint (>25.2 km·h−1); HMLD, high metabolic-load distance (>25.5 W·kg−1); MetPow, mean metabolic power. Estimates are from GLMs (Gaussian, identity) with condition = ApP × objective; contrasts and CIs obtained via estimated marginal means (emmeans). Competitive match (Comp MD) is not displayed in this figure.
For distance events, ApP 75–150 m2 with four small goals drills showed higher values than ApP < 75 m2 possession, ApP < 75 m2, ApP 75–150 m2 and ApP > 150 m2 with regular goals drills (Δ ≈ 0.019–0.020, p < 0.001), and lower values than competitive matches (Δ ≈ 0.021, p < 0.001). This suggests that four small goals drills with moderate ApP require greater physical exertion than other drill formats, though still below match demands.
AccDens events were significantly more frequent in ApP < 75 m2 possession drills compared to all with regular goals and four small goals formats (Δ ≈ 0.08–0.10, p < 0.001), and also more frequent than in competitive matches (Δ ≈ 0.131, p < 0.001). Conversely, ApP >150 m2 with regular goals drills had lower AccDens than ApP 75–150 m2 possession (Δ ≈ 0.07, p = 0.027), highlighting the influence of both ApP and objective type.
For HSR, HMLD and sprint events, all values were significantly higher in competitive matches than in any drills format (Δ ≈ 0.0028–0.0060, p < 0.001), reinforcing the idea that matches induce more intense locomotor demands than training drills.
Finally, MetPow events occurred more frequently in matches (Δ ≈ 0.029–0.035, p < 0.001) and were also significantly higher in ApP 75–150 m2 with four small goals and >150 m2 with regular goals drills than in ApP < 75 m2 possession (Δ ≈ 0.005–0.006, p < 0.05), suggesting that larger spaces and goal-oriented tasks contribute to greater metabolic loads (Figure 3).
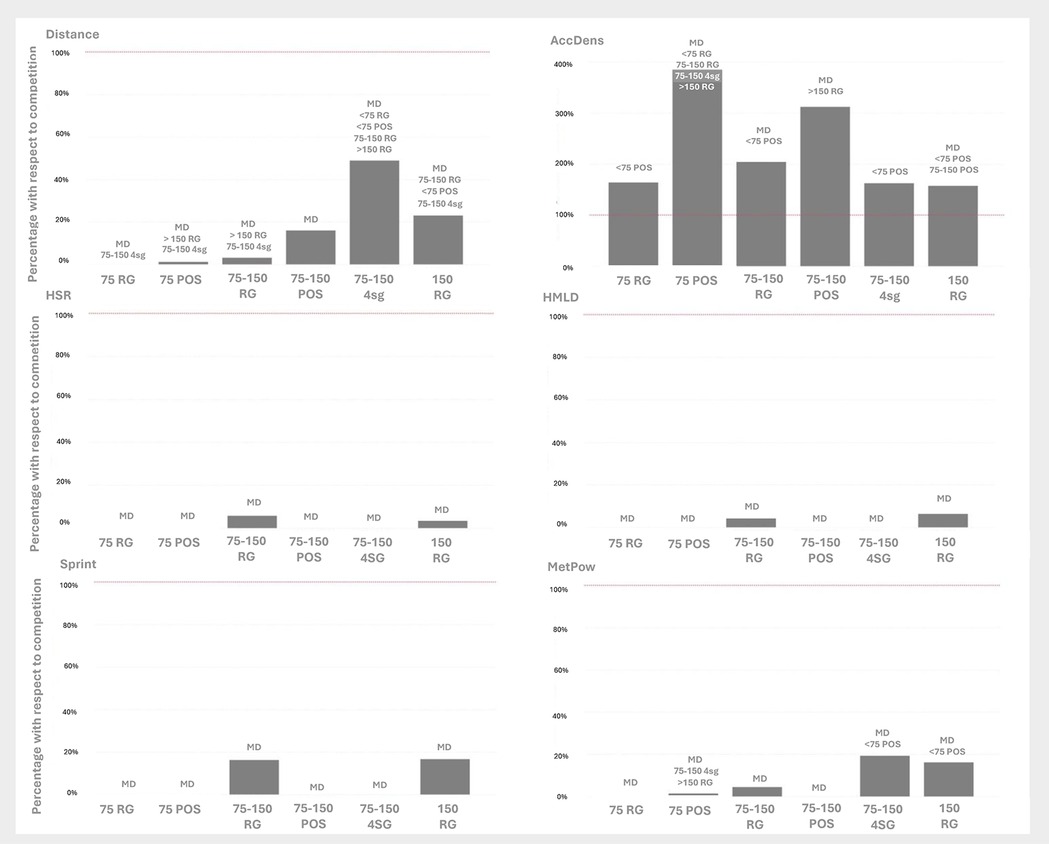
Figure 3. Percentage of SubMIP events (events·min−1) in each drill format, expressed relative to competitive match values (MD = 100%). ApP bands: <75 m2 (75), 75–150 m2 (75–150), >150 m2 (150). Drill objectives: POS, possession; 4 sg, four small goals; RG, regular goals (with goalkeepers). Variables: Distance (m·min−1), AccDens, acceleration density; HSR, high-speed running (>19.8 km·h−1); Sprint (>25.2 km·h−1); HMLD, high metabolic-load distance (>25.5 W·kg−1); MetPow, mean metabolic power. Bar-top annotations: MD, significantly different from competitive matches (p < .05); the additional labels under “MD” list other drill conditions that differ significantly from the current bar (Tukey-adjusted post-hoc from GLM with Gaussian identity via emmeans).
Discussion
The objectives of this research were to identify differences in the occurrence of SubMIP events in drills by ApP level and drill objective, and to compare the results with the occurrence of such events in competitive matches. Differences in the frequency of SubMIP events suggest that the ApP and the drill objective significantly influence the physical demands on players. These differences are consistent with comparisons between drills and competitive matches, which reveal that some drill formats fail to replicate the demands of competitive matches for some variables, but generate higher values for others, such as AccDens. The results suggest that drills should be refined to better simulate the demands of competitive matches to ensure that players are properly stimulated across all key performance metrics.
The SubMIP approach takes the analysis beyond peak exertion levels. By also covering repeated and accumulated near-peak exertion periods, this approach offers a more accurate picture of sustained performance in the various drill formats. To the best of the authors’ knowledge, no previous study has included in-depth analysis of SubMIP events in several drill formats.
In formats with an ApP below 75 m2, HSR, HMLD, sprint and MetPow events were noticeably absent, probably because a small playing area prevents players from reaching high speeds as frequently. In the same formats, SubMIP distance events occurred less frequently than in drills with a higher ApP and in competitive matches, which is consistent with previous studies that analysed mean demand (5, 6, 10, 13, 20) or MIP (21, 25). This finding provides further evidence of the benefits of analysing SubMIP events, since it shows that some near-maximal exertion periods are limited by the space available to players, thus highlighting specific conditions that affect player performance in these variables.
AccDens events, by contrast, occurred most frequently in formats with an ApP below 75 m2, especially in possession drills, with frequencies exceeding those observed in competitive matches and all other drill formats except ApP 75–150 m2 possession. The higher number of AccDens events in possession drills is consistent with the results of previous studies that compared drills with and without goalkeepers (27, 43).
The higher frequency of SubMIP AccDens events in drills with a smaller ApP could be because the smaller team sizes in such formats encourage players to increase their movement (more off-the-ball movements for the team in possession and more defensive duels) and because players accelerate from a stationary position. In competitive matches, by contrast, such actions are more intense but less frequent. In other words, a smaller ApP increases the frequency of such actions, whereas a larger ApP increases their intensity (13).
Formats with an ApP of 75–150 m2 had a greater impact on distance events than formats with a smaller ApP (Figure 3). Although drills with a larger playing area allow greater movement, the space is still too restricted to replicate the demands of competitive matches, as indicated in previous studies (10, 20, 21, 25). In the ApP 75–150 m2 with four small goals format in particular, AccDens values were significantly higher than in all other drill formats except in possession with ApP 75–150 m2 drills, probably because players had to move constantly to cover their goals and to create space with lateral passes, which encouraged greater width and forced players to cover greater distances (7, 8). These results highlight the advantage of using SubMIP analysis to measure the accumulation of efforts that involve significant sustained exertion despite not representing maximum match-level intensity.
AccDens events were more frequent in ApP 75–150 m2 with regular goals and possession drills than in competitive matches, which suggests that drills with an ApP of 75–150 m2 frequently force players to change pace. This finding—which held true irrespective of whether the comparison was with competition averages or various MIP time windows—supports the idea that almost any drills format can stimulate players to equal or surpass the changes of pace they make in matches (20, 23, 25).
The results of this study confirm that, for possession drills to stimulate SubMIP AccDens events more than competitive matches, the ApP can be smaller than the level suggested previously based on an analysis of the mean levels of the variables (27). It is important to bear in mind, however, that the two studies were not identical, though they did address similar aspects, including how the ApP affects the changes of pace required of players.
For higher-intensity events, such as HSR, HMLD and sprints, an ApP of 75–150 m2 did not replicate the demands of SubMIP periods in competitive matches, which indicates that during matches, players engage in high-speed actions more frequently than during drills (21, 27, 44). The ApP required to replicate those demands is estimated at 166 m2 for HSR and 295 m2 for sprints when using conventional metrics. These estimates increase to 187 m2 for HSR and 366 m2 for sprints in the MIP analysis (27, 44) regular goals drills were the only ones in which SubMIP events were recorded for these variables and, though the results were not statistically significant, they add weight to the hypothesis that the type of objective modifies players’ tactical behaviour and the physical demands placed on them (13, 27).
For the MetPow variable, although an ApP of 75–150 m2 generated some SubMIP events, they were significantly less frequent than in competitive matches, which suggests that metabolic demands are higher during matches and cannot be fully replicated with an ApP of 75–150 m2. The estimated minimum ApP required to replicate match-level per-minute stimuli is 177 m2 (27). The only significant difference was found in the ApP 75–150 m2 four small goals format drills, in which the values were higher than in ApP < 75 m2 possession drills, probably due to players’ unique tactical behaviour in this format, as discussed previously.
Analysis of the results in the drills with an ApP that was greater than 150 m2 shows that distance events occurred less frequently than in competitive matches and App 75–150 m2 four small goals drills, but more frequently than in regular goals drills with the same ApP (which use the same type of scoring target). This suggests that, when players have more space, they have more freedom to move around and therefore to engage in more SubMIP events, albeit without replicating the values attained during matches (5, 6). This result differs from the results observed in studies based on per-minute averages (44) or in MIP analysis (25), in which match-level values were reached. One possible explanation is that the ApP of these >150 m2 with regular goals drills was often below the 187 m2 threshold that, according to Ribioli et al. (2020), is necessary for match-level values to be attained. Furthermore, given that the threshold needs to be exceeded for 1 min to generate SubMIP events, the duration of a drill is an important variable, since the analysis is not limited to isolated exertion periods, unlike in previous studies.
The frequency of SubMIP AccDens events in ApP > 150 m2 with regular goals drills was significantly lower than in ApP 75–150 m2 and < 75 m2 possession drills, probably because larger spaces reduce the need for changes of pace and because players’ tactical behaviour changes when the drill objective is different. The effect of the ApP on SubMIP AccDens events is consistent with the inverse relationship between the ApP and moderate accelerations identified in previous studies (12, 13, 21). The values attained in this format exceeded the mean SubMIP AccDens values recorded in competitive matches, which is also consistent with previous analysis of MIP values for changes of pace (12, 23).
High-intensity events such as HSR, HMLD, sprints and MetPow occurred in ApP > 150 m2 with regular goals drills less frequently than in competitive matches, but slightly more frequently than in other drills. The additional space allowed players to reach higher speeds (13, 21), but not enough to replicate the SubMIP values of competitive matches. This was consistent with the findings of previous MIP analyses (12, 21). In studies that analysed mean values for these metrics, by contrast, it was shown that drills with a larger ApP could replicate the demands of competitive matches (25).
Finally, the only drills in which SubMIP HSR, HMLD and sprint events occurred—albeit without significant differences—were the two regular goals drill formats with an ApP greater than 75 m2. This finding adds weight to the idea that, in regular goals drills, players adopt tactics that encourage HSR (13).
This study has several limitations. First, its analysis of only six drill formats limits the broader applicability of the results. Second, the use of different scoring targets with different pitch sizes may have influenced players’ physical responses. Third, the specifc and small sample size may limit statistical power and generalizability. Finally, the results depend on MIP values that vary from one player to another.
Conclusions
The frequency of SubMIP events differed significantly among different types of drills and between drills and competitive matches. The ApP and drill objective strongly influence the physical demands on players. Although some drill formats did not fully replicate the demands of competitive matches, AccDens values were similar—and sometimes higher—than the values attained in matches. Furthermore, the SubMIP approach allows detailed monitoring of the repetition and accumulation of near-peak exertion periods, allowing coaches to better optimise training loads.
Practical applications
The results suggest that drills can be adapted to better address the demands of competitive matches. To stimulate high-intensity events such as HSR and sprints, drills should have an ApP greater than 150 m2 and should be supported by specific high-speed exercises. The intensity of certain variables in regular goals drills could be increased to levels near those of competitive matches. Small spaces (ApP < 75 m2 per player) lead to more demanding SubMIP AccDens events and require players to engage in changes of pace more frequently, especially in possession drills. Since no single drills format replicates all the demands of competitive matches, coaches should combine different ApP levels and drill objectives to ensure that players are fully stimulated during training sessions. Where feasible, coaches should ensure that players attain near-match SubMIP levels during the training week.
While our study did not track injuries, frequent SubMIP exposures reflect repeated near-maximal demands. When poorly periodized (e.g., abrupt increases across key external-load parameters), such exposures may contribute to maladaptation, potentially affecting readiness and injury risk. Conversely, progressive, individualized dosing of drill formats with higher SubMIP occurrence can better align training with match demands while managing risk.
This methodological proposal allows loads to be adapted to the individual needs of each athlete. SubMIP-based analysis provides an additional tool for the detailed monitoring of physical demands in sports with intermittent loads.
Perspectives
Researchers should explore a wider range of drill formats, examine alternative temporal windows for SubMIP detection (in addition to the 60 s window) and develop a standardized methodology for analysing SubMIP events. They should also continue to investigate training loads, since the frequency and intensity of effort needed to optimise the adaptation of individual athletes remains unknown.
Data availability statement
The datasets presented in this study can be found in online repositories. The names of the repository/repositories and accession number(s) can be found in the article/Supplementary Material.
Ethics statement
The studies involving humans were approved by Ethics Committee of the Sports Council of Catalonia (number 035/CEICGC/2021). The studies were conducted in accordance with the local legislation and institutional requirements. The participants provided their written informed consent to participate in this study. Written informed consent was obtained from the individual(s) for the publication of any potentially identifiable images or data included in this article.
Author contributions
EC: Conceptualization, Data curation, Formal analysis, Funding acquisition, Investigation, Methodology, Project administration, Resources, Software, Supervision, Validation, Visualization, Writing – original draft, Writing – review & editing. ML: Conceptualization, Formal analysis, Investigation, Methodology, Project administration, Supervision, Validation, Writing – original draft, Writing – review & editing, Funding acquisition, Resources, Software, Visualization. TC: Conceptualization, Formal analysis, Funding acquisition, Investigation, Methodology, Project administration, Resources, Software, Supervision, Validation, Visualization, Writing – original draft, Writing – review & editing. MC: Conceptualization, Formal analysis, Funding acquisition, Investigation, Methodology, Project administration, Resources, Software, Supervision, Validation, Visualization, Writing – original draft, Writing – review & editing. DP: Data curation, Writing – original draft, Writing – review & editing.
Funding
The author(s) declare that no financial support was received for the research and/or publication of this article.
Conflict of interest
The authors declare that the research was conducted in the absence of any commercial or financial relationships that could be construed as a potential conflict of interest.
Generative AI statement
The author(s) declare that no Generative AI was used in the creation of this manuscript.
Any alternative text (alt text) provided alongside figures in this article has been generated by Frontiers with the support of artificial intelligence and reasonable efforts have been made to ensure accuracy, including review by the authors wherever possible. If you identify any issues, please contact us.
Publisher's note
All claims expressed in this article are solely those of the authors and do not necessarily represent those of their affiliated organizations, or those of the publisher, the editors and the reviewers. Any product that may be evaluated in this article, or claim that may be made by its manufacturer, is not guaranteed or endorsed by the publisher.
Supplementary material
The Supplementary Material for this article can be found online at: https://www.frontiersin.org/articles/10.3389/fspor.2025.1666652/full#supplementary-material
References
1. Hill-Haas SV, Dawson B, Impellizzeri FM, Coutts AJ. Physiology of small-sided games training in football: a systematic review. Sports Med. (2011) 41(3):199–220. doi: 10.2165/11539740-000000000-00000
2. Campos Vázquez MÁ, Jiménez Iglesias J. Periodización integral. Un modelo holístico para el futbol actual. In: Periodización Integral. Firts. Torrazza Piemonte: Amazon KDP (Independently published) (2024). p. 159–96.
3. Praça GM, Andrade AGP, Bredt SDGT, Moura FA, Moreira PED. Progression to the target vs. regular rules in soccer small-sided games. Sci Med Football. (2021) 6(1):66–71. doi: 10.1080/24733938.2020.1869811
4. Clemente FM, Afonso J, Castillo D, Arcos AL, Silva AF, Sarmento H. The effects of small-sided soccer games on tactical behavior and collective dynamics: a systematic review. Chaos Soliton Fract. (2020) 134:109710. doi: 10.1016/j.chaos.2020.109710
5. Casamichana D, Castellano J. Time-motion, heart rate, perceptual and motor behaviour demands in small-sides soccer games: effects of pitch size. J Sports Sci. (2010) 28(14):1615–23. doi: 10.1080/02640414.2010.521168
6. Praça GM, Chagas MH, Bredt SDGT, Andrade AD. Small-sided soccer games with larger relative areas result in higher physical and physiological responses: a systematic and meta-analytical review. J Hum Kinet. (2022) 81(1):163–76. doi: 10.2478/hukin-2022-0013
7. Sarmento H, Clemente FM, Harper LD, Costa Id, Owen A, Figueiredo AJ. Small sided games in soccer–a systematic review. Int J Perf Anal Sport. (2018) 18(5):693–749. doi: 10.1080/24748668.2018.1517288
8. Clemente FM, Sarmento H. The effects of small-sided soccer games on technical actions and skills: a systematic review. Hum Mov. (2020) 21(3):100–19. doi: 10.5114/hm.2020.93014
9. Owen AL, Wong DP, Mckenna M, Dellal A. Heart rate responses and technical comparison between small- vs. large-sided games in elite professional soccer. J Strength Cond Res. (2011) 25(8):2104–10. doi: 10.1519/JSC.0b013e3181f0a8a3
10. Clemente FM, Praça GM, Aquino R, Castillo D, Raya-González J, Rico-González M, et al. Effects of pitch size on soccer players’ physiological, physical, technical, and tactical responses during small-sided games: a meta-analytical comparison. Biol Sport. (2023) 40:111–47. doi: 10.5114/biolsport.2023.110748
11. Aguiar M, Botelho G, Lago C, Maças V, Sampaio J. A review on the effects of soccer small-sided games. J Hum Kinet. (2012) 33(1):103–13. doi: 10.2478/v10078-012-0049-x
12. Dalen T, Samael S, Stenens T, Hjelde GH, Kjosnes T, Wilsoff U. Diferences in acceleration and high-intensity activities between small-sided games and peak periods of official matches in elite soccer players. J Strength Cond Res. (2019) 35(7):2018–24. doi: 10.1519/JSC.0000000000003081
13. Gaudino P, Alberti G, Iaia FM. Estimated metabolic and mechanical demands during different small-sided games in elite soccer players. Hum Mov Sci. (2014) 36:123–33. doi: 10.1016/j.humov.2014.05.006
14. Campos-Vázquez MÁ, Casamichana-Gómez D, Suárez-Arrones L, González-Jurado JA. Medium-sided games in soccer: physical and heart rate demands throughout successive working periods. J Hum Sport Exerc. (2017) 12(1):129–41. doi: 10.14198/jhse.2017.121.11
15. Abate Daga F, Gollin M, Daga AF. Manipulation of playing field’s length/width ratio and neutral players’ positioning: activity profile and motor behavior demands during positional possession soccer small sided games in young elite soccer players. Int J Sports Sci. (2016) 6:106–15. doi: 10.5923/j.sports.20160603.07
16. Couto BP, Praça GM, Gabbett TJ, Luchesi MS, Oliveira MP, Sayers MGL. The influence of the field orientation on the representativeness of the positional dynamics in soccer small-sided games. Int J Sports Sci Coach. (2023) 19(4):1680–87.
17. Casamichana D, Bradley PS, Castellano J. Influence of the varied pitch shape on soccer players physiological responses and time-motion characteristics during small-sided games. J Hum Kinet. (2018) 64(1):171–80. doi: 10.1515/hukin-2017-0192
18. Weaving D, Young D, Riboli A, Jones B, Coratella G. The maximal intensity period: rationalising its use in team sports practice. Sports Med Open. (2022) 8(1):128. doi: 10.1186/s40798-022-00519-7
19. Asian-Clemente J, Rabano-Muñoz A, Muñoz B, Franco J, Suarez-Arrones L. Can small-side games provide adequate high-speed training in professional soccer? Int J Sports Med. (2021) 42(6):523–8. doi: 10.1055/a-1293-8471
20. Clemente FM. The threats of small- sided soccer games: a discussion about their differences with the match external load demands and their variability levels. Strength Cond J. (2020) 42(3):100–5. doi: 10.1519/SSC.0000000000000526
21. de Dios-Álvarez V, Castellano J, Padrón-Cabo A, Rey E. Do small-sided games prepare players for the worst-case scenarios of match play in elite young soccer players? Biol Sport. (2024) 41:95–106. doi: 10.5114/biolsport.2024.127389
22. Oliva-Lozano JM, Rojas-Valverde D, Gómez-Carmona CD, Fortes V, Pino-Ortega J. Worst case scenario match analysis and contextual variables in professional soccer players: a longitudinal study. Biol Sport. (2020) 37(4):429–36. doi: 10.5114/BIOLSPORT.2020.97067
23. Bortnik L, Nir O, Forbes N, Alexander J, Harper D, Bruce-Low S, et al. Worst case scenarios in soccer training and competition: analysis of playing position, congested periods, and substitutes. Res Q Exerc Sport. (2023) 95:588–600. doi: 10.1080/02701367.2023.2290265
24. Casamichana D, Castellano J, Diaz AG, Gabbett TJ, Martin Garcia A. The most demanding passages of play in football competition: a comparison between halves. Biol Sport. (2019) 36(3):233–40. doi: 10.5114/biolsport.2019.86005
25. Martin Garcia A, Castellano J, Diaz AG, Cos F, Casamichana D. Positional demands for various-sided games with goalkeepers according to the most demanding passages of match play in football. Biol Sport. (2019) 36(2):171–80. doi: 10.5114/biolsport.2019.83507
26. Martín García A, Casamichana D, Díaz Gómez A, Cos F, Gabbett JT. Positional differences in the most demanding passages of play in football competition. J Sports Sci Med. (2018) 17(4):563–70. PMCID: PMC6243617.
27. Riboli A, Esposito F, Coratella G. Small-sided games in elite football: practical solutions to replicate the 4 min match-derived maximal intensities. J Strength Cond Res. (2023) 37(2):366–74. doi: 10.1519/JSC.0000000000004249
28. Cipriano R, Pérez-Chao E, Lago C, Zong S, Gómez MÁ. Frequency and intensity of maximal and submaximal demanding scenarios in U19 professional soccer players. J Sports Sci. (2024) 42(12):1112–9. doi: 10.1080/02640414.2024.2384256
29. Novak AR, Impellizzeri FM, Trivedi A, Coutts AJ, McCall A. Analysis of the worst-case scenarios in an elite football team: towards a better understanding and application. J Sports Sci. (2021) 39(16):1850–9. doi: 10.1080/02640414.2021.1902138
30. Oliva-Lozano JM, Fortes V, Muyor JM. The first, second, and third most demanding passages of play in professional soccer: a longitudinal study. Biol Sport. (2021) 38(2):165–74. doi: 10.5114/biolsport.2020.97674
31. Caro E, Campos-Vázquez MÁ, Lapuente-Sagarra M, Caparrós T. Analysis of professional soccer players in competitive match play based on submaximum intensity periods. PeerJ. (2022) 10:e13309. doi: 10.7717/peerj.13309
32. Riboli A, Esposito F, Coratella G. The distribution of match activities relative to the maximal intensities in elite soccer players : implications for practice. Res Sports Med. (2021) 29:1–12. doi: 10.1080/15438627.2021.1895788
33. Caro E, Lapuente-Sagarra M, Caparrós T, Pajón D, Campos-Vázquez MÁ. Analysis of the submaximal intensity periods during the competitive microcycle in professional football players. Apunt Educ Fis Depor. (2024) 158:52–62. doi: 10.5672/apunts.2014-0983.es.(2024/4).158.06
34. Lobo-Triviño D, García-Calvo T, Polo-Tejada J, Sanabria-Pino B, López del Campo R, Nevado-Garrosa F, et al. Analyzing positional and temporal variations in worst-case scenario demands in professional Spanish soccer. J Funct Morphol Kinesiol. (2025) 10(2):172. doi: 10.3390/jfmk10020172
35. Illa J, Fernandez D, Reche X, Carmona G, Tarragó JR. Quantification of an elite futsal team’s microcycle external load by using the repetition of high and very high demanding scenarios. Front Psychol. (2020) 11(October):1–10. doi: 10.3389/fpsyg.2020.577624
36. World Medical Association. World Medical Association declaration of Helsinki: ethical principles for medical research involving human subjects. JAMA. (2013) 310(20):2191–4. doi: 10.1001/jama.2013.281053
37. Jennings D, Cormack S, Coutts AJ, Boyd LJ, Aughey RJ. Variability of GPS units for measuring distance in team sport movements. Int J Sports Physiol Perform. (2010) 5(4):565–9. doi: 10.1123/ijspp.5.4.565
38. Beato M, Coratella G, Stiff A, Dello Iacono A. The validity and between-unit variability of GNSS units (STATSports apex 10 and 18 Hz) for measuring distance and peak speed in team sports. Front Physiol. (2018) 9(SEP):1–8. doi: 10.3389/fphys.2018.01288
39. Delves RIM, Duthie GM, Ball KA, Aughey RJ. Applying common filtering processes to global navigation satellite system-derived acceleration during team sport locomotion. J Sports Sci. (2022) 40(10):1116–26. doi: 10.1080/02640414.2022.2051332
40. Illa J, Fernandez D, Tarragó JR, Reche X. Most demanding passages in elite futsal: an isolated or a repeat situation? Apunt Educ Fis Depor. (2020) 142:80–4. doi: 10.5672/apunts.2014-0983.es.(2020/4).142.10
41. Yılmaz O, Soylu Y. A comparative study of the effects of small-sided game formats on internal load and technical responses in soccer. Pamukkale J Sport Sci. (2024) 15:416–31. doi: 10.54141/psbd.1467311
42. Searle SR, Speed FM, Milliken GA. Population marginal means in the linear model: an alternative to least squares means. Am Stat. (1980) 34:216–21. doi: 10.2307/2684063
43. Santos FJ, Verardi CEL, de Moraes MG, Filho P, Macedo DM, Figueiredo AG, et al. Effects of pitch size and goalkeeper participation on physical load measures during small-sided games in sub-elite professional soccer players. Appl Sci. (2021) 11(17):1–12. doi: 10.3390/app11178024
Keywords: submaximal intensity, training load, GPS, football, match demands, small-sided games
Citation: Caro E, Lapuente-Sagarra M, Caparrós T, Campos-Vázquez MÁ and Pajón D (2025) Submaximal intensity periods in game-based drills vs. match demands in professional football. Front. Sports Act. Living 7:1666652. doi: 10.3389/fspor.2025.1666652
Received: 15 July 2025; Accepted: 12 September 2025;
Published: 29 September 2025.
Edited by:
Farruh Ahmedov, Samarkand State University, UzbekistanReviewed by:
Zhanneta Kozina, H.S. Skovoroda Kharkiv National Pedagogical University, UkraineSevim Gullu, Istanbul University-Cerrahpasa, Türkiye
Mochamad Ridwan, Surabaya State University, Indonesia
Copyright: © 2025 Caro, Lapuente-Sagarra, Caparrós, Campos-Vázquez and Pajón. This is an open-access article distributed under the terms of the Creative Commons Attribution License (CC BY). The use, distribution or reproduction in other forums is permitted, provided the original author(s) and the copyright owner(s) are credited and that the original publication in this journal is cited, in accordance with accepted academic practice. No use, distribution or reproduction is permitted which does not comply with these terms.
*Correspondence: Toni Caparrós, dG9uaS5jYXBhcnJvc0BnZW5jYXQuY2F0
†ORCID:
Edu Caro
orcid.org/0000-0002-7823-4478
Manuel Lapuente-Sagarra
orcid.org/0000-0003-2491-0247
Toni Caparrós
orcid.org/0000-0002-5169-1935
Miguel Ángel Campos-Vázquez
orcid.org/0000-0003-4888-0329