 Nathanael Easey1
 Dmytro Chuprynyuk1
 W. M. Syazwan Wan Musa1Angus Bangs1
 Yousef Dobah1,2Anton Shterenlikht1
 Fabrizio Scarpa1*
- 1Faculty of Engineering, University of Bristol, Bristol, United Kingdom
- 2Department of Mechanical Engineering, University of Jeddah, Jeddah, Saudi Arabia
We present in this work the manufacturing, modeling, and testing of dome-shaped cellular structures with auxetic (negative Poisson's ratio) behavior. The auxetic configurations allow the creation of structures with synclastic (i.e., dome-shaped) curvatures, and this feature is used to evaluate the performance of cellular metamaterials under quasi-static indentation conditions. We consider here different cellular geometries (re-entrant, arrow-head, tri-chiral, hexagonal) and the implications of their manufacturing using 3D printing techniques with PLA material. The dome-shaped configurations are modeled using full-scale non-linear quasi-static and explicit dynamic FE models that represent both the geometry and approximate constitutive models of the PLA filament material derived from tensile tests on dogbone specimens. The cellular metamaterials samples are subjected to indentation tests, with maps of strains obtained through DIC measurements. The correlation between experimental and numerical simulations is good, and shows the peculiar indentation behavior of these cellular structures. We also perform a comparative analysis by simulation of the force/displacement, strain and fracture history during quasi-static loading, and discuss the performance of the different cellular topologies for these dome-shape metamaterial designs.
1. Introduction
A mechanical metamaterial is a multiscale system of materials with engineered mechanical properties that can vary dramatically from those of the base material. Mechanical materials can therefore exhibit some global unusual deformation mechanisms. Lattice structures are a popular example of mechanical metamaterials because of their high strength to density ratio, compared to traditional structural materials (Ashby, 2006). Another important aspect of lattice structures is their tailorable mechanical response, both at global and hierarchical scale (Sun and Pugno, 2013).
A subset of mechanical metamaterials is represented by auxetics. While conventional cellular foams and rubber-like materials have a Poisson's ratio varying from ν≈0.5 (incompressible) to ν = 0 (e.g., cork) with decreasing density, auxetics possess instead a negative Poisson's ratio. Negative ν means that the elongation in one direction is accompanied by an elongation in the transverse direction. On the opposite, the auxetic material will shrink under compression. Auxetic structures can be deployed to provide a required indentation resistance (Evans and Alderson, 2000), high compressive and shear stiffness (Sanami et al., 2014), and high energy absorption (Mohsenizadeh et al., 2015). In biomedical applications of auxetics have been sought in bone implants (Warmuth et al., 2017; Kolken et al., 2018). Auxetics can be also developed by applying patterns of cuts and holes (Grima et al., 2005). Perforated auxetic composite plates have been used in a hybrid flexible cushioning support for multiple sclerosis patients (Mohanraj et al., 2016).
The mechanical properties of lattices can be changed dramatically (Ashby, 2006) by varying the connectivity of the struts and the angles between the same struts at joints, therefore creating auxeticity in essentially bending-dominated lattices (Grima et al., 2010; Bouakba et al., 2012; Saxena et al., 2016). Auxetic structures exhibit synclastic behavior when bent, i.e., they deform into dome shapes (Alderson and Alderson, 2007), rather than saddle ones, which are typical of structures with positive ν. This makes auxetics useful in applications such as pressure vessels (Adachi, 1968) and anti-blast protections (Sahu and Gupta, 2015). Auxetic domes designs could therefore be suitable for protective equipment applications. A lower cell density in an auxetic lattice also leads to lower stiffness and higher bending and rotation motion of the struts (Scarpa et al., 2000; Carneiro et al., 2016), and this increases the effective negative effective Poisson's ratio νa (Carneiro et al., 2016). The energy absorption of chiral auxetic topologies is greater than that of the re-entrant dome as the strut thickness increased and the νa reduced (Scarpa et al., 2000). This suggests that there is a smaller dependence on cell geometry configurations like the tri-chiral lattice.
The energy absorption of a foam increases with density, because the indenter/impactor force is distributed over a larger number of cells (Lakes and Elms, 1993; Fleck and Qiu, 2007). The increase of the cell density in a structure like an auxetic dome should therefore lead to a greater amount of strut deformation, and thus to higher energy absorption.
In the arrow-head topology νa grows from a negative value to zero with increasing strain (Yang et al., 2018). The arrow-head and re-entrant topology has higher energy dissipation than the hexagonal lattice due to the negative in-plane νa. The re-entrant topology has the highest energy absorption (Yang et al., 2018). Both re-entrant and arrow-head topologies are significantly anisotropic (Zied et al., 2015).
Plasticity and non-linear geometry have a significant effect on FE modeling of deformation of auxetic structures (Zhang et al., 2018). Structures ranging from a unit cell to full scale geometrical models have been modeled successfully with beam elements and 3D solid elements (Blachut and Galletly, 1988).
Although auxetic foams have received a lot of attention (Lakes and Elms, 1993; Zied et al., 2015; Yang et al., 2018), little research has been done on auxetic dome-shaped structures. The work presented in this paper focuses on the buckling and post-buckling behavior of novel auxetic lattice domes, such as those shown in Figure 1.
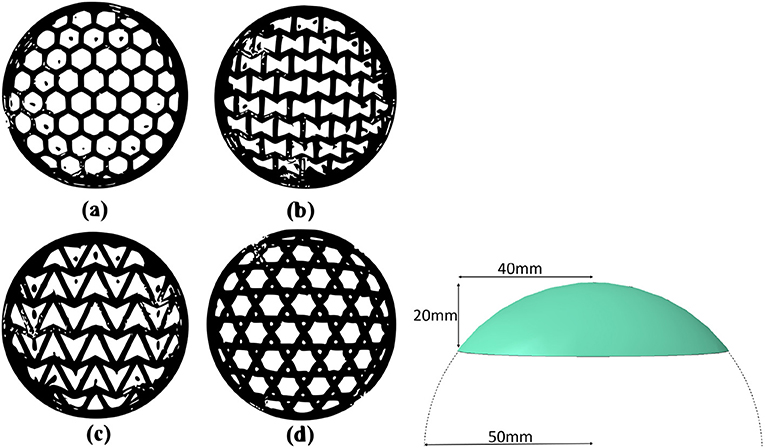
Figure 1. The four cellular topologies considered here (Left): (a) hexagonal, (b) re-entrant, (c) arrow, and (d) tri-chiral. An arrow-head dome PLA specimen (Left) and the spherical dome dimensions (Right). The sphere radius is 50 mm. The dome height is 20 mm and the dome base radius is 40 mm.
2. Domes and the Effect of the Poisson's Ratio
In 1946 Reissner showed that the term (1 − ν2)1/2, where ν is the Poisson's ratio of the material, appears in the linear differential equations for normal displacements, w, in thin shallow spherical shells (Reissner, 1946). Reissner considered a spherical shell segment being shallow if the ratio of its height to the base diameter did not exceed 1/8. Ashwell extended Reissner's theory to large deflections w and showed that a spherical shell segment loaded by an inward point load, F, does not exhibit instability (Ashwell, 1960). Ashwell also demonstrated that the linear theory predicts a linear relationship between F and w, while his non-linear theoretical model predicts a non-linear F(w) response, but still with no loss of elastic stability. A snap-through instability (buckling) is predicted when distributed load (external pressure), p, is applied to a spherical shell, with the same term (1 − ν2)1/2 appearing in the expression for the critical pressure, pc (Budiansky, 1960), see Equation (1), where E is the Young's modulus, and R and t are the shell radius of curvature and thickness respectively.
Leckie showed that a snap through instability does indeed occur under the application of an inward radial force thorough a rigid “boss” of a finite diameter, if plastic deformation is allowed (Leckie, 1969). However, as a plastic deformation is incompressible, no dependence of the critical load on ν was found. This aspect is reinforced also by the particular case we consider in the following example. The loading case is somewhat intermediate between an inward radial force and external pressure on a simply supported spherical shell segment (hereafter–a dome) compressed between a pair of rigid plates. A preliminary non-linear elastic FE study using full 3D solid theory and an isotropic elastic homogeneous material shows that, although a snap-through behavior is clearly present, no sensitivity to ν is also apparent (see Figure 2). In this figure w has been scaled by the dome thickness t; F* is the applied load scaled as shown in Equation (2). The parameters h and b correspond to the dome height and the base radius, respectively.
In this particular example the following dimensions have been considered: R = 50 mm, b = 40 mm, h = 20 mm, t = 2 mm. The Young's modulus E = 2, 774 MPa represents a polymeric material (typical PLA used in 3D printing). The elements considered in this simulations were 2nd order tetra elements C3D10 (Dassault Systèmes, 2014). The models feature 4 elements through the thickness. The Abaqus eigenvalue (Dassault Systèmes, 2014) results for the “boss” loading of a simply supported dome are shown in Figure 3. Note that the predicted critical loads are 3 order of magnitude higher than from plate compression. However, the shape of the curve is the one given by Equation (1).
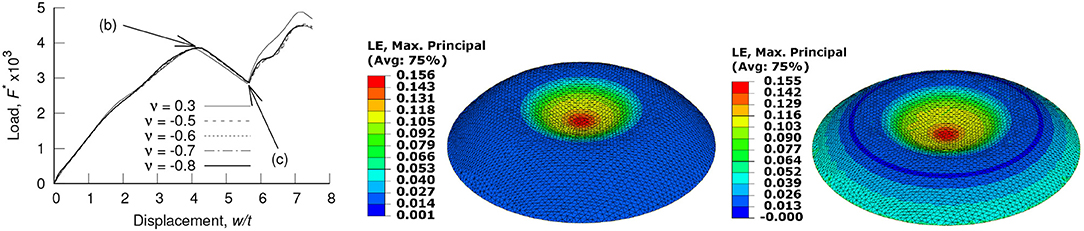
Figure 2. FE snap-through response in the plate compression of a solid dome, showing: (Left) a snap through response, and the maximum principal logarithmic strain, ϵ1, at (Middle) buckling and (Right) after snap-through.
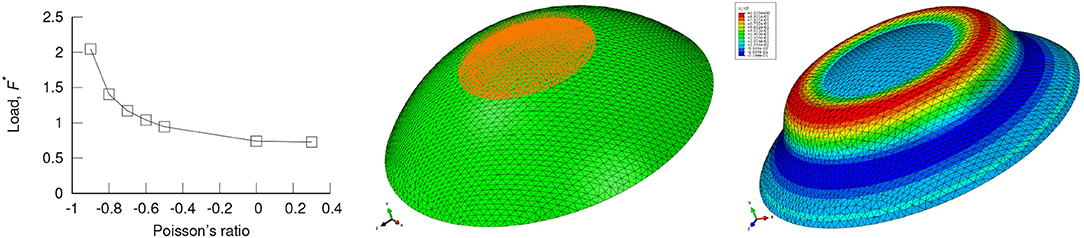
Figure 3. Eigenvalue analysis for “boss” loading of a solid dome, showing: (Left) the buckling load, (middle) the prescribed displacement of the “boss” area and (Right) the 1st buckling mode.
Figures 2, 3 suggest that the issue of the stability of domes with different Poisson's ratio values is complex, and cannot be simply resolved by using existing analytical solutions. In this work we tackle this particular problem with a program of experimental and numerical experiments on lattice domes, which possess different lattice geometries that mimic varying Poisson's ratios.
3. Experiments
3.1. PLA Mechanical Properties
The domes were manufactured from PLA using a Raise3D N1 system with fused filament fabrication (FFF) to extrude the filament into layers, with a single nozzle. The CAD model was converted to the stereolithography (STL) format, compatible with the 3D printer “slicing” software IdeaMaker. IdeaMaker eventually translates the model into a G-code file that contains commands of tool path and amount of extruded material for the printer to execute and produce the domes. The “slicing” process involves applying internal support structures to the model to prevent the dome from collapsing, as the struts can overhang at angles greater than 35° (Baumann et al., 2016). A photo of the 3D printer used for this work is provided as Supplementary Material.
The domes were manufactured with the following topologies: hexagonal, tri-chiral, re-entrant, and arrow-head. A 0.2 mm turquoise colored filament was used with 100% infill ratio, extruder temperature of 235°, 0.2 mm layer height, and 65° print bed temperature. The strut thickness and width were 2 mm.
FFF 3D printing is known to induce mechanical anisotropy in finished components due to its method of material deposition. To reduce the printed material anisotropy, the “slicing” software changes printer's tool path by 90° at every layer by default. Thus, it had to be edited manually to enforce specific direction at all the layers. To measure this anisotropy, dog-bone specimens of 6 configurations were made, see Figure 4.
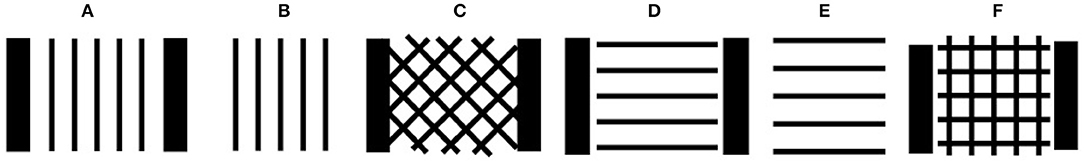
Figure 4. Six layouts for printing dog-bone specimens: (A) 90° with support walls, (B) 90° without support walls, (C) ±45° with support walls, (D) 0° with support walls, (E) 0° without support walls, and (F) 0°/90° with support walls.
The tensile tests were carried out at a rate of 2 mm/min using a clip gauge, according to ASTM D638-14 (2014) valid for 3D printed polymers. The clip gauge, with a resolution of 0.5%, was chosen over the strain gauges because it allows quicker placement on the samples and less time for the experimental set up (Motra et al., 2014). The load cell uncertainty was also 0.5% The cross section area (for stress calculations) was measured with Vernier calipers with 0.02 mm resolution.
The measured PLA Young's modulus was E = 2742 ± 129 MPa, which agrees with the published data (E = 2852 ± 88 MPa; Innofil3D, 2017). The mean yield stress is 15 MPa and the mean flow curve is provided as a Supplementary Material.
3.2. Compression Testing of Domes
The compression tests have been carried out with a Shimadzu Universal testing equipped with a 10 kN load cell. A very low displacement rate (3 mm/min) was used to avoid strain rate effects, as the PLA properties are severely affected by the strain rate (Richeton et al., 2006). The tests were performed at room temperature, well below the PLA glass transition temperature of 59°C (Narladkar et al., 2008).
The use of Digital Image Correlation (DIC) required that the top and/or the bottom surfaces of the dome were visible. A rig was designed to allow cameras to view the dome through transparent acrylic plates, while being out of the way, Figure 5. A steel plate was used at the base. Three 8 mm diameter steel threaded rods were used to attach 10 mm thick acrylic plates. The base diameter was 250 mm.
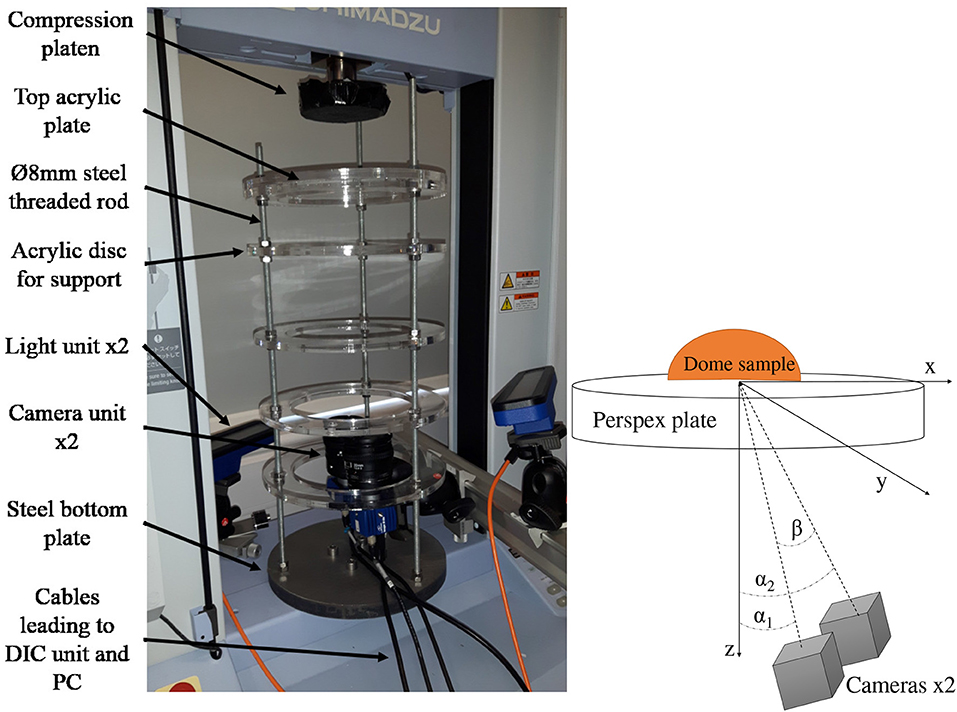
Figure 5. The loading rig for the DIC application (Left) and a schematic of the positioning of the cameras (Right).
Given the relatively low stiffness of the acrylic, it was important to measure the compliance of the rig, to subtract from the measured dome displacement. Equation (3) expresses the rig compliance as displacement δ, in mm, vs. applied force F, in N.
The DIC and load/displacement data were captured at 10 Hz.
3.3. Digital Image Correlation (DIC)
A LaVision portable 3D StrainMaster DIC system was used, with two illumination sources and two M-Lite 5 Megapixel cameras, 20mm lenses and polarizing filters (LaVision, 2017). The kit was mounted on a leveled stand and placed within the experimental rig, see Figure 5.
A zero mean normalized sum of squared difference correlation function (ZNSSD) has been shown to be the most effective for 3D DIC, because it compensates for errors associated with intensity change along the deformation (Pan et al., 2010). For an image subset with dimensions 2M + 1 × 2M + 1 pixels, the ZNSSD correlation function is given in Equation (4).
where all summation is for i and j from −M to M, and ; and f and g are pixel intensities in the reference and the target subsets respectively (Pan et al., 2010).
The DIC method is inherently subjective. Numerous parameters affect the quality of DIC results, such as the lighting, the camera exposure (Zhu et al., 2018), the focal length (Reu et al., 2015), the surface pattern (Lecompte et al., 2006; Sutton et al., 2009; Reu et al., 2015), as well as the accuracy of the calibration.
A subset size of 13 × 13 pixels was used, as it allows approximately three dominant features within a single subset. This was found to be the optimum value in this work and consistent with best practice in literature (McGinnis et al., 2005). To increase the spatial resolution, the step between the subsets was 3 pixels, giving a 10 pixel overlap. A moving average smoothing kernel of 9 × 9 pixels was used for the strain data. The main purpose of smoothing in this work is to reduce the noise produced at the strut edges. The kernel size was chosen to reduce areas of outlying high strains without noticeably reducing the accuracy of the displacements.
The refraction effects due to imaging through the acrylic plates were measured by varying the angle between the camera optical axis and the normal to the plate. The maximum difference was 0.6%, i.e., the effects of refraction could be considered negligible.
The DIC displacement agrees to within 1% with the Shimadzu displacement, which was validated to within 0.02 mm using Vernier calipers, 0.03% of the dome height. This comparison is provided as a Supplementary Material.
4. FE Modeling of the Experiments
The Abaqus FE package was used (Dassault Systèmes, 2014) to model the compression of the auxetic cellular domes. Both implicit and explicit solvers were used, depending on the analysis. Continuum 3D 10-node quadratic tetrahedral elements (Abaqus type C3D10) were used and isotropic homogeneous material properties were assumed, with isotropic hardening. An analysis of the material's Poisson's ratio concluded that it has a negligible effect on the buckling load or post-buckling behavior. Therefore, the reference value of ν = 0.3 was used in all simulations (Farah et al., 2016). While a mesh sensitivity analysis (provided as a Supplementary Material) shows that a global mesh size of 1.5 mm was acceptable for post-buckling analysis.
The static analysis was performed using Newton-Raphson and Riks methods. The Riks method is typically used to model the snap through buckling in solid domes. However, since lattice domes (and auxetic domes in particular) exhibit a much weaker snap through effect, the Newton-Raphson method with displacement control was found in this work to be sufficiently stable. Element deletion was used for modeling fracture propagation with the explicit dynamic solver (Abaqus/Explicit). Fracture simulations used the Johnson-Cook (JC) hardening and the JC failure criterion (Johnson and Cook, 1985) due to their simplicity and ready availability in the Abaqus explicit dynamic solver (tuning JC is described in Supplementary Material).
Schematics of the FE compression test is shown in Figure 6, where the bottom plate was fixed and the top plate was moved vertically down under displacement control. Both plates were modeled as rigid bodies and the interaction between them and the dome was defined as friction contact. the friction coefficient, μ, of the interaction was found to have a significant affect on buckling in the FE simulations, with higher friction increasing the buckling load and the post-buckling stiffness. It was found that μ = 0.4 gives the best agreement between the FE results and the DIC data regarding the change in dome base diameter.
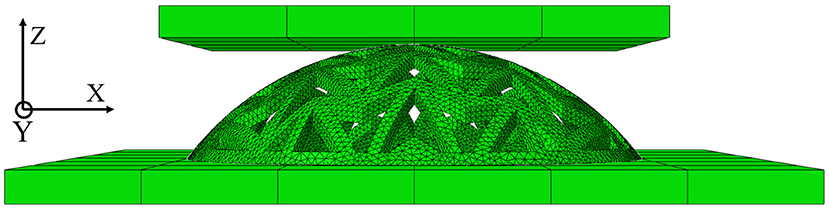
Figure 6. Schematic of the FE dome compression test.
Once the FE model was calibrated, several parametric studies were performed (presented as a Supplementary Material) showcasing their affect on the dome performance.
5. Results
Figure 7 shows a very good agreement between the FE and the experimental results for the arrow-head and re-entrant domes. The experimental data error bars represent here the standard deviation from 5 experiments. For the FE, the error bars represent the mean and the upper and the lower bounds of the flow curve. Note that the re-entrant topology exhibits virtually no snap through behavior, and even the arrow-head topology shows a much lower snap though compared to the one exhibited by a solid dome (Figure 2).
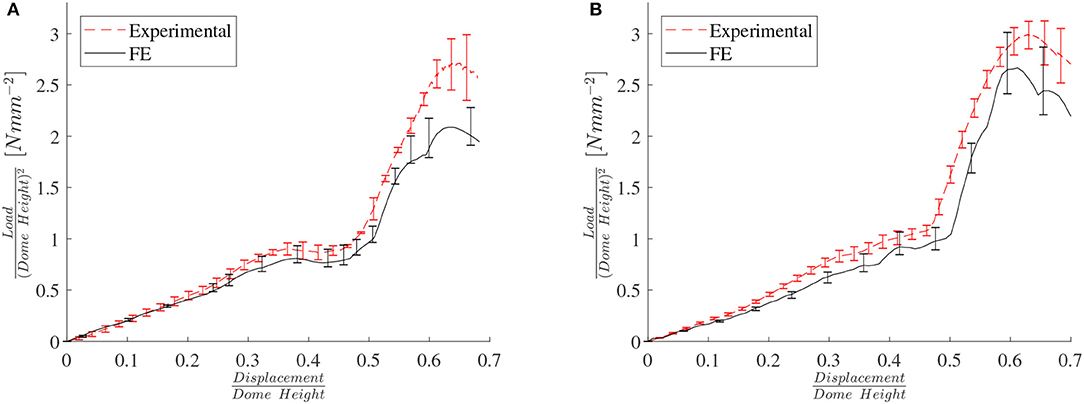
Figure 7. FE vs. experimental load/displacement results for (A) arrow-head and (B) re-entrant topologies.
The 3D printing using PLA produces struts of uneven thickness. Our measurements showed that the mean strut thickness was 2.14 mm with a standard deviation of 0.07 mm. The FE strut also thickness varied due to the limitations of converting a CAD model into a FE mesh. The mean thickness of the struts in the Finite Element models was in reality equal to 2.12 mm, with a standard deviation of 0.14 mm. This small systematic error might explain the higher experimental loads observed in Figure 7.
The Finite Element results have been computed by considering both large geometric deformations and the non-linear mechanical properties of the PLA material. A question may arise about the importance in the mechanical response of the architecture of the domes vs. the core material behavior. To this end we have performed simulations related to arrow, re-entrant and trichiral configurations under large geometric deformations, but with linear elastic material only (see Figure S5 right). The equivalent Young's modulus of the PLA has also been varied to assess any material scaling effect on the response. The results clearly show that up to a scaled displacement of 0.4–0.5 the response of the dome is negligibly dependent of the mechanical properties (both linear and non-linear—Figure 7). The first post-buckling occurrence in the response is scarcely dependent upon the linearity or non-linearity of the core materials properties, and appear at the same scaled displacement value. These are clear indications that the force/displacement behavior of these cellular domes under indentation is essentially governed by the architecture of the lattice.
Figure 8 shows a very good qualitative agreement of the displacement contour plots between DIC and FE, and an excellent quantitative agreement is seen in Figure 9, which shows vertical (z) displacement at the center of the dome (G1), and points located 2 struts away from the top (G2), and 4 struts away from the top (G3). The DIC error bars are standard deviations from 5 experiments.
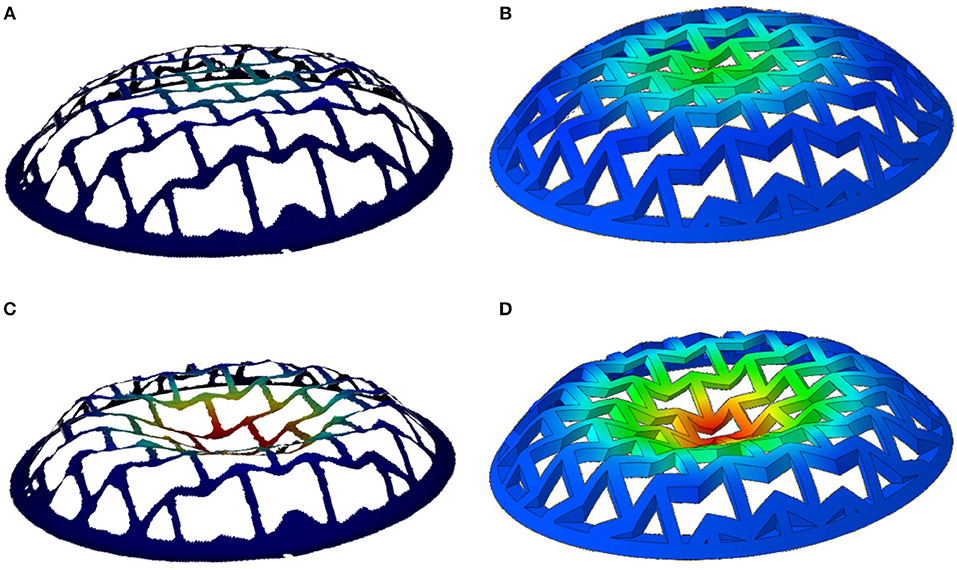
Figure 8. DIC vs. FE vertical displacements (DIC on the left and FE on the right), showing (A,B) at the onset of buckling, and (C,D) when the dome center touches the bottom plate.
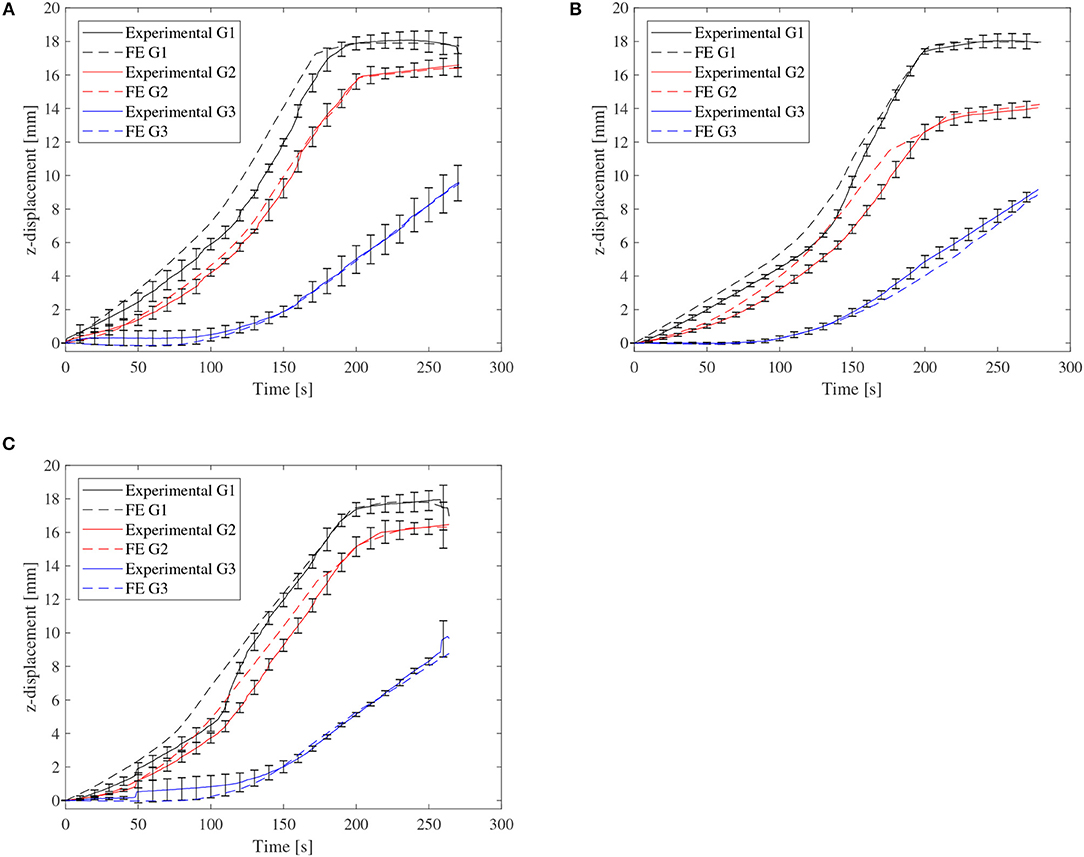
Figure 9. DIC vs. FE displacement at 3 points on the domes, showing: (A) arrow-head, (B) re-entrant, and (C) tri-chiral topologies.
Figure 10 shows a very good match between the DIC and FE engineering strains in the struts of the central cell, up to the end of the simulation/experiment, (Figure 7). The time variable in the graphs corresponds to the displacement steps of the indentor surface. One can also notice a dramatic change in the strain histories between the 3 different auxetic topologies.
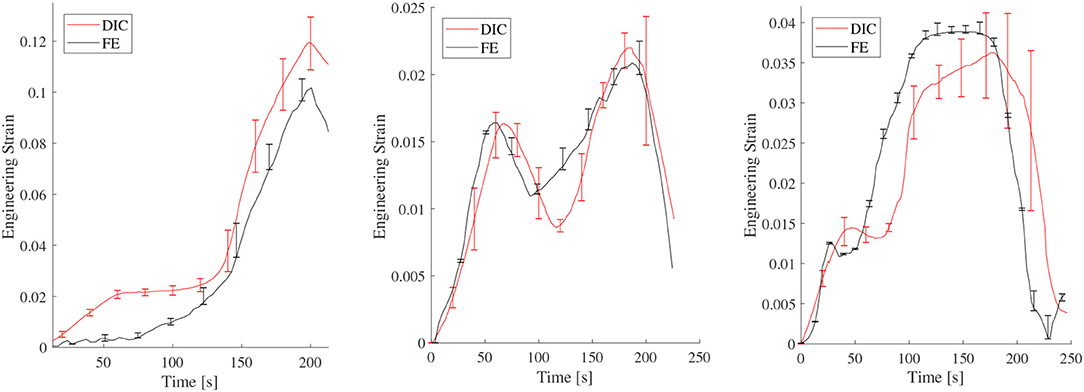
Figure 10. DIC vs FE engineering strain on struts belonging to the central cell, for (Left) re-entrant topology (axial strut), (Middle) re-entrant topology (diagonal strut), and (Right) tri-chiral topology (single strut).
Figure 11 compares FE vs. DIC ϵ1 and Figure 12 compares FE vs. DIC ϵ13, or ϵxz, where z is the vertical direction. Note that the LaVision's “normal” in Figure 11 means principal (LaVision, 2017). All contour plots show the onset of buckling, and the matching color bars are used for FE and DIC for ease of comparison. Regions of particular interest are circled in these figures.
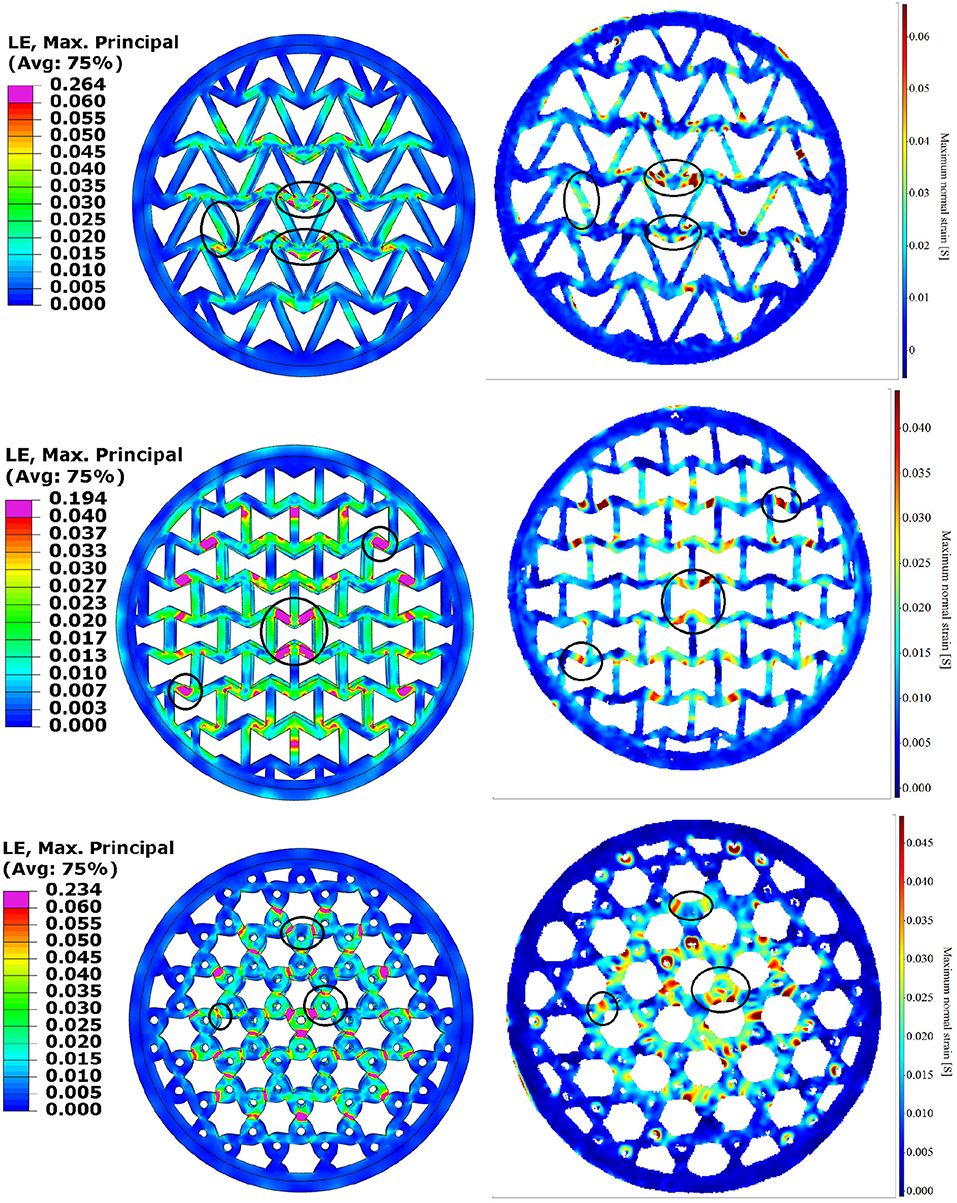
Figure 11. FE (Left) vs. DIC (Right) ϵ1 at buckling for 3 topologies: arrow-head in the top row, re-entrant in the middle row and tri-chiral in the bottom row. The most interesting features have been circled.
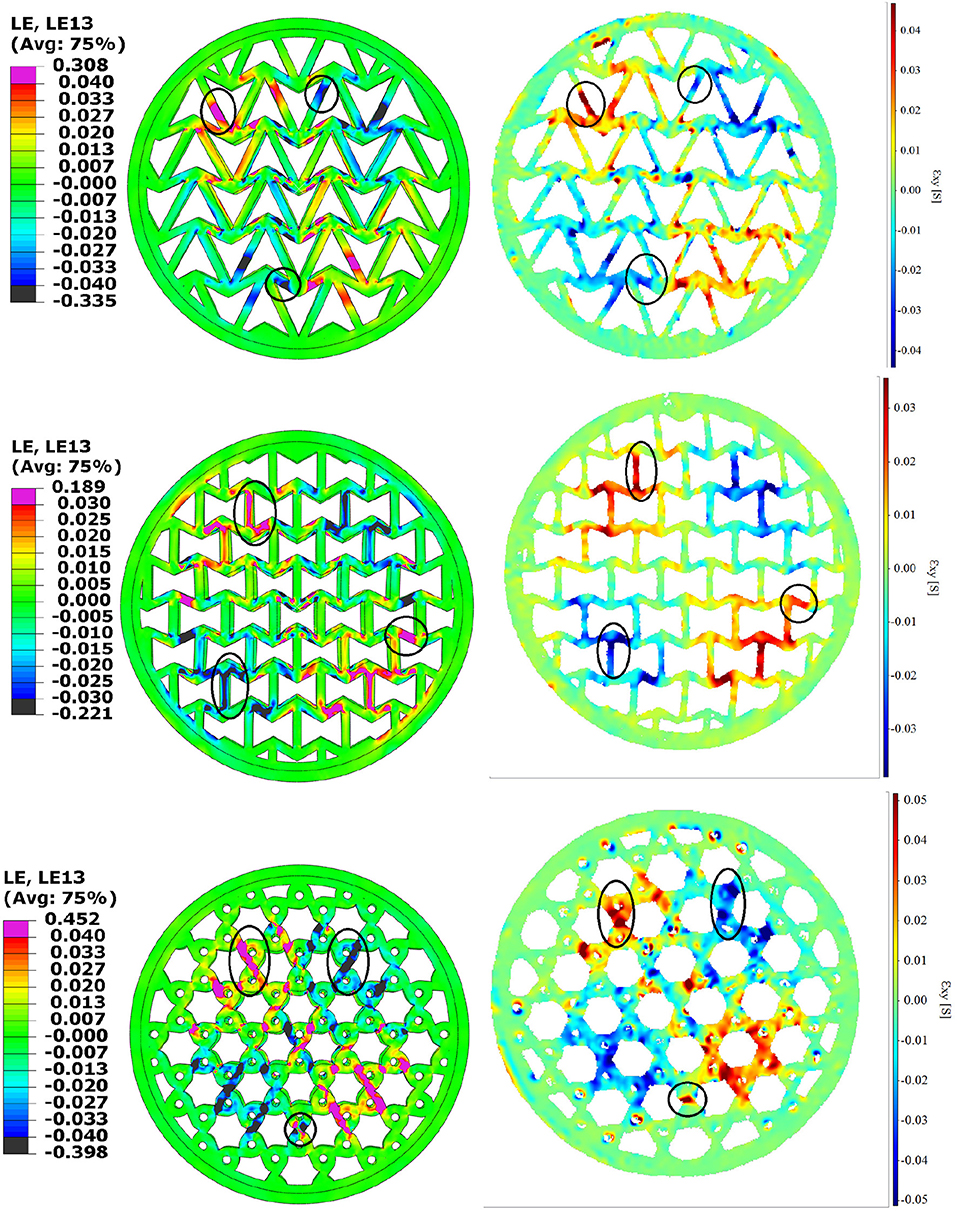
Figure 12. FE (Left) vs. DIC (Right) ϵ23 at buckling for 3 topologies: arrow-head in the top row, re-entrant in the middle row and tri-chiral in the bottom row.
Two-dimensional (flat) lattice specimens were also printed and tested under tension to measure the lateral contraction and determine an equivalent Poisson's ratio, ν for the lattice structures (Table 1). Analytical models of 2D tri-chiral lattices report ν = −1 (Prall and Lakes, 1997), whereas our 2D tests give ν = −0.72. However, Prall and Lakes (1997) assumed zero specimen thickness; for higher thicknesses or lower slenderness ratios of the struts the shear deformation of the cross section becomes important (Scarpa et al., 2000).
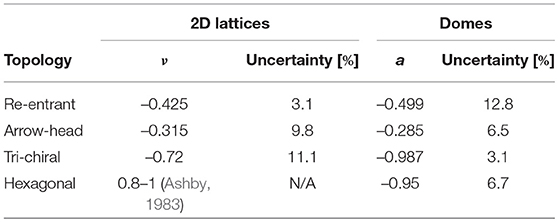
Table 1. Mean values and uncertainty of the Poisson's ratio, for 2D lattices, and of anisotropy for the domes.
The coefficient a for the domes is defined as the ratio between the diameter extension along x to the diameter contraction in y under a compression along z. Thus, a is an indicator of anisotropy, as well as of the Poisson's ratio of the dome lattices. The hexagonal lattice has a≈−1, because it is an isotropic topology, which expands equally in x and y under compression. Note that the 3 auxetic lattices show similar trends for ν and a.
Fracture was observed experimentally during the testing of the re-entrant, hexagonal, and tri-chiral domes. An example is shown in Figure 13B, which is a DIC shear strain map. The region circled in red, on the outer rim of the dome, was where the ductile fracture first appeared. Soon after, the fracture propagated fast toward the center of the dome along the path indicated by the black dashed line. These later fractures were all brittle.
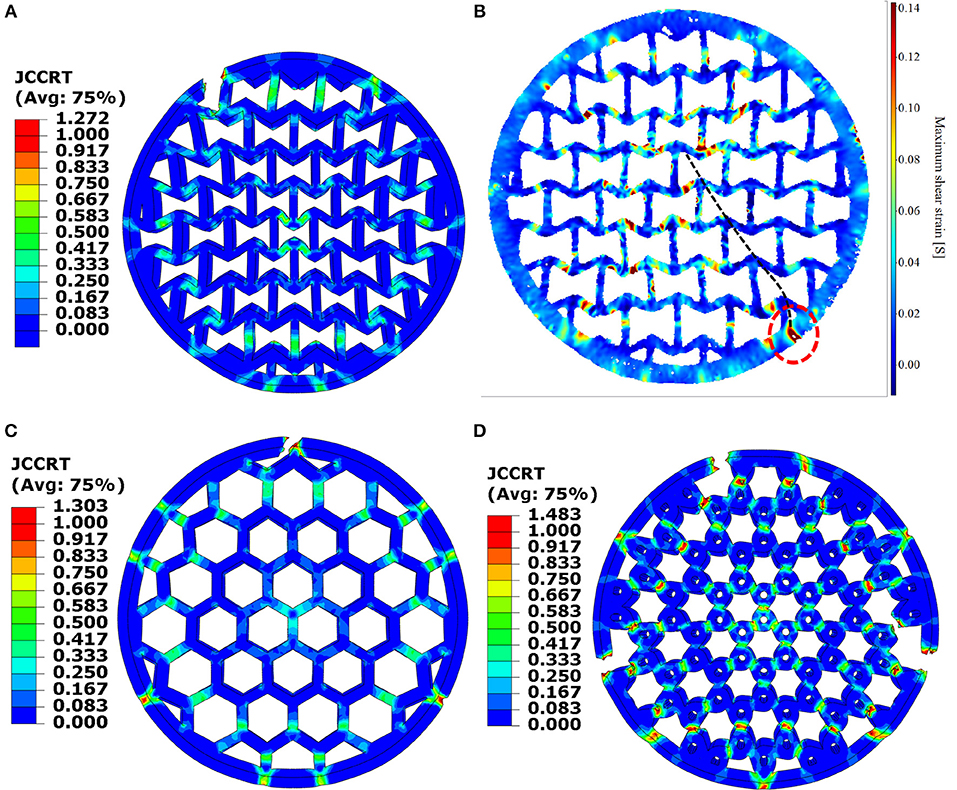
Figure 13. FE vs. DIC fracture initiation, showing: (A) FE re-entrant, (B) DIC re-entrant, (C) hexagonal, and (D) tri-chiral topologies. FE data is the value for the JC fracture criterion. DIC data is the maximum shear strain.
Explicit dynamic FE simulations of fracture were then carried out using the JC failure criterion, on the 3 topologies (Figure 13). In all cases the fracture initiation was predicted at the outer rim. Fracture propagation was simulated using the element removal technique. The solid and the arrow-head domes showed a significant plastic strain prior to fracture, whereas, the tri-chiral dome fractured with little plasticity. This could be attributed to the rotation of the tri-chiral cells, which represents another deformation mechanism to absorb energy, aside from the bending/stretching/shear of the struts.
The SEM images of the PLA fracture surfaces are provided as Supplementary Material. The amount of plastic deformation in the 3D printed PLA depends on the print direction. Voids and coalescence are signs of ductile fracture in 3D printed polymers (Torrado Perez et al., 2014; Gao and Qiang, 2017). Brittle fracture is seen as the presence of “river lines,” which are a sign of two surfaces being rapidly torn apart, like those on a cleavage fracture in crystalline materials. There is evidence of both ductile and brittle fractures in the SEM images.
Figure 14 compares compression response of domes with 4 lattice topologies (3 auxetic and hexagonal). The tri-chiral topology shows a load which is monotonically increasing (within the data uncertainty), with little indication of buckling. The other 3 topologies show similar response, even though the hexagonal lattice is not auxetic.
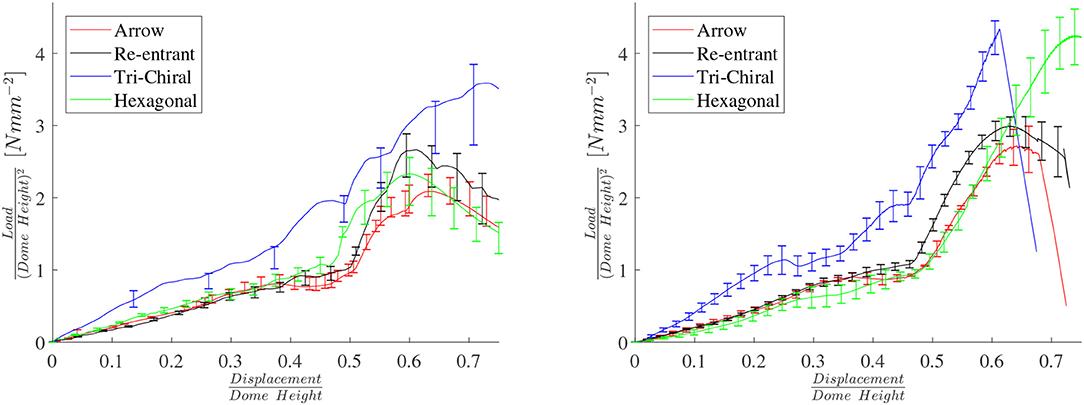
Figure 14. FE (Left) and experimental (Right) load/displacement curves from buckling tests for 4 dome topologies.
6. Conclusions
An accurate and optimized DIC method was produced and used to successfully validate the FE models of auxetic cellular domes. Very good agreement was achieved between DIC and FE for the onset of buckling and post-buckling response, including strain, displacement, and loads. Experimental results are highly dependent on the errors and inaccuracies in 3D printing.
Auxetic cellular domes offer less indentation resistance under compressive loading than solid domes. They also show reduced snap-through in comparison with conventional lattices and solid domes. Tri-chiral topologies show higher resistance to compression than conventional lattices, which in turn show marginally higher resistance than the re-entrant topologies. The smallest snap-through effect is observed with the re-entrant topology. The cell density and dome curvature (contact size) were shown to affect the compressive resistance and the severity of snap-through.
We are currently working on assessing the dynamic response of auxetic lattices, using a similar experimental and modeling setup. These results will be presented in a follow-up publication.
Author Contributions
NE and DC made the test rig and conducted all experimental work. WM and AB run the elasto-plastic FE simulations. YD created the dome CAD models. AS did the eigenvalue analysis and directed the work. FS directed the work. YD, AS, and FS wrote the paper.
Conflict of Interest Statement
The authors declare that the research was conducted in the absence of any commercial or financial relationships that could be construed as a potential conflict of interest.
Acknowledgments
This work was supported by EPSRC UK grant EP/R013047/1. We acknowledge the use of the computational facilities of the Advanced Computing Research Centre, University of Bristol, https://www.acrc.bris.ac.uk.
Supplementary Material
The Supplementary Material for this article can be found online at: https://www.frontiersin.org/articles/10.3389/fmats.2019.00086/full#supplementary-material
References
Adachi, J. (1968). Stresses and Buckling in Thin Domes Under Internal Pressure. Technical report, Army Materials and Mechanics Research Center, Watertown, MA.
Alderson, A., and Alderson, K. L. (2007). Auxetic materials. Proc. Inst. Mech. Eng. G J. Aerospace Eng. 221, 565–575. doi: 10.1243/09544100JAERO185
Ashby, M. (2006). The properties of foams and lattices. Philos. Trans. R. Soc. Lond. A Math. Phys. Eng. Sci. 364, 15–30. doi: 10.1098/rsta.2005.1678
Ashby, M. F. (1983). The mechanical properties of cellular solids. Metallurg. Trans. A 14, 1755–1769. doi: 10.1007/BF02645546
Ashwell, D. G. (1960). “On the large deflection of a spherical shell with an iward point load,” in The Theory of Thin Elastic Shells, Proc. IUTAM Symposium, ed W. T. Koiter (Delft), 43–63.
ASTM D638-14 (2014). Standard Test Method for the Tensile Properties of Plastics. Technical report, ASTM international.
Baumann, F., Bugdayci, H., Grunert, J., Keller, F., and Roller, D. (2016). Influence of slicing tools on quality of 3d printed parts. Comput. Aided Design Appl. 13, 14–31. doi: 10.1080/16864360.2015.1059184
Blachut, J., and Galletly, G. D. (1988). Clamped torispherical shells under external pressure - some new results. J. Strain Anal. Eng. Design 23, 9–24. doi: 10.1243/03093247V231009
Bouakba, M., Bezazi, A., and Scarpa, F. (2012). Fe analysis of the in-plane mechanical properties of a novel voronoi-type lattice with positive and negative poisson's ratio configurations. Int. J. Solids Struct. 49, 2450–2459. doi: 10.1016/j.ijsolstr.2012.05.007
Budiansky, B. (1960). “Buckling of clamped shallow spherical shells,” in The Theory of Thin Elastic Shells, Proc. IUTAM Symposium, ed W. T. Koiter (Delft), 64–94.
Carneiro, V. H., Puga, H., and Meireles, J. (2016). Analysis of the geometrical dependence of auxetic behavior in reentrant structures by finite elements. Acta Mech. Sin. 32, 295–300. doi: 10.1007/s10409-015-0534-2
Evans, K. E., and Alderson, A. (2000). Auxetic materials: functional materials and structures from lateral thinking! Adv. Mater. 12, 617–628. doi: 10.1002/(SICI)1521-4095(200005)12:9<617::AID-ADMA617>3.0.CO;2-3
Farah, S., Anderson, D. G., and Langer, R. (2016). Physical and mechanical properties of PLA, and their functions in widespread applications—A comprehensive review. Adv. Drug Deliv. Rev. 107, 367–392. doi: 10.1016/j.addr.2016.06.012
Fleck, N. A., and Qiu, X. (2007). The damage tolerance of elastic–brittle, two-dimensional isotropic lattices. J. Mech. Phys. Solids 55, 562–588. doi: 10.1016/j.jmps.2006.08.004
Gao, H., and Qiang, T. (2017). Fracture surface morphology and impact strength of cellulose/PLA composites. Materials 10, 1–11. doi: 10.3390/ma10060624
Grima, J., Alderson, A., and Evans, K. (2005). Auxetic behaviour from rotating rigid units. Phys. Status Solidi B 242, 561–575. doi: 10.1002/pssb.200460376
Grima, J. N., Oliveri, L., Attard, D., Ellul, B., Gatt, R., Cicala, G., et al. (2010). Hexagonal honeycombs with zero poisson's ratios and enhanced stiffness. Adv. Eng. Mater. 12, 855–862. doi: 10.1002/adem.201000140
Innofil3D (2017). Technical Data Sheet PLA 1.75 mm, V3.0. Available online at: http://www.polymaker.com/wp-content/uploads/2015/06/PolyMax-PLA_TDS-v1.pdf
Johnson, G. R., and Cook, W. H. (1985). Fracture characteristics of three metals subjected to various strains, strain rates, temperatures and pressures. Eng. Fract. Mech. 21, 31–48. doi: 10.1016/0013-7944(85)90052-9
Kolken, H. M. A., Janbaz, S., Leeflang, S. M. A., Lietaert, K., Weinans, H. H., and Zadpoor, A. A. (2018). Rationally designed meta-implants: a combination of auxetic and conventional meta-biomaterials. Mater. Horiz. 5, 28–35. doi: 10.1039/C7MH00699C
Lakes, R., and Elms, K. (1993). Indentability of conventional and negative poisson's ratio foams. J. Compos. Mater. 27, 1193–1202. doi: 10.1177/002199839302701203
LaVision (2017). Digital Image Correlation (DIC) system hardware and software user manual. StrainMaster 1.0.
Leckie, F. A. (1969). “Plastic instability of a spherical shell,” in Theory of Thin Shells, Proc. 2nd IUTAM Symposium, ed F. I.Niordson (Copenhagen), 358–373.
Lecompte, D., Smits, A., Bossuyt, S., Sol, H., Vantomme, J., Hemelrijck, D. V., et al. (2006). Quality assessment of speckle patterns for digital image correlation. Opt. Lasers Eng. 44, 1132–1145. doi: 10.1016/j.optlaseng.2005.10.004
McGinnis, M. J., Pessiki, S., and Turker, H. (2005). Application of three-dimensional digital image correlation to the core-drilling method. Exp. Mech. 45, 359–367. doi: 10.1007/BF02428166
Mohanraj, H., Ribeiro, S. L. M. F., Panzera, T. H., Scarpa, F., Farrow, I. R., Jones, R., et al. (2016). Hybrid auxetic foam and perforated plate composites for human body support. Phys. Status Solidi B 253, 1378–1386. doi: 10.1002/pssb.201600106
Mohsenizadeh, S., Alipour, R., Nejad, A. F., Rad, M. S., and Ahmad, Z. (2015). Experimental investigation on energy absorption of auxetic foam-filled thin-walled square tubes under quasi-static loading. Proc. Manufact. 2, 331–336. doi: 10.1016/j.promfg.2015.07.058
Motra, H., Hildebrand, J., and Dimmig-Osburg, A. (2014). Assessment of strain measurement techniques to characterise mechanical properties of structural steel. Eng. Sci. Technol. Int. J. 17, 260–269. doi: 10.1016/j.jestch.2014.07.006
Narladkar, A., Balnois, E., Vignaud, G., and Grohens, Y. (2008). Difference in glass transition behavior between semi crystalline and amorphous poly(lactic acid) thin films. Macromol. Symp. 273, 146–152. doi: 10.1002/masy.200851321
Pan, B., Xie, H., and Wang, Z. (2010). Equivalence of digital image correlation criteria for pattern matching. Appl. Opt. 49, 5501–5509. doi: 10.1364/AO.49.005501
Prall, D., and Lakes, R. (1997). Properties of a chiral honeycomb with a poisson's ratio of -1. Int. J. Mech. Sci. 39, 305–314. doi: 10.1016/S0020-7403(96)00025-2
Reissner, E. (1946). Stresses and small displacements of shallow spherical shells. II. J. Math. Phys. 25, 279–300. doi: 10.1002/sapm1946251279
Reu, P. L., Sweatt, W., Miller, T., and Fleming, D. (2015). Camera system resolution and its influence on digital image correlation. Exp. Mech. 55, 9–25. doi: 10.1007/s11340-014-9886-y
Richeton, J., Ahzi, S., Vecchio, K., Jiang, F., and Adharapurapu, R. (2006). Influence of temperature and strain rate on the mechanical behavior of three amorphous polymers: characterization and modeling of the compressive yield stress. Int. J. Solids Struct. 43, 2318–2335. doi: 10.1016/j.ijsolstr.2005.06.040
Sahu, R., and Gupta, P. (2015). Blast diffusion by different shapes of domes. Defence Sci. J. 65, 77–82. doi: 10.14429/dsj.65.6908
Sanami, M., Ravirala, N., Alderson, K., and Alderson, A. (2014). Auxetic materials for sports applications. Proc. Eng. 72, 453–458. doi: 10.1016/j.proeng.2014.06.079
Saxena, K. K., Das, R., and Calius, E. P. (2016). Three decades of auxetics research-materials with negative Poisson's ratio: a review. Adv. Eng. Mater. 18, 1847–1870. doi: 10.1002/adem.201600053
Scarpa, F., Panayiotou, P., and Tomlinson, G. (2000). Numerical and experimental uniaxial loading on in-plane auxetic honeycombs. J. Strain Anal. Eng. Design 35, 383–388. doi: 10.1243/0309324001514152
Sun, Y. T., and Pugno, N. (2013). In plane stiffness of multifunctional hierarchical honeycombs with negative poisson's ratio sub-structures. Compos. Struct. 106, 681–689. doi: 10.1016/j.compstruct.2013.05.008
Sutton, M. A., Orteu, J.-J., and Schreier, H. (2009). Image Correlation for Shape, Motion and Deformation Measurements: Basic Concepts,Theory and Applications, 1st Edn. Springer Publishing Company, Incorporated.
Torrado Perez, A. R., Roberson, D. A., and Wicker, R. B. (2014). Fracture surface analysis of 3D-printed tensile specimens of novel ABS-based materials. J. Fail. Anal. Prev. 14, 343–353. doi: 10.1007/s11668-014-9803-9
Warmuth, F., Osmanlic, F., Adler, L., Lodes, M. A., and Korner, C. (2017). Fabrication and characterisation of a fully auxetic 3d lattice structure via selective electron beam melting. Smart Mater. Struct. 26, 1–8. doi: 10.1088/1361-665X/26/2/025013
Yang, C., Vora, H. D., and Chang, Y. (2018). Behavior of auxetic structures under compression and impact forces. Smart Mater. Struct. 27, 1–12. doi: 10.1088/1361-665X/aaa3cf
Zhang, J., Dong, G. L., and Wang, R. Z. (2018). Tensile behavior of an auxetic structure: Analytical modeling and finite element analysis. Int. J. Med. Sci. 136, 143–154. doi: 10.1016/j.ijmecsci.2017.12.029
Zhu, H., Liu, X., Chen, L., Ma, Q., and Ma, S. (2018). Influence of imaging configurations on the accuracy of digital image correlation measurement. Meas. Sci. Technol. 29:035205. doi: 10.1088/1361-6501/aa9e6a
Keywords: auxetic domes, snap-through, buckling, re-entrant, arrow-head, tri-chiral, non-linear FE, digital image correlation
Citation: Easey N, Chuprynyuk D, Musa WMSW, Bangs A, Dobah Y, Shterenlikht A and Scarpa F (2019) Dome-Shape Auxetic Cellular Metamaterials: Manufacturing, Modeling, and Testing. Front. Mater. 6:86. doi: 10.3389/fmats.2019.00086
Received: 06 October 2018; Accepted: 08 April 2019;
Published: 24 April 2019.
Edited by:
Fernando Fraternali, University of Salerno, ItalyReviewed by:
Anastasiia O. Krushynska, University of Groningen, NetherlandsLuciano Teresi, Roma Tre University, Italy
Copyright © 2019 Easey, Chuprynyuk, Musa, Bangs, Dobah, Shterenlikht and Scarpa. This is an open-access article distributed under the terms of the Creative Commons Attribution License (CC BY). The use, distribution or reproduction in other forums is permitted, provided the original author(s) and the copyright owner(s) are credited and that the original publication in this journal is cited, in accordance with accepted academic practice. No use, distribution or reproduction is permitted which does not comply with these terms.
*Correspondence: Fabrizio Scarpa, Ri5TY2FycGFAYnJpc3RvbC5hYy51aw==