 Yuxi Liu
 Qian Li2†
- 1College of Materials and Chemical Engineering, Chuzhou University, Chuzhou, China
- 2Lianyungang Jingwei Advanced Composite Material Co., Ltd., Lianyungang, China
A flexible thermal insulation system is proposed in this study, which considers the application and promotion of flexible composite materials in the field of marine engineering. This system is designed to provide a cost-effective and convenient thermal insulation solution for avoiding impurity precipitation and formation of wax plugs caused by extremely low temperature during mining, transportation, and storage of oil. The thermal insulation system includes two main parts: the insulation layer and the heating source. In accordance with the laws of thermodynamics and the primary characteristics of the flexible structure, two different insulation systems were designed and model tests were performed to compare performance in heating efficiency, thermal insulation, and temperature field distribution under identical environmental conditions. Compared with the plan 1 thermal insulation system, the plan 2 system has lower requirements for heating power, more uniform temperature field distribution inside the flexible structure, and a difference of only 7.18°C between the highest and lowest temperatures.
Introduction
The normal operation of offshore oil equipment is inseparable from the support of the insulation system, especially in areas where the ambient temperature is at or lower than the temperature at which development of a wax plug is a risk. The factors affecting temperature change in oil products must be investigated to avoid solidification of oil products during transportation and storage, which is a danger to normal production operations. At present, most research on the insulation of offshore oil equipment focuses on oil pipelines. The main measures used to prevent oil product development of wax plugs during transmission include chemical methods, pipeline insulation, direct electric heating, and noncontact heating methods (Candelier et al., 2015; Sunday et al., 2021). The goal of each method is to reduce oil viscosity during the transportation process to ensure the flow demand.
The chemical method reduces the critical temperature of hydrate formation by adding chemicals to the oil (Nysveen et al., 2007). Pipeline insulation is usually suitable for conditions where the wellhead temperature is high. The pipeline is wrapped with thermal insulation materials to reduce heat loss during the oil transmission process. However, this method has limitations. Low ambient temperature or extremely long pipeline transmission distance leads to wax plug formation and reduces the flow rate (Sadafule and Patil, 2014). The principle of direct electric heating technology is to let the current pass through the pipeline and use the resistance heating effect of the pipeline to heat the oil. Considering that the current of direct electric heating technology is directly connected with seawater during the conduction process, the energy utilization efficiency rate is low, increasing the likelihood of electric corrosion and reducing the service life of the pipeline (Roth, 2011; Lervik et al., 2017; Lervik et al., 2018). Data show a linear relationship between maximum safe power and pipe diameter and an exponential relationship between applicable heating time and pipe diameter (Yao et al., 2019). The development and application of medium voltage technology can effectively reduce power consumption and energy loss, with benefits in terms of installation cost, maintenance, and operation (Molnar et al., 2015; Molnar and Riley, 2016). Noncontact heating technology includes circulating hydrothermal heating, electrical heat tracing, and electromagnetic induction heating (Ansart et al., 2014). Circulating hydrothermal heating adopts pipe-in-pipe structure, where the inner layer is a conveying pipe, the outer layer is an insulation pipe, and the middle space is full of hydrotherm. This design requires an additional pump to facilitate hydrothermal flow.
Compared with the aforementioned heating methods, electrical heat tracing is more efficient in energy utilization and heating by winding a heating cable on the pipeline surface and converting electrical energy directly into heat energy. There is no heat attenuation during the heat preservation process for long-distance pipelines, as occurs with circulating hydrothermal heating, and electrochemical corrosion caused by current flowing through the pipeline is avoided. Electrical heat tracing can be applied to any target sea area and provide protection for pipeline flow by changing the layout density and heating power of the heating cable (Verdeil et al., 2017). Electromagnetic induction heating is equivalent to combining direct electric heating technology and electrical heat tracing. The coil is wound on the pipe but is not in direct contact with the pipe. The coil itself does not heat after power is applied but rather uses the magnetic induction heating capacity of metal to induce self-heating of the pipe and ensure that the oil in the pipeline does not form wax plugs (Bjørvik, 2015; Yakhibbaeva and Chaturova, 2017; Anres et al., 2018; Anres et al., 2019).
Many methods are used in practical engineering applications. Noncontact heating methods cannot be separated from the use of thermal insulation materials to improve heating efficiency (Mehta et al., 2014; Pedroso et al., 2020). At present, the heating and insulation efficiency of pipelines can reach 90% through use of combined applications (Angays, 2011). A combination of heating and insulation has been recognized as the most efficient method, and studies have focused on multiple layers of insulation (An and Su, 2015; Parsazadeh and Duan, 2015), the influence of different heating efficiency on heating effects (González et al., 2018), and the application of other methods, such as electrically trace heated pipe-in-pipe (Jez et al., 2020) and eddy current manufacturers (Park et al., 2015). However, most of the studies remain at the stage of theory and numerical simulation and lack relevant model testing.
On the basis of research on the heating and insulation technology of submarine oil pipelines, combined with the structure of flexible thermal insulation systems, this study uses electrical heat tracing and auxiliary heat insulation to achieve internal oil temperature control and avoid wax plug development. Two heating layout methods are proposed to study the difference in temperature field distribution caused by different trace heating layouts. The heating effect data were obtained via a small-scale model and then used in the design of a more optimized layout to provide reliable heating for actual engineering applications.
Materials and methods
Flexible composite tank specification
The flexible composite tank (FCT) used in this research was an iso-proportional model of 2 m3, 1.6 m high, and a maximum diameter of 1.64 m. The 2D curves are shown in Supplementary Material, and the FCT model was obtained by converting the curve using 3D CAD software. The shape of the FCT was roughly spherical, and the tank was mainly composed of a steel center pipe and flexible membrane. The center pipe consisted of a main pipe and 16 struts, all spread around the main pipe, with a radius of 175 mm and a length of 1.2 m. The flexible membrane consisted of a sealing layer, an insulation layer, and an antileakage layer, each made of collapsible flexible materials (Figure 1). The density of the insulation layer was 0.064 g/cm3, and its thermal conductivity is shown in Table 1.
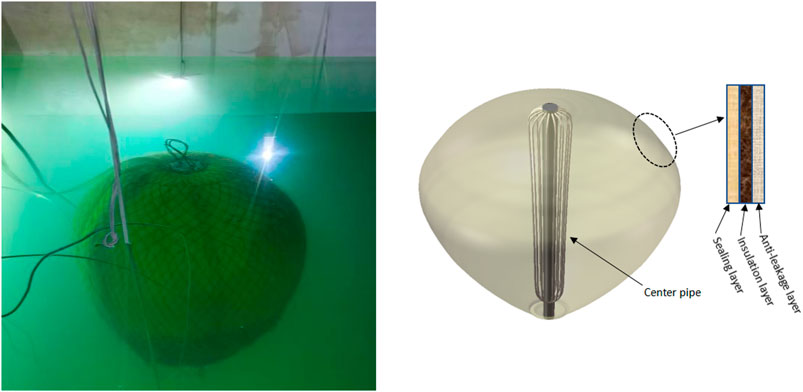
FIGURE 1. FCT sample specification.
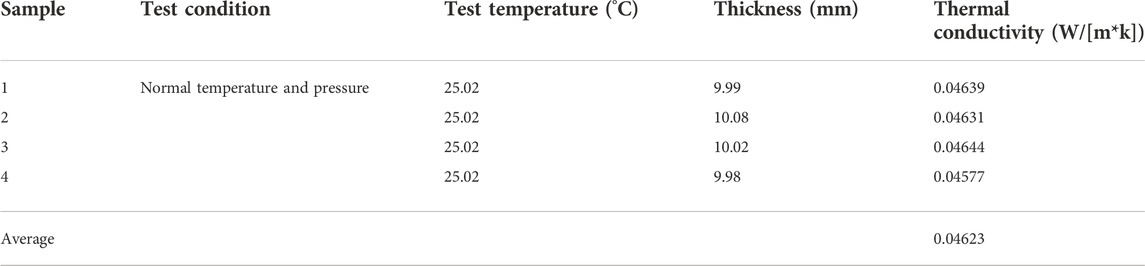
TABLE 1. Insulation layer thermal conductivity.
Heat-tracing configuration
In this test, more heat-tracings with the same type of heating elements were installed to demonstrate that, whether the power was sufficient or not, additional heating elements were activated. A 20-m heat-tracing, which can supply 6.6 kW maximum heating power, was equipped to test the relationship between elevating temperature and heating power supply. Based on the structure of the FCT, two heat-tracing arrangements were designed. Plan 1 had all the heat-tracings laid along with the struts, as shown in Figure 2. Plan 2 had all the heat-tracings arranged within 0.5 m height from the bottom of the struts, as shown in Figure 3.
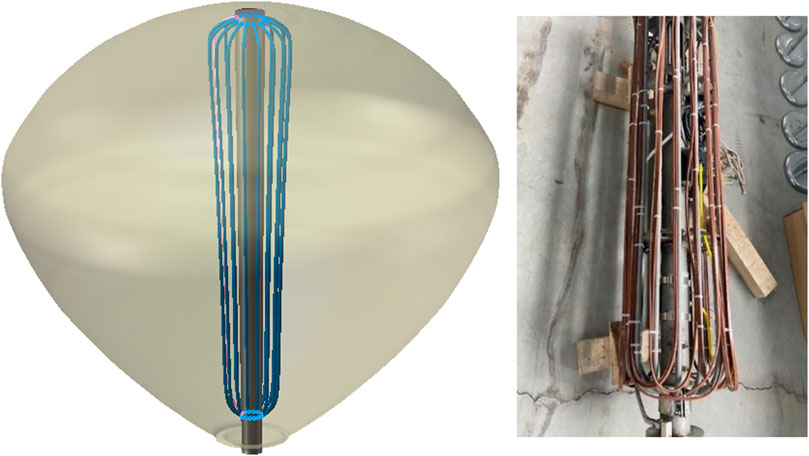
FIGURE 2. Plan 1: Heat-tracing laying along with the struts.
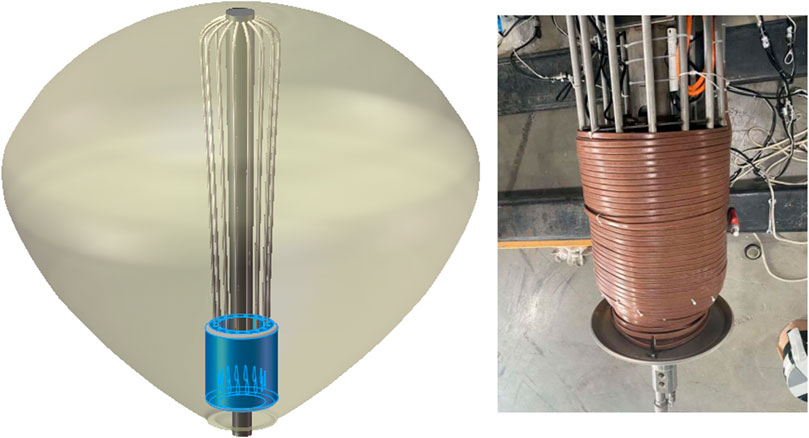
FIGURE 3. Plan 2: Heat-tracing laying on the bottom of struts.
Temperature sensor arrangement
Thirty-three temperature sensors were deployed in the FCT to monitor all field temperatures. The temperature sensors were distributed in the whole tank, including five sensors on the center pipe, 16 sensors on the membrane, and 12 sensors suspended inside the FCT. The 3D layout is shown in Figure 4. The 33 sensors were distributed on two mutually perpendicular surfaces, and the relative position is shown in Figure 5. Each sensor number is shown in Figure 6. For the center pipe, the five sensors were numbered 71, 72, 73, 74, and 75 from the top to the bottom.
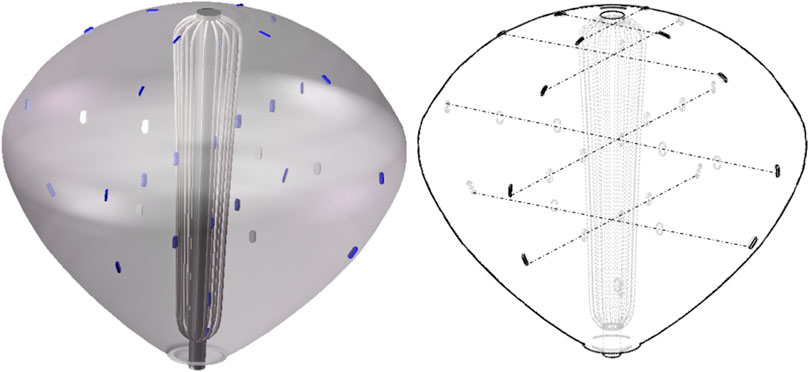
FIGURE 4. Isometric view of temperature sensor arrangement.

FIGURE 5. Position of temperature sensors.
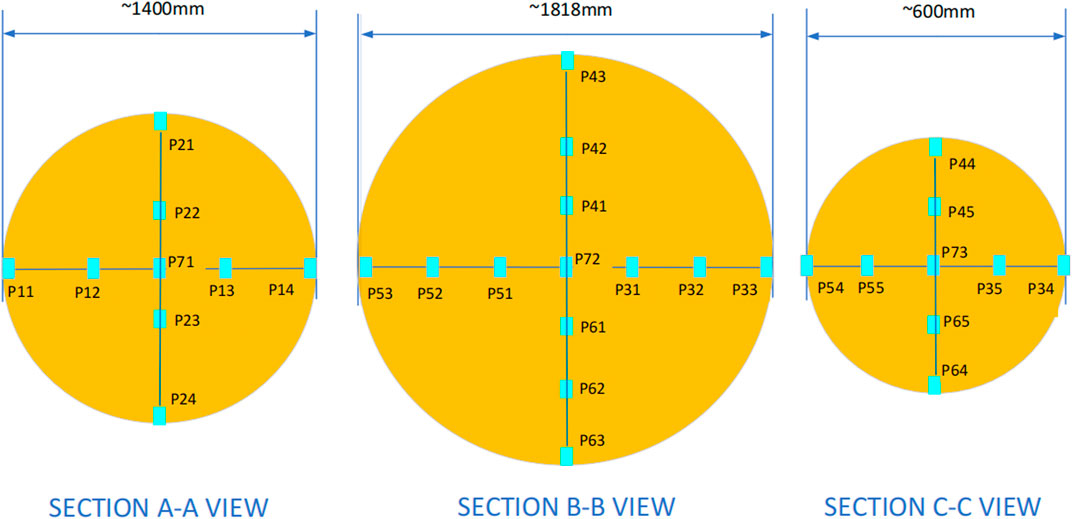
FIGURE 6. Sectional view of the layout of temperature sensors.
Test medium and ambient condition
The medium used for the test was white oil (nonwaxy crude), and its properties are presented in Table 2. The FCT was placed in water to reduce the influence of changes in ambient conditions on the test results. The pool was 12 m in length, 7 m in width, and 6.5 m in depth (Figure 7). In accordance with recorded data, the water temperature fluctuated between 19°C and 25°C.
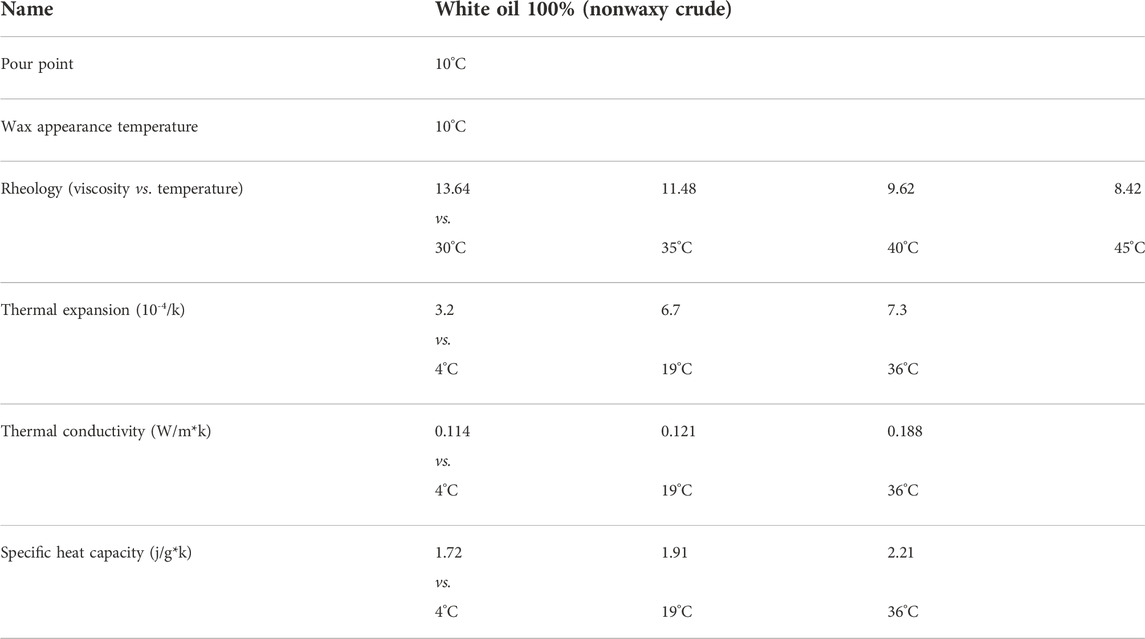
TABLE 2. Rheological properties of testing medium.
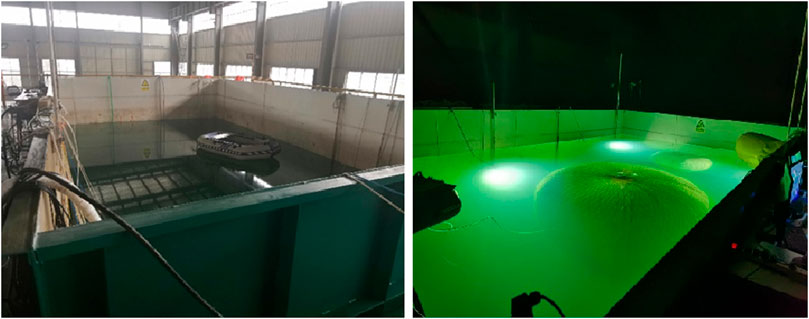
FIGURE 7. Experimental pool.
Results and discussion
Heating effects of plan 1
The switch and heating power adjustment of the heating system during the test were controlled using an automatic procedure and the data from each temperature sensor were recorded every 1 min. For plan 1, the heating power was 6600 W and the continuous heating time was 6 h. The measurements from the sensors inside the FCT were observed. The highest temperature point of 71.31°C was at the top area of the center pipe, the lowest temperature point of 33.38°C was at the bottom of the center pipe, and the temperature difference was 37.93°C. The entire system was allowed to cool down naturally, and the internal temperature of the FCT returned to ambient temperature after 46 h.
From the experimental results, the relatively high-temperature area inside the FCT was at the top and the relatively low temperature area was located at the bottom after heating for 6 h with the plan 1 layout (Figure 8). The maximum temperature deviation was 37.93°C. This phenomenon may be due to rising of the liquid heated by the bottom heating trace into the top zone under conditions of thermal convection, which is then added to the heating effect of the top trace, causing the heating efficiency of the top zone to be twice that of the bottom zone.
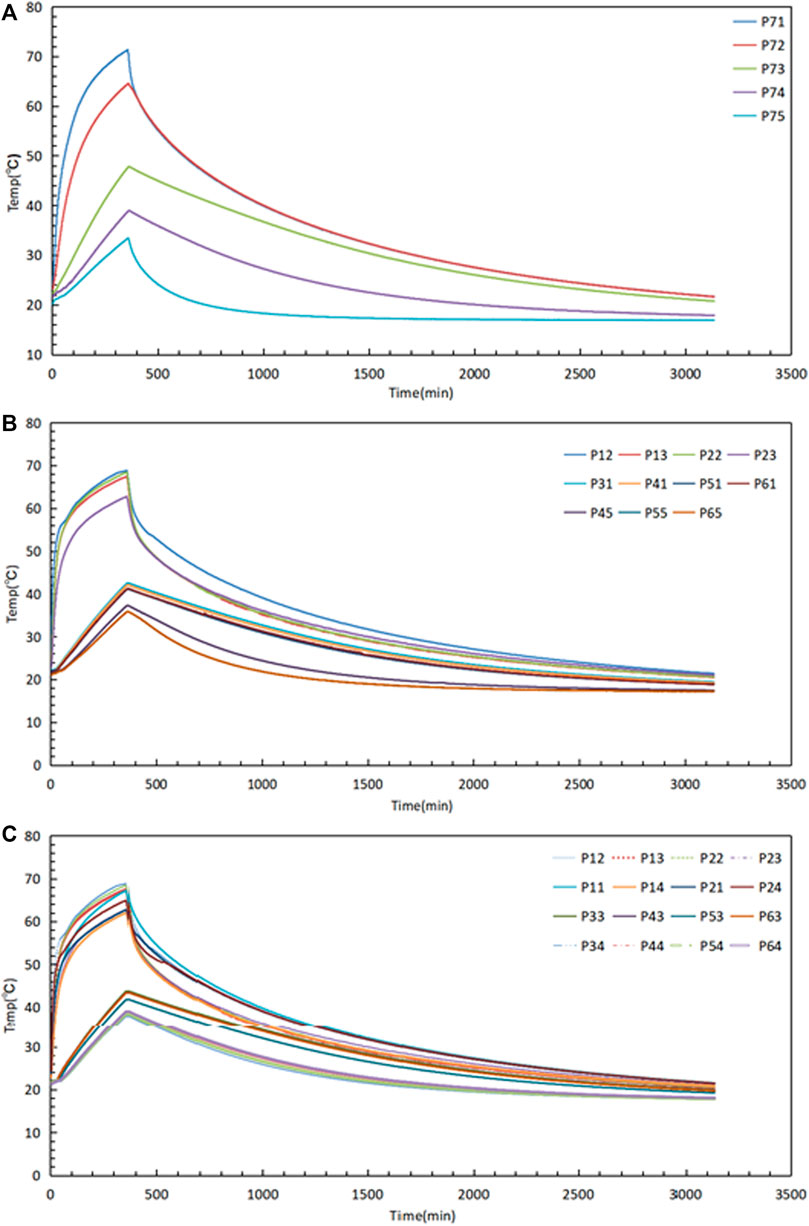
FIGURE 8. Plan 1: Temperature distribution of (A) center pipe, (B) intermediate section, and (C) boundary from the top to the bottom.
As shown in Figure 9, the temperature difference between the central region and the edge region was small within the same height range, with a maximum deviation of 6.87°C. The experimental results indicate feasibility of use of a central heating source combined with an edge insulation layer to achieve a relatively small temperature difference between the central and extreme edge areas of the container. However, improvement of the central heat source layout is needed. Considering thermodynamic convection characteristics, the heat source layout in the top area could be reduced, and the heat source in the bottom increased, to achieve more uniform temperature distribution in the system.
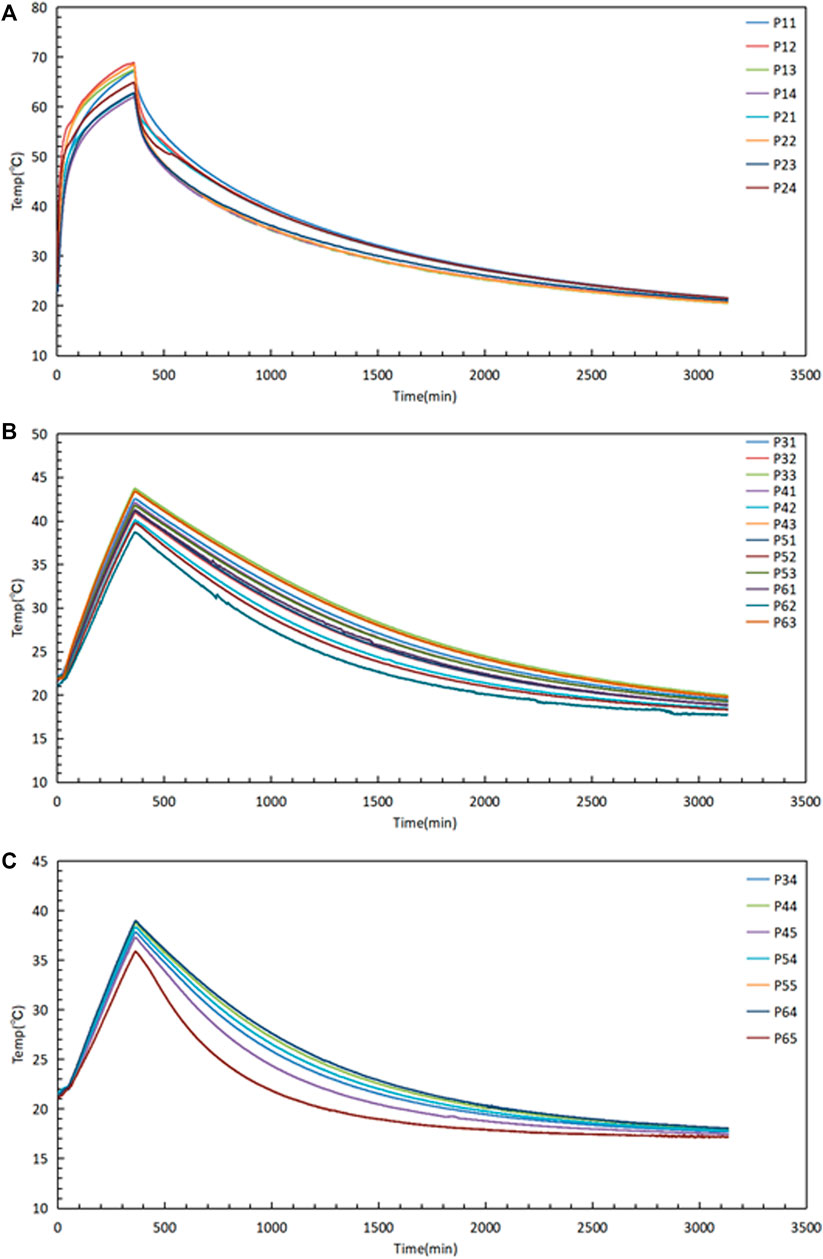
FIGURE 9. Plan 1: Temperature distribution of (A) section A-A, (B) section B-B, and (C) section C-C.
Heating effects of plan 2
For plan 2, the heating duration was 8 h 20 min, heating power was 3400 W, holding time was 21 h 10 min, and the corresponding power was 540 W. The experimental results showed the highest temperature of 43.12°C near the heat source and the lowest temperature of 35.94°C at the top edge. The maximum temperature difference within the FCT was 7.18°C.
As shown in Figure 10, the temperature difference in the height range was insignificant in either the central or edge area. The maximum temperature at the center pipe near the top area was 41.7°C, and the minimum temperature in the upper central partial region (section B-B) was 37.1°C. No remarkable ladder change was observed in the temperature field distribution in the intermediate section between the central pipe and the boundary. The top region had a low temperature, and the bottom region had a higher temperature, with a minimum of 34.44°C and a maximum of 43.12°C. No remarkable ladder change was observed in the temperature field distribution in the boundary, with a minimum temperature of 34.44°C and a maximum of 42.56°C.
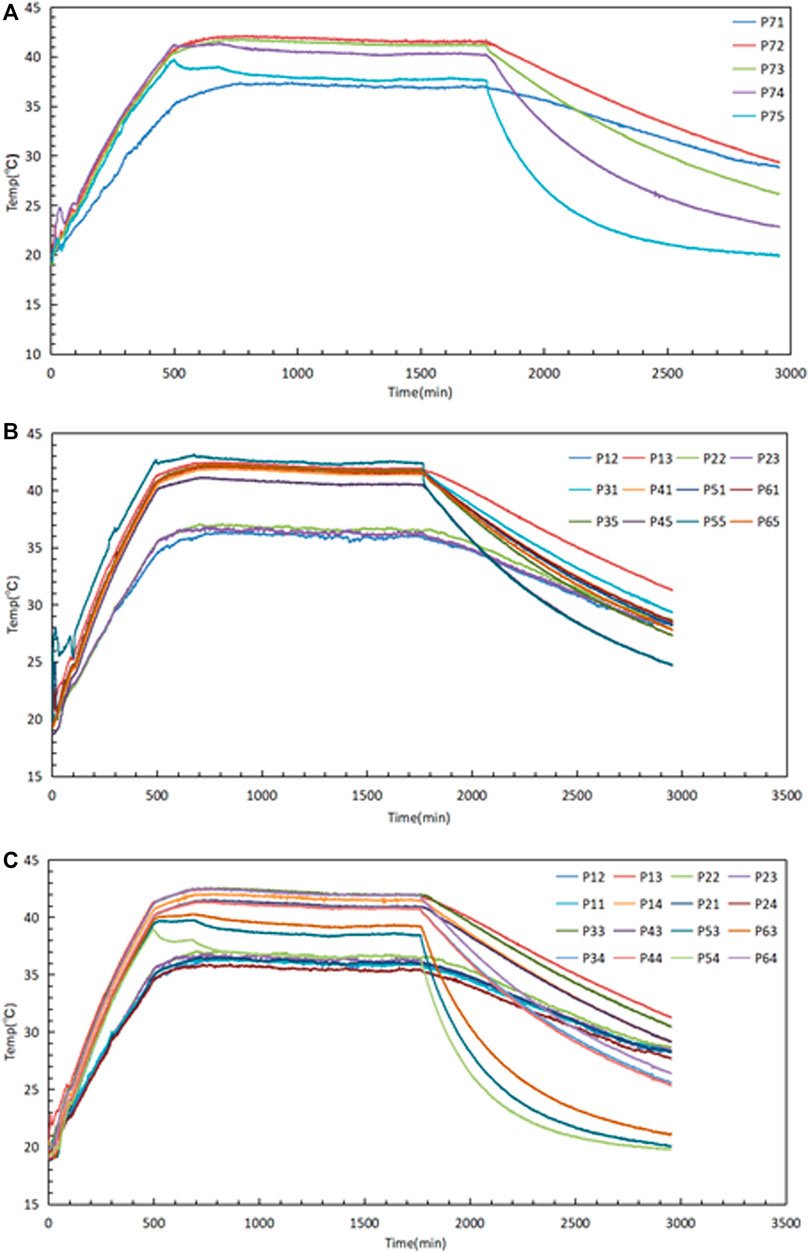
FIGURE 10. Plan 2: Temperature distribution of (A) center pipe, (B) intermediate section, and (C) boundary from the top to the bottom.
As shown in Figure 11, no obvious gradient change was observed in the temperature distribution from the center pipe to the boundary within the same height plane. The test results demonstrated that the plan 2 layout can produce a uniform heating effect on the entire FCT. The insulation led to well-maintained temperature inside the FCT throughout the 21 h 10 min test period, during which the temperature did not rise or fall remarkably, and the overall temperature was effectively maintained in a stable state under the combined action of the insulation layer and the insulation power of 540 W. The maximum temperature fluctuation at each point was 2.56°C, which shows that the plan 2 scheme provided effective insulation of the FCT system.
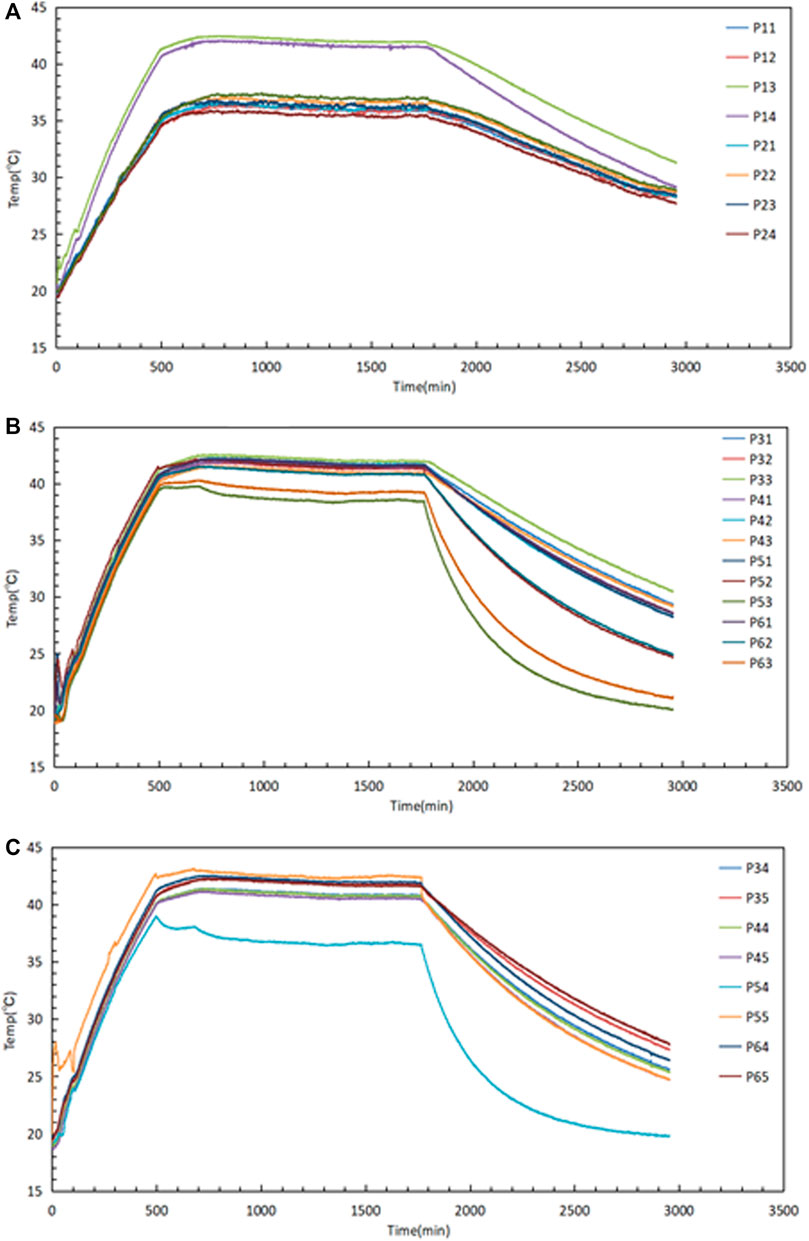
FIGURE 11. Plan 2: Temperature distribution of (A) section A-A, (B) section B-B, and (C) section C-C.
Comparison of plans 1 and 2
As shown in Figures 9B,C and Figures 11B,C, the heating power of plan 1 is 6600 W and that of plan 2 is 3400 W for the temperature field distribution at the same height (section B-B and C-C) inside the FCT. The heating efficiency of plan 2 is comparable to that of plan 1 at the same heating time. Plan 2 achieves the same heating effect as plan 1 with approximately half the heating power, as the temperature distribution from middle to edge is more uniform in the same height range. Plan 2 is preferred from both economic and practical perspectives.
Computational fluid dynamics analysis
To facilitate follow-up research, a corresponding finite element model was established based on plan 2, as shown in Supplementary Material. In view of the symmetry of the structure, only 1/4 models were built for heating analysis. Therefore, the heating power in the model was 850 W, and the holding power was 135 W.
The general finite element software FLUENT was used for analysis, and the properties of each material are summarized in Tables 1, 2. The distribution of the temperature field inside the FCT after heating for 10 h is shown in Supplementary Material. The highest temperature, 41.0°C, was located near the heating source, with a deviation of 4.92% from the experimental results. The lowest temperature, 38.0°C, was located at the top edge, with deviation from the experimental results of 5.73%. The distribution of temperature field was similar to the experimental results.
The variation curve of the average temperature inside the FCT during the heating and holding stages is shown in Supplementary Material. The comparison of computational fluid dynamics (CFD) analysis and the experimental results in Supplementary Material shows that the CFD model can accurately simulate the temperature variation trend. The comparison of results also demonstrates that the CFD model and algorithm can accurately predict the experimental results, indicating suitability for use in subsequent research.
Conclusion
The main research content of this study is the development of a thermal insulation and heating system for a new type of FCT. Drawing lessons from the traditional subsea pipeline temperature control system and considering the characteristics of collapse, folding, and squeezing of the flexible layer in the actual operation process, the heating source was chosen to be arranged on the central rigid structure, which effectively avoids possible damage to the heating source caused by bending fatigue. In the selection of the insulation layer, the hardness of the insulation layer should be controlled so it does not exceed the hardness of the sealing layer to avoid abrasion of the sealing layer during operation while providing adequate thermal conductivity.
In this study, two heat-tracing layout methods were investigated. Plan 1 involved full coverage layout along the center pipe and plan 2 involved a layout within 0.5 m height from the bottom of the center pipe. The test results showed that plan 2 is superior to plan 1 in terms of heating efficiency, heating effect, and thermal insulation control. This study provides a reliable basis for actual engineering applications and serves as an important reference for subsequent research on temperature control systems for related flexible marine structures.
Data availability statement
The original contributions presented in the study are included in the article/Supplementary Material; further inquiries can be directed to the corresponding author.
Author contributions
YL and QL designed and supervised the project and wrote and edited the article. HZ assisted in the analysis and editing. All authors contributed to manuscript revision and read and approved the submitted version.
Funding
This work was supported by “Anhui Province Outstanding Young Talents Support Plan Project” (gxyq2022099). This work was also supported by the Key Research and Development Program of Anhui Province (No. 202104b11020010).
Conflict of interest
QL and HZ were employed by Lianyungang Jingwei Advanced Composite Material Co. Ltd.
The remaining author declares that the research was conducted in the absence of any commercial or financial relationships that could be construed as a potential conflict of interest.
Publisher’s note
All claims expressed in this article are solely those of the authors and do not necessarily represent those of their affiliated organizations, or those of the publisher, the editors, and the reviewers. Any product that may be evaluated in this article, or claim that may be made by its manufacturer, is not guaranteed or endorsed by the publisher.
Supplementary material
The Supplementary Material for this article can be found online at: https://www.frontiersin.org/articles/10.3389/fmats.2022.1047096/full#supplementary-material
References
An, C., and Su, J. (2015). Lumped models for transient thermal analysis of multilayered composite pipeline with active heating. Appl. Therm. Eng. 87, 749–759. doi:10.1016/j.applthermaleng.2015.05.061
Angays, P. “High efficiency heating method for subsea pipelines heating,” in Proceedings of The Industry Applications Society 58th Annual IEEE Petroleum and Chemical Industry Conference (PCIC), Ontario, Canada, September 2011, 19–21. doi:10.1109/PCICon.2011.6085885
Anres, S., Hallot, R., Valdenaire, T., and Macauley, L. “Subsea induction heating technology solves hydrate and wax issues in subsea flowlines,” in Proceedings of The Offshore Technology Conference Brasil, Rio de Janeiro, Brazil, October 2019, 29–31. doi:10.4043/29724-MS
Anres, S. J., Hallot, R., Macauley, L., and Valdenaire, T. “Local heating of subsea flowlines, A way to increase step out distance with conventional thermal insulation,” in Proceedings of The Offshore Technology Conference, Texas, TAC, USA, April 2018, 30–35. doi:10.4043/28987-MS
Ansart, B., Marret, A., Parenteau, T., and Rageot, O. “Technical and economical comparison of subsea active heating technologies,” in Proceedings of The Offshore Technology Conference-Asia, Kuala Lumpur, Malaysia, March 2014, 25–28. doi:10.4043/24711-MS
Bjørvik, T. B. (2015). “Development of induction heating system in a deposit processing subsea cooler,”. Master’s Thesis (Trondheim, Norway: Norwegian University of Science and Technology).
Candelier, C., Durica, S., and Beys, F. “Subsea pipeline electrical heat trace (EHT)–‘Active’ heating–application for a deep water Brown field development,” in Proceedings of The 12th Offshore Mediterranean Conference and Exhibition, Ravenna, Italy, March 2015, 25–27.
González, D., Stanko, M., and Golan, M. (2018). Numerical feasibility study of electric heating strategies for subsea tie-in flowlines using a 1-D mechanistic multiphase flow simulator. Engineering 10 (9), 561–571. doi:10.4236/eng.2018.109040
Jez, R., Ejma-Multanski, J., and Vivet, R. “On the modelling of long heating cables for electrically trace heated pipe-in-pipe ETH-PiP systems,” in Proceedings of The Offshore Technology Conference, Texas, TAC, USA, May 2020, 4–7. doi:10.4043/30650-MS
Lervik, J. K., Iversen, Ø., and Solheim, K. T. “Next generation heating of subsea oil production pipelines,” in Proceedings of The 27th International Ocean and Polar Engineering Conference, California, MA, USA, June 2017, 25–30.
Lervik, J. K., Iversen, Ø., and Solheim, K. T. “Optimizing electrical heating system of subsea oil production pipelines,” in Proceedings of The 28th International Ocean and Polar Engineering Conference, Sapporo, Japan, June 2018, 10–15.
Mehta, P., Huh, C., and Bryant, S. L. “Evaluation of superparamagnetic nanoparticle-based heating for flow assurance in subsea flowlines,” in Proceedings of The International Petroleum Technology Conference, Kuala Lumpur, Malaysia, December 2014, 10–12.
Molnar, C., and Riley, M. “Flow assurance and hydrate prevention methods enabled by medium voltage electric heating technology,” in Proceedings of The Offshore Technology Conference Asia, Kuala Lumpur, Malaysia, March 2016, 22–25. doi:10.4043/26389-MS
Molnar, C., Riley, M., and Trussler, R. “Medium voltage electric heating technology for downhole heating applications and offshore platforms,” in Proceedings of the The Abu Dhabi International Petroleum Exhibition and Conference, Abu Dhabi, UAE, November 2015, 9–12. doi:10.2118/177530-MS
Nysveen, A., Kulbotten, H., Lervik, J. K., Børnes, A. H., Høyer-Hansen, M., and Bremnes, J. J. (2007). Direct electrical heating of subsea pipelines–technology development and operating experience. IEEE Trans. Ind. Appl. 43 (1), 118–129. doi:10.1109/TIA.2006.886425
Park, J. M., Oh, D. W., and Lee, J. (2015). Numerical analysis of thermal mixing in a swirler-embedded line-heater for flow assurance in subsea pipelines. Adv. Mech. Eng. 7 (2), 739089. doi:10.1155/2014/739089
Parsazadeh, M., and Duan, X. “Thermal insulation with latent energy storage for flow assurance in subsea pipelines,” in Proceedings of The Proceedings of the ASME 2015 34th International Conference on Ocean, Offshore and Arctic Engineering, Newfoundland, Canada, May 31–June 5, 2015, 31–35. doi:10.1115/OMAE2015-41285
Pedroso, C. A., Silva, G. R., Rangel, P., and Nunes, K. R. “Subsea systems innovations and the use of state of art subsea technologies help the flow assurance of heavy oil production in ultra–deep waters,” in Proceedings of The Rio Oil & Gas Expo and Conference, Rio de Janeiro, Brazil, September 2020, 21–24. doi:10.48072/2525-7579.rog.2020.165
Roth, R. “Direct electrical heating of flowlines–A guide to uses and benefits,” in Proceedings of The OTC Brasil, Rio de Janeiro, Brazil, October 2011, 4–6. doi:10.4043/22631-MS
Sadafule, S., and Patil, K. D. (2014). Study on effect of insulation design on thermal–hydraulic analysis: An important aspect in subsea pipeline designing. J. Pet. Eng. Technol. 4 (1), 33–45.
Sunday, N., Settar, A., Chetehouna, K., and Gascoin, N. (2021). An overview of flow assurance heat management systems in subsea flowlines. Energies 14 (2), 458. doi:10.3390/en14020458
Verdeil, J., Giraudbit, S., Silcock, D., and Cherkaoui, S. “Combining the most efficient active heating technology with subsea electrical distribution to develop remote resources,” in Proceedings of The Offshore Technology Conference, Texas, TAC, USA, May 2017, 1–4. doi:10.4043/27722-MS
Yakhibbaeva, L. M., and Chaturova, D. I. (2017). Technological heating complex for subsea pipelines based on induction heating system. Электроmехнuческuе u uнформацuонные комплексы и сuсmемы 13 (3), 32–36.
Keywords: flexible thermal insulation system, heating source layout, temperature field distribution, collapsible, constant temperature
Citation: Liu Y, Li Q and Zhu H (2022) Thermal system for a new flexible composite tank. Front. Mater. 9:1047096. doi: 10.3389/fmats.2022.1047096
Received: 17 September 2022; Accepted: 15 November 2022;
Published: 01 December 2022.
Edited by:
Wenliang Li, Jilin Medical University, ChinaReviewed by:
Boyang Liu, Shanghai Maritime University, ChinaJunqi Wang, Xi’an Jiaotong University, China
Copyright © 2022 Liu, Li and Zhu. This is an open-access article distributed under the terms of the Creative Commons Attribution License (CC BY). The use, distribution or reproduction in other forums is permitted, provided the original author(s) and the copyright owner(s) are credited and that the original publication in this journal is cited, in accordance with accepted academic practice. No use, distribution or reproduction is permitted which does not comply with these terms.
*Correspondence: Yuxi Liu, bGl1eXV4aWVtYWlsQDEyNi5jb20=
†These authors have contributed equally to this work and share first authorship