 Júlio Lemos Garcia
 José Luiz de Medeiros
 Ofélia de Queiroz F. Araújo
- Escola de Química, Federal University of Rio de Janeiro, CT, E, Ilha do Fundão, Rio de Janeiro, Brazil
Energy transition is a global transformation driven by greenhouse gas climate change in which fossil power production is replaced by fully renewable counterparts. Currently, the world has accomplished a small fraction of the energy transition. The main reason is that fossil energy sources are still abundant, cost-effective, portable, and easily implementable, while renewable sources are still technologically incipient, costly, cumbersome, portable, intermittent/seasonal, and land-intensive. Because the world cannot suddenly get rid of fossil power production, the compromise is to convert it into sustainable production by attaching carbon abatement processes (anti-carbon packages). Moreover, it is also conducive to migrating from carbon-intensive fossil power production to less carbon-intensive ones. This trend is perceptible as coal-fired plants are being replaced by natural gas combined cycles characterized by maximum thermodynamic yields and minimum carbon emitted per kWh among all fossil analogs. Thus, a conceivable next step of energy transition is to implement natural gas combined cycles with anti-carbon packages. This work compares three anti-carbon packages—post-combustion, oxy-combustion, and pre-combustion—attached to a typical natural gas combined cycle. A differential is the novel marginal abatement cost (MAC) adopted as an economic-environmental performance metric. It is shown that the post-combustion combined cycle requires the minimum investment (596.89 MMUSD) and attains the maximum net value (2,060.68 MMUSD) and minimum MAC (4.58 USD/tCO2), making it the best economic-environmental compromise. The oxy-combustion combined cycle attains the maximum investment (1,095.19 MMUSD) and intermediary MAC (12.09 USD/tCO2) and net value (1,144.21 MMUSD) but offers the best social benefit per environmental harm (PowerExported/CO2Emitted = 51.63 MWh/tCO2). The pre-combustion combined cycle has a minimum net value (339.66 MMUSD) and a maximum MAC (28.17 USD/tCO2) and is likely the worst decarbonized combined cycle according to all metrics.
1 Introduction
Energy transition is a global technological transformation driven by greenhouse gas climate change, in which fossil power production is completely replaced by fully renewable counterparts. Nowadays, it is well recognized that the world has accomplished only a small fraction of the necessary energy transition (Ahmad and Zhang, 2020). The underlying reason is that fossil energy sources are still abundant, affordable, portable, reliable, and easily implementable, while renewable sources are still technologically incipient, costly, cumbersome, portable, intermittent/seasonal, and land-intensive and compete with forest and food-producing lands. Because the world cannot suddenly get rid of fossil power production, a feasible and necessary compromise is to convert ordinary fossil power production into sustainable production by attaching carbon abatement processes or, as denominated here, anti-carbon packages. Sustainable fossil power production still could inject fossil carbon into the biosphere, but the anti-carbon packages capture a good portion of it and eliminate it as geological sequestration (carbon capture and sequestration (CCS)) or to some industrial manufacture of durable commodities using this carbon (carbon capture and utilization (CCU)). Many countries have implemented mechanisms such as carbon pricing, emissions trading systems, and taxation policies that assign a financial cost to carbon emissions, encouraging industries to adopt cleaner practices and invest in low-carbon technologies. In response, CCS and CCU technologies have emerged as critical components in the strategy to develop sustainable fossil power production without compromising the energy transition (Araújo and de Medeiros, 2021).
It is also helpful to implement technology changes that result in replacing carbon-intensive fossil power production with less carbon-intensive forms. This trend is perceptible as ordinary coal-fired plants are gradually being replaced by integrated gasification combined cycle (IGCC) and/or natural gas (NG) combined cycle (NGCC) plants (Ahmad and Zhang, 2020). IGCCs are very capital-intensive and have greater heat intake, while NGCCs are less capital/heat-intensive and attain the highest thermodynamic yields, entailing minimum carbon emitted per kWh among all fossil fuel analogs (Bhattacharya and Datta, 2013). Even so, NGCCs continue to emit considerable amounts of carbon dioxide (CO2), demanding integration into anti-carbon packages. Consequently, a conceivable next step in the energy transition is to encourage the implementation of NGCCs with anti-carbon packages. The marginal abatement cost (MAC) is a widely accepted metric (expressed in USD/tCO2) used to measure the economic-environmental performance of sustainable fossil power production (and also renewable power production) (Lameh et al., 2022).
Regarding the anti-carbon packages for sustainable fossil power production, three kinds of technology exist: (i) post-combustion carbon capture, (ii) oxy-combustion carbon capture, and (iii) pre-combustion carbon capture.
Post-combustion capture is easily integrated into existing power plant facilities, as it is mainly located downstream, where CO2 is removed from flue gas. This separation is typically achieved through either absorption or adsorption, with aqueous ethanolamine absorption being the most widely adopted technology (Goren et al., 2024). Regarding adsorption technologies, several developments exist. Calvo-Muñoz et al. (2016) created post-combustion adsorbents from biomass waste, and Bharath and Rajendran (2024) developed a temperature-swing adsorption (TSA) technology for CO2 removal from NGCC flue gas with steam-assisted adsorbent regeneration. Isogai and Nakagaki (2024) economically assessed an NGCC with post-combustion capture via aqueous monoethanolamine (PCC-MEA) absorption, in which the heat for solvent regeneration shifts to power-to-heat during low electricity demand periods. Cruz et al. (2023) applied PCC-MEA to NGCC or to single-cycle power generation in offshore rigs, and Yadav et al. (2025) applied post-combustion capture to a NGCC flue gas using cold energy from liquefied NG regasification.
In oxy-combustion carbon capture, fossil fuel is burned with oxygen (O2 > 96% mol/mol), resulting in a flue gas composed primarily of CO2 and water vapor. This composition enables straightforward CO2 separation, requiring only water condensation. An air separation unit (ASU) is required to supply the necessary oxygen. ASU technologies comprise cryogenic distillation, pressure-swing adsorption, and membrane permeation. An alternative oxy-combustion approach is the chemical-looping combustion, although this technology is still in development (Goren et al., 2024). Among the available ASU options, cryogenic distillation is the only one commercially established at a high capacity that has been extensively studied. In this context, Brigagão et al. (2019) studied a new cryogenic ASU based on top-vapor recompression distillation with lower power consumption integrated with an oxy-combustion NGCC with CCU. Skorek-Osikowska et al. (2015) presented an economic and thermodynamic comparison between two ASU concepts for oxygen supply to a coal-fired oxy-combustion power plant: conventional cryogenic distillation and a hybrid process combining membrane separation with cryogenic distillation. Tan et al. (2023) studied biomass gasification integrated with oxy-combustion NGCC fed with liquefied NG as a strategy to reduce energy consumption through the utilization of its cold energy. Khallaghi et al. (2019) studied a staged oxy-combustion NGCC to avoid exhaust-gas recirculation (EGR) and used supercritical CO2 as the working fluid of the bottoming cycle.
In pre-combustion capture systems, high-pressure synthesis gas (syngas), containing hydrogen (H2), carbon monoxide (CO), and CO2, is produced from a fossil fuel via steam reforming or steam gasification. Syngas becomes shifted syngas—H2 + CO2—after a water–gas shift (WGS) reaction, and the shifted syngas is decarbonated before power production, in which H2 is burned with air (Malekli et al., 2025). Compared to post-combustion technologies, the high CO2 fugacity in the high-pressure shifted syngas enables easy CO2 absorption, allowing the use of less heat-intensive solvents instead of aqueous MEA (Geweda et al., 2025). In addition to the high thermal loads required in steam reforming or steam gasification, retrofitting ordinary power plants to a pre-combustion configuration entails extra high investment and complexity (Singla et al., 2025). Moreover, the WGS reactors impose some process inefficiency (Thiedemann and Wark, 2025). Several works have explored the context of NGCC with pre-combustion capture. Cobden et al. (2007) studied a sorption-enhanced hydrogen production with hydrotalcite-based materials for high-temperature adsorption of CO2 (≈400 °C). Solares and Wood (2020) developed a scale-up model for pressure-swing adsorption for CO2 removal from shifted syngas. Pruvost et al. (2022) conducted a techno-economic assessment of blue, green, and turquoise pathways for hydrogen production from NG, comprising pre-reforming, steam-methane reforming (SMR), WGS, and pressure-swing adsorption. Oh et al. (2022) studied blue-hydrogen production from NG with a process comprising SMR without WGS afterward, syngas cooling (without heat recovery), and CO2 removal via absorption by aqueous methyl-diethanolamine (MDEA) with piperazine (aqueous MDEA-PZ). Zanetti et al. (2025) studied an offshore floating plant for NG conversion into blue-hydrogen wherein CO2 is monetized as a fluid for enhanced oil recovery (EOR) in offshore oil-gas fields. Membrane separation technologies have also been considered for shifted syngas decarbonation, namely, (i) Belaissaoui and Favre (2018) studied a gas–liquid membrane contactor with Selexol and (ii) Ni et al. (2025) contemplated membrane permeation exploring the leverage of high CO2 fugacity.
Some works compared post-combustion, oxy-combustion, and pre-combustion in the context of NGCC with CCS/CCU. Kanniche et al. (2010) evaluated these three anti-carbon packages for different sorts of power plants, and the results suggest the following best matches: (i) pre-combustion capture with physical-solvent absorption for integrated gasification combined cycle; (ii) oxy-combustion for coal-fired power plants; (iii) post-combustion capture via aqueous MEA absorption for NGCC. Kazemi et al. (2022) performed a techno-economic assessment of 19 alternative NGCC configurations with post-combustion, oxy-combustion, and pre-combustion. Kazemi et al. (2023) performed economic optimization and comparative environmental assessment of 11 NGCC configurations.
Table 1 summarizes the literature reviewed on anti-carbon packages for sustainable fossil power production.

Table 1. Comparison of literature on anti-carbon packages for sustainable fossil power production.
An inherent characteristic of all studied NGCC power plants with anti-carbon packages discussed above has to do with the fact that none of them considered the evaluation of economic-environmental performance via the marginal abatement cost (MAC). MAC is currently considered a better and concise metric for the evaluation of sustainable power production processes. This work compares the three kinds of anti-carbon packages—post-combustion, oxy-combustion, and pre-combustion—attached to typical NGCC plants using the novel MAC as a metric (in addition to other classical metrics like the net present value and ratios, such as MWhExported/tCO2−Capt). It is shown that the three anti-carbon packages have typical signatures (in terms of MAC and other metrics) when coupled to NGCC power plants.
2 Materials and methods
A typical NGCC power plant was chosen as the base case and designed first. Then, its post-combustion, pre-combustion, and oxy-combustion variants were formulated, simulated, and designed using the Aspen HYSYS simulator. All the necessary pertinent information and technical resources (e.g., flowsheets) are presented throughout this section. Other methods for economic analysis and MAC analysis are also discussed.
2.1 Process description
The four analyzed processes: base case, post-combustion variant, pre-combustion variant, and oxy-combustion variant, are described through a set of six subsystems that are combined to form them. The elemental subsystems are (i) a gas turbine block (GT); (ii) a Rankine cycle block (RANK); (iii) post-combustion capture via an aqueous MEA absorption block (PCC-MEA); (iv) a CO2 compression train and dehydration with a triethylene-glycol block (CC-TEG); (v) a cryogenic air separation unit block (ASU); and (vi) steam reforming and WGS for a H2 production block (HU). Figures 1–3 describe the flowsheets of the six elemental subsystems. Certain subsystems, such as GT and RANK, are defined as super-structures (i.e., with extra streams) to allow all respective possible operational modes. The six subsystems are described in Sections 2.1.1–2.1.6. The four analyzed processes are represented as block diagrams in Figures 4, 5 and are discussed in Sections 2.1.7, 2.1.8. The four processes include a cooling-water (CW) tower, which is omitted in the respective diagrams.
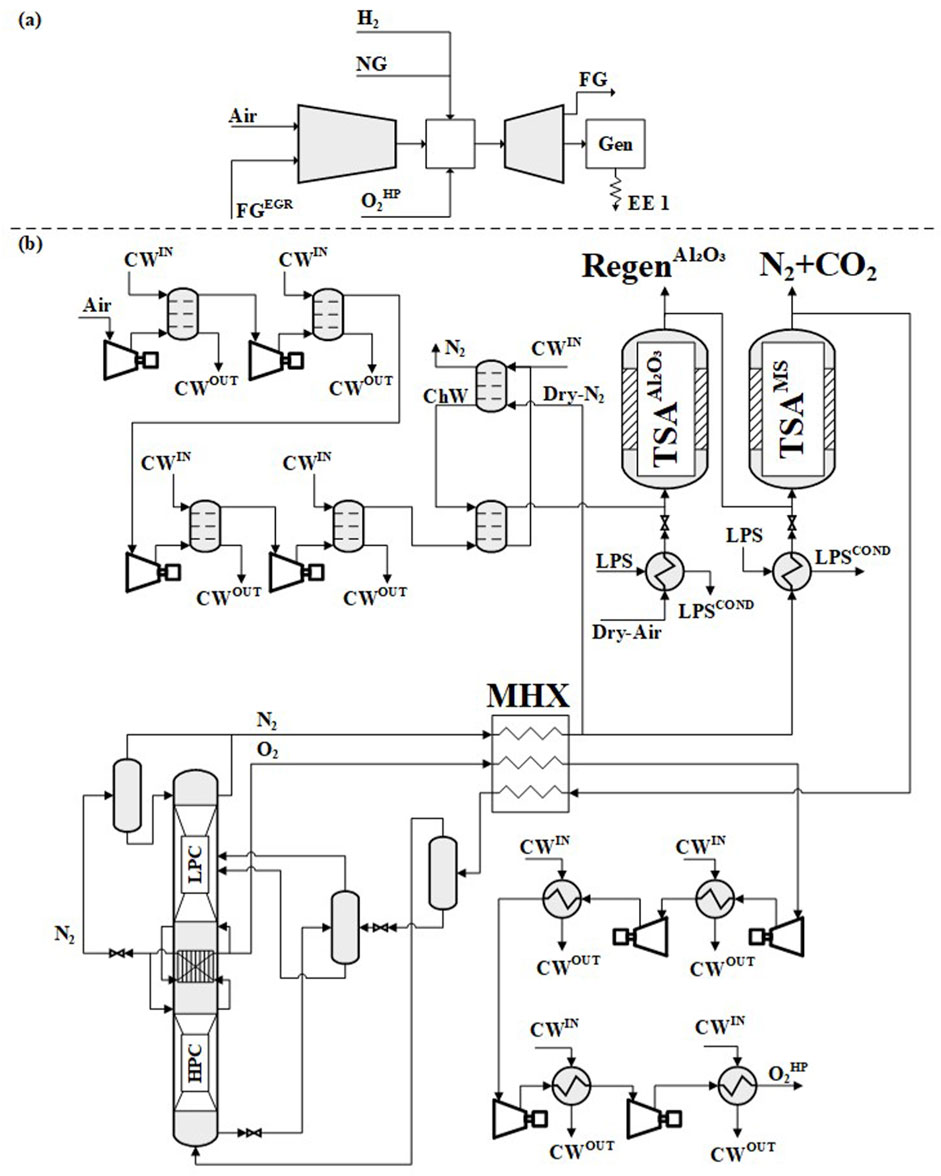
Figure 1. Subsystems: (a) gas turbine (GT) and (b) air separation unit (ASU) (GEN = generator; COND = condensate; EE = electricity; FG = flue gas; HPC = high-pressure column; LPC = low-pressure column; LPS = low-pressure steam; MHX = main heat exchanger).

Figure 2. Subsystems: (a) post-combustion capture with aqueous MEA (PCC-MEA) and (b) CO2 compression and dehydration with TEG (CC-TEG) (FG = flue gas; LPS = low-pressure steam; MU = make-up, COND = condensate; VAP = vapor; LP = low pressure; HP = high pressure).

Figure 3. Subsystems: (a) steam reforming and WGS for H2 production (HU) and (b) Rankine cycle (RANK) (ATM = atmospheric; COND = condensate; DCC = direct-contact column; FG = flue gas; HRSG = heat-recovery steam generator; LPS = low-pressure steam; HPS = high-pressure steam; ST = steam turbine; LT = low-T, HT = high-T; PRR = pre-reforming reactor; SMR = steam-methane reforming).

Figure 4. NGCC without CO2 capture (FG = flue gas; ATM = atmospheric).

Figure 5. NGCC block diagrams with anti-carbon packages: (a) post-combustion NGCC, (b) oxy-combustion NGCC, (c) pre-combustion NGCC (FG = flue gas, ATM = atmospheric, COND = condensate, HP = high pressure, MU = make-up).
2.1.1 Gas turbine block (GT)
A GT (Figure 1a) consists of an axial adiabatic air (and/or flue gas) compressor, an adiabatic combustor, and an axial adiabatic expander. To simulate GT operation, compressor and expander adiabatic efficiencies were previously calibrated to match the performance data of the selected commercial gas turbine. Ambient air and/or flue gas recirculation (from RANK) feed the compressor to enable high-pressure combustion of fuel gas (NG or H2) with air (or oxygen). Air excess and/or flue gas recirculation flow rates are regulated to maintain the maximum allowable combustion temperature. However, increasing the total air (or flue gas) inlet flow rate increases compressor shaft work. High-pressure fuel gas (NG or H2) directly feeds the combustor, and the resulting high-temperature, high-pressure flue gas expands through the axial expander. The compressor, expander, and generator share a single shaft, such that the expander drives the compressor and the electricity generator. The flue gas from the expander is nearly atmospheric but still has significant enthalpy at high temperature.
2.1.2 Rankine cycle block (RANK)
In the RANK (Figure 3b), the heat-recovery steam generator (HRSG) transfers enthalpic content of hot (nearly atmospheric) flue gas (FGATM for oxy-combustion, post-combustion, and pre-combustion, and FGH2 also for pre-combustion) to produce high-pressure steam (HPS) from high-pressure condensate and low-pressure steam (LPS) from low-pressure condensate (LPS production is disabled in the base case). HPS expands through a steam turbine that drives another generator, complementing the electricity generated in the GT. The steam turbine exhaust condenses in the Rankine cycle condenser and is pumped back to the HRSG, closing the Rankine cycle. The final flue gas (FGATM) is further cooled in a direct-contact column (DCC), and a part of it becomes the exhaust-gas recirculation (EGR) to the GT in the post-combustion and oxy-combustion processes. The final flue gas FGH2 only exists in the pre-combustion NGCC, and it is cooled in a shell-and-tube exchanger to recover demineralized water condensate to feed the hydrogen unit (HU) as process water for steam generation (used in SMR).
Because implementation of all anti-carbon packages requires LPS consumption, RANK also produces LPS in the HRSG, reducing HPS production and, consequently, electricity generation in the steam turbine. In other words, decarbonization implementation entails reducing NGCC net exported electricity (this loss is part of the so-called capture penalty).
2.1.3 Post-combustion capture via aqueous MEA absorption block (PCC-MEA)
In PCC-MEA (Figure 2a), the separation of CO2 from flue gas, composed of CO2, N2, argon, O2, and water, is achieved through chemical absorption with aqueous MEA. Flue gas feeds the absorption column at atmospheric pressure and is uniformly distributed among the bottom stages to enhance separation efficiency. Lean aqueous MEA is fed at the top and absorbs CO2 via reversible exothermic reactions. The absorber bottom product is CO2-rich aqueous MEA, while the water-saturated top vapor contains decarbonized flue gas, water vapor, and traces of MEA. To minimize solvent losses, the top vapor is cooled in an external vessel, where more than 99% of the MEA is condensed and recovered. CO2-rich aqueous MEA is pre-heated with hot lean aqueous MEA and feeds the regeneration stripper column, wherein CO2 is stripped from the solvent. Additional feeds to the stripper include carbonated waters fed at Stage#1 and a water-saturated CO2 stream injected in the stripper reboiler, namely, (i) aqueous condensates from the CO2 compression train; (ii) aqueous distillate from the TEG dehydration unit; and (iii) water-saturated CO2 vapor from the TEG unit. These carbonated waters reduce condenser heat duty, water make-up, and CO2 fugitive emissions, while the water-saturated CO2 feed also reduces water make-up and CO2 fugitive emissions and lowers the reboiler temperature, helping prevent MEA degradation. The lean aqueous MEA is cooled and pumped back to the absorber along with recovered liquid and make-up solvent, maintaining solvent composition for continuous operation.
2.1.4 Carbon dioxide compression and dehydration block (CC-TEG)
Captured CO2 is water saturated and must be dehydrated after compression to prevent CO2 hydrate formation in the pipeline, a phenomenon favored by high pressures and temperatures below 10 °C. CC-TEG (Figure 2b) executes initial CO2 compression and dehydration via TEG absorption at ≈65 bar. Dry CO2 is compressed once more and pumped after condensation for pipeline dispatch. Figure 2b (West) depicts four compression stages followed by intercoolers and knock-out vessels for condensed water removal. Train power consumption is minimized, setting equal stage compression ratios (≈3). Condensed waters from knock-out vessels contain CO2 and return to the PCC-MEA stripper to reduce fugitive emissions and water make-up. After the 4-stage compression train, CO2 is fed at the bottom of the TEG absorber, while lean TEG is fed at the top. High-pressure CO2 dehydration has some advantages: (i) increases TEG-water affinity and equilibrium water loading; (ii) reduces column diameter by increased CO2 density; (iii) reduces water absorption load due to partial water condensation in the compression train intercoolers; and (iv) reduces TEG evaporative losses into dry CO2. However, the dehydration pressure should not surpass P ≈ 70 bar due to CO2 supercritical effects that stabilize water vapor, hindering dehydration. A small fraction (≈2%) of dry CO2 is deviated, expanded, and injected into the TEG stripper reboiler as stripping gas. This enhances water stripping, reducing the reboiler temperature (limited to T = 140 °C to avoid TEG degradation). Simple measures can extend TEG durability up to three or more years (Zanetti et al., 2025), such as (i) injecting dry stripping gas (no water and no oxygen allowed) to keep the reboiler temperature below T = 140 °C; (ii) avoiding air entrance; and (iii) adding an oxidant scavenger (i.e., 0.1% w/w NaHSO3). Both vapor and aqueous liquid distillates from the TEG stripper recycle to the PCC-MEA stripper to minimize CO2 fugitive emissions and water losses. In the present case, simulation shows that CC-TEG recovers approximately 15.7 t/h of water and avoids 10.2 t/h CO2 fugitive emissions. These measures improve the economic and environmental sustainability of CC-TEG. Dry CO2 is compressed again from P ≈ 65 bar to P ≈ 100 bar and cooled in the intercooler to 40 °C. At P ≈ 100 bar and T = 40 °C, CO2 condenses as a dense supercritical fluid. Dense CO2 is pumped to P = 250 bar via a supercritical-fluid pump, cools to T = 40 °C, and is then dispatched to the pipeline. High pressure and low temperature increase the fluid density, reducing the pipeline diameter and/or fluid velocity, and lowering the head loss per kilometer.
2.1.5 Cryogenic air separation unit (ASU)
The ASU subsystem (Figure 1B) adopts the cryogenic double-column Linde process for air fractionation and is designed to supply high-purity oxygen to NG oxy-combustion. High-purity nitrogen (N2) is also produced. The air feed undergoes four compression stages in adiabatic centrifugal compressors. Air from each stage is cooled in an interstage DCC with CW, which also partially dehydrates air due to the increasing pressure along the train. A final cooling step uses chilled water (ChW) in another DCC, further reducing air temperature and its humidity prior to its absolute dehydration via TSA with an activated alumina bed. ChW is produced via evaporative DCC, where dry N2 at T ≈ 15 °C from the cold box contacts CW (T = 35 °C), promoting water evaporation and chilling CW to ChW. Before entering the cold box, the air must be absolutely dehydrated and decarbonated to prevent ice and dry-ice blockages in the cryogenic equipment. Water and CO2 are, respectively, removed through TSA with an activated alumina bed and another TSA with a 13X zeolite bed. The alumina bed is regenerated with a fraction of dry air heated to 200 °C, while the zeolite bed is regenerated with the remaining dry N2 from the cold box heated to T = 120 °C. After dehydration and decarbonation, the air is sufficiently purified for cold box conditions. At the cold box entrance, purified air is cooled in the main heat exchanger (MHX) with cryogenic liquid O2 and N2 vapor leaving the cold box. In the MHX, air attains cryogenic temperatures and partially condenses, wherein its liquid and vapor phases are separated in a cryogenic high-pressure flash. The nitrogen-rich vapor feeds the bottom of the high-pressure column (HPC), while the oxygen-rich liquid expands and feeds the low-pressure column (LPC). The pressure difference between the HPC and the LPC must guarantee that the condensing temperature of N2 at the top of the HPC remains higher than the boiling temperature of oxygen at the bottom of the LPC. Oxygen-rich liquid is collected at the bottom of the LPC, while a nitrogen-rich vapor is a product at the top of the LPC. These products leave the cold box through the MHX. Outside the cold box, the gaseous O2 product passes through a 4-stage intercooled compressor train to reach GT combustor pressure (Figure 1a). Direct injection of O2 into the GT combustor prevents risks of combustion/explosion in the GT axial compressor of the oxy-combustion plant due to potential contact with residual hydrocarbons in the EGR fluid.
2.1.6 Hydrogen unit (HU)
The HU subsystem (Figure 3a) is fed with NG divided into two sub-feeds: (i) 55% as a fuel gas to heat steam-methane reforming (SMR); (ii) 45% as a reactant for the SMR reaction (P = 28.35 bar). Fuel gas depressurizes to P = 1.693 bar, mixes with air (50% excess), and is burned in SMR combustors. Hot flue gas (FGATM) goes to RANK after releasing heat at T ≈ 975 °C in the HRSG (Figure 3a) for (i) NG pre-heating to T = 390 °C as SMR reactant and (ii) superheated steam generation (T = 500 °C).
In the SMR section, NG and steam are mixed (molH2O/molC = 3) with some shifted syngas to adjust molH2/molC = 0.5 to avoid coke formation in pre-reforming. Pre-reforming converts C2+ hydrocarbons into syngas (H2, CO, and CO2) via Equations 1–3 to avoid coke formation in SMR (Zanetti et al., 2025). Pre-reforming effluent is pre-heated to 540 °C with SMR syngas and feeds SMR for methane conversion into syngas via Equations 3–5 (Zanetti et al., 2025).
Several heat integrations are implemented because process water needs to be pre-heated before it is fed to the HRSG for steam generation, and hot syngas must cool; that is, (i) before and after the high-temperature WGS reactor (WGS-HT); (ii) after the low-temperature WGS reactor (WGS-LT). Hot syngas (T > 700 °C) from the SMR cools to 340 °C and feeds the WGS-HT, whose outlet-shifted syngas cools to 242 °C and feeds the WGS-LT. WGS-LT-shifted syngas cools to 151 °C and cools again to 40 °C with CW, and a flash separates process water from shifted syngas. Approximately 26.4% of the shifted syngas recycles to pre-reforming, while the rest is decarbonized with aqueous MDEA-PZ. The flash process water mixes with process water from the RANK and recycles to the HRSG for SMR steam generation.
The kinetic models for pre-reforming, SMR, and WGS reactors are based on Zanetti et al. (2025) and are discussed in Supplementary Appendix A. These models were installed in HYSYS for HU simulation and design.
Shifted syngas (40.0 °C, 19.5 bar, ≈65% mol H2, ≈30% mol CO2) is fed at the bottom of the 10-stage absorber with aqueous MDEA-PZ (MDEA = 40% w/w, PZ = 5% w/w). Decarbonized H2 is obtained at the top and sent to the GT. CO2-rich aqueous MDEA-PZ is pre-heated, then depressurized, and feeds Stage #5 of the low-pressure stripper for solvent regeneration. The stripper operates with a total reflux condenser at 40 °C, and its reboiler is heated with LPS. Lean solvent leaves the reboiler at ≈100 °C, is cooled first with rich solvent, then with CW, receives make-up, and is finally pumped back to the absorber (da Cunha et al., 2023).
2.1.7 Base case
The base case is a typical NGCC power plant without carbon capture, depicted in Figure 4 as a block diagram using the subsystems GT (Figure 1a) and RANK (Figure 3b). Table 2 shows the base case operational assumptions.

Table 2. Simulation and design assumptions.
2.1.8 NGCC with anti-carbon packages
Figure 5 depicts block diagrams for the three NGCCs with anti-carbon packages studied in this work. The blocks used in Figure 5 correspond to the subsystems defined in Figures 1–3, namely, (i) post-combustion NGCC using blocks GT, RANK, PCC-MEA, and CC-TEG (Figure 5a); (ii) oxy-combustion NGCC with blocks ASU, GT, RANK, and CC-TEG (Figure 5b); and (iii) pre-combustion NGCC using blocks HU, GT, RANK, PCC-MEA, and CC-TEG (Figure 5c). Table 2 shows the corresponding operational assumptions.
2.1.9 Operational and design assumptions
Table 2 depicts the simulation and design assumptions used in this work.
2.2 Preliminary economic analysis of the process
Preliminary economic analysis of the process uses the method of Turton et al. (2018). Turton et al. (2018) emphasize that this analysis is strictly preliminary in the sense that error magnitudes can be as high as ±40%. Nevertheless, it can be very useful for comparing process alternatives as well as for eliminating very bad ones from further consideration. Table 3 shows economic assumptions for the preliminary economic analysis of the process.
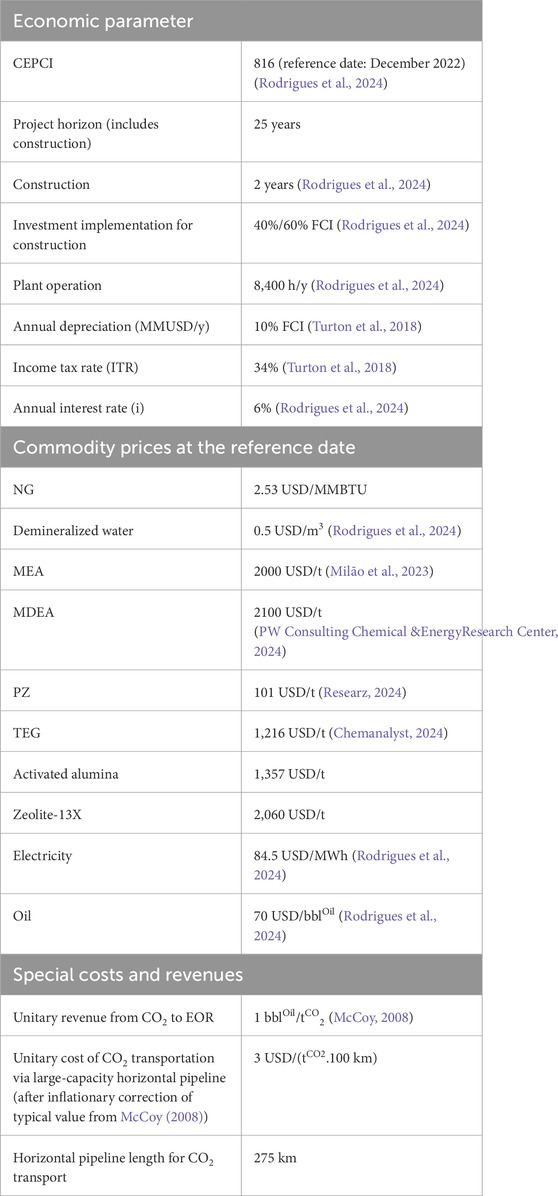
Table 3. Economic assumptions for the preliminary economic analysis of the process.
After defining the reference date of the analysis, the chemical engineering plant cost index (CEPCI) must be found in the literature for correcting equipment prices to the reference date, taking into account inflationary market factors. The bare module cost CBM(MMUSD) refers to equipment cost at process conditions and is estimated from correlations by Turton et al. (2018) using the bare module cost at the reference conditions CoBM (MMUSD), with correlations from Turton et al. (2018). Bare module costs out of the correlation range can be estimated via Equation 6 using limit values, where CF represents a characteristic capacity factor (e.g., power (kW) for machines, area (m2) for heat exchangers, etc.). The grassroots equipment cost CGR (MMUSD) in Equation 7 refers to installed equipment at process conditions in a new plant. The fixed capital investment FCI (MMUSD) of a new plant is given by Equation 8, where NEQ is the number of equipment items. The number of operators (NOL) working 4.5 shifts per week is estimated by Equation 9 with NEQ. The cost of labor COL (MMUSD/y) is calculated using Equation 10 with the operator cost OpCOST (MMUSD/y). The cost of manufacturing COM (MMUSD/y) is estimated by Equation 11 using FCI (MMUSD), the cost of utilities CUT (MMUSD/y), the cost of raw materials CRM (MMUSD/y), and the cost of CO2 transportation CCT (MMUSD/y). Gross annual profit GAP (MMUSD/y), or profit before taxes, is calculated using Equation 12 with COM (MMUSD/y) and revenues REV (MMUSD/y). Annual profit AP (MMUSD/y) is calculated with Equation 13 using GAP (MMUSD/y), depreciation DEPR (MMUSD/y), and the income tax rate ITR(%). Finally, the net present value NPV (MMUSD) is obtained via Equation 14 using the annual interest rate i (%), the project horizon NH (years), and the annual profit of the kth year APk (MMUSD/y). Equation 14 assumes the investment (FCI) is implemented in the first two project years at 40% and 60%, respectively, and production only exists after the second year (APk = 0 for k < 3). In addition, investment expenses are made at the beginning of the year, while revenues are consolidated at the end of the year.
Bare module costs of special equipment and blocks that do not exist in the correlations of Turton et al. (2018) were found in the literature as follows: (i) the CBM of a complete CW tower system
2.3 Marginal abatement cost for CCHU/CCS technologies
The marginal abatement cost or MAC (USD/tCO2) is the increment of the COM (MMUSD/y) (Equation 11) of a process to capture an additional CO2 ton per year (Huang et al., 2016). The economic-environmental comparison of power production technologies with CCU can be implemented through MAC (Eory et al., 2018).
As a marginal cost, MAC is the derivative shown in Equation 18. This equation can be approximated via finite differences in Equation 19. Because extra revenues normally arise with CCU, MAC is generalized in Equation 20 using the GAP (MMUSD/y) from Equation 12. Consequently, negative MAC values can occur and mean that sufficient CCU gains appeared, afforded CO2 abatement, and even generated profits.
Now, because money value is time-dependent and because a process normally experience changes in REV, COM, and CCUCapacity along the project horizon (NH or N, years), it is better to redefine MAC for the entire project campaign in terms of the accumulated discounted GAP, or AGAP (MMUSD), using the interest rate i (%) over N years, as shown in Equations 21–23.
3 Results and discussion
The technical, environmental, economic, and MAC results are discussed and compared with literature analogs.
3.1 Simulation results
The four studied NGCC—base case NGCC, post-combustion NGCC, oxy-combustion NGCC, and pre-combustion NGCC—were simulated at a steady state and solved in HYSYS 14. Certain critical and representative operations of post-combustion NGCC, oxy-combustion NGCC, and pre-combustion NGCC were selected in Figure 6 for a graphic demonstration of the correct implementation of flowsheets (Figures 1–5) and technical assumptions (Table 2). In this regard, Figure 6a depicts the thermal composite curves in the HRSG of subsystem RANK in the post-combustion NGCC; Figure 6b depicts the thermal composite curves in the heat exchanger for thermal integration of LPC/HPC distillation columns of subsystem ASU in the oxy-combustion NGCC; Figure 6c depicts H2, CO, CO2, H2O, and CH4 mole fraction profiles along the steam reforming (SMR) reactor of subsystem HU in the pre-combustion NGCC; and Figure 6d depicts temperature profiles of the reforming stream and hot flue gas stream along the same SMR reactor of HU in the pre-combustion NGCC. All variables behave as expected vis-à-vis the technical assumptions (Table 2).

Figure 6. Profiles in the critical operations of decarbonized NGCCs: (a) thermal composite curves in the HRSG of the RANK (post-combustion NGCC); (b) thermal composite curves along the LPC/HPC integration exchanger of the ASU (oxy-combustion NGCC); (c) composition profiles vs. axial position along the SMR reactor of the HU (pre-combustion NGCC); (d) temperature profiles of the reforming stream and flue gas stream along the SMR reactor of the HU (pre-combustion NGCC).
3.2 Technical and environmental results
Table 4 presents the technical and environmental results of NGCC configurations. An environmental impact is water consumption (process water make-up plus CW make-up). It is seen that pre-combustion NGCC has the largest CW circulation due to high CW consumption in: (i) shifted syngas decarbonization with aqueous MDEA-PZ, (ii) PCC-MEA decarbonization of flue gas from SMR burners, (iii) cooling after WGS-LT, and (iv) CO2 multi-stage intercooled compression. Oxy-combustion NGCC CW consumption comes second due to the high cooling demand of its massive intercooled air compression train and its intercooled CO2 compression train. Meanwhile, post-combustion NGCC demands less cooling in its intercooled CO2 compression train and PCC-MEA condensers and coolers. The pre-combustion NGCC, with its highest CW consumption, naturally entails the highest CW make-up, that is, the worst water-intensity environmental result. The pre-combustion NGCC also comes second as a CO2 emitter among decarbonized NGCCs, while the post-combustion NGCC is the greatest emitter among the decarbonized NGCCs. The oxy-combustion NGCC has the lowest CO2 emission (lowest carbon intensity).

Table 4. Technical and environmental results of the NGCC configurations.
The oxy-combustion NGCC also presents the lowest LPS consumption, despite its highest power consumption due to its massive air compression train in the ASU. In contrast, both the post-combustion NGCC and the pre-combustion NGCC require approximately 50% less power consumption. However, high LPS consumption is required for solvent regeneration in the CO2 strippers in the decarbonation steps, though a little less is needed in the pre-combustion NGCC, as aqueous MDEA-PZ demands a lower heat ratio for regeneration relative to aqueous MEA.
An evident advantage of the oxy-combustion NGCC is its near-zero CO2 emission, as NG combustion is performed with pure oxygen, creating a CO2+H2O flue gas from which CO2 is easily captured with ≈100% efficiency. In contrast, post-combustion NGCC and pre-combustion NGCC require flue gas decarbonization in PCC-MEA. wherein CO2 capture efficiency rarely exceeds 90%, before atmospheric release. Flue gas decarbonization in pre-combustion NGCC is even more difficult than in the post-combustion NGCC counterpart because the flue gas flow rate in the latter is lower while the CO2 content is higher, due to utilization of EGR, which reduces air intake to a stoichiometric flow rate, while the PCC-MEA in the pre-combustion NGCC does not operate with EGR, entailing a lower CO2 content in the flue gas simultaneous with the high flow rate.
Not surprisingly, the largest CO2-to-EOR comes from the oxy-combustion NGCC, a consequence of its highest CO2 capture efficiency ≈100%. Meanwhile, the post-combustion NGCC has the lowest CO2-to-EOR, as the PCC-MEA operates with a CO2 capture efficiency ≈90%. Shifted syngas decarbonization with aqueous MDEA-PZ in the pre-combustion NGCC has a capture efficiency ≈95%.
The post-combustion NGCC has the highest gas turbine power, as the oxy-combustion NGCC burns NG with O2, generating CO2 + H2O, without nitrogen. Because CO2 and H2O have greater heat capacities than N2, the oxy-combustion flame temperature and flue gas flow rate are both lower, entailing a lower Brayton cycle thermodynamic yield. The pre-combustion NGCC has the lowest gas turbine power because 55% of NG is diverted to heat the SMR reactors, while only 45% of NG is converted into H2 for power production.
The oxy-combustion NGCC has the largest team-turbine power due to its lowest LPS demand, entailing that its Rankine cycle (RANK) operates with the highest HPS flow rate. As both the pre-combustion NGCC and the post-combustion NGCC have large LPS demands, the oxy-combustion NGCC combined-cycle power (gross power) is the highest. However, the oxy-combustion NGCC also has the highest power consumption (for ASU air compression), entailing that the post-combustion NGCC has the highest net power. The pre-combustion NGCC power performance is the worst among the CCUS-NGCCs. These efficiency differences are also perceived in terms of electricity capture penalty (MW) and capture penalty (MWh/tCO2), where the former represents net power loss after decarbonization, and the latter is the ratio between the electricity capture penalty (MW) and the CO2-to-EOR (tCO2/h) ratio. Table 4 depicts capture penalties for the post-combustion NGCC, oxy-combustion NGCC, and pre-combustion NGCC, which are, respectively, 0.574 MWh/tCO2, 0.546 MWh/tCO2, and 1.056 MWh/tCO2. The lowest capture penalty of the oxy-combustion NGCC reflects its greatest power generation and greatest CO2-to-EOR among CCUS-NGCCs.
3.3 Economic and MAC results
Table 5 presents the economic and MAC results. All NGCCs with anti-carbon packages have remarkably larger FCI and lower electricity revenues than the base case, so that the environmental benefit should be large enough to compensate for greater investments, higher costs, and revenue losses.
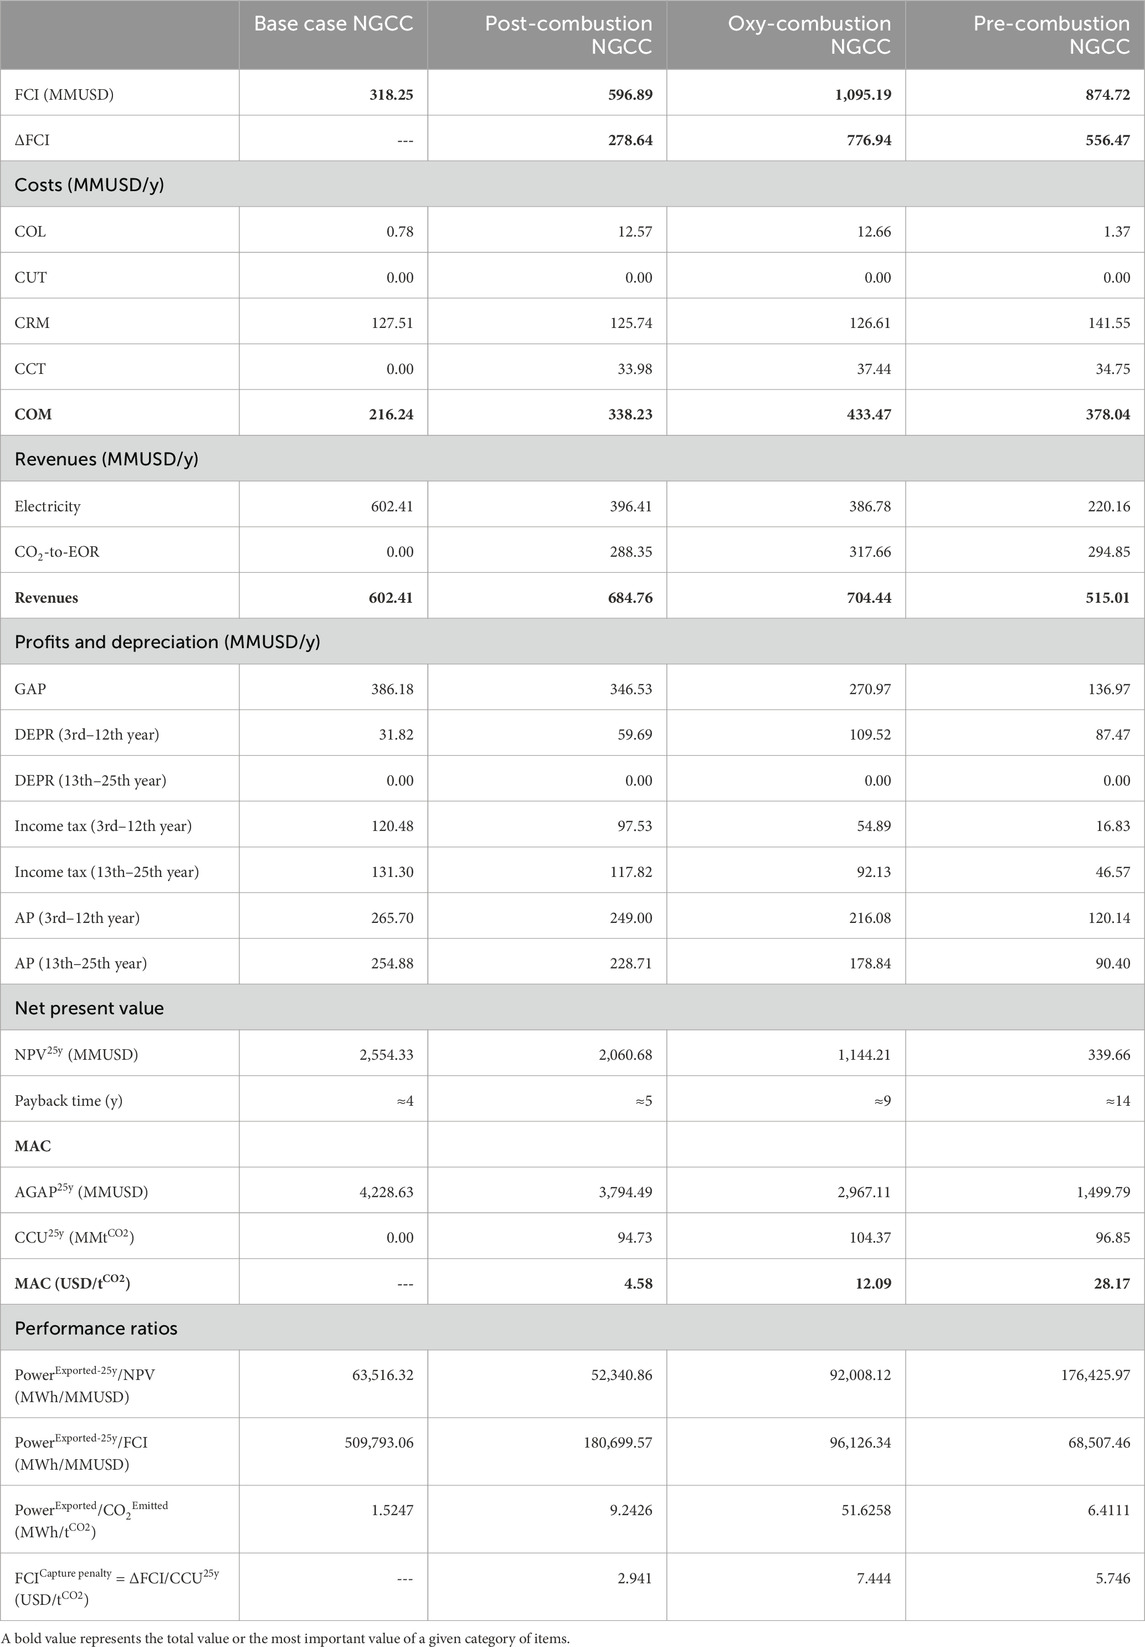
Table 5. Economic and MAC results for NGCC configurations.
As expected, the post-combustion NGCC requires the lowest FCI. Although the high investment of pre-combustion NGCC, the highest FCI comes from the oxy-combustion NGCC, as cryogenic ASU equipment, which is made of titanium and aluminum alloys, is expensive. The oxy-combustion NGCC presents the highest COM due to the highest FCI, in accordance with Equation 11, as the other contributing costs of COM have similar magnitudes.
CCT and CO2 monetization revenues depend on the value of CO2-to-EOR, which attains the highest value in the oxy-combustion NGCC, while the post-combustion NGCC has the lowest. In addition, the post-combustion NGCC presents the highest electricity revenues, which are remarkably lower (≈45% lower) in the pre-combustion NGCC. The largest total revenues come from the oxy-combustion NGCC, thanks to its highest CO2 capture, while the pre-combustion NGCC has the lowest total revenues.
Considering CO2 monetization, the three NGCCs with anti-carbon packages are profitable with positive NPV25y and acceptable payback periods. Among the NGCCs with anti-carbon packages, the post-combustion NGCC attains the highest NPV25y, while the pre-combustion NGCC attains the lowest.
The MACs of the CCU alternatives were calculated for comparisons using the AGAP25y, the 25 years accumulated discounted GAP, for the base case and all NGCCs with anti-carbon packages, and CCU25y, which is the total CO2 captured during project lifetime. The pre-combustion NGCC attained the highest MAC; that is, it has the worst economic performance among all NGCCs with anti-carbon packages, so that carbon capture implementation on the base case NGCC attained the highest unitary cost or the lowest AGAP25y. The post-combustion NGCC attained the lowest MAC because its AGAP25y showed a lesser reduction from the base case AGAP25y compared to the oxy-combustion NGCC counterparts, whose large decrease of AGAP25y is a symptom of their high COM (and high FCI). Figure 7 presents the NPV vs. project lifetime for the base case NGCC and all NGCCs with anti-carbon packages. The payback times correspond to the respective times for zero NPV. As expected, the pre-combustion NGCC developed the lowest NPV25y in spite of the highest FCI of the oxy-combustion NGCC, which could recover a higher NPV25y due to its highest CO2-to-EOR revenues.

Figure 7. NPV vs. project lifetime for NGCC configurations.
The performance ratios (Table 5) are useful to measure performance disconnected from scale. In this sense, the base case NGCC evidently has the best PowerExported-25y/FCI because it simultaneously has the lowest investment and the highest power exported, while the three decarbonized NGCCs must pay for their capture penalties. The ratio PowerExported-25y/NPV has an inverted sense because it ranks NGCCs from the highest NPV to the lowest (i.e., the one with the worst economic return) for similar power exports. It is not surprising to see the leadership of the pre-combustion NGCC according to this indicator. The fact that the base case is located ahead of the post-combustion NGCC, which is theoretically the best NGCC according to this metric, has to do with its much greater power export than all three CCU NGCCs. However, the true performance discriminator among these performance ratios undoubtedly is PowerExported/CO2Emitted (MWh/tCO2), which reveals how much social benefit (electricity) per unit of environmental harm (carbon emission) is being provided. It is amazing to see how the oxy-combustion NGCC is more efficient than the other NGCCs according to this metric. Its PowerExported/CO2Emitted is, respectively, approximately 5.5× and 8× the counterparts of post-combustion NGCC and pre-combustion NGCC (and 34× the base case NGCC counterpart). Consequently, the oxy-combustion NGCC clearly has the greatest sustainability among the NGCCs with anti-carbon packages despite its second place in water intensity.
3.4 Comparisons with literature
The results obtained here were compared with techno-environmental-economic data from decarbonized NGCC available in the literature. In the cases where MAC evaluations are missing, the respective MAC values were indirectly calculated using other kinds of information available in the same source.
Isogai and Nakagaki (2024) studied a post-combustion NGCC, while Manzolini et al. (2013) assessed both post-combustion and pre-combustion NGCCs. In both studies, an NGCC without carbon capture was presented and was used as the base case for calculating MACs. Table 6 presents these results. In addition to MAC, FCI and NPV were also compared. For the sake of normalizing the data and to eliminate the influence of scale differences, some performance ratios were also compared. Isogai and Nakagaki (2024) incorporated a carbon tax in their analysis, which imposes an additional cost on the base case NGCC. As a result, the decarbonized NGCC yields a higher gross annual profit, which is reflected in the calculated MAC, yielding a negative value. Their work considers only a retrofit scenario, focusing exclusively on the investment related to the capture facility. However, for consistency and comparability, the present comparison took into consideration the full FCI of their process in the analysis.

Table 6. Comparison of decarbonized NGCCs with literature.
Manzolini et al. (2013) did not specify the electricity price, as their objective was to determine the break-even electricity price; that is, the price at which electricity must be sold to achieve zero NPV over the project lifetime. To align their results with the present methodology, the same electricity price defined in Table 3 was applied. A consequence of this choice was that their decarbonized NGCC plants did not achieve the break-even point; that is, negative NPV resulted. Another observation regarding Manzolini et al. (2013) is that their pre-combustion NGCC was reported to achieve a power yield—the so-called LHV efficiency—higher than their post-combustion NGCC counterpart, which is a somewhat atypical result. Consequently, the MAC values do not vary significantly between their NGCC configurations, yet they remain relatively high, particularly for the post-combustion NGCC, due to the absence of carbon utilization revenues. Another aspect of Manzolini et al. (2013) is that they did not inform the CO2 emission associated with their decarbonized NGCCs. This information is critical for the complete evaluation of the sustainability performance of decarbonized plants.
Table 6 confirms that the oxy-combustion NGCC achieves the highest power exported per unit of CO2 emitted, reflecting its near-zero emission profile. This comes at the cost of higher FCI and FCICapture penalty (Table 5), which limit its economic attractiveness despite the environmental benefit. However, it is important to register that oxy-combustion NGCCs are the most sustainable fossil power production systems as they maximize social benefit (electricity) per unit of climatic harm (fossil carbon emission).
Points on the comparison of performance ratios (Table 6) are raised in the following paragraphs.
PowerExported/FCI (MWh/MMUSD) is a useful ratio related to the social efficiency of the decarbonized NGCC, as it unveils how much social benefit appears per USD invested. According to this ratio, the best sustainable plant is the post-combustion NGCC (this work), characterized by low FCI, which leads to a pragmatic conclusion: “with low money, prioritize post-combustion NGCC.” This aphorism is corroborated by the post-combustion NGCC of Manzolini et al. (2013), which comes second. The counterpart of Isogai and Nakagaki (2024) did not confirm the rule due to its anomalously low power exported, while all the pre-combustion NGCCs and the oxy-combustion NGCC are handicapped by high FCI.
NPV/PowerExported (USD/MWh) reports plant profitability per unit of social benefit. It is a somewhat egoistic ratio that privileges the benefit of the plant owner in the sense that high values derive from high NPV and/or low social benefit. Here, the post-combustion NGCC (this work) is again the best option thanks to its highest NPV. The results of Manzolini et al. (2013) did not perform well due to the negative NPV. The oxy-combustion NGCC comes second as it is technically a good solution, but its NPV is handicapped by high FCI.
NPV/CO2Captured (USD/tCO2) is similar to the previous ratio as it reports profitability per unit of environmental benefit, in which high values derive from high NPV and/or low environmental benefit (i.e., NGCC base cases attain infinite scores here). This is precisely the case of the post-combustion NGCC of Isogai and Nakagaki (2024), which attains the best score thanks to very low carbon capture. The post-combustion NGCC (this work) comes second due to its highest NPV, while the oxy-combustion NGCC comes third, doubly handicapped by its highest carbon capture and lower NPV.
NPV/CO2Emitted (USD/tCO2) is a metric reporting profitability per unit of environmental harm; that is, it favors plants that are doubly sustainable: both economically and environmentally. Here, the best plant with flying colors is the oxy-combustion NGCC, which is profitable and generates almost zero emissions. The post-combustion NGCC (this work) comes second, impelled by its highest NPV, which offsets its perceptible emissions, while the pre-combustion NGCCs are doubly handicapped by low NPV and perceptible emission load.
PowerExported/CO2Emitted (MWh/tCO2) is the best environmental sustainability indicator for power plants by excellence, as it reports social benefit provided per unit of environmental harm. The oxy-combustion NGCC attains, by far, the best score: more than 5.5× the post-combustion NGCC counterpart, which comes second, propelled by its high exported power. The pre-combustion NGCC comes third, handicapped by its lower power exportation and perceptible emission load.
Figure 8 presents a comparative graph illustrating MACs and several performance ratios for the decarbonized NGCCs from this work and from references. The decarbonized NGCCs from the present work achieved the highest NPV values, which entail high scores in NPV ratios. This is a consequence of considering CO2-to-EOR revenues in NGCCs with anti-carbon packages. The results of Manzolini et al. (2013) show the relevance of CO2 pricing mechanisms, as demonstrated by their negative NPV and high MAC values for the post-combustion NGCC. These outcomes highlight that, without appropriate mechanisms such as carbon taxes or CCU, decarbonized power plants may remain financially unfeasible in the context of sustainable energy transition.
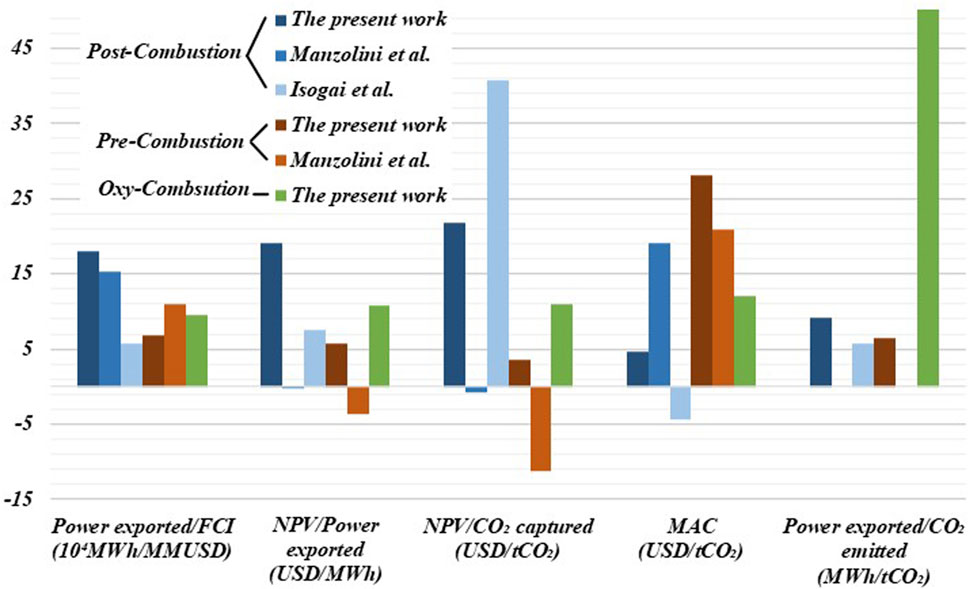
Figure 8. Comparison of decarbonized NGCCs.
Figure 9 depicts the MAC distribution, also called the MAC curve (McKinsey and Company, 2007), for the six analyzed NGCCs with anti-carbon packages. This kind of graph typically ranks processes in ascending MAC order and defines the horizontal axis as cumulative lifetime carbon capture capacity. As already discussed, the lowest and negative MAC corresponds to the post-combustion NGCC of Isogai and Nakagaki (2024), favored by its carbon tax penalty, which increased AGAP25y during decarbonization. The process with the lowest positive MAC is the post-combustion NGCC (this work) because it exhibits the lowest fall of AGAP25y (due to the lowest COM increase in Table 5) during decarbonization. In third place comes the oxy-combustion NGCC (164% MAC increase), handicapped by a greater AGAP25y decrease during decarbonization due to an impressive 100% COM increase, in response to a 240% FCI increase. Not surprisingly, the pre-combustion NGCC (this work) attains the highest MAC, doubly handicapped by the greatest loss of power exportation and 75% COM increase during decarbonization.

Figure 9. MAC vs. cumulative CCS capacity: NGCCs with anti-carbon packages (sorted by MAC).
3.5 Sensitivity analysis
A sensitivity analysis was carried out to assess the influence of three independent factors (two economic factors and one operational factor) on the post-combustion NGCC, namely: (i) electricity price (PEL) ranging from 80.5 USD/MWh to 98.5 USD/MWh, (ii) interest rate (i) ranging from 6% to 15%, and (iii) CO2 capture efficiency (CapEFF) ranging from 85% to 94%. By sampling 10 equidistant levels for each factor, a total of 1,000 sensitivity points were obtained. The outputs included environmental and economic indicators: (i) NPV, (ii) MAC, (iii) FCI, (iv) total CO2 captured (CO2CAP,25y), (v) electricity exported (WEXP,25y) in the 25-year horizon, (vi) CO2 emissions per year (CO2E), as well as performance ratios NPV/CO2E,25y (economic return per environmental harm), WEXP/CO2E,25y (social benefit per environmental harm), and NPV/FCI (economic return per USD invested).
Other economic variables, necessary for calculating those outputs, are also presented: REV, COM, GAP, and AGAP. To estimate MAC in different economic scenarios, AGAP for the base case (zero capture) was recalculated, as it is influenced by both PEL and i.
Table 7 highlights 12 selected sensitivity points that illustrate the general behavior, including the CCU-design point 205, and the base case (zero capture). Figures 10, 11 provide a visualization of all sensitivity points, where the color scale represents the NPV (Figure 10) and NPV/CO2E,25y (Figure 11). A table with all 1,000 sensitivity points is available on request to the corresponding author.

Table 7. Sensitivity analysis selected points.

Figure 10. NPV sensitivity analysis.

Figure 11. NPV/CO2E,25y sensitivity analysis.
The analysis revealed insights regarding the techno-economic performance of the post-combustion NGCC. First, all simulated cases achieved a positive NPV, indicating that FCI is fully recovered under the assumed operating and economic conditions for all sensitivity points (Figure 10). This attests to the economic resilience of the post-combustion NGCC even under pessimistic conjunctures.
Among the tested independent factors, the interest rate exerts the strongest influence on NPV (Figure 10). Its negative effect on NPV is illustrated by the paired points 1–91, 10–100, 901–991, and 910–1,000, which evince strong NPV decreases as i increases. By contrast, the capture efficiency has a minor influence on NPV; that is, NPV primarily responds to economic factors rather than CO2 capture level (Figure 10).
GAP behavior reflects interactions between the price of electricity and capture efficiency. For a low electricity price, high capture efficiency entails greater GAP, unveiling financial compensation of capture penalty losses with CO2-to-EOR revenues. This behavior persists until PEL = 90.5 USD/MWh, where GAP becomes nearly insensitive to capture efficiency (points 501 and 510). Beyond this price, GAP is consistently higher for lower capture efficiency, indicating that CO2-to-EOR no longer compensates for electricity revenue losses.
For all economic scenarios, increasing capture efficiency reduces MAC. This occurs because CO2CAP,25y increases, while AGAP remains comparatively unaffected. This trend is also seen in the NPV/CO2E,25y and WEXP/CO2E ratios, which increase as emissions decrease (capture efficiency increases). Overall, MAC, NPV/CO2E,25y, and WEXP/CO2E improve as capture increases (Figure 11).
Finally, there is some trade-off between MAC and NPV. As NPV increases due to economic factors, MAC also increases because its numerator ΔAGAP25y increases; that is, maximizing financial return entails a greater burden to the environment, unveiling the profitability vs. sustainability trade-off typical of CO2 capture technologies.
4 Conclusion and outlook
Three NGCCs with anti-carbon packages were evaluated for sustainable fossil power production, namely, post-combustion NGCC, oxy-combustion NGCC, and pre-combustion NGCC. All decarbonized NGCCs export 100% of the captured CO2 to EOR, generating extra revenues and ensuring profitability and economic sustainability. In consequence, the decarbonized NGCCs are all CCU power plants. The evaluation was based on the marginal abatement cost MAC (USD/tCO2), classical techno-economic outputs, such as PowerExported-25y (MWh), FCI (MMUSD), and NPV (MMUSD), and techno-environmental-economic performance ratios, including PowerExported/CO2Emitted (MWh/tCO2) and PowerExported-25y/FCI (MWh/MMUSD).
All NGCC with anti-carbon packages have economic viability: (i) post-combustion NGCC NPV25y = 2,060.68 MMUSD, AGAP25y = 3,794.49 MMUSD; (ii) oxy-combustion NGCC: NPV25y = 1,144.21 MMUSD, AGAP25y = 2,967.11 MMUSD; and (iii) pre-combustion NGCC: NPV25y = 339.66 MMUSD, AGAP25y = 1,499.79 MMUSD.
The post-combustion NGCC has the lowest MAC = +4.58 USD/tCO2 due to the lowest FCI and COM and the highest electricity export, entailing the highest AGAP25y. Despite the highest FCI and COM, the oxy-combustion NGCC comes second with MAC = +12.09 USD/tCO2 due to the greatest revenues after decarbonization. Meanwhile, the pre-combustion NGCC is characterized by the highest MAC = +28.17 USD/tCO2, which is doubly handicapped by its low power export and high COM (from high FCI).
MAC values were also calculated for decarbonized NGCCs from the literature for comparison purposes. The post-combustion NGCC from Isogai and Nakagaki (2024) attained MAC = –4.30 USD/tCO2, and the post-combustion NGCC and the pre-combustion NGCC from Manzolini et al. (2013) attained MAC = 19.05 USD/tCO2 and MAC = 20.97 USD/tCO2, respectively.
These MAC values lead to the general conclusion that post-combustion NGCCs operate with the lowest abatement cost, while pre-combustion NGCCs present the highest abatement cost. The oxy-combustion NGCC operates with intermediary abatement costs. The characteristic signature of post-combustion NGCC is the lowest investment and increase of revenues in decarbonized mode, thanks to CO2 monetization and low loss of electricity exportation. Meanwhile, the characteristic signature of pre-combustion NGCC comprises high investment and appreciable loss of electricity exportation after decarbonization. The oxy-combustion NGCC behaves in an intermediary way, with a characteristic signature consisting of the highest investment simultaneously with the highest revenues due to the highest CO2 monetization and low loss of electricity exportation.
The analysis based on performance ratios corroborates the MAC analysis while unveiling novel facets of decarbonized NGCCs, namely, (i) PowerExported/FCI (MWh/MMUSD) unveils the social efficiency (social benefit per USD invested) of decarbonized NGCCs and indicates that the best sustainable NGCC is the post-combustion NGCC corroborating the aphorism, “with low money, prioritize post-combustion NGCC;” (ii) NPV/PowerExported (USD/MWh) reports profitability per unit of social benefit, confirming post-combustion NGCC as the best option thanks to its highest NPV, while the oxy-combustion NGCC comes second as it is technically a good solution, but with a NPV handicapped by the highest FCI; (iii) NPV/CO2Captured (USD/tCO2) reports profitability per unit of environmental benefit, which is the case of the post-combustion NGCC of Isogai and Nakagaki (2024), which attains the best score thanks to very low carbon capture, while the post-combustion NGCC (this work) comes second due to its highest NPV; (iv) NPV/CO2Emitted (USD/tCO2) reports profitability per unit of environmental harm favoring plants that are economically and environmentally sustainable, indicating the oxy-combustion NGCC as the best decarbonized NGCC; the post-combustion NGCC (this work) comes second propelled by its highest NPV, while the pre-combustion NGCCs is doubly handicapped by low NPV and emission load; (v) PowerExported/CO2Emitted (MWh/tCO2) is the environmental sustainability indicator for power plants by excellence that reports social benefit per unit of environmental harm, indicating the oxy-combustion NGCC as the best scorer, and the post-combustion NGCC comes second propelled by its high exported power, while the pre-combustion NGCC comes third, handicapped by its low power exportation and emission load.
Considering all metrics, the post-combustion NGCC is indicated as the best economic-environmental compromise, but the oxy-combustion NGCC comes close as the best social benefit per environmental harm. The pre-combustion NGCC is, in principle, not recommended as a decarbonized NGCC.
Sensitivity analysis confirms that the post-combustion NGCC, as the best short-term CCUS solution, is economically resilient; that is, it keeps a positive NPV under unfavorable economic scenarios. In addition, under low electricity prices, high capture efficiencies can even enhance economic performance due to CO2-to-EOR revenues. Another disclosure is that economic-environmental ratios like MAC, NPV/CO2E,25y, and WEXP/CO2E all improve as capture increases, despite worse economic performance.
5 Limitations and future work
This work has scope, method, and results limitations; thus, suggestions for future works that eliminate part of such limitations apply, namely, (i) to consider catalyst deactivation costs in the pre-combustion NGCC; (ii) to consider uncertainties of CO2 transport and logistics; (iii) to implement Monte Carlo analyses of results; (iv) different chemical or physical solvents for CO2 absorption in post-combustion and pre-combustion NGCCs; (v) membrane permeation and/or gas-liquid membrane contactors for CO2 capture instead of CO2 absorption columns in post-combustion and pre-combustion NGCCs; (vi) different cryogenic air separation units (ASU) in an oxy-combustion NGCC; (vii) lifecycle analysis (LCA) of the three CCUS-NGCCs for complete evaluation of environmental aspects; (viii) a technology roadmap for short-term, mid-term, or long-term viability assessment of CCUS-NGCCs; and (ix) high-scale CCUS-NGCC optimization.
Data availability statement
The datasets presented in this article are not readily available because the funder does not allow distribution of information belonging to this research. Requests to access the datasets should be directed to José Luiz de Medeiros,amxtQGVxLnVmcmouYnI=.
Author contributions
JG: Visualization, Validation, Formal Analysis, Data curation, Writing – original draft, Software, Investigation. Gd: Validation, Investigation, Visualization, Formal Analysis, Writing – original draft, Data curation, Software. JM: Investigation, Project administration, Conceptualization, Funding acquisition, Methodology, Writing – original draft, Supervision, Formal Analysis, Resources, Visualization, Writing – review and editing, Software. OA: Resources, Funding acquisition, Writing – review and editing, Project administration, Supervision.
Funding
The authors declare that financial support was received for the research and/or publication of this article. The authors acknowledge financial support from Petrobras (0050.0124916.23.9). JG acknowledges financial support from CNPq-Brazil (181588/2024-2). JL de Medeiros and OQF Araújo acknowledge financial support from CNPq-Brazil (313861/2020-0 and 312328/2021-4) and FAPERJ-Brazil (E-26/200.522/2023 and E-26/201.178/2021).
Conflict of interest
The authors declare that the research was conducted in the absence of any commercial or financial relationships that could be construed as a potential conflict of interest.
Generative AI statement
The authors declare that no Generative AI was used in the creation of this manuscript.
Any alternative text (alt text) provided alongside figures in this article has been generated by Frontiers with the support of artificial intelligence and reasonable efforts have been made to ensure accuracy, including review by the authors wherever possible. If you identify any issues, please contact us.
Publisher’s note
All claims expressed in this article are solely those of the authors and do not necessarily represent those of their affiliated organizations, or those of the publisher, the editors and the reviewers. Any product that may be evaluated in this article, or claim that may be made by its manufacturer, is not guaranteed or endorsed by the publisher.
Supplementary material
The Supplementary Material for this article can be found online at: https://www.frontiersin.org/articles/10.3389/fmats.2025.1679722/full#supplementary-material
References
Ahmad, T., and Zhang, D. (2020). A critical review of comparative global historical energy consumption and future demand: the story told so far. Energy Rep. 6, 1973–1991. doi:10.1016/j.egyr.2020.07.020
Araújo, O. Q. F., and de Medeiros, J. L. (2021). How is the transition away from fossil fuels doing, and how will the low-carbon future unfold? Clean. Technol. Environ. Policy. 23, 1385–1388. doi:10.1007/s10098-021-02123-x
Belaissaoui, B., and Favre, E. (2018). Evaluation of a dense skin hollow fiber gas-liquid membrane contactor for high pressure removal of CO2 from syngas using selexol as the absorbent. Chem. Eng. Sci. 184, 186–199. doi:10.1016/j.ces.2018.02.028
Bharath, Y., and Rajendran, A. (2024). Evaluation of a tetramine-appended MOF for post combustion CO2 capture from natural gas combined cycle flue gas by steam-assisted temperature swing adsorption. Int. J. Greenh. Gas. Control 131, 104016. doi:10.1016/j.ijggc.2023.104016
Bhattacharya, A., and Datta, A. (2013). Effects of supplementary biomass firing on the performance of combined cycle power generation: a comparison between NGCC and IGCC plants. Biomass Bioenergy 54, 239–249. doi:10.1016/j.biombioe.2013.04.008
Brigagão, G. V., de Medeiros, J. L., and Araújo, O. Q. F. (2019). A novel cryogenic vapor-recompression air separation unit integrated to oxyfuel combined-cycle gas-to-wire plant with carbon dioxide enhanced oil recovery: energy and economic assessments. Energy Convers. Manage. 189, 202–214. doi:10.1016/j.enconman.2019.03.088
Calvo-Muñoz, E. M., García-Mateos, F. J., Rosas, J. M., Rodríguez-Mirasol, J., and Cordero, T. (2016). Biomass waste carbon materials as adsorbents for CO2 capture under post-combustion conditions. Front. Mater. 3, 23. doi:10.3389/fmats.2016.00023
Chemanalyst (2024). Triethylene glycol price trend and forecast. Available online at: https://www.chemanalyst.com/Pricing-data/triethylene-glycol-1532 (Accessed November 04, 2024).
Cobden, P. D., van Beurden, P., Reijers, H. T. J., Elzinga, G. D., Kluiters, S. C. A., Dijkstra, J. W., et al. (2007). Sorption-enhanced hydrogen production for pre-combustion CO2 capture: thermodynamic analysis and experimental results. Int. J. Greenh. Gas. Control 1, 170–179. doi:10.1016/S1750-5836(07)00021-7
Cruz, M. A., Brigagão, G. V., de Medeiros, J. L., Musse, A. P. S., Kami, E., Freire, R. L. A., et al. (2023). Decarbonization of energy supply to offshore oil and gas production with post-combustion capture: a simulation-based techno-economic analysis. Energy 274, 127349. doi:10.1016/j.energy.2023.127349
da Cunha, G. P., de Medeiros, J. L., and Araújo, O. Q. F. (2023). Offshore decarbonation of CO2-rich natural gas intensified via gas-liquid membrane contactors with blended aqueous-amines. Chem. Eng. Process. Process Intensif. 191, 109462. doi:10.1016/j.cep.2023.109462
Eory, V., Pellerin, S., Garcia, G. C., Lehtonen, H., Licite, I., Mattila, H., et al. (2018). Marginal abatement cost curves for agricultural climate policy: state-of-the art, lessons learnt and future potential. J. Clean. Prod. 182, 705–716. doi:10.1016/j.jclepro.2018.01.252
Geweda, A. E., Zayed, M. E., Khan, M. Y., and Alquaity, A. B. S. (2025). Mitigating CO2 emissions: a review on emerging technologies/strategies for CO2 capture. J. Energy Inst. 118, 101911. doi:10.1016/j.joei.2024.101911
Goren, A. Y., Erdemir, D., and Dincer, I. (2024). Comprehensive review and assessment of carbon capturing methods and technologies: an environmental research. Environ. Res. 240, 117503. doi:10.1016/j.envres.2023.117503
Huang, S. K., Kuo, L., and Chou, K. L. (2016). The applicability of marginal abatement cost approach: a comprehensive review. J. Clean. Prod. 127, 59–71. doi:10.1016/j.jclepro.2016.04.013
Isogai, H., and Nakagaki, T. (2024). Power-to-heat amine-based post-combustion CO2 capture system with solvent storage utilizing fluctuating electricity prices. Appl. Energy 368, 123519. doi:10.1016/j.apenergy.2024.123519
Kanniche, M., Gros-Bonnivard, R., Jaud, P., Valle-Marcos, J., Amann, J. M., and Bouallou, C. (2010). Pre-combustion, post-combustion and oxy-combustion in thermal power plant for CO2 capture. Appl. Therm. Eng. 30, 53–62. doi:10.1016/j.applthermaleng.2009.05.005
Kazemi, A., Moreno, J., and Iribarren, D. (2022). Techno-economic comparison of optimized natural gas combined cycle power plants with CO2 capture. Energy 255, 124617. doi:10.1016/j.energy.2022.124617
Kazemi, A., Moreno, J., and Iribarren, D. (2023). Economic optimization and comparative environmental assessment of natural gas combined cycle power plants with CO2 capture. Energy 277, 127661. doi:10.1016/j.energy.2023.127661
Khallaghi, N., Hanak, D. P., and Manovic, V. (2019). Staged oxy-fuel natural gas combined cycle. Appl. Therm. Eng. 153, 761–767. doi:10.1016/j.applthermaleng.2019.03.033
Lameh, M., Al-Mohannadi, D. M., and Linke, P. (2022). Minimum marginal abatement cost curves (Mini-MAC) for CO2 emissions reduction planning. Clean. Technol. Environ. Policy 24, 143–159. doi:10.1007/s10098-021-02095-y
Malekli, M., Aslani, A., and Ghaffarinejad, T. (2025). Integration of indirect mechanism autothermal reforming process with chilled methanol scrubbing solution for syngas purification: power generation exploiting blue hydrogen as fuel. Chem. Eng. Process. Process Intensif. 212, 110248. doi:10.1016/j.cep.2025.110248
Manzolini, G., Macchi, E., and Gazzani, M. (2013). CO2 capture in natural gas combined cycle with SEWGS. Part B: economic assessment. Int. J. Greenh. Gas. Control. 12, 502–509. doi:10.1016/j.ijggc.2012.06.021
McCoy, S. T. (2008). The economics of CO2 transport by pipeline and storage in saline aquifers and oil reservoirs. Pittsburgh, PA, USA: Carnegie Mellon University. Available online at: https://www.cmu.edu/ceic/assets/docs/publications/phd-dissertations/2008/sean-mccoy-phd-thesis-2008.pdf.
McKinsey and Company (2007). “Reducing US greenhouse gas emissions: how much at what cost? US greenhouse gas abatement mapping initiative,” in Executive report.
Middelhoff, E., Furtado, L. A., Parise, J. A. R., Ximenes, F., and Florin, N. (2022). Hybrid concentrated solar biomass (HCSB) systems for cogeneration: techno-economic analysis for beef abattoirs in New South Wales, Australia. Energy Convers. manage. 262, 115620. doi:10.1016/j.enconman.2022.115620
Milão, R. F. D., de Medeiros, J. L., Interlenghi, S. F., and Araújo, O. Q. F. (2023). Low-emission gas-to-wire with thermodynamic efficiency: monetization of carbon dioxide rich natural gas from offshore fields. Gas. Sci. Eng. 115, 205021. doi:10.1016/j.jgsce.2023.205021
Ni, Z., Li, S., Zhang, X., Bao, J., and Zhang, N. (2025). Analysis and comparison of the membrane-cryogenic hybrid process and multistage membrane process for pre-combustion carbon capture based on the superstructure method. Sep. Purif. Technol. 353, 128636. doi:10.1016/j.seppur.2024.128636
Oh, H. T., Kum, J., Park, J., Vo, N. D., Kang, J. H., and Lee, C. H. (2022). Pre-combustion CO2 capture using amine-based absorption process for blue H2 production from steam methane reformer. Energy Convers. Manage. 262, 115632. doi:10.1016/j.enconman.2022.115632
Pruvost, F., Cloete, S., del Pozo, C. A., and Zaabout, A. (2022). Blue, green, and turquoise pathways for minimizing hydrogen production costs from steam methane reforming with CO2 capture. Energy Convers. Manage. 274, 116458. doi:10.1016/j.enconman.2022.116458
PW Consulting Chemical and Energy Research Center (2024). Methyldiethanolamine (MDEA) based solvent market. Available online at: https://pmarketresearch.com/chemi/methyldiethanolamine-mdea-based-solvent-market/(Accessed November 04, 2024).
Researz (2024). Piperazine news, index, prices, graph and demand. Available online at: https://researz.com/piperazine-news-index-prices-graph-and-demand/?utm_source (Accessed November 04, 2024).
Rodrigues, I. N., de Medeiros, J. L., Poblete, I. B. S., Constantino, A. M., and Araújo, O. Q. F. (2024). Landfill-gas-to-biomethane via a new carbon capture and utilization technology: one-pot sodium chloride batch mineralization. J. Clean. Prod. 478, 143979. doi:10.1016/j.jclepro.2024.143979
Singla, Y., Thakur, A., and Sud, D. (2025). A comprehensive review on carbon capturing materials and processes for sustainable development. Mater. Today Energy 48, 101783. doi:10.1016/j.mtener.2024.101783
Skorek-Osikowska, A., Bartela, Ł., and Kotowicz, J. (2015). A comparative thermodynamic, economic and risk analysis concerning implementation of oxy-combustion power plants integrated with cryogenic and hybrid air separation units. Energy Convers. manage. 92, 421–430. doi:10.1016/j.enconman.2014.12.079
Solares, R. A. A., and Wood, J. (2020). A parametric study of process design and cycle configurations for pre-combustion PSA applied to NGCC power plants. Chem. Eng. Res. Des. 160, 141–153. doi:10.1016/j.cherd.2020.04.039
Tan, L., Cai, L., Fu, Y., Zhou, Z., and Guan, Y. (2023). Numerical investigation of biomass and liquefied natural gas driven oxy-fuel combustion power system. Renew. Energy 208, 94–104. doi:10.1016/j.renene.2023.03.014
Thiedemann, T. M., and Wark, M. (2025). A compact review of current technologies for carbon capture as well as storing and utilizing the captured CO2. Processes 13, 283. doi:10.3390/pr13010283
Turton, R., Shaeiwitz, J. A., Bhattacharyya, D., and Whiting, W. B. (2018). Analysis, synthesis, and design of chemical processes. fifth ed. NY, United States: Prentice Hall International.
Wang, D., Ren, X., Zhang, J., Wang, Z., and Wang, T. (2023). Comparative investigation on techno-economics of cascade supercritical CO2 combined cycles for waste heat recovery of typical gas turbines. Therm. Sci. Eng. Prog. 42, 101941. doi:10.1016/j.tsep.2023.101941
Yadav, S., Seethamraju, S., and Banerjee, R. (2025). Post-combustion CO2 capture using cold energy from liquefied natural gas regasification in natural gas combined cycle power plants. Fuel 401, 135878. doi:10.1016/j.fuel.2025.135878
Zanetti, A., de Medeiros, J. L., and Araújo, O. Q. F. (2025). Assessment of floating reservoir-to-blue-hydrogen as alternative for deep-water offshore processing of natural gas. Energy Convers. Manage. 342, 120117. doi:10.1016/j.enconman.2025.120117
Nomenclature
AGAP Accumulated discounted gross annual profit (MMUSD)
AP Annual profit (MMUSD/y)
Ci Concentration of component i (kmol/m3)
CEPCI CF Chemical engineering plant cost index (−), equipment capacity factor (m2, m3, kW, etc.)
COM, COL Cost of manufacture, cost of labor (MMUSD/y)
CUT, CRM, CCT Cost of utilities, cost of raw materials, cost of CO2 transportation (MMUSD/y)
DEPR Annual depreciation (MMUSD/y)
Ea Activation energy (kJ/mol)
FCI, GAP Fixed capital investment (MMUSD), gross annual profit (MMUSD/y)
i, ITR Annual interest and income tax rates (%)
ki Absorption constant of chemical species i
MAC Marginal abatement cost (USD/tCO2)
NH, N Project horizon (y)
NEQ, NOL Number of equipment items, number of operators
NPV Net present value (MMUSD)
OPCOST Annual operator cost (MMUSD/y)
P, Pi Pressure (bar), partial pressure of component i (bar)
R, r Ideal gas constant (J/(mol.K)), reaction rate (mol/(s.gcat))
REV Revenues (MMUSD/y)
T Temperature (K)
Greek symbols
β Reversibility factor
Superscripts
ads Adsorption
Abbreviations
CCS Carbon capture and sequestration
CCU Carbon capture and utilization
CW Cooling water
DCC Direct-contact column
EGR Exhaust gas recirculation
EOR Enhanced oil recovery
IGCC Integrated gasification combined cycle
LPS Saturated low-pressure steam
MEA Monoethanolamine
MDEA Methyl-diethanolamine
NG Natural gas
NGCC NG combined cycle
PCC-MEA Post-combustion carbon capture with aqueous MEA
SMR Steam-methane reforming
TEG Triethylene-glycol
TSA Temperature-swing adsorption
WGS Water–gas shift.
Keywords: cleaner energy, sustainable energy, power production, marginal abatement cost, post-combustion, oxy-combustion
Citation: Garcia JL, da Cunha GP, de Medeiros JL and Araújo OdQF (2025) Marginal abatement cost analysis of cleaner power production alternatives for sustainable energy transition. Front. Mater. 12:1679722. doi: 10.3389/fmats.2025.1679722
Received: 05 August 2025; Accepted: 29 October 2025;
Published: 03 December 2025.
Edited by:
Daniela Šojić Merkulov, University of Novi Sad, SerbiaReviewed by:
Szabolcs Bognár, University of Novi Sad, SerbiaShravan Kumar, Harcourt Butler Technical University, India
Copyright © 2025 Garcia, da Cunha, de Medeiros and Araújo. This is an open-access article distributed under the terms of the Creative Commons Attribution License (CC BY). The use, distribution or reproduction in other forums is permitted, provided the original author(s) and the copyright owner(s) are credited and that the original publication in this journal is cited, in accordance with accepted academic practice. No use, distribution or reproduction is permitted which does not comply with these terms.
*Correspondence: José Luiz de Medeiros, amxtQGVxLnVmcmouYnI=