 Søren Espersen Schrøder1*
 David San Martin2
 Giuseppe Foti2Monica Gutierrez2
 Bruno Iñarra Chastagnol2
 J. Rasmus Nielsen1Erling Larsen1
- 1DTU Aqua, National Institute of Aquatic Resources, Technical University of Denmark, Kongens Lyngby, Denmark
- 2AZTI, Food Research, Basque Research and Technology Alliance (BRTA), Derio, Spain
Multi-criteria decision-making (MCDM) tools are essentially methods to enable a decision maker to achieve a more objective approach to a given decision scenario using quantitative methods. One such complex decision scenario is the underutilization of side-streams in the seafood industry, which is brought about by a combination of complex decision challenges related to processing methods, storage methods, logistics, technical viability, status quo mindset, and the attitude of the decision maker. However, the influence and identification of cognitive biases (e.g., loss aversion bias) in MCDM tools are rarely accounted for and may result in a less objective decision process due to subjective influences, which can influence the valorization and utilization of seafood side-streams in a company. To enable a more objective approach where the influence of these cognitive biases is corrected, in this paper, we propose a debiasing method based on the UN’s 14 SDGs, cognitive mapping (CM), and attribute substitution (AS) as an extension of MCDM tools and the modeling of seafood processing. The results of the case-specific implementation show that the proposed method can identify cognitive biases and correct these by enabling the implementation of relevant debiasing techniques that can aid a decision marker in choosing the best alternative when it comes to decisions on reducing wasted side-streams and increasing the sustainability of their food processing. It was found that the debiasing application provided a correction of the user ranking for the best-evaluated alternative within a side-stream scenario to be in line with the experts’ ranking for the same scenario in terms of environmentally and economically efficient production. This is a novel approach combining existing theories and methods into a single bias identification and debiasing method, which is designed to be generic and can be implemented in other sectors and industries using MCDM tools in their decision process. The approach provides industry and science with a verified and structured method to achieve objectivity through the identification and correction of decision-making biases that also supports a balance between a company’s economic and environmental goals.
1 Introduction and background
1.1 What are side-streams and why are they important?
One of the current and near-future challenges is providing access to affordable and sustainable food sources for the rising world population (Schubel and Thompson, 2019; Costello et al., 2020; Van der Meer, 2020; Farmery et al., 2021).
Generally, the food processing sector is marked by high exploitation of its raw resources and side-streams; for instance, the processing of beef cattle has a nearly 100% utilization rate (businessinsider.com, 2017) when not accounting for trophic efficiency in this process (Shepon et al., 2016).
However, in the food-processing sector involved in the exploitation of aquatic living resources, this efficiency is significantly lower. Here, the current exploitation of resources is impeded by inefficiency as in some cases, up to 60%–70% of the aquatic living resources end up as production waste and low-value products (FAO, 2020; Coppola et al., 2021). The waste and low-value products constitute the so-called side-streams of production, which are often underutilized. This leaves the industry and society with inefficiency and a poorly utilized aquatic living resource biomass that could be used for higher value purposes, such as securing affordable protein sources or developing bioactive peptides for nutraceutical, pharmaceutical production, food, and feed applications (Rustad et al., 2011; Shahidi et al., 2019; Coppola et al., 2021).
1.2 What is needed for this near-future underutilization challenge to be solved?
To meet the challenge of this underutilization of biomass and solve the problem, there is a need for a proper provision of logistics and infrastructure to ensure a high quality of side-streams for a prolonged window of time (Shahdi et al., 2019; Shavandi et al., 2019; Coppola et al., 2021). Promising technologies currently only available at the laboratory level can be adapted to an industrial scale and integrated into a biorefinery approach to reduce not only the lack of knowledge but also the lack of methods of how to handle underutilized side-streams in a cost-effective way (Steven et al., 2019; Mohan et al., 2020; Coppola et al., 2021). Furthermore, a producer attitude change, away from side-stream resource only being a low-value resource, is needed to achieve a more extensive, efficient, and sound exploitation of the aquatic biomass (Guillen et al., 2018; Mo et al., 2018).
To meet these challenges, a main objective of current large-scale research projects, e.g., the EU Horizon 2020 WaSeaBi project, is to develop the state-of-the-art in solving the barriers to proper utilization of aquatic living resources. This involves a focus on better utilization of seafood side-streams through the development of storage solutions, sorting technologies, and management tools to secure an efficient, sustainable supply system for fishery by-catches and side-stream utilization from aquaculture, fisheries, and the aquatic processing industries (EU H2020 WaSeaBi, Project No. 837726, www.WaSeaBi.eu).
One such barrier, which needs to be solved, is related to the fact that human decision-making in the food industry production is also inherently limited and more subjective rather than objective due to our limited rationality when handling new and/or complex information (Simon, 1957; Abara and Singh, 1993; Gilovich et al., 2002). Therefore, there is a need for further development and utilization of robust and generic management tools to mitigate these flaws and support a more rational and unbiased decision-making process. One of the most utilized multi-criteria decision-making (MCDM) tools for this barrier is the analytic hierarchy process (AHP) methodology. AHP is one of the most utilized decision-making methods in resource allocation, quality management, and more, with organizations and companies such as Xerox, NASA, and Northeast Fisheries Science Center (NFSC) as some of its users (Ernest and Gass, 2001; Munier and Hontoria, 2021).
1.3 How do AHP tools aid in resolving these issues?
The spread of the AHP methodology as a management tool to support a more objective decision-making process is evident from its use in both the public and private sectors. Here, it has been praised for making pairwise comparisons of alternative choices transparent and simple, thus enabling the decision maker to make the most optimal local decision based on the given criteria (Saaty, 1980; Ernest and Gass, 2001; Liberatore and Nydick, 2008). The AHP methodology itself is based on mathematical theory and functions and psychological theory, which enables it to incorporate both qualitative and quantitative inputs while also considering the decision maker’s subjective biases when rating solution alternatives (Ernest and Gass, 2001).
In relation to solving the issues with the food industry’s underutilized aquatic biomass, an AHP tool is a very suitable method to simplify an otherwise complex decision-making process and scale it to an overall cost–benefit approach (Saaty, 1980). This can, for instance, be to improve and better inform a decision-making process on whether certain utilization projects of side-streams should be initiated, continued, or ceased based on predefined decision criteria that require the user of the tool to approach the decision process from an objective point of view. This objective view is generally visualized via an AHP Matrix* and its AHP scores* (Saaty, 1980) (see more details on the AHP Matrix and score in Supplementary Material S1). Regarding the aim to enable seafood companies to achieve better utilization and valuation of their side-streams in the current example, the AHP methodology does contain some shortcomings with respect to the psychological component that can lessen the effectiveness of the tool (Alessio et al., 2009; Ma et al., 2017).
First, while the AHP methodology incorporates some elements of cognitive psychology* to explain and account for biases in the decision-making process, it follows a trial-and-error approach when it comes to correcting issues regarding its consistency rating due to cognitive biases*. A review of the AHP methodology literature shows this enables the widely accepted practice that if the AHP tool’s inconsistency ratio is higher than 10%, it is advised to reconsider the tool’s attribute rating to achieve consistent measures (Alessio et al., 2009; Deniz, 2020). The general bias that is assigned to such inconsistencies is the confirmation bias, which affects the interpretation of evidence, which favors one’s existing beliefs and expectations (Montebeller and Von Winterfeldt, 2015). The AHP methodology, therefore, lacks an active stand on the psychological element as to which cognitive biases the AHP tool should account for and how to classify them (Ma et al., 2017; Deniz, 2020). While a decision maker’s confirmation bias is a likely candidate for inconsistency, the AHP methodology does not seek to understand why this bias occurs or how to account for them. Instead, the presence of cognitive biases is only confirmed but not identified during the sensitivity analysis section in the AHP design process (Mu and Pereyra-Rojas, 2017).
Second, the AHP methodology only accounts for one cognitive bias as the source of inconsistencies and does not adequately account for other biases. This can include biases such as overconfidence bias, planning bias, or loss aversion bias* that may cause inconsistencies in the ratings and other further reaching implications for the decision process than the confirmation bias (Gilovich et al., 2002; Borrero and Henao, 2017; Deniz, 2020).
The psychological element of different cognitive biases can influence which information is included in the formulation of the problem hierarchy and subsequent framing of the pairwise comparison by the decision maker. These biases affect the criteria weighting and therefore need to be accounted for. These drawbacks in accounting for the psychological aspects of the decision-making process in the AHP tool, therefore, raise some essential questions—how does one account for different biases in an AHP tool, given the current level of knowledge that we have of these biases, to minimize their influence on the criteria weights that are being calculated in the AHP matrix and are central for the final AHP scores? Among others, this is the question we aim to address in the current study according to the following objectives.
2 Objectives
The overall objective of the present study is to introduce a new methodological framework to create, test, and implement a generic supplement tool to existing AHP tools based on identifying decision-making biases from interview data and how to correct these biases in an AHP matrix and scores process.
This new methodological framework is being developed for the use of AHP tools in the context of the European seafood industry. The Bio-Based Industries Consortium (BBI) in Europe calls for proposals to address the logistical, infrastructural, and technological challenges for valorization of residual and side-streams from aquaculture, fisheries, and the aquatic biomass industry (BBI, 2018). A set of Horizon 2020 projects with WaSeaBi, as an example, is centered on meeting this call by developing and testing new concepts, which will ensure that side-streams from aquaculture, fisheries, and aquatic processing industries can be used for the production of new products and ingredients (WaSeaBi, 2021). The proposed methodological framework in this paper is, however, not limited to this industry, and given the wide usage of the existing AHP methodology in other industries and geographical regions, there is potential for the proposed methodological framework to be used more widely in these areas, as mentioned by Ernest and Gass (2001) and Munier and Hontoria (2021).
The specific aim of the study is as follows:
• To contribute with a debiasing* method, with an emphasis on identifying the decision maker’s biases and correcting these with appropriate debiasing techniques in the setting of an AHP tool to improve side-stream utilization in the seafood industry.
• To demonstrate how debiasing techniques can be implemented in decision support and management tools designed with the AHP methodology.
This is based on the following zero hypothesis:
• Debiasing techniques will not correct overweighted importance weights from an AHP matrix.
On this basis, we introduce, test, and implement, on a case-specific basis, the new methodological framework, including a supplementary tool to existing AHP tools to improve the bias reduction capabilities. Going through the relevant literature, no complete methodological description is available. Therefore, the following sections describe the proposed method such that it is a coherent and condensed process to understand the rest of the paper. For more in-depth explanations of the method, see the relevant Supplementary Material or the mentioned literature. To exemplify the framework, a typical but hypothetical decision scenario for a real-life decision maker in the seafood industry seeking to improve their side-stream utilization is applied in the study (Section 4) with case-specific data.
3 Methodology of the debiasing method based on cognitive maps and attribute substitution
3.1 Materials and equipment
3.1.1 Required data material
• Interview data from key decision makers in the given seafood company on side-stream utilization, who are also the ones using the AHP or MCDM tool. It is recommended to collect this with the interview guide detailed in Supplementary Material S2.
• Data from an AHP or MCDM tool on the decision criteria, the decision weights, and the evaluation of alternatives made by the user.
3.1.2 Equipment
• Recording device for interviews.
• Microsoft Excel or equivalent data software.
• An AHP or MCDM tool.
3.2 Debiasing methods in multi-criteria decision-making methods in general
Several preliminary methods for correcting bias in tools based on the AHP methodology currently exist. One of the first methods was developed by Buchanan and Corner (1997), which focuses on the impact of the anchoring effect and reducing its influence in MCDM methods. In the study by Almashat et al. (2008), the effects of debiasing procedures for the framing effect were studied in three different medical clinics, where the procedure was shown to be effective in preventing the framing effect from influencing decision-making.
Newer methods in the field include the method used by Ma et al. (2017), who extended the AHP method to handle the cognitive limitation of the affect heuristic and, as a result, reduce its influence on MCDM problems. Arabsheybani et al. (2018) focused on developing an integrated approach by combining fuzzy multi-objective optimization based on ratio analysis (MOORA) with a failure mode and effects analysis (FEMA) to provide a more accurate supplier score and evaluation of risk. Qian et al. (2019) developed a new method that considered and corrected for loss aversion as a result of incomplete information regarding the purchases of clean energy devices. Stevic et al. (2020) developed a new MCDM method for the Measurement of Alternatives and Ranking according to Compromise Solution (MARCOS), which studied the influence that a switch from the 1–9 scale in current MCDM methods to a 1–5 scale would have on 21 different decision scenarios regarding the choice of sustainable suppliers for the health industry.
3.3 The proposed debiasing method based on cognitive maps and attribute substitution
The method proposed in this paper is based on the basic method presented by Deniz (2020), which includes techniques for debiasing for loss aversion bias and the status quo bias*. In addition, this method introduces a coupling between the AHP methodology and the Technique for Order of Preference by Similarity to Ideal Solution (TOPSIS), which allows for an easier ranking process with the AHP scores and subsequently more accessible correction of criteria weights with debiasing techniques (Deniz, 2020). Our proposed method expands on the method by Deniz (2020) by introducing tools and techniques for the action in her method regarding determining the decision maker’s biases and bias degree.
The process of implementing the proposed debiasing process into the existing AHP methodology consists of seven actions that are illustrated as a flow diagram in Figure 1, with further explanation of each action in detail in the following sections.
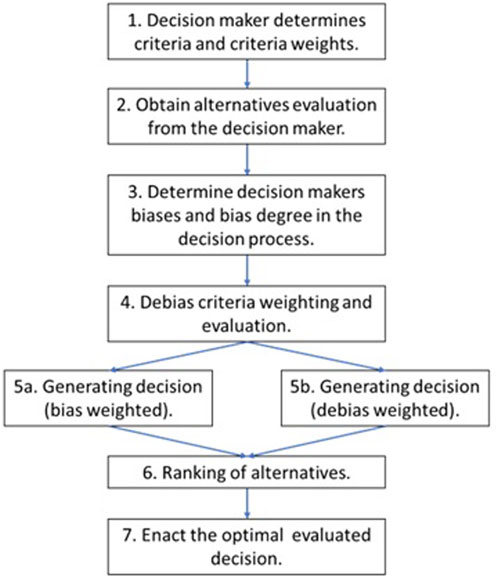
FIGURE 1. Flow diagram of the debiasing process. Inspired by the methodology from Deniz (2020). Each box in the flow diagram indicates an action that is taken in the debiasing process with this methodology. The arrows between the boxes are unidirectional and indicate a transfer of information from one action to another action. The most important actions in the process are actions 5a and 5b.
3.3.1 Action 1: The decision maker determines criteria and criteria weights
Initial weights for the decision criteria are determined following the AHP techniques detailed in the study by Saaty (1980).
3.3.2 Action 2: Obtaining alternative evaluation from the decision maker
The decision maker’s evaluation of different alternatives is obtained according to the AHP techniques detailed by Saaty (1980).
3.3.3 Action 3: Determining the decision marker’s biases and bias degree
This action involves three procedures: 1) Data collection from semi-structured interviews with decision makers in the companies are conducted based on the topic of their current business model, understanding of sustainability, and their view on the utilization of side-stream resources in their production. For the interview guide, please see Supplementary Material S2. 2) The interview data are then used to create company-specific cognitive maps* that visualize the understanding and interaction between these three topics in the company. 3) Based on the output of the cognitive map, biases are identified through the theory of attribute substitution (AS), and the degree of biases is determined as either minor or dominating based on the centrality score and influence score in the cognitive map. The three procedures are described in more detail in Section 3.4.
3.3.4 Action 4: Debias criteria weighting and evaluation
Based on the identified biases from the cognitive map, different debiasing techniques are used to either
• correct for missing criteria categories in the AHP problem hierarchy,
• correct the initial weighting obtained from the AHP process, or
• correct the evaluations of the criteria by the decision makers.
Correcting either or all with appropriate debiasing techniques will lead to correcting the evaluation of the different alternatives in the next step.
3.3.5 Actions 5a: Generating decision (bias weighted) and 5b: Generating decision (debias weighted)
This is the most important action in the process as this is the point where all the previous information is used to calculate and generate the final decision scores that the decision maker will receive from an AHP tool. Decision scores are generated for all the alternatives using TOPSIS for both the unmodified input (bias weighted) and the debiased input (debias weighted). The reason for including both the biased and debiased decision scores is to provide the decision maker with an insight into the magnitude and actual impact that these subjective biases have on their decision-making.
3.3.6 Action 6: Ranking of alternatives
Ranking of the alternatives to determine which alternative the decision maker should choose to enact in the given decision scenario.
3.3.7 Action 7: Enacting the optimal evaluated decision
Based on the debiased AHP scores, the decision maker should, at this point in the process, have a more objective foundation to base his or her decision on, regarding the problem at hand. It is important to note that this is the optimal local decision as evaluated based on the decision maker’s criteria and weighting of these and not a global optimal decision.
3.4 Procedures under determining biases and bias degree in relation to action 3
Under action 3, there are three main procedures in the following order: data collection, cognitive mapping (CM), and AS, as described in the following text. For more details on these procedures, see Supplementary Materials S2–S6.
3.4.1 Data collection from semi-structured interviews to construct cognitive maps
The first part of the debiasing process is focused on collecting data to construct the cognitive maps of the decision maker using semi-structured interviews with open-ended questions. An example of the questionnaire used for the interviews can be found in Supplementary Material S2, together with a more in-depth explanation for the use of the semi-structured interview methodology in this study in Supplementary Material S3.
The decision maker’s answers to the interview questions are analyzed through a thematic analysis process developed by Braun and Clarke (2006), which is detailed in Supplementary Material S4, together with an example referred to as Company A. This creates a list of concepts that enables the development of the cognitive map for the decision maker. This CM procedure is detailed in the following section.
3.4.2 Cognitive mapping to determine causal relations as further input to bias identification
To determine the biases of the decision maker and the magnitude of these biases, the methodology of the CM technique combined with the causal mapping technique by Axelrod (1976) is used first, followed by an analysis with the theory of AS described by Kahneman and Shane (2002). An in-depth explanation of this part of the methodological framework can be viewed in Supplementary Material S5.
Axelrod (1976) defined CM as a method for studying social or organizational actors’ cognitions with the intention of uncovering a person’s causal beliefs to better understand the information filtering and decision-making of these actors. The aim of CM is to uncover underlying assumptions regarding causal relations, to provide the foundation for explaining the decision maker’s behavior, and to predict future behavior within the problem space (Tegarden and Sheetz, 2003).
A central component of the CM technique is the representation of subjective data from a decision maker in a clear overview that allows for identifying causal links between different concepts and criteria within a problem space or hierarchy (Axelrod, 1976). A cognitive map is, therefore, essentially a map where the relationships are restricted to causal relationships, e.g., each relationship is restricted to a “may-lead-to,” “has-implications-for,” “supports,” or “cause–effect” types (Axelrod, 1976). This is also known as ideographic causality, which differs from nomothetic causal explanation. Ideographic causality is the focus on understanding and determining the subjective understandings of causality that the interviewed participants base their views and decisions on (Windelband, 1998).
To develop the cognitive maps with an emphasis on identifying the causal relationships of the decision maker (to be referred to as relations in the following text), a general four-stage approach based on the method by Tegarden and Sheetz (2003) is used. A fifth stage, concept ranking, has been omitted in this study since we are not interested in this level of detail. The four stages are summarized in Supplementary Table S1 with a detailed explanation.
Following these four stages will create a cognitive map with causal relationships identified between the categories, like the visualized map shown in Figure 2. The cognitive map in Figure 2 is based on interviews with one European seafood company referred to as Company A in this study. This cognitive map is referred to through the rest of the paper.
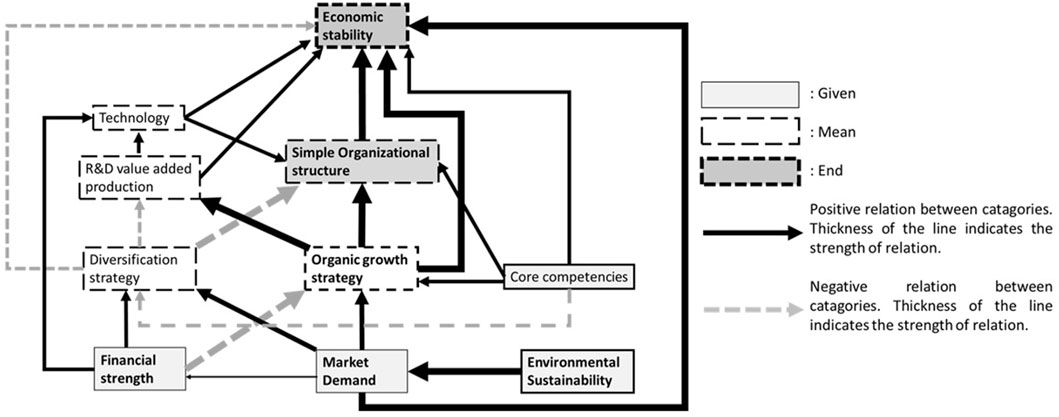
FIGURE 2. Concept of a cognitive map as exemplified through one of the current study cases (Company A in the fish/seafood sector).
The cognitive map for Company A in Figure 2 shows the causal relationships for the company’s decision categories in relation to sustainable development, here, ordered according to givens, means, and ends. The full black arrow in the map indicates positive relations between categories (e.g., market demand increase and economic stability increase), and the dotted gray arrows indicate negative relations between categories (e.g., diversification strategy increase and R&D value-added research decrease). The flow is kept unilateral in the map to reduce complexity in reading the map. The influence score from the domain analysis determines the thickness of the lines. For a detailed walkthrough of the CM procedure for the map in Figure 2, please see Supplementary Materials S11–S12.
3.4.3 Attribute substitution to determine decision maker biases and bias degree
The identification and classification of biases are based on the constructed cognitive maps and analyzed with the theory of AS by Kahneman and Shane (2002) to identify and classify biases in the cognitive maps through normative models. The normative model used in this study is based on the UN SDGs (see Supplementary Material S6, Supplementary Figure S1); a decision maker should consider and include biosphere, social, and economic categories when making decisions relating to sustainable development.
An attribute substitution* occurs when an individual must make a judgment that is computationally complex and instead substitutes a more easily calculated heuristic attribute. The process of defining a decision maker’s attribute substitution involves defining a hierarchy consisting of 1) the target attribute*, 2) the heuristic attribute*, and 3) the sub-attributes* (Kahneman and Shane, 2002). An in-depth explanation of this part of the methodological framework and the creation of the AS model in Figure 3 can be viewed in Supplementary Material S6.
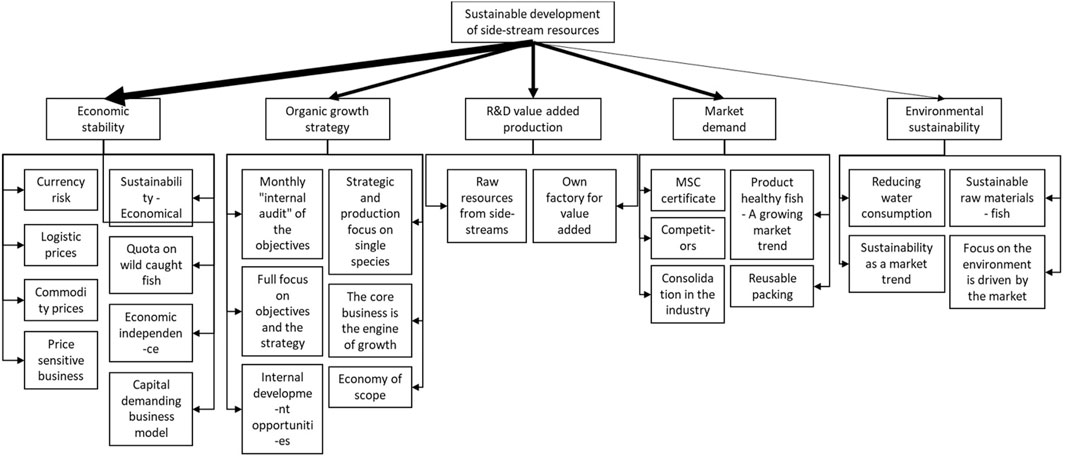
FIGURE 3. Example of attribute substitution—decision makers’ view of sustainable development of side-stream resources in Company A. For a larger version of this figure, see Supplementary Material S7.
An example of such an attribute substitution hierarchy can be viewed in Figure 3, where the cognitive map from the decision maker in Company A has been analyzed for heuristic attributes and sub-attributes.
In Figure 3, the decision maker’s attribute substitution can be defined as follows: the target attribute is the sustainable development of side-stream resources. The heuristic attributes are economic stability, organic growth strategy, R&D value-added production, market demand, and environmental sustainability. The sub-attributes in case of economic stability are currency risk, logistic prices, etc. The thickness of the lines indicates the relative importance of the heuristic attribute and the sub-attributes according to the importance score of these categories from Table 2.
These scores in combination with the AS model are used to identify which heuristic attributes and sub-attributes are over-weighted in the decision maker’s reasoning on the investigated target heuristic and are likely to influence the decision maker’s weighing of criteria in the AHP tool through different cognitive biases (Smith and Bahill, 2009). The decision maker in Company A would, in the example shown in Figure 3, be more predisposed to base decisions on these over-weighted parameters while omitting the other parameters, despite these being a part of their cognitive map on the investigated issue of sustainable development of side-stream resources. Furthermore, this hierarchy also shows that this decision maker’s attribute substitutions primarily are economic perspectives. Contrasting this to the normative model, this would indicate that the decision maker is omitting or under-weighting the aspects of sustainable development that are related to the categories of the biosphere and the society in their decision-making.
If a central theme is observed in the cognitive map, and this central theme is proven to influence the attribute substitution (e.g., the over-weighted heuristic attribute of economic stability and associated sub-criteria here-in), then the pattern of this central theme is matched against the known list of cognitive biases to determine which biases are influencing the decision maker in this weighting reasoning (Kahneman and Shane, 2002). To classify a bias, pattern matching is used in relation to the cognitive biases’ definition. Given that there is a magnitude of bias identified in the scientific literature, this list will only comprise seven of the most documented biases that have been replicated or observed outside of a laboratory setting. These biases are listed in Supplementary Table S2. The biases identified in the case of Company A’s attribute substitution are presented in Section 4.
In Section 4, we also propose that the degree of the identified biases is determined by multiplying the centrality rating score of a category with its average influence score from the CM procedure. The degree strong is assigned if the degree is > 1.5, moderate if the degree is < 1.50 and >1.00, and slight if the degree is < 1.00 and >0.50. To avoid overcorrection of the decision maker’s input or criteria weights, we suggest that only the bias degrees of strong or moderate are debiased because a slight degree of bias will not influence the decision process in any impactful way. This practice of taking the magnitude or degree of the bias into account when initializing a debiasing process is also suggested by Croskerry et al. (2013).
The following section will present the proposed debiasing process used in this study.
4 Results
Here, we show an example of the proposed debias process from actions 1 to 7 using a typical but hypothetical decision scenario for the decision maker in Company A, whose cognitive map and attribute substitution have been introduced in Section 3.4. The validation of the proposed method will be how well the debiased user ratings conform to the experts’ ratings for the different alternatives.
The typical decision scenario and hypothetical example were first chosen to test the model validity and robustness of the method. Second, the typical scenario and hypothetical example were applied in a general situation where an AHP process has not yet been conducted. Consequently, the decision situation and example are chosen due to a lack of empirical information on the first two actions since Company A has yet to complete an AHP session with an AHP tool.
4.1 The debiasing process of Company A—a hypothetical example to test model validity
The decision maker in Company A must, in this typical but hypothetical decision scenario, decide on which supplier to choose for the new production system for the processing of cod guts into new products, a side-stream resource from the primary cod fillet production.
The aim of the decision maker is to achieve the best environmental (lowest in criteria 4–6, see Table 1) and economic (highest in criteria 1 and 3 and lowest in criteria 2, see Table 1) options for the production. An additional aim is that the new production system must contribute to a low level of eutrophication so that the nutrients from the cod gut-processed water can be stored for further extraction to benefit other side-stream products. One option for the supplier is the current supplier (alternative A) for Company A. Furthermore, six new suppliers are also being evaluated, meaning that a total of seven alternatives are to be evaluated in this scenario.
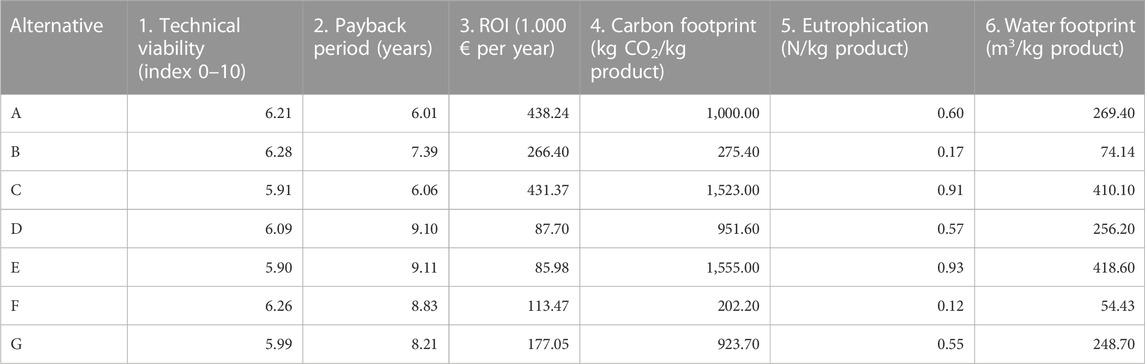
TABLE 1. Decision makers’ input values for each alternative that is being evaluated based on the six criteria.
4.1.1 Criteria and criteria weights determined in relation to action 1
The decision maker was tasked with creating a decision hierarchy (see Supplementary Material S8) by defining six criteria that should be used to evaluate each alternative in relation to the goal—a new production system for cod guts with a low level of eutrophication. A simulated pairwise comparison using the AHP method (Supplementary Material S14B) (Saaty, 1980) was used to define the initial user criteria weights for each of the six criteria as, respectively, 0.224, 0.146, 0.391, 0.113, 0.046, and 0.08.
4.1.2 Alternatives evaluated from decision-maker related to action 2
Normally, in action 2, the decision maker would be tasked with providing input values for each alternative in relation to the six criteria identified in action 1. However, in this typical but hypothetical decision scenario, the decision maker’s input was chosen at random from the simulated dataset in Supplementary Material S9.
To select the random alternative samples from the dataset, the Windows Excel function Rand was used to assign random numbers to each alternative in the dataset. Then, by using the sorting function based on random numbers with the condition of smallest to largest, the following samples were selected. This created the evaluation data presented in Table 1.
4.1.3 Decision maker’s biases and bias degrees related to action 3
After following actions 1 and 2 as described earlier, the procedure for determining the decision maker’s biases and bias degrees was conducted following the three procedures outlined in Section 3.3. Based on the interview with the decision maker of Company A (see Supplementary Material S10) and the thematic analysis of that interview, a list of categories in the cognitive map was identified following stages 1 and 2 in the CM procedure (see Supplementary Table S5).
4.1.4 Centrality analysis of the cognitive map under action 3
Following the identification of categories, the next stage in the CM procedure was a centrality analysis (see Supplementary Table S1). Here, the weighted cognitive centrality and rating scores are calculated to determine the most important categories for the decision maker in Company A, as shown in Supplementary Table S6.
4.1.5 Domain and GME analysis of cognitive map under action 3
Following the centrality analysis, the next stage in the CM procedure was the domain analysis to identify causal relationships for the case study (see Supplementary Table S1). The results of the domain analysis are shown in Supplementary Table S7, where the average influence score is also included. Following the domain analysis, a GME analysis was conducted, and the results from this analysis are shown in Supplementary Table S8. The data were then used to visualize the cognitive map for Company A in Figure 2 and can be viewed in Table 2 as a summary of the most important data from the CM procedure.
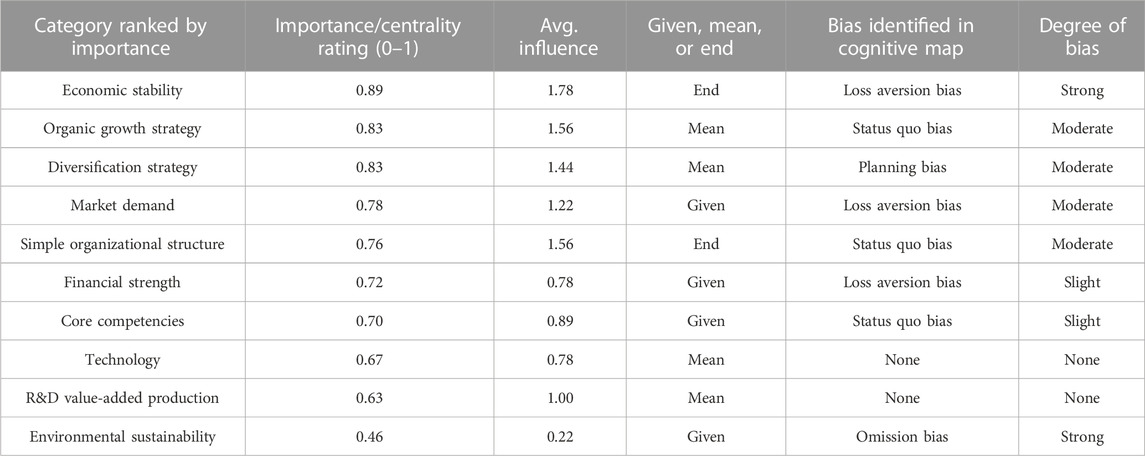
TABLE 2. Example of bias identified through the cognitive map of Company A.
4.1.6 Attribute substitution analysis under action 3
Next in action 3 was the case-specific attribute substitution, which is shown in Figure 3. The data from the AS model were used to identify biases through pattern matching of the biases described in Supplementary Table S2. The identification of the loss aversion bias and status quo bias from the AS model is given in the following section.
4.1.7 Identification of loss aversion bias
In Figure 3, it can be observed that the decision maker primarily views the sustainable development of side-stream resources from an economic focus based on market demand, value-added principles, and cost-effective management. The reason for this is that Company A has gone through a period of economic instability while trying to implement and execute its new diversification strategy. This caused a decrease in the company’s annual results in the period from 2014 to 2018, which the company is still trying to recover from.
While some foci were on other aspects, such as environmental sustainability, which was observed through a focus on reducing wastewater, it was clarified through the interview that this focus was primarily motivated by economic reasons rather than environmental reasons due to the previously mentioned poor economic performance. This caused Company A to focus more on securing the economic stability of the company through a focus on proven efficient existing business concepts rather than new business concepts, to avoid potential future loss situations.
This insight from the interview (see Supplementary Material S13) matches with the description of loss aversion bias found in Supplementary Table S2 and indicates that Company A would be inclined to overweight criteria related to the economic focus. This is also supported by the resulting importance and influence scores in Table 2, where the economic category economic stability was both the most important and the most influential category for the decision maker.
4.1.8 Identification of status quo bias
In Figure 3, it can be observed that the category organic growth strategy was also a central category to the views of Company A on sustainable development of side-stream resources. In the interview (Supplementary Material S13), it was described that the company previously had tried to diversify through a new diversification strategy but had not acquired the economic gains that were prospected due to shifting market demands and difficulties in using current core competencies while acquiring new competencies. To secure the financial strength and economic stability of the company, Company A reverted to the previous status quo of a simplified organizational structure with a strategic focus on organic growth again. This return to the original status quo has had implications on the company’s approach to technology and R&D decisions and strategic choices, as explained in the interview (Supplementary Material S13).
This insight from the interview (Supplementary Material S13) matches the description of status quo bias found in Supplementary Table S2 and indicates that Company A would be inclined to overvalue the alternatives that they have had experience or success with before. This is also supported by the importance scores and influence scores in Table 2, where the categories organic growth strategy stability and simple organizational structure were rated high in both importance and influence for the decision maker. In Table 2, the identified biases from the cognitive map of Company A with their degree are shown. For the identification of omission bias and planning bias, see Supplementary Material S13.
Since no AHP process has been carried out with Company A and environment-focused criteria are included in Table 1, no debiasing for omission bias is carried out on the formation of the decision maker’s decision hierarchy. In addition, since Company A no longer pursues a diversification strategy, no debiasing is carried out on the evaluations of the alternatives. This concludes action 3.
4.2 Debiasing techniques utilized in relation to action 4
Once the relevant biases are identified during action 3 (see Figure 1), the appropriate debiasing techniques can be applied in action 4 to generate the debiased decision scores in action 5b. Debiasing techniques for loss aversion bias and status quo bias used in this study are based on the study by Deniz (2020), as described in the following section.
4.2.1 Debiasing for loss aversion bias
Application: In evaluation situations where the decision maker has previously experienced economic losses because of changes to production, organizational structure, or strategy, the decision maker becomes sensitive to loss framings in investments, which causes an overweighting of economic criteria. Based on the study by Deniz (2020), debiasing for an identified loss aversion bias follows two stages:
1) The weight of other criteria is adjusted using the following formula:
(Wdi = debiased weight, Win = initial user weight of each criterion (i to n), Wmax = highest user weight, and W2 = second-highest user weight.)
2) Then, the highest initial user weight is set to the second-highest initial user weight. The reason for this practice is to continue acknowledging the importance that the decision maker has assigned to it.
4.2.2 Debiasing for status quo bias
Application: In evaluation situations where the decision maker has a strong preference for choosing an alternative (e.g., a supplier and a solution) that he/she had success with previously. This has made the decision maker reluctant to choose new alternatives due to the risk this imposes on their current business situation.
The debiasing technique is based on identifying the previous or the go-to alternative that the decision maker tends to choose. An adjustment of the ratings that the decision maker has made to the alternative is conducted. Deniz (2020) performed this by subtracting 1.00 from the decision maker’s evaluation of each criterion related to the biased alternative. This approach is, however, very scale sensitive since Deniz (2020) only used the method with a 1–5 scale for the evaluation of the alternatives. While it is possible to convert different scales into a 1–5 scale using normalization, the practice of reducing the evaluation of the biased alternative by 1 in each criterion creates a situation where the debiased alternative would often score lowest of all the alternatives. In this study, we have opted to instead reduce or increase the score in the weighted normalized decision matrix by 0.05 for the biased alternative. The decrease or increase is tied to how the ideal best and ideal worst values are defined in actions 5a and 5b. The reason for this change is so that this adjustment of the decision maker’s evaluation will not cause the biased alternative to automatically become the lowest-scoring alternative, but still ensures that the gap between the biased alternative and the other alternatives is reduced.
4.2.3 Debias criteria weighting and evaluation in action 4
Following the identification of loss aversion bias and status quo bias in Table 2, the debiasing techniques were applied to the initial user weights (Wi) described under action 1 and the weighted normalized decision matrix, respectively.
4.2.4 Loss aversion bias
The utilization of the debiasing technique for loss aversion bias resulted in the debiased weights (Wdi) presented in Table 3.
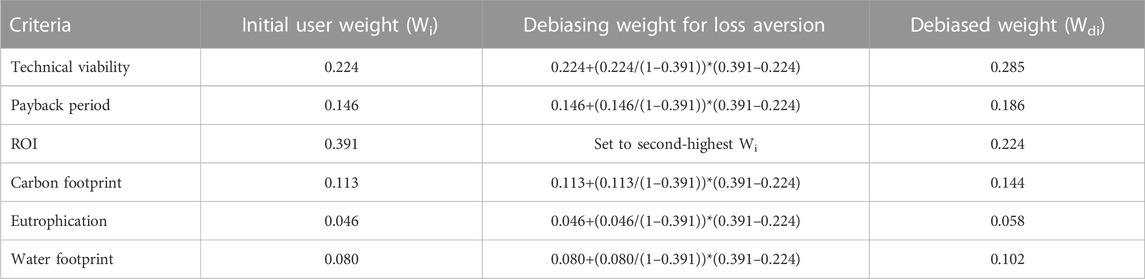
TABLE 3. Debiasing the initial user weights for the identified loss aversion bias from the cognitive map of Company A.
These initial user weights and debiased weights, in addition to experts’ weights (Wei; based on the equal weighting method), were accordingly used in action 5 for the weighted normalized decision matrix calculation.
4.2.5 Status quo bias
According to the decision scenario described under action 1, alternative A was defined as the go-to supplier for Company A. Given that the status quo bias was identified and determined to be moderate in its degree of influence in Table 2, this meant that the debiasing technique of adjusting the score for the biased alternative in the weighted normalized decision matrix by 0.05 was used in calculations carried out in Table 6.
4.2.6 Generation of weighted bias and debiased decision under actions 5a and 5b
To generate the final AHP score, TOPSIS calculations (Hwang and Yoon, 1981) were used based on the alternative inputs from Table 1 and the debiased weights from Table 4. This approach was repeated for the other weights and without the debiasing techniques applied. First, in the TOPSIS approach (Hwang and Yoon, 1981), the process was to calculate the normalized matrix (
(Xij = alternative input of each criterion).
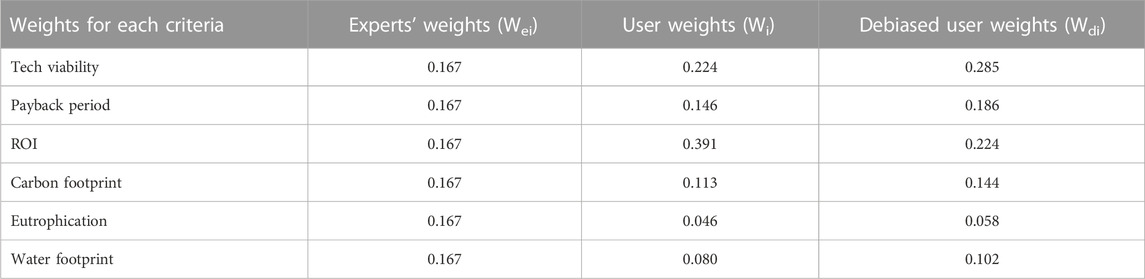
TABLE 4. Criteria weights set by experts, the user, and the debiased user weight following a loss aversion debiasing.
This resulted in the normalized decision matrix shown in Table 5. Here, alternative A was noted as biased because it has not been corrected for status quo bias at this point in the TOPSIS approach.
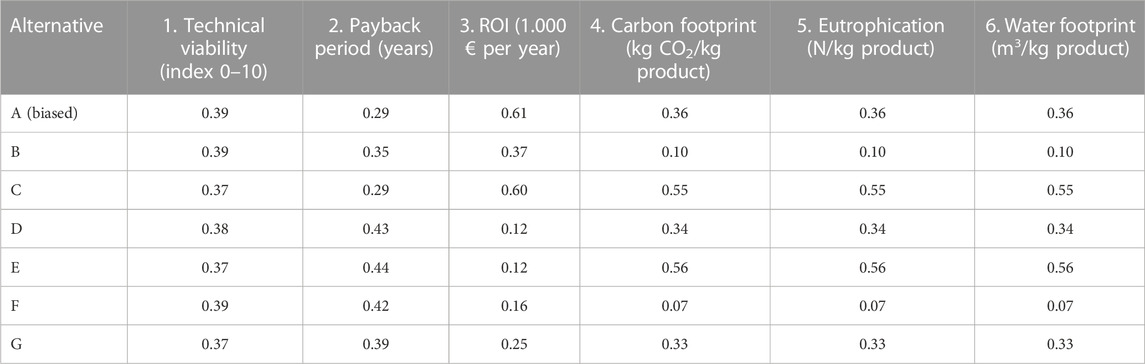
TABLE 5. Normalized decision matrix for Company A.
Next in the TOPSIS approach was the assignment of the ideal best and ideal worst values for each criterion, followed by the calculation of the weighted normalized matrix (
• Tech viability—highest index score (Vmax score)
• Eco viability payback period—lowest payback period in years (Vmin score)
• ECO viability ROI—highest 1.000 € per year (Vmax score)
• ENVIRO carbon footprint—lowest kg CO2/kg product (Vmin score)
• ENVIRO eutrophication—lowest N/kg product (Vmin score)
• ENVIRO water footprint—lowest m3/kg product (Vmin score)
Reverse logic was then applied to define the ideal worst value for the six criteria (Hwang and Yoon, 1981). The weighted normalized decision matrix (Vij) was calculated based on the values in Table 5 using the following formula:
At this point, the debiasing technique for status quo bias was applied to the weighted normalized matrix calculation for alternative A only (Va) using the modified formula of Eq. 3:
In Table 6, the results are shown by alternative A being noted as debiased. The values from the Va followed the same type of calculations but replaced Vij when calculating the Euclidean distance for ideal best and ideal worst values for alternative A. Next, the Euclidean distance from the ideal best value (Si+) was calculated using the following formula:
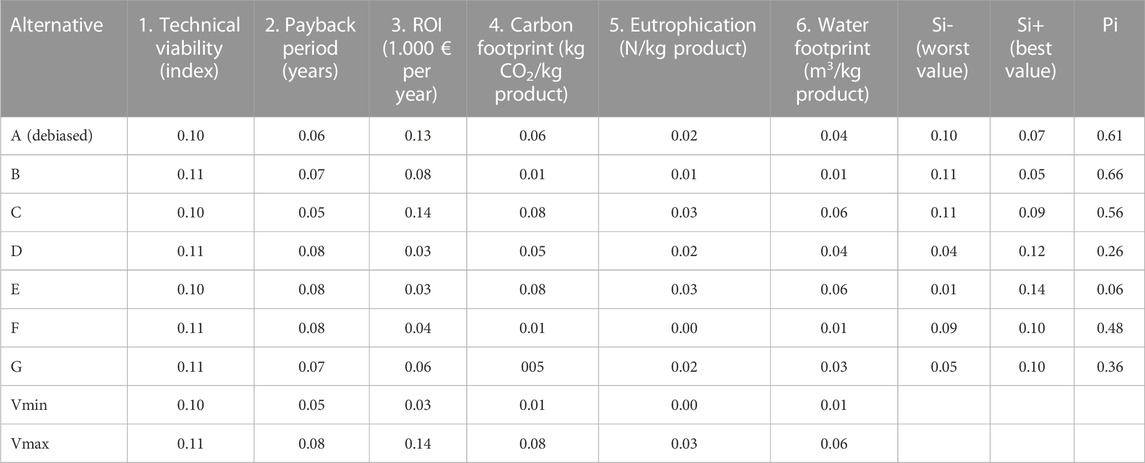
TABLE 6. Weighted normalized decision matrix for Company A with calculated performance score (Pi) of each alternative (A–G) based on their
Then, the Euclidean distance from the ideal worst value (Si-) was calculated using the following formula:
With the ideal best and ideal worst values, the calculated performance score (Pi) for each alternative was finally calculated with Eq. 7, resulting in the weighted normalized decision matrix given in Table 6.
4.2.7 Ranking of alternatives under action 6
With the Pi score from Table 6, it was possible to rank the different alternatives based on their Pi rating, as shown in Table 7. This enables us to conclude which alternative would be the optimal local evaluated decision in this case-specific application.
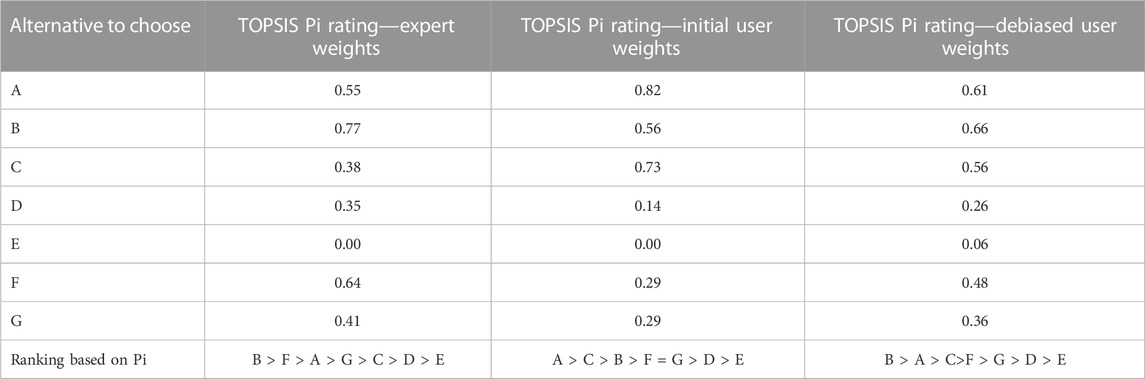
TABLE 7. Final AHP score matrix using expert weights, user weights, and debiased user weights. Pi stands for performance score.
4.2.8 Enacting the optimal evaluated decision under action 7
With the ranking of alternatives for each weight type (expert, initial user, and debiased user), the decision for the optimal local evaluated alternative was made. Based on the Pi for expert weights and debiased user weights, the optimal local evaluated decision for the decision maker to enact is alternative B to achieve the best environmental and economic option for the production.
5 Discussion
To choose the alternative to enact in action 7, a ranking based on the Pi score was made central to this action, and the proposed method was able to correct the biases of the decision maker from Company A in this typical but hypothetical scenario, as shown in Table 7.
When using the expert weights as a benchmark for validating the chosen alternative, it generated the ranking B > F > A > G > C > D > E (Table 7), on which alternative B should be enacted. When using the initial user weights for the alternatives, it generated the ranking A > C > B > F = G > D > E (Table 7), where alternative A would be the suggested option for the decision maker to enact, while alternative B has been reduced to the third-best alternative to enact.
Reviewing the alternative input in Table 1 shows that while alternative A has the highest input values for technical viability, payback period, and ROI, it has one of the worst inputs for carbon footprint, eutrophication, and water footprint. Choosing this alternative would accordingly be in contradiction to the aim of achieving the best environmental and economic option for the production.
When using the debiased weights for the alternatives, it corrected the previous ranking and generated B > A > C > F > G > D > E (Table 7). Consulting the Pi for the debiased user weight shows that the decision maker should choose alternative B to enact, which is in line with the Pi for the expert weights.
Reviewing the alternative input in Table 1 shows that alternative B has the third-best input values in technical viability, payback period, and ROI behind alternatives C and A, while it has the second-best input values for carbon footprint, eutrophication, and water footprint after alternative F. Choosing alternative B would, therefore, achieve a good balance between the environmental and economic criteria and enable the decision maker to realize the aim of the best environmental and economic option for the production. By applying the debiasing techniques, the final ranking of suggested alternatives was corrected for the identified bias.
To evaluate the robustness of the proposed debiasing method with respect to changing the relative criteria weights of the user, a graphical method-based sensitivity analysis (Frey and Patil, 2002) of relative criteria weights by a user was conducted. To obtain relative criteria weights, a simulation was established, which simulates a pairwise comparison procedure, as described in the AHP methodology (Saaty, 1980). Given that the analysis of Company A’s cognitive map show that a loss aversion bias is present and causes an overweighting of the economic criteria payback period and ROI, this still has to be reflected in the criteria weights following a pairwise comparison. To test this, an additional simulation was designed to conduct the pairwise comparison where these two criteria could not be weighted lower in importance than the other criteria, thus ensuring a higher weighting for these two criteria. This simulation created eight new initial user criteria weights, which are shown together with the AHP calculations to achieve the weights in Supplementary Materials S14A, B. Once the simulated initial user criteria weights were created, they were run through the same process, as shown in Section 4 and Figure 4, representing the results from this process. The sensitivity analysis and figure were created in Microsoft Excel using the Visual Basic Application programming language and can be viewed in Supplementary Material S14C.
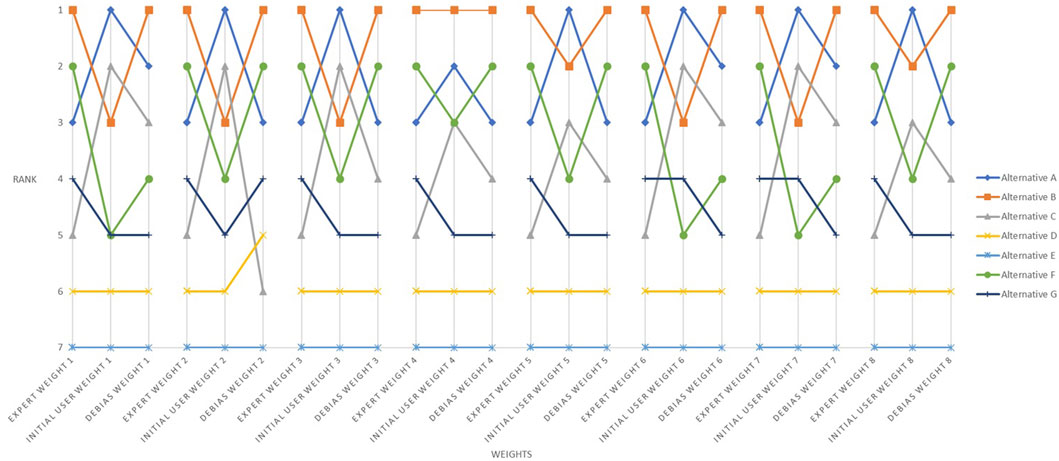
FIGURE 4. Sensitivity analysis. The sensitivity analysis is based on the ranking results when applying the simulated initial user criteria weights to the AHP tool and then debiasing these weights.
According to Figure 4, it is evident that the ranking results are, to some extent, dependent on the weights that a user assigns to the different criteria. In seven out of eight cases, the user initial weights would lead to alternative A being evaluated as the optimal local evaluated decision; however, in the same number of cases, the debiased weights are able to correct the ranking of the optimal local evaluated decision to alternative B. Consequently, it is reasonable to assume that the proposed debiasing method is robust to changes in the initial user weights and that Company A should select alternative B as this alternative achieves the best balance between the environmental and economic criteria, which was the actual aim with this decision scenario.
However, there are some limitations in the approach which need to be addressed. One of the main limitations of the study was the reliance on randomly selected simulated data for the results, which decreases the validity of the conclusions in this case study. To gather actual AHP input data in actions 1 and 2 from Company A and analyze those using the proposed method would, therefore, be one of the future goals in relation to the study.
The proposed debiasing method and the sensitivity analysis are based on one comprehensive case study, making it difficult to determine the robustness of the method to other case studies where the context of the decision might be different. However, in the current examined case study, the type of decisions and the decision process are quite generic, and here, the method was shown to be robust to the changes in the initial user weights. Future studies should test the robustness by expanding the number of case studies in a sensitivity analysis to further validate and verify the proposed method and to expand the literature in this rather new research field.
Another limitation of the case-specific application of the method is testing with expert weights that are based on an equal weighting method, while other weighting methods potentially used by experts are so far untested. This is an issue also raised in the literature within the research field (Ma et al., 2017; Haeri and Rezaei, 2019; Deniz, 2020). This can potentially lead to decreased method general applicability and robustness because different experts may consider some criteria to be more significant while other experts may consider them insignificant. An example of this is to weight the different SDGs against each other. Here, some experts claim that they should be weighted equally (Eppinga et al., 2020), while others claim that the environment-related SDGs are more significant than the economic-related SDGs (Eppinga et al., 2020; Stockholm Resilience Centre, 2016). Such conflicts on what is considered significant or insignificant criteria by experts can have implications for the results of this or any other case study. However, it will be easy to modify and parameterize the method to include different weighting of different criteria, and as such, the generic method is not limited by this but can be used in scenario testing of different weighting methods. This limitation will require future investigations to conclude the method’s robustness in a case-specific context against different weighting methods used by experts on the issue of side-stream utilization.
Another limitation and a potential source of lacking robustness in the proposed method stems from the bias identification in action 3. Beyond the time required to gather the interview data and analysis using the different procedures described under action 3, a large responsibility is placed on the conductor of analysis to not only handle the vast amount of qualitative data correctly but also to analyze these as objectively as possible. Therefore, an emphasis was made to enhance both the construct validity and the internal validity during action 3 to reduce any researcher bias by using the following precautions (Brinkmann and Tanggaard, 2015).
To improve the study’s construct validity, the following procedure was used: multiple sources of evidence (interviews, annual reports, press releases, etc.), focusing on maintaining the chain of evidence, and organizing the data and documenting the data appropriately, as shown in Supplementary Materials S10–S13. In addition, the construct validity was strengthened by having the cognitive map and following AS model reviewed by decision makers who participated in the interview (Brinkmann and Tanggaard, 2015; Yin, 2014). To improve the internal validity of this study, explanation building was applied to build an explanation of the case that is fundamental in a theoretical explanation (Yin, 2014). This was carried out by pattern-matching the recurring themes from the interview with the theoretical definitions of cognitive biases and documenting their match. For this, see Supplementary Material S13.
Due to this reliance on the conductor of analysis, it may be difficult to achieve a complete reproduction of the bias identification results from action 3. A way to improve the CM procedure and subsequent AS procedure in action 3 may be to reduce the conductor of analysis involvement in the creation of the cognitive map and focus more on a self-Q method, as shown by Tegarden and Sheetz (2003). In their method, the decision maker is responsible for providing the input to create a cognitive map through an automated WWW-based system or software program developed for this action, which would limit the conductor of analysis involvement.
The application to different decision contexts also needs to be further explored for the proposed method. In this study, the decision context is rooted in increasing side-stream utilization in the seafood industry. However, other food industries that also seek to increase the utilization of their side-stream or other waste resources for both economic gains and positive environmental impact could also use this proposed generic method to assist their decision process. The main limiting factor to the application of the method is whether a company uses MCDM tools in their decision-making process or not. As MCDM tools are generally used in many different contexts and industries (Ernest and Gass, 2001; Munier and Hontoria, 2021), the MCDM context will not be an issue as has been demonstrated in the already established literature in this field (Ma et al., 2017; Arabsheybani et al., 2018; Qian et al., 2019; Deniz, 2020). Naturally, limitations in the application would occur in the case that the company does not use MCDM tools in their decision-making process. In this case, the proposed method can only be applied to identify the biases and not correct for these since the techniques used by the proposed method are focused on correcting the initial user weights that are used in the MCDM tools’ calculations. In this case, process-oriented debiasing techniques (Gilovich et al., 2002; Croskerry et al., 2013) will have to be used instead as an intervention in the company’s decision-making process.
6 Conclusion and future perspectives
Based on the proposed methodology and application of a typical case, it was possible to identify and determine the degree of cognitive biases to which the decision maker was influenced and correct for these. This is carried out by implementing the relevant debiasing techniques into an AHP tool to improve the quality and performance of the tool by reducing the influence of overweighted user weights. Thus, it leads us to reject the zero hypothesis and realize the aims set in this study.
This study and its results provide the industry and science with a structured method to identify several decision-making biases and correct for these in an AHP context. The proposed method enables to identify more than one cognitive bias, which is the current limit in the AHP methodology. Furthermore, it enables companies and researchers to correct for these biases, which can assist companies in achieving greater objectivity in their decision process that balances out the goals of achieving both economic gains and more environmentally sound production with side-stream resources.
The issue of biased decision-making not only contributes to problems in the seafood industry but also in other food production industries, policy, medicine, and education. Thus, the application of the proposed method shown here is not limited to just one sector or industry and, for that matter, Europe as a region. The only limitation to the application in the global context is whether a company or organization uses MCDM tools in their decision-making process or not. While this study only has shown the application of debiasing techniques in relation to AHP with TOPSIS, it would not be difficult to apply the proposed method to other MCDM tools such as SMART, SWING, and Expert Choice. This range of possible applications outside the seafood industry and the AHP methodology would be of significant interdisciplinary interest and relevance but would require further testing of the proposed method within these settings.
As a future direction, it would be important to develop, test, and compare with similar computational debiasing techniques as those for loss aversion bias and status quo bias for other cognitive and motivational biases described in the heuristics* and bias literature. The goal would be to have an index consisting of a suit of debiasing techniques where their conditional application and correcting method are described, as shown in Section 4.2.
The general applicability of the proposed method needs to be addressed. Since the study is based on a single case study in the western European seafood industry, its generalization claim is not yet fully explored (Runkel & McGrath, 1972). To improve the generalization of the method, more case studies from the European seafood industry should be explored to enable statistical testing of whether the debiasing techniques of the proposed method can produce the same results in different decision contexts and, thus, support generic applicability and robustness of results (Runkel & McGrath, 1972). Furthermore, there remains the issue of generalization beyond the European seafood industry, which will require more data to build a catalog of case studies for these regions so a further argument for generalization can be made. Therefore, creating this catalogue is another future direction from this study that needs to be expanded. Here, the generic and transparent design of the proposed method will ensure ease of application in these new case studies.
Data availability statement
The original contributions presented in the study are included in the article/Supplementary Material, further inquiries can be directed to the corresponding author.
Ethics statement
Ethical review and approval were not required for the study on human participants in accordance with the local legislation and institutional requirements. Written informed consent for participation was not required for this study in accordance with the national legislation and institutional requirements.
Author contributions
Lead author SS was responsible for the stage of conception and design of Section 1 and Section 2, data acquisition for the cognitive maps, solution method in Section 1 and Section 2, analysis in Section 3, and interpretation of results in Section 4 of the manuscript with input from the co-authors. SS was responsible for drafts and ensuring that revisions from the co-authors were included in the manuscript. SS approved the final version of the manuscript and agreed on accountability for all aspects of the work. Co-authors: DM, GF, MG, BC, JN, and EL. The co-authors aided the lead author in the conception and design of the proposed methodology in Section 3 and the manuscript. In addition, the co-authors, with the exception of JN and EL, contributed to data acquisition in the form of the simulated data used by the lead author in Section 4, which can be viewed in Supplementary Material S8. The text in Supplementary Material S8 is contributed by them. All co-authors were instrumental in reviewing and critiquing the manuscript. All authors contributed to the article and approved the submitted version.
Funding
WASEABI project has received funding from the Bio Based Industries Joint Undertaking (JU) under grant agreement No 837726. This communication reflects only the author’s view, and the JU is not responsible for any use that may be made of the information it contains.
Conflict of interest
The authors declare that the research was conducted in the absence of any commercial or financial relationships that could be construed as a potential conflict of interest.
Publisher’s note
All claims expressed in this article are solely those of the authors and do not necessarily represent those of their affiliated organizations, or those of the publisher, the editors, and the reviewers. Any product that may be evaluated in this article, or claim that may be made by its manufacturer, is not guaranteed or endorsed by the publisher.
Supplementary material
The Supplementary Material for this article can be found online at: https://www.frontiersin.org/articles/10.3389/frfst.2023.1068974/full#supplementary-material
Footnotes
*The “*” symbol indicates a concept or expression explained by the glossary in Supplementary Material S1—first occurrence only.
References
Abara, I. O. C., and Singh, S. (1993). Ethics and biases in technology adoption: The small-farm argument. Technol. Forecast. Soc. Change 43 (3–4), 289–300. doi:10.1016/0040-1625(93)90057-E
Alessio, I., and Ashraf, L. (2009). Analytic hierarchy process and expert choice: Benefits and limitations. OR Insight 22 (4), 201–220. doi:10.1057/ori.2009.10
Almashat, S., Ayotte, B., Edelstein, B., and Margrett, J. (2008). Framing effect debiasing in medical decision making. Patient Educ. Couns. 71, 102–107. doi:10.1016/j.pec.2007.11.004
Arabsheybani, A., Paydar, M. M., and Safaei, A. S. (2018). An integrated fuzzy MOORA method and FMEA technique for sustainable supplier selection considering quantity discounts and supplier’s risk. J. Clean. Prod. 190 (10), 577–591. doi:10.1016/j.jclepro.2018.04.167
Axelrod, R. (1976). “The mathematics of cognitive maps,” in Structure and decision: The cognitive maps of political elites (Princeton, NJ, USA: Princeton University Press), 180–217.
BBI (2018). BBI. Available at: https://ec.europa.eu/info/funding-tenders/opportunities/portal/screen/opportunities/topic-details/bbi.2018.so1.r1.
Borrero, S., and Henao, F. (2017). Can managers be really objective? Bias in multicriteria decision analysis. Acad. Strategic Manag. J. 39 (1), 244–259.
Braun, V., and Clarke, V. (2006). Using thematic analysis in psychology. Qual. Res. Psychol. 3 (2), 77–101. doi:10.1191/1478088706qp063oa
Buchanan, J. T., and Corner, J. L. (1997). The effects of anchoring in interactive MCDM solution methods. Comput. Oper. Res. 24, 907–918. doi:10.1016/S0305-0548(97)00014-2
Businessinsider.com (2017). Businessinsider.com. Available at: https://www.businessinsider.com/surprising-everyday-products-made-from-cow-parts-2017-10?r=US&IR=T.
Coppola, D., Lauritano, C., Palma Esposito, F., Riccio, G., Rizzo, C., and de Pascale, D. (2021). Fish waste: From problem to valuable resource. Mar. drugs 19 (2), 116. doi:10.3390/md19020116
Costello, C., Cao, L., Gelcich, S., Cisneros-Mata, M. A., Free, C. M., Froehlich, H. E., et al. (2020). The future of food from the sea. Nature 588, 95–100. doi:10.1038/s41586-020-2616-y
Croskerry, P., Singhal, G., and Mamede, S. (2013). Cognitive debiasing 1: Origins of bias and theory of debiasing. BMJ Qual. Saf. 23, 58–64. doi:10.1136/bmjqs-2012-001712
Deniz, N. (2020). Cognitive biases in MCDM methods: An embedded filter proposal through sustainable supplier selection problem. J. Enterp. Inf. Manag. 33 (5), 947–963. doi:10.1108/JEIM-09-2019-0285
Eppinga, M. B., Mijts, E. N., and Santos, M. J. (2020). Ranking the sustainable development goals: Perceived sustainability priorities in small island states. Sustain Sci. 17, 1537–1556. doi:10.1007/s11625-022-01100-7
Ernest, F. H., and Gass, S. I. (2001). The analytic hierarchy process - an exposition. Operations Res. 49 (4), 469–486. doi:10.1287/opre.49.4.469.11231
FAO (2020). The state of the world fisheries and aquaculture: Sustainability in action. Rome: FAO. doi:10.4060/ca9229en
Farmery, A. K., Alexander, K., Anderson, K., Blanchard, J. L., Carter, C. G., Evans, K., et al. (2021). Food for all: Designing sustainable and secure future seafood systems. Rev. Fish. Biol. Fish. 32, 101–121. doi:10.1007/s11160-021-09663-x
Frey, C. H., and Patil, S. R. (2002). Identification and review of sensitivity analysis methods. Risk Anal. 22 (3), 553–578. doi:10.1111/0272-4332.00039
Gilovich, T., Griffin, D. W., and Kahneman, D. (2002). Heuristics and biases: The psychology of intuitive judgement. 1st ed. Cambridge, UK: Cambridge University Press.
Guillen, J., Holmes, S. J., Carvalho, N., Casey, J., Dörner, H., Gibin, M., et al. (2018). A review of the European union landing obligation focusing on its implications for fisheries and the environment. Sustainability 10 (4), 900. doi:10.3390/su10040900
Hwang, C. L., and Yoon, K. (1981). Multiple attribute decision making: Methods and applications. New York: Springer-Verlag.
Kahneman, D., and Shane, F. (2002). “Representativeness revisited: Attribute substitution in intuitive judgment,” in Heuristics and biases: The psychology of intuitive judgment. Editors T. Gilovich, D. Griffin, and D. Kahneman (Cambridge: Cambridge University Press), 49–81. doi:10.1017/CBO9780511808098.004
Liberatore, M., and Nydick, R. (2008). The analytic hierarchy process in medical and health care decision making: A literature review. Eur. J. Operational Res. 189 (1), 194–207. doi:10.1016/j.ejor.2007.05.001
Ma, W., Luo, X., and Jiang, Y. (2017). Multicriteria decision making with cognitive limitations: A DS/AHP-based approach. Int. J. Intell. Syst. 32, 686–721. doi:10.1002/int.21872
Mo, W. Y., Man, Y. B., and Wong, M. H. (2018). Use of food waste, fish waste and food processing waste for China’s aquaculture industry: Needs and challenge. Sci. Total Environ. 613, 635–643. doi:10.1016/j.scitotenv.2017.08.321
Mohan, S. V., Varjani, S., Pant, D., Sauer, M., and Chang, J. S. (2020). Circular bioeconomy approaches for sustainability. Bioresour. Technol. 318, 124084. doi:10.1016/j.biortech.2020.124084
Montebeller, G., and Von Winterfeldt, D. (2015). Cognitive and motivational biases in decision and risk analysis. Risk Anal. 35 (7), 1230–1251. doi:10.1111/risa.12360
Mu, E., and Pereyra-Rojas, M. (2017). “Practical decision making - an introduction to the analytic hierarchy process (AHP) using super decisions V2,” in Springer briefs in operations research (Cham, Switzerland: Springer Nature).
Munier, N., and Hontoria, E. (2021). Uses and limitations of the AHP method: A non-mathematical and rational analysis. New York: Springer.
Qian, X., Fang, S. F., Huang, M., and Wang, X. (2019). Winner determination of loss-averse buyers with incomplete information in multiattribute reverse auctions for clean energy device procurement. Energy 177, 276–292. doi:10.1016/j.energy.2019.04.072
Runkel, P. J., and McGrath, E. J. (1972). Research on human behavior: A systematic guide to method. New York: Holt Rinehart & Winston.
Rustad, T., Storrø, I., and Slizyte, R. (2011). Possibilities for the utilisation of marine by-products. Int. J. Food Sci. Technol. 46, 2001–2014. doi:10.1111/j.1365-2621.2011.02736.x
Schubel, J. R., and Thompson, K. (2019). Farming the sea: The only way to meet humanity's future food needs. GeoHealth 3, 238–244. doi:10.1029/2019GH000204
Shahidi, F., Varatharajan, V., Peng, H., and Senadheera, R. (2019). Utilization of marine by-products for the recovery of value-added products. J. Food Bioact. 6. doi:10.31665/JFB.2019.6184
Shavandi, A., Hou, Y., Carne, A., McConnell, M., and Bekhit, A. E.-d. A. (2019). Marine waste utilization as a source of functional and health compounds. Adv. Food Nutr. Res. 87, 187–254. doi:10.1016/bs.afnr.2018.08.001
Shepon, A., Eshel, G., Noor, E., and Milo, R. (2016). Energy and protein feed-to-food conversion efficiencies in the US and potential food security gains from dietary changes. Environ. Res. Lett. 11 (10), 105002. doi:10.1088/1748-9326/11/10/105002
Smith, E. D., and Bahill, A. T. (2009). Attribute substitution in systems engineering. Syst. Eng. 13, 130. doi:10.1002/sys.20138
Stevic, Z., Pamučar, D., Puška, A., and Chatterjee, P. (2020). Sustainable supplier selection in healthcare industries using a new MCDM method: Measurement of alternatives and ranking according to Compromise solution (MARCOS). Comput. Industrial Eng. 140, 106231. doi:10.1016/j.cie.2019.106231
Stockholm Resilience Centre (2016). Stockholm resilience Centre. Available at: https://www.stockholmresilience.org/research/research-news/2016-06-14-the-sdgs-wedding-cake.html (Accessed 02 16, 2022).
Tegarden, D. P., and Sheetz, S. D. (2003). Group cognitive mapping: A methodology and system for capturing and evaluating managerial and organizational cognition. Omega 31, 113–125. doi:10.1016/S0305-0483(03)00018-5
Van der Meer, J. (2020). Limits to food production from the sea. Nat. Food 1, 762–764. doi:10.1038/s43016-020-00202-8
WaSeaBi (2021). WaSeaBi. Available at: https://www.waseabi.eu/about-waseabi/.
Windelband, W. (1998). History and natural science. Theory Psychol. 8 (1), 5–22. doi:10.1177/0959354398081001
Keywords: seafood processing, reduction of food wastes and by-products in food processing, sustainability in food processing, modeling of food processing, decision support systems, analytic hierarchy process (AHP), case-specific cognitive biases, debiasing techniques
Citation: Schrøder SE, San Martin D, Foti G, Gutierrez M, Iñarra Chastagnol B, Nielsen JR and Larsen E (2023) Making the objectively best choice for side-stream resources—Verification of a debiasing method based on cognitive maps and attribute substitution. Front. Food. Sci. Technol. 3:1068974. doi: 10.3389/frfst.2023.1068974
Received: 13 October 2022; Accepted: 10 February 2023;
Published: 09 March 2023.
Edited by:
Jose Manuel Lorenzo, Centro Tecnologico de la Carne, SpainReviewed by:
Meleksen Akin, Iğdır Üniversitesi, TürkiyeSerafim Bakalis, University of Copenhagen, Denmark
Copyright © 2023 Schrøder, San Martin, Foti, Gutierrez, Iñarra Chastagnol, Nielsen and Larsen. This is an open-access article distributed under the terms of the Creative Commons Attribution License (CC BY). The use, distribution or reproduction in other forums is permitted, provided the original author(s) and the copyright owner(s) are credited and that the original publication in this journal is cited, in accordance with accepted academic practice. No use, distribution or reproduction is permitted which does not comply with these terms.
*Correspondence: Søren Espersen Schrøder, c29zY0BhcXVhLmR0dS5kaw==