 Akitoshi Makino1
 Keiichi Yamaguchi1,2Daichi Sumi2,3
 Masaru Ichikawa4Masumi Ohno5Akinori Nagano1
 Kazushige Goto1*
- 1Graduate School of Sport and Health Science, Ritsumeikan University, Shiga, Japan
- 2Research Fellow of Japan Society for the Promotion of Science, Tokyo, Japan
- 3Research Center for Urban Health and Sports, Osaka City University, Osaka, Japan
- 4Institute of Sport Science, ASICS Corporation, Hyogo, Japan
- 5Business Incubation Department, ASICS Corporation, Hyogo, Japan
Background: Physically active status is an important contributor to individual health. Walking is regarded as commonly accepted exercise for exercise promotion. Particularly, interval fast walking (FW), consisting of alternating between fast and slow walking speeds, has gained popularity from practical viewpoints. Although previous studies have determined the short- and long-term effects of FW programs on endurance capacity and cardiovascular variables, factors affecting these outcomes have not been clarified. In addition to physiological variables, understanding of mechanical variables and muscle activity during FW would be a help to understand characteristics of FW. In the present study, we compared the ground reaction force (GRF) and lower limb muscle activity between fast walking (FW) and running at equivalent speeds.
Method: Eight healthy men performed slow walking (45% of the maximum walking speed; SW, 3.9 ± 0.2 km/h), FW (85% of the maximum walking speed, 7.4 ± 0.4 km/h), and running at equivalent speeds (Run) for 4 min each. GRF and average muscle activity (aEMG) were evaluated during the contact, braking, and propulsive phases. Muscle activities were determined for seven lower limb muscles: gluteus maximus (GM), biceps femoris (BF), rectus femoris (RF), vastus lateralis (VL), gastrocnemius medialis (MG), soleus (SOL), and tibialis anterior (TA).
Results: The anteroposterior GRF was greater in FW than in Run during the propulsive phase (p < 0.001), whereas the impact load (peak and average vertical GRF) was lower in FW than in Run (p < 0.001). In the braking phase, lower leg muscle aEMGs were higher during Run than during SW and FW (p < 0.001). However, in the propulsive phase, soleus muscle activity was greater during FW than during Run (p < 0.001). aEMG of tibialis anterior was higher during FW than during SW and Run in the contact phase (p < 0.001). No significant difference between FW and Run was observed for HR and RPE.
Conclusion: These results suggest that the average muscle activities of lower limbs (e.g., gluteus maximus, rectus femoris, and soleus) during the contact phase were comparable between FW and running, however, the activity patterns of lower limb muscles differed between FW and running, even at equivalent speeds. During running, muscles were mainly activated in the braking phase related to impact. In contrast, during FW, soleus muscle activity during the propulsive phase was increased. Although cardiopulmonary response was not different between FW and running, exercise using FW might be useful for health promotion among individuals who cannot exercise at high-intensity.
1. Introduction
Daily physical activity is associated with improved cardiopulmonary function (1) and increased muscle mass and strength (2). Reduced physical activity leads to metabolic disturbances and related diseases, including insulin resistance (3), hyperglycemia (4), and atherosclerosis (5). Increased energy expenditure (EE) during exercise also reduces the risk of cardiovascular diseases (6). Therefore, strategies to increase exercise-induced EE are essential for health promotion.
Walking is widely accepted exercise modality among the adults (7, 8). Particularly, interval fast walking (FW), consisting of alternating between fast and slow walking speeds, has gained popularity from practical viewpoint. Cycling (pedaling) exercise is generally easy to perform but requires a stationary bike. Running does not require equipment but may pose risks of injury for those with orthopedic or other medical problems. On the other hand, it was reported that walking has a lower risk of injury than running (9). Previous studies have demonstrated improvements in maximal oxygen uptake, blood pressure, and heart rate after 5 months of FW (≥ 5 sets of FW at 70%–85% of peak aerobic capacity followed by slow walking at ≤ 40% of peak aerobic capacity; 3 min per set) (10, 11). Interval FW for 2 weeks improved insulin sensitivity, while reducing 24 h maximum glucose levels and mean amplitudes of glycemic excursion, in patients with type 2 diabetes (12).
Although previous studies have established the short- and long-term effects of FW programs on endurance capacity and cardiovascular variables, factors influencing these outcomes have not been investigated (10, 12). In our previous study, we demonstrated that EE and carbohydrate oxidation during walking were enhanced in a non-linear manner with increasing speed. It was notable that walking at speeds > 8.0 km/h caused greater EE and carbohydrate oxidation than running at an equivalent speed in young individuals (13). Moreover, previous studies reported that interval walking for 17 weeks or 5 months increased muscle strength of knee extensors and flexors muscles (14, 15),. Although Kubo et al. (16) reported that a walking exercise program for six months increased muscle strength of the knee flexors, no significant increase in muscle strength of the knee extensors was found.
In addition to physiological variables, understanding of mechanical variables and muscle activity during FW would be a help to clarify characteristics of FW. Walking speeds influence biomechanical variables such as joint kinematics, GRFs, joint moments of moments and powers, muscle activities, and spatiotemporal gait parameters (17). Previous studies compared GRFs (18) and muscle activity of the lower limbs (19) among different walking speeds. However, in these studies, no significant differences in GRFs were found between slow and normal speeds. Hence, comparisons of both GRFs and lower limbs of muscle activity between FW and running are currently required.
Therefore, the purpose of the present study was to compare the ground reaction force (GRF) and lower limb muscle activity between FW and running at equivalent speeds. We hypothesized that the GRF would be lower during FW than during running. Moreover, we hypothesized that lower limb muscle activity during FW would be mainly enhanced in the propulsive phase, whereas it would be activated in the braking phase while running.
2. Materials and methods
2.1. Participants
Eight men were recruited in the present study (mean ± standard deviation: age, 22 ± 1 y; height, 172.1 ± 1.7 cm; weight, 62.1 ± 7.0 kg); they received an overview of the experiment and possible risks (Table 1). None of them had any history of chronic diseases that could affect neuromuscular function, exercise, or daily physical activity. All participants were not involved in any training programs at the start of the study. Written informed consent was obtained from all participants. This study was approved by the ethics committee for Human Experiments at Ritsumeikan University (BKC-IRB-2020–047) and was conducted in accordance with the Declaration of Helsinki.
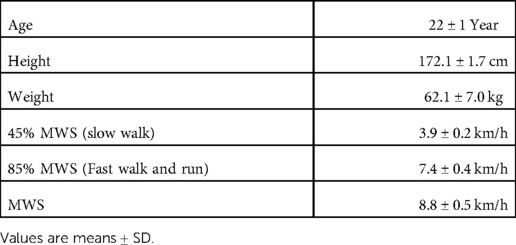
Table 1. Physical characteristics of the subjects and walking speed variables.
2.2. Experimental overview
Participants visited the laboratory twice throughout the experimental period. On the first visit, a familiarization session and determination of the maximal walking speed (MWS) were conducted. On the second visit, each participant performed the main experimental trials, consisting of slow walk trial, FW and Run trial. The anteroposterior and vertical GRF components, surface electromyography (EMG) of lower limb muscles were evaluated during each trial.
2.3. Exercise protocol
2.3.1. MWS measurements
The participants began walking on a treadmill (Elevation series E95Ta; Life Fitness Corp., Franklin Park, IL, United States) at a speed of 4.0 km/h. The speed was progressively increased by 1.0 km/h at 1 min intervals until the participants could no longer match the speed; this speed was recorded as the MWS.
2.3.2. Main experiment
The participants walked for 4 min at 45% of MWS (slow walk) on a special treadmill with built-in force plates (HPT-2200D; Tec Gihan Co., Ltd., Kyoto, Japan); they then ran (Run) or walked at 85% of MWS (fast walk) for 4 min. The exercises were separated by 3-min rest periods. The order of running and FW was randomized. Based on our previous study which revealed significantly greater EE and carbohydrate oxidation in FW than in running (13), we selected 85% of MWS during fast walk phase. Heart rate (HR), rating of perceived exertion (RPE), GRF, and EMG were measured during the exercise (Figure 1).
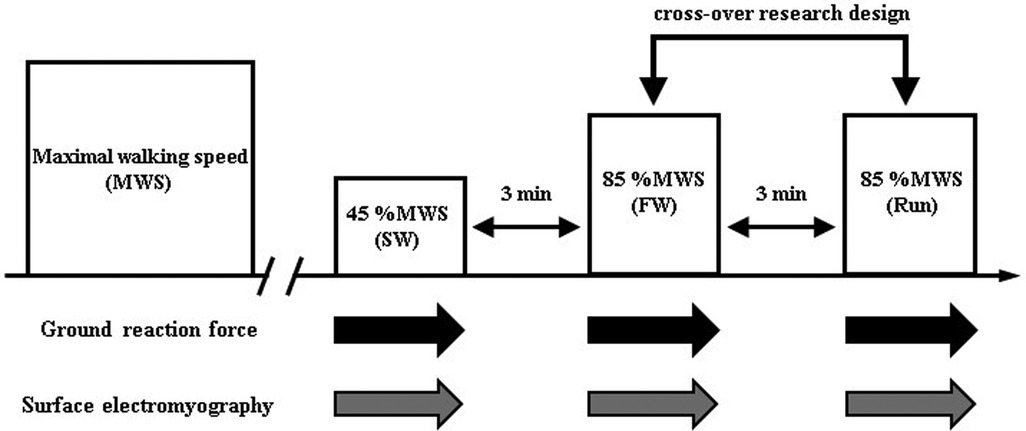
Figure 1. Protocol overview.
2.3.3. GRF and EMG measurements
A dual-belt treadmill with two force plates (HPT-2200D; Tec Gihan Co., Ltd.) was used for GRF measurements. Surface EMGs were recorded and amplified (SX230–1000, Biometrics Ltd., Ghent, United Kingdom) from seven right lower limb muscles: gluteus maximus (GM), biceps femoris (BF), rectus femoris (RF), vastus lateralis (VL), gastrocnemius medialis (MG), soleus (SOL), and tibialis anterior (TA). EMG electrode placement was based on the guidelines for non-invasive surface EMG assessment of muscles (20) (Figure 2). GRFs and EMGs were recorded at a sampling frequency of 1 kHz using a data acquisition and analysis system (LabChart; ADInstruments, Sydney, Australia) with a 16-bit analog-to-digital converter (PowerLab/16SP; ADInstruments).
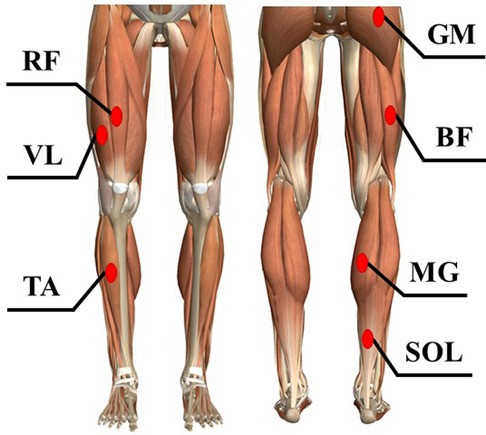
Figure 2. The measurement places of surface electromyography (EMG) of lower limb muscles. The EMGs were recorded and amplified from seven right lower limb muscles. GM; gluteus maximus, BF; biceps femoris, RF; rectus femoris, VL; vastus lateralis, MG; gastrocnemius medialis, SOL; soleus, TA; tibialis anterior.
2.3.4. HR and RPE
HR was measured continuously (every 5 s) using a wireless HR monitor (RCX5; Polar Electro, Kempele, Finland). RPE was evaluated using a 10-point scale (21) at the end of each trial.
2.3.5. Data analyses
The anteroposterior and vertical GRF components were analyzed after they had been filtered at 40 Hz and 60 Hz, respectively, using a low-pass Butterworth filter. The contact phase, between the foot strike and toe-off, had a detection threshold of 50 N for the vertical GRF component. The braking and propulsive phases were between the foot strike and braking-to-propulsion transition, and between the braking-to-propulsion transition and toe-off, respectively. All GRF values were normalized according to body weight.
EMG signals were filtered at 20–450 Hz using band-pass Butterworth filters, then rectified and smoothed at 60 Hz using low-pass Butterworth filters. The muscle activity for each phase was calculated as the average EMG (aEMG) amplitude, using maximum voluntary contraction as the reference. EMG data were reported for the contact, braking, and propulsive phases. The GRF data and EMG signals during 10 steps have been averaged individually. In the GRF data, impulse and averaged force for each phase were calculated. The rectified time course EMG signals were aEMG for each phase.
2.3.6. Statistical analyses
Data are presented as means ± standard deviations. A commercially available statistical software (SigmaStat 2.03; SPSS, Inc.) was utilized. For comparisons of each variable among the trials, one-way repeated-measures analysis of variance (repeated ANOVA) was used to compare the main effect. When ANOVA found significant main effect, post hoc test (Tukey method) was performed to identify specific pairwise differences. The level of statistical significance was set at p < 0.05.
3. Results
Table 1 shows walking speed variables.
3.1. GRFs comparison between SW, FW, and Run
Figure 3 shows the anteroposterior average and impulse GRFs. The impulse was significantly lower for Run than for SW or FW during the braking phase and during the propulsive phase. During the braking phase, the average force was significantly higher for FW and Run than for SW; it was higher for FW than for Run. During the propulsive phase, the average force was significantly higher for FW than for SW or Run.
Figure 4 shows the vertical peak, average, and impulse GRFs. The peak force was significantly higher for FW and Run than for SW during the contact phase; it was significantly higher for Run than for FW. The average force was significantly higher for FW and Run than for SW during the contact phase; it was significantly greater for Run than for FW. The impulse was significantly lower for FW and Run than for SW during the contact phase; it was lower for Run than for FW.
3.2. EMGs comparison between SW, FW, and Run
Figure 5 shows the aEMGs for the GM, BF, RF, and VL during the contact, braking, and propulsive phases. The contact phase aEMG for the GM was significantly higher in Run than in SW. The braking phase aEMG for the GM was significantly higher in Run than in SW and FW; it was higher in FW than in SW. The contact phase aEMG for the BF was significantly higher in Run than in SW or FW; it was higher in FW than in SW. The braking phase aEMG for the BF was significantly higher in FW and Run than in SW. Furthermore, the propulsive phase aEMG for the BF was higher in Run than in SW or FW. The contact phase aEMG for the RF was significantly higher in FW and Run than in SW. The braking phase aEMG for the RF was significantly higher in Run than in SW or FW; it was higher in FW than in SW. The contact phase aEMG for the VL was higher in Run than in SW or FW; it was higher in FW than in SW. The braking phase aEMG for the VL was higher in Run than in SW or FW; it was higher in FW than in SW.
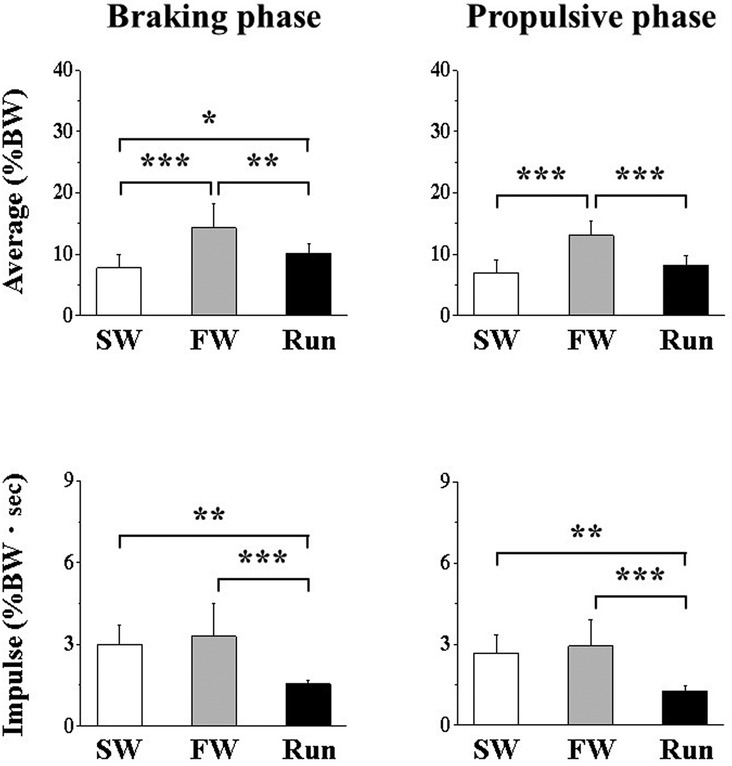
Figure 3. Anteroposterior component of ground reaction force during the braking (A,B) and propulsive (C,D) phases. Values are means ± SD. Significant difference between trials (*p < 0.05, **p < 0.01, ***p < 0.001). SW; Slow walk trial. FW; Fast walk trial. Run; Run trial.
Figure 6 shows the aEMGs for the MG, SOL, and TA during the contact, braking, and propulsive phases. The contact phase aEMG for the MG was significantly higher in Run than in SW or FW; it was higher in FW than in SW. The braking phase aEMG for the MG was significantly higher in Run than in FW or SW. The propulsive phase aEMG for the MG was significantly higher in FW than in SW. The contact phase aEMG for the SOL was significantly higher in Run and FW than in SW. The braking phase aEMG for the SOL was significantly higher in Run than in SW or FW. The propulsive phase aEMG for the SOL was significantly higher in FW than in SW or Run. The aEMG for the TA during all phases was significantly higher in FW than in SW or Run.
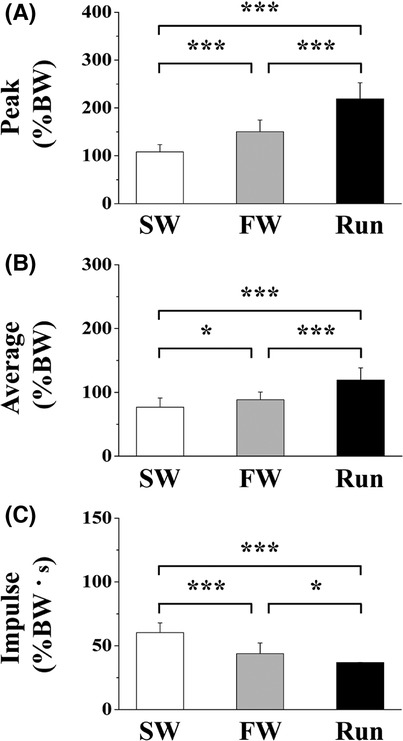
Figure 4. The peak (A), average (B) and impulse (C) of vertical component of ground reaction force. Values are means ± SD. Significant difference between trials (*p < 0.05, **p < 0.01, ***p < 0.001). SW; Slow walk trial. FW; Fast walk trial. Run; Run trial.
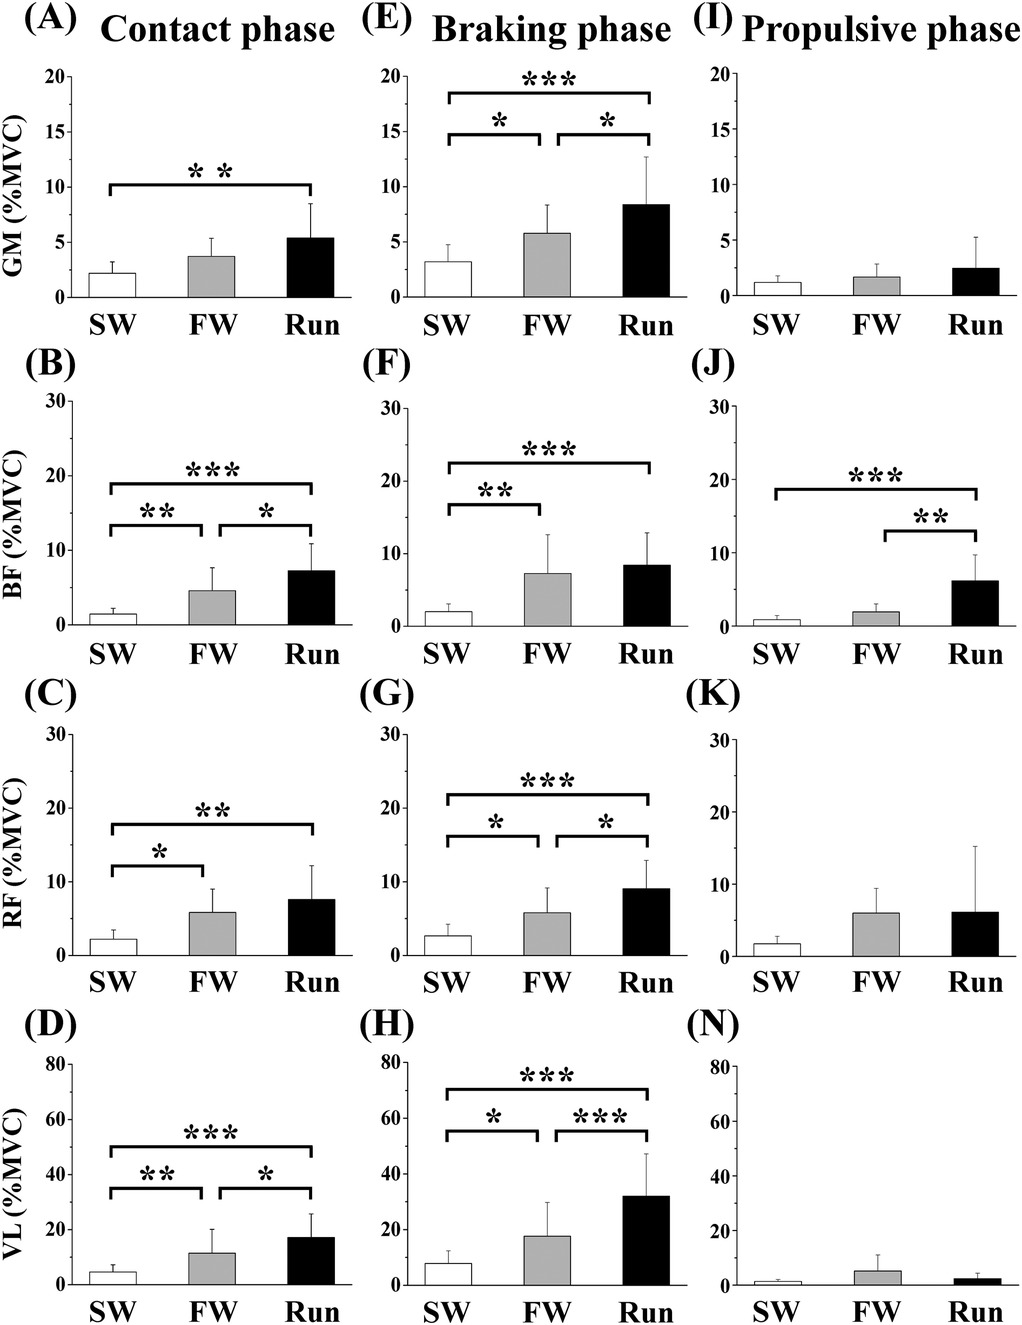
Figure 5. Averaged surface electromyography (aEMG) of femoral muscles during the contact (A—D), braking (E—F) and propulsive (I—N) phases. Values are means ± SD. Significant difference between trials (*p < 0.05, **p < 0.01, ***p < 0.001). SW; Slow walk trial. FW; Fast walk trial. Run; Run trial. GM; Gluteus maximus, BF; Biceps femoris, RF; Rectus femoris, VL; Vastus lateralis.
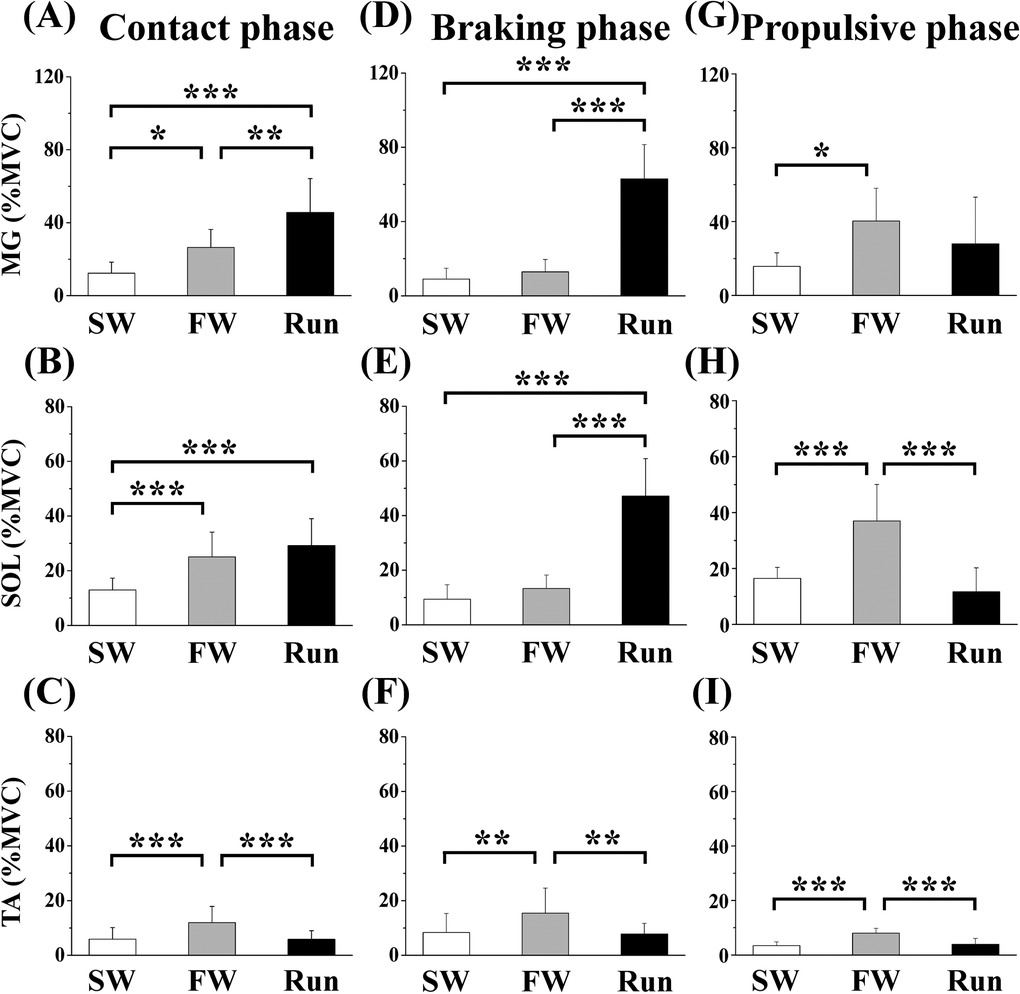
Figure 6. Averaged surface electromyography (aEMG) of lower leg muscles during the contact (A—C), braking (D—F) and propulsive (G—I) phases. Values are means ± SD. Significant difference between trials (*p < 0.05, **p < 0.01, ***p < 0.001). SW; Slow walk trial. FW; Fast walk trial. Run; Run trial. MG; Gastrocnemius medialis, SOL; Soleus, TA; Tibialis anterior.
3.3. HR and RPE
Table 2 shows the HR and RPE. HR was significantly higher in FW and Run than in SW, but it did not significantly differ between FW and Run. RPE for breath (RPEbreath) was significantly higher in FW and Run than in SW, with no difference between FW and Run. RPE for leg muscles (RPEleg) was significantly higher in FW and Run than in SW, and it was higher in FW than in Run.
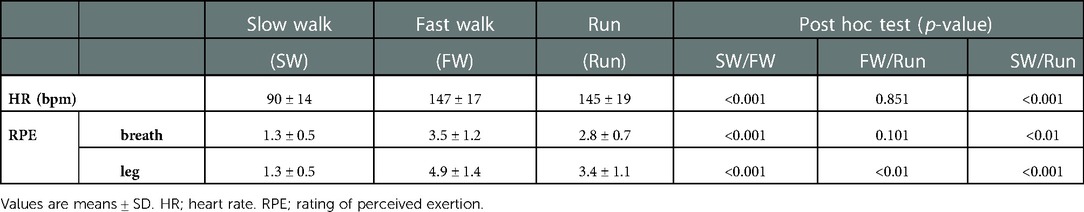
Table 2. Hr and RPE.
4. Discussion
The present study compared GRF and lower limb muscle activity between FW and running at equivalent speeds. Consequently, anteroposterior GRF was greater during FW than during Run, whereas vertical GRF was greater during Run than during FW. Moreover, muscle activity during the braking phase was lower in FW than in Run, while it was higher in FW during the propulsive phase. These findings suggest that FW causes less mechanical stress during impact and produces greater propulsive force, compared with running at an equivalent speed.
Despite equivalent speed, the impulse and average of anteroposterior GRF were significantly greater during FW than during running. In contrast, the average vertical GRF was higher during running than during FW. These results may be related to differences in locomotion (22). We (13) reported that EE and carbohydrate oxidation during walking were enhanced in a non-linear manner with increasing speed. Peak GM activity generally occurs immediately after foot-ground contact (23). In the present study, aEMGs for the GM, RF, and VL during braking phase were greater in Run than in FW. aEMGs during breaking phase showed similar trend for average vertical GRF. In the braking phase of running, the lower limb joints (i.e., hip, knee, and ankle joints) flexed because of the impact during ground contact. In the subsequent propulsive phase, these joints were extended, and the mechanical energy exchange involved elastic energy storage and release (24). Also, the peak of vertical GRF was significantly greater during running than during FW, and it is advantageous for the mechanical energy from exchange stretch- shortening cycle perspective (25).
Gazendam & Hof (23) reported minor hamstring differences in the walking and running profiles, but major differences in the EMG profiles were observed for the lower limb muscles. In the present study, aEMGs for the MG and SOL during braking phase were higher in running than in walking. However, aEMG for the MG during the propulsive phase was significantly higher in FW than in SW, and aEMG for the SOL was significantly higher in FW than in SW and running. Less knee flexion with greater ankle plantarflexion decreased mechanical efficiency at fast speed (26), and it may augment mechanical work, thus decreasing mechanical efficiency (27). Furthermore, impulse and average anteroposterior GRFs were significantly higher in FW than in running during the propulsive phase. Therefore, increased muscle activities during push-off might be involved in the greater EE during walking (28). The present study also demonstrated differences in aEMGs for the TA during FW and Run. The EMG of TA was significantly higher in FW than in SW and Run during all phases. The increased aEMG for the TA during FW would contribute to maintaining the ankle joint in a dorsiflexed position, thus improving ankle joint stability while walking (29). Furthermore, the augmented muscle activities of lower limb muscles might explain significantly higher score of RPEleg in FW than in Run.
As limitations of the present study, joint torques and powers were not evaluated. Also, the evaluations of GRFs were limited during 4 min of exercise (walking or running). In further study, determination of GRFs during actual interval FW exercise would be valuable.
5. Conclusion
FW resulted in a smaller impact (i.e., vertical GRF) than running at an equivalent speed. During the contact phase, the average muscle activities of GM, RF, and SOL were not significantly different between FW and running. However, further analyses presented that the activity patterns of lower limb muscles differed between FW and running, even at equivalent speeds. In running, GM, RF, VL, MG, and SOL were mainly activated during the braking phase than the propulsive phase. On the other hand, in FW, the muscle activity of SOL during the propulsive phase was increased than during the braking phase. Therefore, FW causes smaller mechanical stress than running at an equivalent speed, but it highly activates lower limb muscles. These notions may be useful for designing exercise program for health promotion, particularly in individuals with orthopedic or other medical issues (e. g., joint injuries, type 2 diabetes, and obesity).
Data availability statement
The original contributions presented in the study are included in the article/Supplementary Material, further inquiries can be directed to the corresponding authors.
Ethics statement
The studies involving human participants were reviewed and approved by The ethics committee for Human Experiments at Ritsumeikan University. The patients/participants provided their written informed consent to participate in this study.
Author contributions
AM, AN and KG contributed to the study design, collection, analysis, interpretation of data and manuscript writing. KY, DS, MI and MO contributed to the study design, data collection and interpretation of data. All authors contributed to the article and approved the submitted version.
Funding
This study received funding from ASICS Corporation. All authors declare no other competing interests. The funder was not involved in the writing of this article or the decision to submit it for publication.
Acknowledgments
We would like to appreciate all participants who completed experimental trials. We also thank the laboratory members for the grateful technical support.
Conflict of interest
MI, MO were employed by ASICS Corporation. The remaining authors declare that the research was conducted in the absence of any commercial or financial relationships that could be construed as a potential conflict of interest.
Publisher's note
All claims expressed in this article are solely those of the authors and do not necessarily represent those of their affiliated organizations, or those of the publisher, the editors and the reviewers. Any product that may be evaluated in this article, or claim that may be made by its manufacturer, is not guaranteed or endorsed by the publisher.
References
1. Sazlina SG, Sooryanarayana R, Ho BK, Omar MA, Krishnapillai AD, Tohit NM, et al. Cardiovascular disease risk factors among older people: data from the national health and morbidity survey 2015. PLoS One. (2020) 15:1–11. doi: 10.1371/journal.pone.0240826
2. Larsson L, Degens H, Li M, Salviati L, Lee YI, Thompson W, et al. Sarcopenia: aging-related loss of muscle mass and function. Physiol Rev. (2019) 99:427–511. doi: 10.1152/physrev.00061.2017
3. Lee CG, Boyko EJ, Strotmeyer ES, Lewis CE, Cawthon PM, Hoffman AR, et al. Association between insulin resistance and lean mass loss and fat mass gain in older men without diabetes mellitus. J Am Geriatr Soc. (2011) 59:1217–24. doi: 10.1111/j.1532-5415.2011.03472.x
4. Sanada K, Iemitsu M, Murakami H, Gando Y, Kawano H, Kawakami R, et al. Adverse effects of coexistence of sarcopenia and metabolic syndrome in Japanese women. Eur J Clin Nutr. (2012) 66:1093–8. doi: 10.1038/ejcn.2012.43
5. Abe T, Thiebaud RS, Loenneke JP, Bemben MG, Loftin M, Fukunaga T. Influence of severe sarcopenia on cardiovascular risk factors in nonobese men. Metab Syndr Relat Disord. (2012) 10:407–12. doi: 10.1089/met.2012.0057
6. Kraus WE, Powell KE, Haskell WL, Janz KF, Campbell WW, Jakicic JM, et al. Physical activity, all-cause and cardiovascular mortality, and cardiovascular disease. Med Sci Sports Exerc. (2019) 51:1270–81. doi: 10.1249/MSS.0000000000001939
7. Hiwa MA, Muhammed BM. Population-level interventions based on walking and cycling as a means to increase physical activity. Phys Act and Health. (2021) 5:55–63. doi: 10.5334/paah.87
8. Norwood P, Eberth B, Farrar S, Anable J, Ludbrook A. Active travel intervention and physical activity behaviour: an evaluation. Soc Sci Med. (2014) 113:50–8. doi: 10.1016/j.socscimed.2014.05.003
9. Colbert LH, Hootman JM, Macera CA. Physical activity-related injuries in walkers and runners in the aerobics center longitudinal study. Clin J Sport Med. (2000) 10:259–63. doi: 10.1097/00042752-200010000-00006
10. Nemoto K, Gen-no H, Masuki S, Okazaki K, Nose H. Effects of high-intensity interval walking training on physical fitness and blood pressure in middle-aged and older people. Mayo Clin Proc. (2007) 82:803–11. doi: 10.4065/82.7.803
11. Masuki S, Morikawa M, Nose H. High-Intensity walking time is a key determinant to increase physical fitness and improve health outcomes after interval walking training in middle-aged and older people. Mayo Clin Proc. (2019) 94:2415–26. doi: 10.1016/j.mayocp.2019.04.039
12. Karstoft K, Clark MA, Jakobsen I, Müller IA, Pedersen BK, Solomon TPJ, et al. The effects of 2 weeks of interval vs continuous walking training on glycaemic control and whole-body oxidative stress in individuals with type 2 diabetes: a controlled, randomised, crossover trial. Diabetologia. (2017) 60:508–17. doi: 10.1007/s00125-016-4170-6
13. Makino A, Yamaguchi K, Sumi D, Ichikawa M, Ohno M, Goto K. Comparison of energy expenditure and substrate oxidation between walking and running in men and women. Phys Act Nutr. (2022) 26:8–13. doi: 10.20463/pan.2022.0002
14. Okazaki K, Yazawa D, Goto M, Kamijo Y-I, Furihata M, Gen-no H, et al. Effects of macronutrient intake on thigh muscle mass during home-based walking training in middle-aged and older women. Scand J Med Sci Sports. (2013) 23:e286–92. doi: 10.1111/sms.12076
15. Ozaki H, Nakagata T, Yoshihara T, Kitada T, Natsume T, Ishihara Y, et al. Effects of progressive walking and stair-climbing training program on muscle size and strength of the lower body in untrained older adults. J Sports Sci Med. (2019) 18:722–8. Available at: https://www.ncbi.nlm.nih.gov/pmc/articles/PMC6873118/31827357
16. Kubo K, Ishida Y, Suzuki S, Komuro T, Shirasawa H, Ishiguro N, et al. Effects of 6 months of walking training on lower limb muscle and tendon in elderly. Scand J Med Sci Sports. (2008) 18:31–9. doi: 10.1111/j.1600-0838.2007.00654.x
17. Fukuchi CA, Fukuchi RK, Duarte M. Effects of walking speed on gait biomechanics in healthy participants: a systematic review and meta-analysis. Syst Rev. (2019) 8:153. doi: 10.1186/s13643-019-1063-z
18. Sun D, Fekete G, Mei Q, Gu Y. The effect of walking speed on the foot inter-segment kinematics, ground reaction forces and lower limb joint moments. PeerJ. (2018) 6:e5517. doi: 10.7717/peerj.5517
19. Chiu MC, Wang MJ. The effect of gait speed and gender on perceived exertion, muscle activity, joint motion of lower extremity, ground reaction force and heart rate during normal walking. Gait Posture. (2007) 25:385–92. doi: 10.1016/j.gaitpost.2006.05.008
20. Hermens HJ, Freriks B, Disselhorst-Klug C, Rau G. Development of recommendations for SEMG sensors and sensor placement procedures. J Electromyogr Kinesiol. (2000) 10:361–74. doi: 10.1016/s1050-6411(00)00027-4
21. Christian RJ, Bishop DJ, Billaut F, Girard O. The role of sense of effort on self-selected cycling power output. Front Physiol. (2014) 5:115. doi: 10.3389/fphys.2014.00115
22. Dugan SA, Bhat KP. Biomechanics and analysis of running gait. Phys Med Rehabil Clin N Am. (2005) 16:603–21. doi: 10.1016/j.pmr.2005.02.007
23. Gazendam MG, Hof AL. Averaged EMG profiles in jogging and running at different speeds. Gait Posture. (2007) 25:604–14. doi: 10.1016/j.gaitpost.2006.06.013
24. Cavagna GA. Storage and utilization of elastic energy in skeletal muscle. Exerc Sport Sci Rev. (1977) 5:89–129. doi: 10.1249/00003677-197700050-00004
25. Earp JE, Newton RU, Cormie P, Blazevich AJ. The influence of loading intensity on muscle-tendon unit behavior during maximal knee extensor stretch shortening cycle exercise. Eur J Appl Physiol. (2014) 114:59–69. doi: 10.1007/s00421-013-2744-2
26. DeVita P, Hortobágyi T. Obesity is not associated with increased knee joint torque and power during level walking. J Biomech. (2003) 36:1355–62. doi: 10.1016/s0021-9290(03)00119-2
27. Massaad F, Lejeune TM, Detrembleur C. The up and down bobbing of human walking: a compromise between muscle work and efficiency [published correction appears in. J Physiol. (2007) 582(Pt 1):789–99. doi: 10.1113/jphysiol.2007.127969
28. Clark WH, Pimentel RE, Franz JR. Imaging and simulation of inter-muscular differences in Triceps surae contributions to forward propulsion during walking. Ann Biomed Eng. (2021) 49:703–15. doi: 10.1007/s10439-020-02594-x
Keywords: fast walking, running, ground reaction force, electromyogram, health promotion
Citation: Makino A, Yamaguchi K, Sumi D, Ichikawa M, Ohno M, Nagano A and Goto K (2023) Ground reaction force and electromyograms of lower limb muscles during fast walking. Front. Sports Act. Living 4:1055302. doi: 10.3389/fspor.2022.1055302
Received: 27 September 2022; Accepted: 12 December 2022;
Published: 17 February 2023.
Edited by:
Hun-Young Park, Konkuk University, South Korea© 2023 Makino, Yamaguchi, Sumi, Ichikawa, Ohno, Nagano and Goto. This is an open-access article distributed under the terms of the Creative Commons Attribution License (CC BY). The use, distribution or reproduction in other forums is permitted, provided the original author(s) and the copyright owner(s) are credited and that the original publication in this journal is cited, in accordance with accepted academic practice. No use, distribution or reproduction is permitted which does not comply with these terms.
*Correspondence: Kazushige Goto a2Fnb3RvQGZjLnJpdHN1bWVpLmFjLmpw
Specialty Section: This article was submitted to Exercise Physiology, a section of the journal Frontiers in Sports and Active Living