 Greig Logan1*
 Camilla Somers2
 Graham Baker3
 Hayley Connell2
 Stuart Gray1
 Paul Kelly3
 Emma McIntosh2Paul Welsh1
 Cindy M. Gray2
 Jason M. R. Gill1
- 1School of Cardiovascular and Metabolic Health, University of Glasgow, Glasgow, United Kingdom
- 2Institute of Health and Wellbeing, University of Glasgow, Glasgow, United Kingdom
- 3Physical Activity for Health Research Centre, University of Edinburgh, Edinburgh, United Kingdom
There is large potential to increase cycling participation worldwide. Participation in cycling is associated with lower risk of mortality from any cause, and incidence of cardiovascular disease and type 2 diabetes, as well as positive mental health and well-being. The largest potential for health gains likely to come from increasing participation amongst those who do not currently cycle regularly, rather than encouraging those who already cycle regularly to cycle more. Replacing car journeys with cycling can lead to reductions in air pollution emissions and lower pollutant exposure to the general population. Important gaps and uncertainties in the existing evidence base include: the extent to which the health benefits associated with cycling participation are fully causal due to the observational nature of much of the existing evidence base; the real-world economic cost-benefits of pragmatic interventions to increase cycling participation; and the most effective (combination of) approaches to increase cycling participation. To address these uncertainties, large-scale, long-term randomised controlled trials are needed to: evaluate the effectiveness, and cost-effectiveness, of (combinations of) intervention approaches to induce sustained long-term increases in cycling participation in terms of increases in numbers of people cycling regularly and number of cycling journeys undertaken, across a range of population demographic groups; establish the effects of such interventions on relevant outcomes related to health and wellbeing, economic productivity and wider societal impacts; and provide more robust quantification of potential harms of increasing cycling participation, such as collision risks.
1. Introduction
Established causal relationships between general physical activity and health outcomes are well documented (1, 2). While riding bicycles is often included in population measures of physical activity alongside other exercise modalities, few studies have investigated the contribution of cycling alone with health associations (3). Cycling can be performed for leisure, sport, commuting, active transport and utility (e.g., shopping, school run), however quantification of precise contributions of cycling purpose to health are not well known (4). Despite this, cycling is increasingly forming an important component of public health recommendations and active transport policy, but uncertainty still exists about the effectiveness of intervention strategies to improve cycling (5).
This narrative review intends to provide a balanced, evidence-based, overview of the benefits and risks of cycling and the potential scope of consequences of increasing cycling participation for health, wellbeing, the environment, and the economy, as well as providing an overview of the evidence about barriers to cycling, and approaches which have been tried so far to increase cycling participation. Throughout, we aim to summarise what is known on each of these topics and to highlight the key evidence gaps and to outline the next steps needed to address these gaps. In doing so, we provide a clear pathway, outlining the work still needed, to facilitate the goal of a sustained increase in cycling uptake globally.
2. The benefits of cycling on physical health outcomes
For outcomes where relevant systematic reviews and meta-analyses have been published, findings from these analyses have been reported. These have been updated with of evidence from more recent studies published since these reviews reported as appropriate. In areas where a systematic review or meta-analysis has not been published, we have attempted to report a representative overview of the available data. The available evidence on cycling and specific health outcomes is summarised in the sections below.
2.1. Cycling and risk of mortality
The available evidence from large prospective cohort studies indicates that regular cycling is associated with a lower risk of mortality. In 2014, Kelly et al. published a comprehensive systematic review and meta-analysis collating evidence from all published studies in healthy adults investigating the association between participation in cycling and risk of mortality (3). This analysis included data from seven large scale studies—four from Denmark, two from the United Kingdom, and one from China—which included approximately 200,000 adults aged from 20 to 93 years, and over 2 million person-years of observation. In these studies, participation in cycling was assessed and participants were followed up for between 5.7 and 18 years with mortality outcomes over this follow-up period recorded. The data were statistically adjusted for a range of potential confounding factors. All studies performed adjustment for age, smoking, other non-cycling physical activity, at least one indicator of socio-economic status, and aspects of health status, and either adjusted for sex or performed analyses in single sex groups. Four studies also adjusted for body mass index, and three studies adjusted for alcohol intake. Key features of the studies included in the 2014 Kelly meta-analysis (3) are outlined in Supplementary Table S1.
All but one study reported that higher levels of cycling were associated with a lower risk of mortality over the follow-up period. When data from all studies were combined, there was a clear, statistically significant lower risk of mortality associated with regular cycling participation. The combined data from all of these studies, illustrated in Figure 1, indicated that higher levels of cycling were associated with lower risk of mortality with a curvilinear relationship, with the largest difference in mortality risk being between individuals reporting no cycling and those reporting undertaking up to approximately 100 min per week of cycling. Participation in approximately 100 min of cycling per week was associated with a 17% lower risk of mortality compared with no cycling participation, in analyses adjusted for major confounding variables.
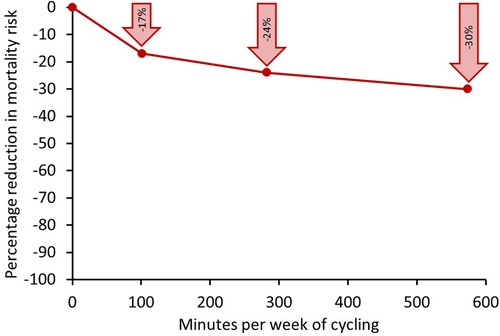
Figure 1. Relative reduction in risk of mortality associated with different weekly volumes of cycling compared with undertaking no regular cycling for a meta-analysis of seven large-scale population studies. Data in individual studies adjusted for a range of confounding factors including age, sex, smoking, other non-cycling physical activity, socio-economic status, and aspects of health status. Points on graph at 100, 280 and 570 min per week represent the mid-points of ranges of 10–210, 210–350, and 350–800 min per week, respectively. Modified from (3).
Levels of cycling beyond this range were associated with a further lowering of mortality risk, but the risk reduction was less steep. Participation in approximately 270 min per week was associated with a 24% lower mortality risk compared with no cycling, however, participation in approximately 570 min per week was associated with a 30% lower risk of mortality compared with no cycling. The clear implication of this is that bigger public health gains will be realised by encouraging individuals who currently do not cycle regularly to do some cycling, rather than getting those who currently cycle regularly to cycle more.
Since the publication of the Kelly et al. (2014) systematic review and meta-analysis (3), further epidemiological studies have examined the association between cycling participation and risk of mortality. Key features of these studies are summarised in Table 1 and described below.

Table 1. What is known and what is not yet know about barriers to cycling.
Koolhaas et al. examined the association between cycling participation and risk of all-cause mortality amongst 7,225 older adults (mean age 70 years) in living in Rotterdam, who were followed up for a median of 13.1 years (6). They reported that participation in “medium” levels of cycling (median 13 min per day, or 91 min per week) was associated with an 28% lower risk of mortality compared with no cycling participation, after adjustment for confounders (Supplementary Table S2), and participation in “high” levels of cycling (median 51 min per day or 357 min per week) was associated with an 35% lower risk of mortality.
To minimise the potential contribution of reverse causality, Koolhaas et al. undertook sensitivity analyses where they excluded deaths occurring in the first 5 and first 10 years of follow up (those with pre-existing disease are more likely to die within the first few years the measurements), and the findings were essentially unchanged (6). This is an important study as it focused on older adults, where there had previously been limited data, and shows that the associations between cycling participation and lower risk of mortality extend into older age. Importantly, the findings are consistent with the Kelly et al. meta-analysis which reported the largest reduction in mortality risk when moving from undertaking no regular cycling to a undertaking approximately 100 min per week with diminishing further returns thereafter (3).
In a large-scale study of 80,306 UK adults followed up for 9.2 years, Oja et al. found that participation in any compared to no cycling was associated with a 15% lower risk of mortality, after adjustment for confounders (7). Interestingly, this analysis revealed no clear effect of self-reported cycling intensity or weekly cycling duration on the association between cycling and mortality, which again is consistent with the findings from the Kelly et al. meta-analysis (3), which indicated that the largest benefit in terms of lowering of mortality risk was observed when moving from no cycling to some cycling.
In the largest study to date of cycling participation and risk of mortality—approximately the size of all previous studies combined—Celis-Morales et al. examined the association between mode of commuting to work and risk of mortality amongst 263,540 participants in the UK Biobank cohort who were followed up for 5 years (8). Compared with non-active commuting (car/motor vehicle or public transport), cycling to work was associated with a 41% lower risk of mortality. Mixed-mode commuting, where participants undertook part of the journey by cycle with the remainder using a non-active form of transport, was associated with a 24% lower risk of mortality. This is an important finding which indicates that for individuals who live too far from work to cycle the whole way could potentially gain substantial benefits from cycling part of the way. There was a dose-response relationship between weekly cycling commuting distance and risk of mortality, with those commuting less than 30 miles per week having 32% lower risk of mortality, compared to non-active commuters, and those cycling more than 30 miles per week to work having a 40% lower mortality risk. Again, this non-linear response with the largest difference in risk seen between no cycling and some cycling, rather than some cycling and more cycling is consistent with the findings of the Kelly et al. meta-analysis (3).
Finally, in a large study of the combined effects of physical activity and air pollution amongst 52,061 older Danish adults living in urban environments, Anderson et al. reported that participation in cycling was associated with a 17% lower risk of mortality and this association was not modified by exposure to high levels of traffic-related air pollution (9).
Thus, in summary, a large body of epidemiological evidence, including data from over half a million participants has consistently demonstrated that participation in regular cycling is associated with lower risk of mortality compared with no cycling. The curvilinear nature of the dose response relationship (Figure 1) indicates that that the largest benefit is seen when moving from no cycling to some cycling. Thus, with a large proportion of the population cycling less than this amount, it is clear that to maximise public health gains, it is necessary to focus on increasing participation amongst those who do not currently cycle regularly, rather than encouraging those who already cycle regularly to cycle more.
2.2. Cycling and risk of cardiovascular disease
There is a large body of robust data from prospective cohort studies (approximately 50 studies with a total of over 700,000 participants) that participation in physical activity is associated lower risk of incidence and mortality from cardiovascular disease (CVD) and coronary heart disease (CHD) (10–14), with a curvilinear dose response relationship, similar to that observed for all-cause mortality (Figure 1).
A smaller number of studies have specifically examined the association between cycling participation and incidence or mortality from CVD or CHD (7–9, 15–23). These studies are summarised in Supplementary Table S3. Of the 12 studies identified, including over 700,000 participants, five were from Denmark, four from the UK, and one each from Netherlands, USA and China. Eleven out of 12 studies reported numerically lower risk of CVD or CHD with higher levels cycling of participation (7–9, 15–17, 19–23); in six of these studies this association was statistically significant (8, 9, 16, 17, 22, 23).
Most studies focused on primary prevention and excluded participants with CVD or CHD at baseline. One study considered both primary prevention and secondary prevention data (22), reporting that participation in cycling was associated with lower risk of both a first myocardial infarction (heart attack) and of a subsequent myocardial infarction in those who had already had an event. It seems likely that the lack of a statistically significant association in some of the studies which suggested numerically lower CVD or CHD risk amongst cyclists (7, 15, 19–21 )may reflect insufficient statistical power to robustly detect an association, rather than the absence of benefit. However, the directional consistency of the findings suggests that if a meta-analysis was undertaken combining all the available data, an overall statistically significant association between cycling participation and lower risk of CVD and CHD would likely be observed.
2.3. Cycling and risk of cancer
Studies which have considered the association between cycling specifically and cancer incidence and mortality amongst populations who did not have cancer at baseline are summarised in Supplementary Table S4. Studies examining the association between physical activity and survival from cancer in cancer patients were not considered. Nine studies were identified (8, 9, 15, 16, 19, 20, 24–26) investigating the association between cycling participation and cancer. Two studies reported that participation in cycling was associated with lower risk of overall cancer incidence and mortality (8, 20), but others did not observe a statistically significant association between cycling participation and cancer risk (9, 15, 16, 19). Cycling was associated with lower risk of lung cancer in women but not in men (26), but was not associated with significantly lower risk of colon cancer (24) or prostate cancer (25). Thus, the available evidence on cycling and risk of cancer is mixed and further larger studies with sufficient statistical power to robustly assess effects of cycling on incidence of specific cancers are needed.
2.4. Cycling and risk of type 2 diabetes
A number of cross-sectional studies have indicated that participation in cycling is associated lower prevalence of type 2 diabetes (8, 27–30), but relatively few prospective cohort studies have investigated whether cycling participation amongst those who are free from type 2 diabetes at baseline is associated with lower incidence of developing the disease. These studies are summarised in Supplementary Table S5.
Rasmussen et al. (31) evaluated the effects of cycling participation on incidence of type 2 diabetes in 52,513 Danish adults aged 50–64 years at baseline and followed up for 14.2 years. Cycling participation was assessed by self-report questionnaire at baseline, then again approximately 5 years later. This study showed that increasing levels in both total cycling and commuting cycling were associated with lower risk of type 2 diabetes in a curvilinear dose-dependent manner with the greatest benefit seen when comparing those participating no cycling to some cycling, analogous to the relationship seen between cycling and all-cause mortality (see Figure 1). It also observed that individuals who did not cycle at baseline, but had initiated cycling by the second assessment had a 20% lower risk of developing type 2 diabetes than those who were consistently non-cyclists, showing that initiation of cycling even in mid-to-late adulthood was associated with benefit. Interestingly, year-round cycling was associated with lower risk of type 2 diabetes than cycling in summer or winter only, emphasising the importance of cycling consistently throughout the year for maximal risk lowering.
An earlier study of 70,658 Chinese women aged 40–70 years followed up for 14.6 years by Villegas et al. (32) reported that participation in cycling was associated with a 19% lower risk of developing type 2 diabetes, but this was attenuated to a 14% lower risk in a sensitivity analysis which excluded participants with coronary heart disease, stroke, cancer at baseline.
Hu et al. (33 )undertook an analysis of 70,102 US Nurses aged 40–65 years at baseline and followed-up for 8 years, finding that participation in any cycling was associated with a non-significant 4% lower risk of type 2 diabetes. However, it is important to note that this analysis used relatively crude measure of cycling participation (any vs. none) and the reported risk estimate was after adjustment for all other physical activities which were more robustly quantified than cycling participation.
The wider body of evidence evaluating the association between overall physical activity and type 2 diabetes risk is also consistent the available data on cycling. In 2015, Aune et al. (34 )performed a systematic review and meta-analysis of studies investigating the association between physical activity and risk of type 2 diabetes, reporting that participation in 5 h per week of leisure-time physical activity was associated with a 25% lower risk of incident type 2 diabetes than no leisure-time physical activity participation, with the shape of the dose-response curve being curvilinear, such that the largest differences in risk were observed when comparing those undertaking approximately 1–3 h per week of leisure-time physical activity with those undertaking none.
Thus, the available evidence for cycling participation and risk of type 2 diabetes enables broadly similar conclusions to be drawn as the data for cycling and risk of mortality. Cycling is associated with lower risk of type 2 diabetes and substantial differences in risk are seen when comparing individuals who undertake some, compared to those who undertake no regular cycling. Approaches to encourage individuals who currently do not cycle regularly to do some cycling is likely to lead to substantial public health gains.
2.5. Cycling and risk of obesity
Cross-sectional studies generally report that individuals who participate in cycling have a lower body mass index (BMI), and a lower prevalence of overweight and obesity, than their non-cycling counterparts (27, 28, 35–39). Relatively few prospective studies have evaluated the association between participation in cycling and future risk of overweight or obesity or future changes in body weight. These studies are summarised in Supplementary Table S6. Taken together these studies suggest that participation in cycling has a modest association on change in weight or BMI (<1 kg difference compared with not cycling), waist circumference (∼0.5 cm difference) and incidence of obesity (∼15%–25% lower risk of developing obesity) (31, 40–42). This is consistent with analyses of the association of overall physical activity and changes in weight and waist circumference (43). While these differences may be small on an individual level, at a population level they may be sufficient to elicit a public health gain, suggesting that cycling could contribute to public health strategies for obesity prevention.
2.6. Cycling and bone health
Physical activities which are weight-bearing and induce substantial skeletal impacts are associated with benefits on bone health, including higher levels of bone mineral density (44–46) which can potentially lead to lower risk of osteoporosis and fracture particularly in older adults (46–48), but as cycling is non-weight bearing form of physical activity, it is not possible to simply extrapolate evidence from other forms of activity to cycling.
Olmedillas et al. published a systematic review of the evidence on cycling and bone health (49). The majority of included studies were of high-level competitive cyclists, and suggested that cycling at this level does not generally appear to have a beneficial effect on bone mineral density, and may be associated with low bone mass in some cases (49).
One study included in the review reported that sprint cyclists had stronger bones than longer-distance cyclists (50); another reported that cross-country mountain bikers had higher bone mineral density than road cyclists (51), which is consistent with the higher mechanical loading to bone experienced during sprint cycling and mountain biking compared to endurance road cycling.
There is an absence of data in the literature on the effects of participation in transport and recreational cycling on aspects of bone health. Such studies are needed but given that high level competitive cycling is associated with neutral or negative effects on bone health, it seems unlikely that recreational or transport cycling would have a substantial positive effect in this domain. Thus, particularly for people at risk of osteoporosis (for example women and older adults), the available evidence suggests that cycling should probably not be the sole form of physical activity undertaken and should ideally be supplemented with other forms of bone-strengthening weight-bearing physical activities to maximise bone health. A time-efficient way to do this might be to perform exercises such as vertical jumps (e.g., ∼50 jumps per session in sets of 10–20) a few times per week (46).
2.7. Evidence from intervention studies on cycling and health outcomes
A combination of observational and intervention studies is needed to gain a complete picture of how cycling participation affects health outcomes. However, studies evaluating the effects of cycling interventions specifically on health outcomes are limited. In 2011, Oja et al. (52) undertook a systematic review of studies evaluating health benefits of cycling (excluding studies of stationary cycling on a cycle ergometer) and identified four intervention trials (53–56). These studies and other cycling intervention studies evaluating health outcomes of real-world cycling interventions (as opposed to intervention using stationary cycle ergometers) published since publication of this systematic review (57, 58) are described in Supplementary Table S7.
The overall picture is that the evidence-base for cycling interventions and health outcomes is very limited, with the published studies all being small (less than 100 participants) and generally short-term. The available evidence indicates that cycling interventions improve cardiorespiratory fitness. There is no clear evidence which indicates effects on body composition or on biomarkers of chronic disease risk, which is likely due to the studies being too small to have sufficient statistical power on these health outcomes. The long-term effects (>1 year) of cycling interventions on any health outcomes are also not known at present. Thus, adequately powered larger, longer-term studies are urgently needed to establish the extent to which feasible large-scale cycling interventions are likely to alter health outcomes in real-world settings.
2.8. Summary of evidence on cycling and physical health outcomes
There a large body of observational data indicating an association between participation in cycling and favourable health outcomes, with the evidence suggesting the largest potential public health gains are likely be realised by encouraging individuals who currently do not cycle regularly to do some cycling, rather than getting those who currently cycle regularly to cycle more. The evidence also indicates that the benefits of cycling are broadly similar to other forms of physical activity, thus to maximise gains in public health, it would be important to increase participation in cycling amongst individuals who currently undertake little physical activity, rather than encouraging those who are currently active in other pursuits to switch to cycling. However, the evidence from intervention trials is much more limited. Thus, there is a clear need for longer, larger RCTs to evaluate the size of potential health gains which are realistically achievable from pragmatic real-world interventions to promote cycling. Table 2 provides a summary of what is known and what is not yet know about cycling and physical health.
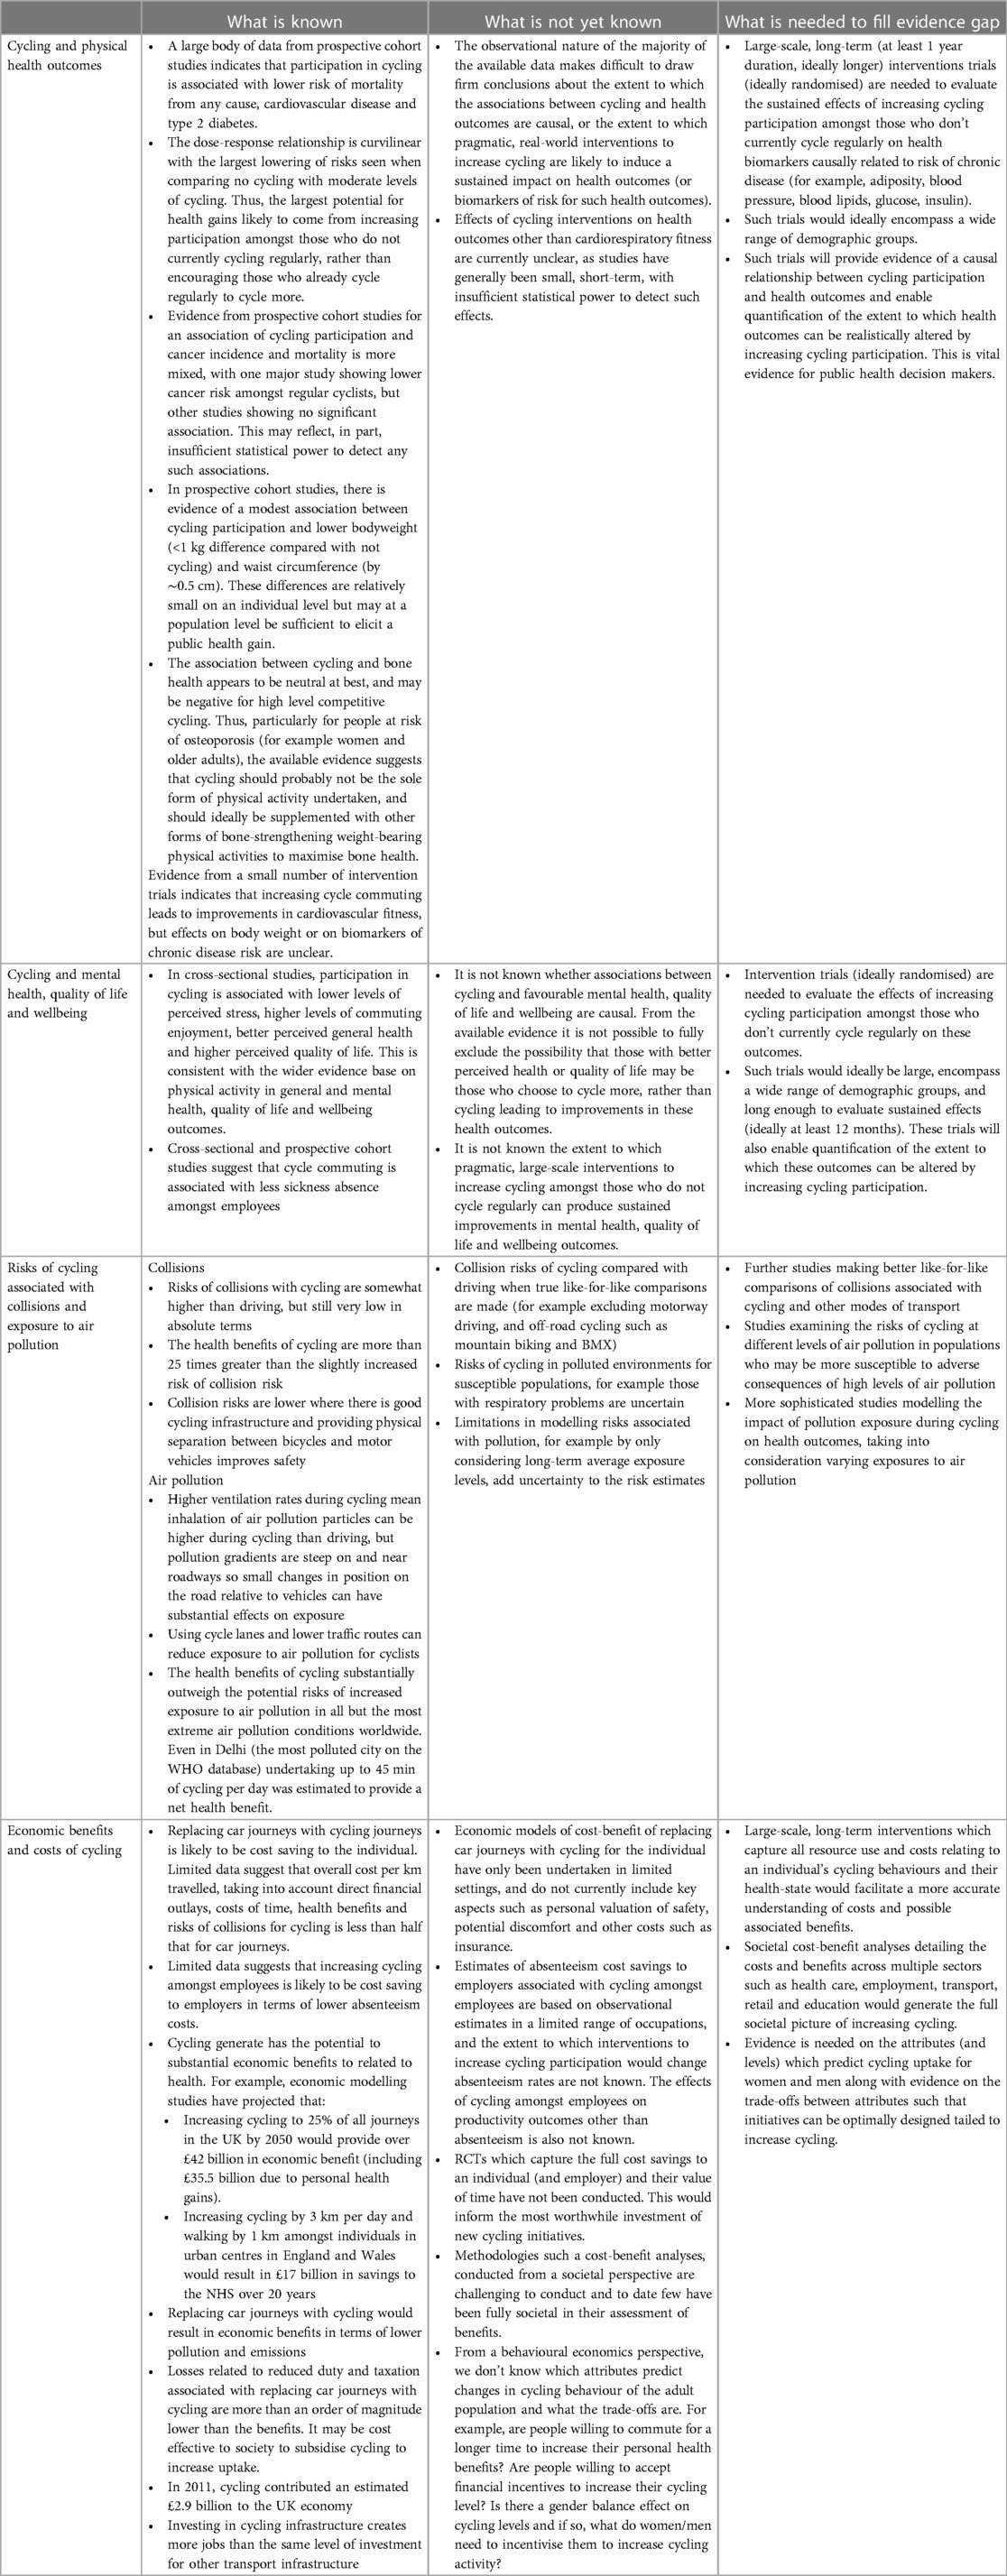
Table 2. What is known and what is not yet know about the benefits and risks of cycling.
3. The benefits of cycling on mental health, quality of life, and wellbeing outcomes
A large body of evidence suggests that physical activity in general is associated with a range of positive mental health and wellbeing outcomes, including increased sleep quality, improved executive function and other components of cognition, reduced risk of depression and depressive symptoms, and higher perceived quality of life (59, 60). However, there is more limited evidence on outdoor cycling specifically and mental health, quality or life and wellbeing outcomes. Key studies on this topic are summarised in Supplementary Table S8.
A consistent body of evidence from cross-sectional studies suggests an association between cycling and aspects of mental health, quality or life and wellbeing outcomes. For example, cross-sectional studies have reported associations between cycling and lower levels of perceived stress (61, 62), higher levels of commuting enjoyment (63), better perceived general health (64, 65), high levels of quality of life (66, 67), and higher life satisfaction (68). Evidence from cross-sectional (69) and prospective cohort (70) studies have also indicated that cycle commuters have less sickness absence (by∼1 day per year) compared with those who commute to work by other means.
Intervention trial data are more limited. One non-randomised intervention trial indicated that an intervention increasing commuting cycling led to greater vitality at 6 months, but this was not sustained until 1 year (55). Thus, the available evidence for cycling and health, quality of life and wellbeing outcomes, while relatively limited, is consistent with the evidence base for overall physical activity which indicates benefits for these outcomes.
There is a clear lack of trial data about whether interventions to increase cycling will improve mental health, quality of life and wellbeing. Randomised controlled trials to quantify the effect of pragmatic and feasible cycling interventions on these outcomes are urgently needed. In particular, understanding whether cycling interventions can reduce sickness absence amongst employee could potentially play a key role in encouraging employers to introduce interventions and policies which facilitate active commuting. Table 2 summarises what we know and what we do not yet know about cycling and mental health, quality of life and wellbeing.
4. The risks of collisions and exposure to air pollution for cyclists
4.1. Cycling and risk of collisions
Collision rates in cycling can be expressed based on a number of different exposure measures, including collisions per trip, per unit distance, or per unit time, amongst others (4). The most appropriate measure will depend on the context—collision risk of cycling in comparison to cars is higher when expressed per unit distance than per unit time or per trip as cars travel much faster and further than cycles for any given trip (4, 71). This has led some cycling advocates to suggest that a distance-based comparison of cycling and car safety is not appropriate unless only short-distance car journeys which could be feasibly replaced by cycling are compared, and long-distance car travel (which is an order of magnitude less dangerous than local driving) is excluded (4, 71).
Figure 2 shows rates of cycling fatalities and injuries for cyclists, expressed per unit distance, from selected countries in 2004 to 2005 taken from a 2008 review by Pucher and Buehler (72). This indicates that absolute rates of injuries are low, and fatalities are very rare events, however these are lowest in countries with high levels of cycling infrastructure.
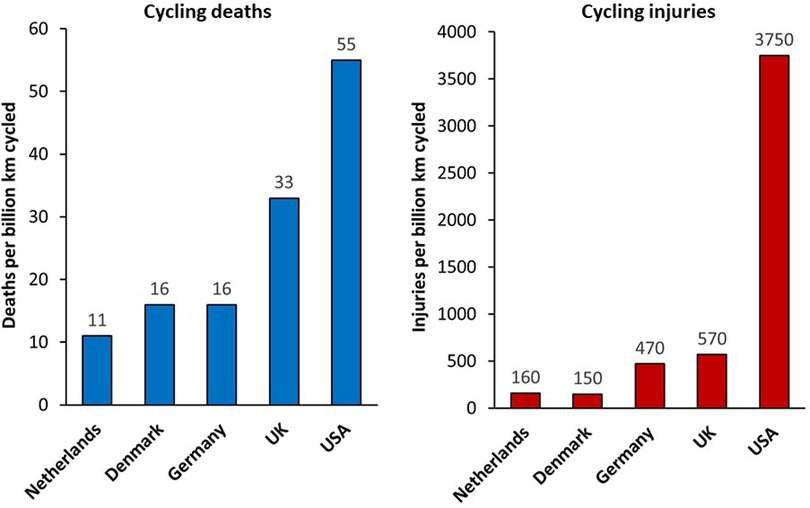
Figure 2. Rates of cycling deaths and non-fatal injuries in selected countries in 2004–2005. From (72).
Mindell et al. (71) reported hospital admissions and mortality data in England in 2007–2009 for cyclists, pedestrians and car/van drivers by age and sex groups, revealing that all-age fatalities varied within the same factor-of-three range for men (0.15–0.45 fatalities per million hours' use) and women (0.09–0.31 fatalities per million hours' use) across these three transport modes, but with substantial variation by age and sex, with a higher fatality risk for driving compared with cycling for young men, and relatively higher risks for cycling mortality in men aged over 70 years. Risks of hospital admission from cycling (29 admissions per million hours' use in men and 28 admissions per million hours' use in women) were higher than for driving (1.6 admissions per million hours' use in men and 1.8 admissions per million hours' use in women), but for cycling this does include admissions due to activities such as mountain biking and BMX, as well as cycling for transport, so does not provide a true like-for-like comparison with driving (71).
Risks of cycling vary according to route infrastructure with lower probabilities for a crash being evident on protected bike lanes (by ∼30%–90%) than on roads shared with motorised traffic (73, 74). A review by Reynolds et al. concluded that clearly marked bike-specific facilities were consistently shown to improve safety for cyclists, reducing injury or crash rates by about half compared to unmodified roads (75).
Overall, absolute risk of collisions with cycling are somewhat higher than driving, but still very low in absolute terms, and the health benefits of cycling are more than 21 times greater than any increased risk of collision (76). In short, even with current levels of cycling collision rates, the benefits of cycling substantially outweigh any increased collision risk. However, there is clear potential to reduce the collision risk associated with cycling further. Risks of cycling are lower in countries with good cycling infrastructure (71, 72, 77), and there is clear evidence that improving cycling infrastructure and providing physical separation between bicycles and motor vehicles improves safety (78).
Modelling the impact of interventions on cycling collision risks is complex and findings are difficult to generalise, but the available evidence indicates that increases in cycling lead to disproportionately smaller increases in collisions and that the negative impact of collisions do not outweigh the benefits of physical activity from cycling (78, 79).
4.2. Cycling and risk of exposure to air pollution
This section considers the risks of exposure to air pollution to the individual cyclist while they are cycling. Exposure to air pollution tends to be higher when travelling on roads than during most other activities due to proximity to motor vehicles (80). This is particularly in urban environments with high vehicle density, during peak commuting hours and exposure to pollution during commuting makes a substantial contribution to total personal exposure to air pollutants (81).
Karanasiou et al. (81) undertook a review of levels of personal exposure to key air pollutants during different modes of commuting. Twenty European studies were identified which calculated exposure to air pollution during cycling, which reported exposures for PM2.5 in the range 29–72 µg/m3, P10 in the range 37–62 µg/m3, black carbon in range 3–21 µg/m3 (81). These exposure levels were broadly similar to those in cars (P2.5 22–85 µg/m3, P10 36–76 µg/m3, black carbon 6–30 µg/m3) (81). When the higher ventilation rates, and potentially longer travel times, for cyclists are taken into account, inhaled doses of particles can be up to 4–7 times higher than car passengers on the same route (80, 81).
A key issue is whether adverse effects of exposure to pollution negates health benefits of cycling when cycling in areas with elevated levels of air pollution. The available evidence suggests that this is not the case. In a prospective cohort study of over 52,000 Danish adults aged 50–65 years, followed up for 13 years, reductions in risk of disease specific (cardiovascular disease, respiratory disease, diabetes) and all-cause mortality associated with cycling were not modified by level of exposure to traffic-related air pollution (assessed as NO2) exposure (22).
Modelling studies of the effects of cycling on health outcomes also estimate that the health benefits associated with increased physical activity from cycling are several fold higher than the risks associated with increased inhaled air pollution doses. Mueller et al. (82) reported that health impacts related to differences in air pollution exposure were small, and the benefits associated with increased physical activity associated with taking up cycling were appromately an order of magnitude greater than the risks to the cyclist assocated with increased inhaled air pollution.
Tainio et al. (83), extended this work by modelling the risk-benefit balance of cycling in environments with increasingly high levels of air pollution. In this analysis they calculated a “tipping point” for different levels of air pollution where maximal health benefits are achieved and increasing cycling beyond this level would not accrue further health benefits, and a “breakeven point” where cycling beyond this level would lead to the risks exceeding the benefits. For cities with average the global average level of urban background pollution in the World Health Organistation database (PM2.5 levels of 22 µg/m3; for context the level in London is lower than this at 16 µg/m3), the tipping point would only be reached after 7 h per day of cycling and breakeven point would never be reached. For the average European city the tipping point was 2.5 h per day of cycling and breakeven point was 9.25 h of cycling. Even in the most polluted city in the database (Delhi, background PM2.5 levels of 153 µg/m3) the tipping point was 30 min of cycling per day and breakeven point was 45 min of cycling per day. Thus, the evidence indicates that in almost all but the most extreme air pollution conditions worldwide, the benefits of cycling exceed the risks of increased exposure to inhaled air pollution for all reasonable durations of daily cycling.
A summary of what we know and is not yet know about cycling and risk of collisions and exposure to air pollution is shown in Table 2.
5. The economic benefits and costs of cycling
The following section discusses the available evidence and current research gaps on the economic benefits and costs associated with cycling, considering costs to the individual, employers and wider society. We searched the academic and grey literature for reports on the economic benefits and costs of cycling, prioritising reporting data from reviews summarising existing evidence, but also reporting data from individual studies. Thus, this section provides a representative overview of the existing evidence, but does not represent a systematic review of the topic.
When evaluating the economic costs and benefits of cycling (in comparison to other modes of transport), it is important to consider costs at multiple levels. These include costs and benefits:
• To the individual (such as value of time, cost of purchase and depreciation, cost of fuel, health).
• To employers (such as productivity, absenteeism).
• To wider society (such as health and social care, congestion, environmental impact, collisions, taxation, employment).
Costs and benefits of cycling at these three levels are described in the sections below.
5.1. Economic benefits and costs of cycling to the individual
Evidence from Denmark indicates that choosing to cycle over driving a car is cost saving to the individual (84). Taking into account costs from vehicle taxes, fuel, oil, tires, repairs and depreciation, it was estimated that cycling one kilometre costs the individual €0.048 (£0.043), whereas travelling the same distance by car would cost €0.34 (£0.29) (at 2008 prices, currency exchange rates correct as of 06/12/2022 from www.xe.com). If taxation costs (which can vary considerably by country and vehicle emissions) are excluded, the cost of travel was per km €0.039/km (£0.035) by cycle and €0.16 (£0.14) by car.
As cycling is generally slower than driving—although this is not necessarily the case for urban commutes—cost of time is the highest cycling-related cost. Time costs valuations are derived from estimates of a population's willingness to pay for time changes in length of travel time and differ according to mode of transport (car, cycling or public transport)(84). It also differs between societies, so care must be taken in extrapolating Danish time cost data elsewhere. The Danish study assumed cycling speeds of 16 km.h−1 and driving speeds of 50 km.h−1, and costed driving time at €15.19/hour and €22.86/hour for delays (people as less tolerant of time in traffic, so time is costed higher for delays) and costing cycling time at €12.10/hour and €18.28/hour for delays, equating to a time cost of €0.672/km for cycling and €0.215/km (84).
The Danish reports estimated that cost to the individual of cycling collisions at €0.034/km (vs. €0/km for driving, though driving collisions did incur social costs, see Section 6.3 below), but that cycling was associated with individual gains in terms of prolonged life (by €0.358/km) and improved health (by €0.149/km) (84). Taken all of these factors into account the cost to the individual was €0.243/km for cycling and €0.511/km for travelling by car (84). Thus, overall these data suggest that travelling by cycling, even after accounting for additional time taken, reduces the economic costs of commuting by more than half, but further such economic evaluations in other contexts are needed extrapolate findings beyond a Danish setting. For example, in many urban contexts in the UK, assuming a driving speed of 50 km.h−1 is optimistic. Furthermore costs associated with insurance, as well as costs associated with the personal valuation of perceptions of safely (which may increase cycling costs) and potential discomfort during travel were not considered in this economic model. Inclusion of such factors is needed to provide a more complete picture of economic costs and benefits to the individual.
5.2. Cycle commuting and productivity
There is limited evidence available on the effects of cycle commuting on productivity. Data from studies in the UK and Denmark both reported that regular cyclists are more likely to have lower absenteeism per year than their non-cycling counterparts, by approximately 1 day per year (69, 70). A 2007 report by SQW for Cycling England on valuing the benefits of cycling, assumed that increased physical activity from cycling would lead to 0.4 days less absence per year, resulting in £64.40 saving per working person per year [assuming gross value added (GVA) per employee of £37,000 per year] (85).
Data on the cost-benefit of work-based cycle schemes is also limited. A 2008 report from Transport for London summarising the current state of knowledge on cycling in London to inform cycling policy, which reviewed evidence from over 100 studies, identified a work-based cycle pool scheme called Bikes for Business which could reportedly provide savings of £25–80/month per bike to the employer (due to reduced taxi and public transport costs) and approximately £50/month to the individual employee due to reduced travel costs (86). Furthermore, qualitative research reported that this scheme reduced employee travel time and avoided parking problems and was viewed by some employees as directly improving their productivity.
Thus, while the available data on cycling and productivity are limited the current evidence suggests a potential net benefit to employers of higher levels of cycling amongst employees. Development of employer-led interventions to increase levels of cycling amongst employees could conceivably result in net economic benefit to employers, even when costs of the intervention are taken into consideration.
Further research is needed to more robustly quantify the benefits and costs to employers, as well as employees, of pragmatic, large-scale interventions to increase cycling amongst employees. The first stage in this process would be to gain a better understanding of which type of interventions are most likely to be cost-effective in incentivising employees to increase their cycling participation.
5.3. The economic benefits and costs of cycling to wider society
There is a growing body of evidence indicating a net benefit to society of increasing participation in cycling as summarized in the following sections relating to cycling impacts on health, pollution and congestion, duty and taxation and employment and retail.
5.3.1. Economic costs and benefits of cycling in relation to health
To assess the economic costs and benefits of cycling in relation to health, it is necessary to first obtain an estimate of the epidemiological dose-response relationships between cycling and health benefits and health risks, such as pollution exposure and collisions, as well as potential changes to pollution as a result of changes in cycling and then scale them into an impact model according to level or change in level of population cycling (4). These health effects can be expressed in a number of ways. Typically, economists use incidences of chronic diseases prevented, disability adjusted life years (DALYS), premature mortality, years of life lost, or years of healthy life lost), and by placing an economic value on these health outcomes (for example, £30,000 per DALY avoided).
Commonly used models relevant to this report include the World Health Organization's Health Economic Assessment Tool (HEAT) for cycling and walking (87, 88) and the Integrated Transport and Health Impact Modelling Tool (ITHIM) (89). All such models assume that any cycling represents additional physical activity, rather than displacing other forms of physical activity, and also make assumptions about the nature of the dose-response relationship between cycling and health which are not fully understood, for example about benefits of very short duration bike rides and the tradeoff between intensity and duration for benefits (4). Some models attempt to take into consideration differential benefits according to other factors such as age. The models also assume that the epidemiological association between cycling and health outcomes is entirely causal and the level of risk reductions seen with increasing levels of cycling in observational studies would be replicated by interventions to increase cycling, which may not necessarily be the case. Notwithstanding these limitations, several studies have been undertaken to estimate the economic value of potential effects of cycling on health. These consistently report net health benefits of cycling would result in cost savings to national health budgets.
In 2008, Cavill et al. systematically reviewed economic analyses of transport infrastructure and policies which included health effects related to cycling (90). This review, which pre-dated the introduction of the HEAT and ITHIM modelling tools, included 15 studies, 10 of which considered only cycling and five considered cycling and walking, all but one of these studies (which was from the USA) were conducted in European countries. Three studies were considered high quality, five moderate quality and seven low quality in terms of methodology. While the studies were heterogeneous in nature and presented a wide range of results, benefit-cost ratios (present value of benefits/present value of costs) and the value attributed to each new cyclist were frequently reported outcomes. All but one study reported a positive benefit-cost ratio, with a median benefit-cost ratio of 5:1 and a range from −0.4 to 32.5. However, the authors suggested that these values should be treated with caution given the different assumptions made across studies. Six studies presented results in terms of value attributed to each new cyclist ranging from €127 to €1,290, with much of the difference in value due to different assumptions [some which Cavill et al. (90) considered incorrect], and many studies not being transparent in their methods. However, these values are in line with a report by SQW Consulting for Cycling for England which estimated the monetary value of one additional cyclist cycling for one year, replacing 50% of car trips with cycling trips. These models calculated benefits of £408.67 per cyclist per year in terms of lower risk of loss of life with an additional £28.30 per year in NHS savings (91).
Some reports have attempted to quantify population-level health cost savings associated increasing levels of cycling, or active travel. Jarrett et al. (92) modelled the effects on NHS costs (including management and treatment of acute and chronic diseases, and road traffic injuries) over 20 years of increasing cycling by 3 km per day and walking by 1 km per day, amongst all individuals in England and Wales living in urban areas (those with 20,000 residents or more). The model estimated a saving of ∼£17 billion over 20 years to the NHS budget (at 2,010 prices)—approximately 1% of the yearly health care budget.
A report by Fishman and coworkers (93), used HEAT to estimate the economic health benefits of cycling in the Dutch population. Based on age-specific weekly cycling times (average of 74 min per week across the age range from 20 to 90 years) and mortality rates it was estimated that current levels of cycling prevented 6,657 deaths per year in the Netherlands, resulting in a 0.57 year increase in life expectancy and an annual economic benefit of €18.6 billion, assuming a value of a statistical life of €2.8 million per prevented death.
5.3.2. Economic benefits and costs of cycling in relation to pollution and congestion
The available evidence, albeit limited, quantifying the benefits of cycling on congestion and pollution consistently reports that increased cycling levels would lead to reductions in associated costs. These approaches model the effects of replacing car journeys with cycling journeys and monetary attribute costs to reductions in emissions, noise and congestion. Using this approach it was estimated that, in Copenhagen, replacing car travel by cycling would result in a saving of €0.004/km in air pollution costs, €0.005/km in climate change costs, €0.0062/km in congestion costs (84, 94).
Crawford and Lovelace (95) used Transport Analysis Guidance (TAG) data from the Department for Transport to estimate pollution and congestion cost savings which could be realised by meeting CDP and GBC cycling targets in 2025 and 2050. Compared with a baseline of zero growth in cycling:
• The CDP plan was projected to result economic benefits in 2025 of £283.5 million in reduced congestion, £10.9 million in reduced greenhouse gas emissions, £2.4 million in decreased noise and £1.5 million in improved air quality. Corresponding economic benefits in 2050 were £956.3 million (reduced congestion), £36.6 million (greenhouse gases), £7.9 million (noise) and £5.2 million (air quality).
• The more ambitious GBC target was projected to result in economic benefits for congestion, greenhouse gases, noise, and air quality of £1.09 billion, £41.5 million, £9.1 million, and £5.9 million, respectively in 2025; and £7.1 billion, £271.6 million, £59.2 million, and £38.6 million, respectively in 2050.
Modelling studies evaluating potential effects of increasing levels of cycling for transport on air pollution (Table 2) also considered the effects on costs associated with congestion. Creutzig and coworkers (96) modelled the effects of policy scenarios to reduce motorised transport use and increase use of public transport and non-motorized transport, which including increasing cycling infrastructure, on pollution and congestion in four European cities. Economic values for pollution changes were not reported, but it was estimated that transport scenarios in Malmo and Freiburg which resulted in increases in non-motorised transport trips by ∼50% would provide estimated economic benefits of reduced congestion of €363 million per annum (∼€800 per person per annum) and €184 million per annum (∼€650 per person per annum) respectively in the two cities.
6. The barriers to cycling participation
A detailed understanding of barriers to cycling amongst those who do not cycle regularly is essential to inform the design of effective interventions to facilitate increased levels of cycling. This section discusses the evidence on barriers to increasing cycling in adults. This evidence comes from two sources. First, peer-reviewed studies were identified via searches of key databases [PubMed, CINAHL (Cumulative Index to Nursing and Allied Health), AMED (Allied and Complimentary medicine database), PeDRO (Physiotherapy Evidence Database), Cochrane library]. Although our search was not exhaustive, it is likely that the evidence presented here is representative of the evidence base. There were 10 studies identified; these included one systematic review (97) and nine further original research studies (98–106) which employed a range of quantitative and qualitative methods, including surveys, interviews and focus groups (Supplementary Table S9).
6.1. Environmental barriers to cycling
The systematic review, which included 21 observational studies from five countries (14 from the USA, three from Australia, two from the UK, and one each from Canada and the Netherlands) focused on the effect of the environment on cycling levels (97). It reported that key environmental-level barriers to cycling included: perceived and objective traffic danger; distance from cycle paths; long trip distance and steep inclines, leading to; and high levels of effort.
Conversely, the presence of dedicated cycle routes or paths, separation of cycling from other traffic, high population density, short trip distance, and proximity of a cycle path or green space were positively associated with cycling (97). Similar environmental-level barriers to cycling were also reported by studies not included in the review. The main findings from these additional studies were that the main barriers to cycling were: low perceived safety (98–100, 102, 103); lack of cycling infrastructure (including secure cycle parking and shower facilities) (98–103); distance and perceived effort (100, 102, 106); and bad weather (98–100, 104, 106).
Related to safety, three studies further identified the perceived poor attitude of other road users as a barrier to cycling (98, 102, 103). They recommended education for other road users on safe interaction with cyclists, and the promotion of cycling as a mode of transport (not just a recreational activity) to help normalise it within a population.
One study reported that owning a car was negatively associated with using a bike as a mode of transport (101), and suggested making it less appealing to use a car (e.g., raising the cost of parking at work) may help to increase cycling amongst car owners.
One study used a modelling approach to predict that increases in numbers of people cycling would lead to greater political will to improve the cycling environment and a “safely in numbers” effect that would increase the perceived and actual safety of cycling, thereby creating a virtuous cycle for growth (103).
Finally, at an environmental level, the presence of dedicated cycle routes or paths, separation of cycling from other traffic, high population density, short trip distance, and proximity of a cycle path or green space appear to be positively associated with cycling (97).
6.2. Individual-level barriers to cycling
The studies that were not included in the review also reported on individual-level, barriers to cycling. These included: lack of skills and confidence (100, 101, 105); physical discomfort and impracticality of cycling (104–106); and cost (99), although cost-saving was also reported as a facilitator to cycling (98, 99).
In contrast to studies undertaken in areas with relatively weak infrastructure (98–103), in countries where cycling infrastructure was good (Netherlands, Belgium), individual-level factors were generally more important than environmental-level factors in predicting cycling behaviour (105, 106). While the relative importance of individual vs. environmental barriers will be context-specific, this evidence suggests that focusing solely on improving infrastructure may not be sufficient to maximise cycling participation.
Connell et al. conducted a full exploration of barriers for office workers for the development and optimisation of a workplace cycling intervention (107). They first nationally representative survey of UK adults, then undertook focus groups with bank employees to understand any context-specific barriers and ways in which these might be overcome. These activities led to identification of 10 individual-level, two social-level, and five organizational-level modifiable factors, which were mapped to candidate intervention components previously identified in a scoping review of cycling initiatives (5) This work led to the development of a tailored multi-component workplace cycling intervention designed to address as many barriers to cycling to enable a sustained uptake in cycling behaviour in bank employees.
There were a number of evidence gaps in the peer-reviewed literature, particularly on barriers to cycling in older adults and disabled populations. Most studies specifically examined cycling as a mode of transport (99–102, 105, 106) or explored barriers to transport and recreational cycling combined (97, 98, 103, 104). Information on perceived barriers to recreational cycling specifically (which are likely to differ from barriers to cycling for transport) was limited.
6.3. Summary of evidence on barriers to cycling
The main barriers to cycling operate on both environmental (lack of facilities and infrastructure, weather, and perceived effort due to long distances, hills) and individual [perceived lack of safety and lack of confidence, skills and time, and perceived inconvenience/ impracticality relative to alternatives (i.e., using the car)] levels.
Importantly, women may be more concerned about safety and lack confidence to a greater degree than men, and even where cycling infrastructure is good, individual barriers remain important.
In addition, the promotion of cycling as an everyday (useful, enjoyable and social) activity, rather than a sport will be needed to maximise uptake of cycling. A multi-faceted approach targeting different population groups in different contexts is therefore needed to reduce barriers to cycling and facilitate increased participation.
However, more research is needed to understand specific barriers to recreational cycling, and in different population groups (i.e., older people, specific disabilities, specific BAME groups). Table 1 summarises what we know and what is not yet know about barriers to cycling.
7. Potential solutions to increase the number of people cycling: what has worked, what hasn't worked, and what could be tried?
When implementing and evaluating potential solutions to increase the number of people cycling, it can be helpful to think about the “level” of the intervention. A useful and previously used (108) model is the social-ecological framework (109). The factors that can influence a behaviour (in this case cycling) and also the levels at which interventions and actions can be aimed at: the individual level (may include biological and psychological approaches); the social level (may include family, group, cultural and community approaches); interventions at the physical environment level (could include facilities and infrastructure); and the policy level (may include legislation, funding and national strategies and priorities).
7.1. The current evidence for the promotion of cycling
The evidence for the promotion of cycling draws from different study types; observational studies examining factors which influence cycling; experimental studies, empirical studies such as natural experiments, and evaluations of public health policies. In the past two decades there have been numerous attempts to synthesise this evidence. Table 3 provides an overview of the current evidence base for the promotion of cycling using key selected systematic reviews and public health guidance reports.
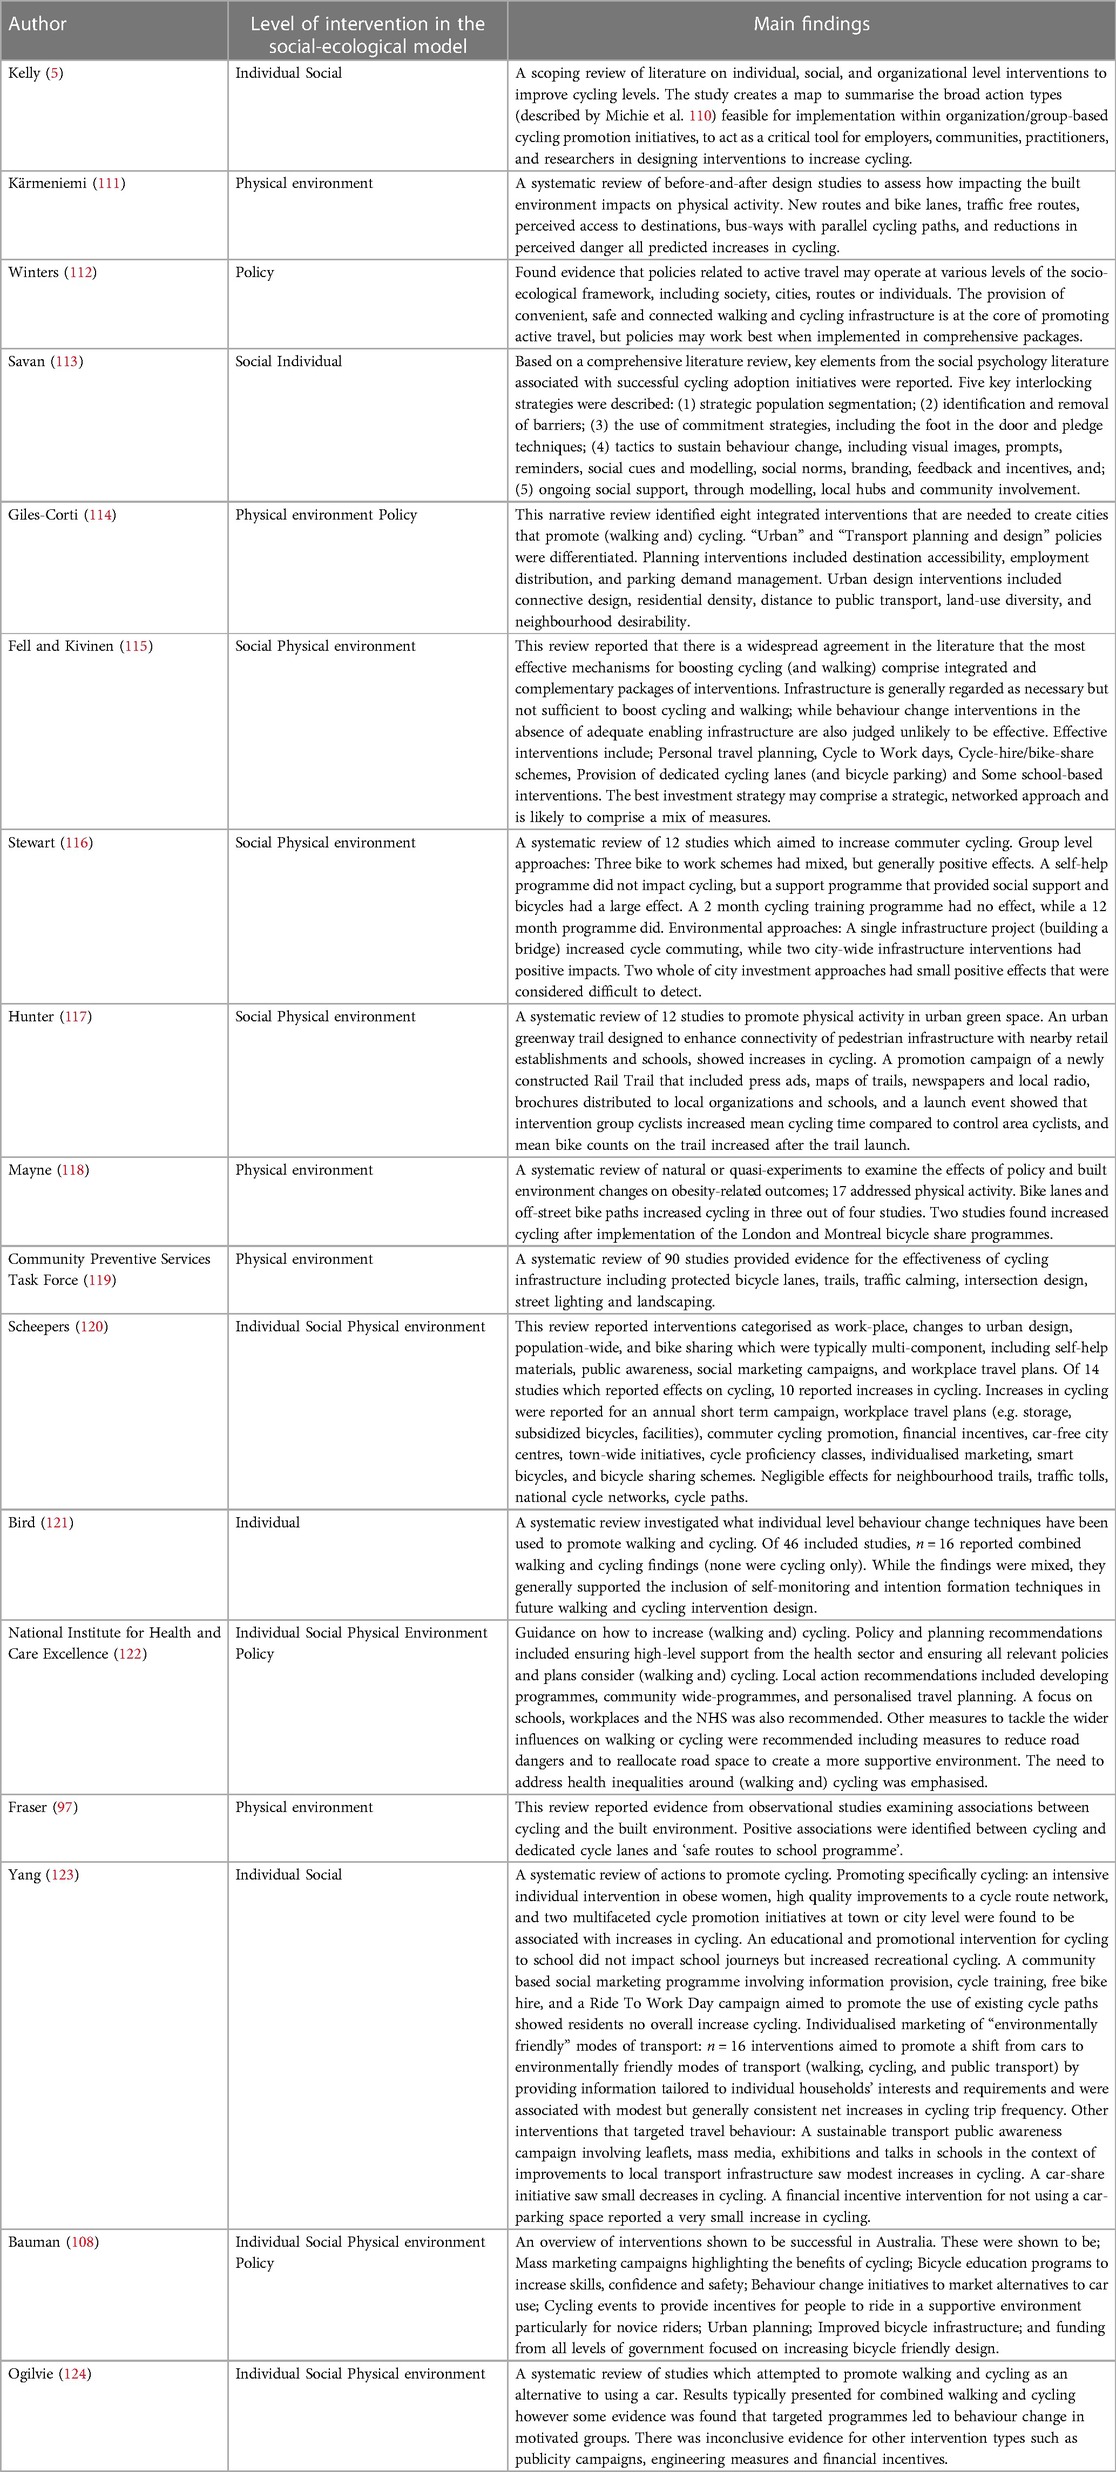
Table 3. An overview of key reviews on potential solutions and facilitators for promoting cycling.
There are many potential solutions to increase cycling which exist across all four levels of the socio-ecological model and which may target different types of cycling. For example, interventions have attempted to increase commuter cycling at the level of the individual (123), longitudinal studies (observing people over time) provide evidence of how changes in the physical environment may lead to changes in leisure and/or transport cycling (111), and policies have been developed to promote active travel to impact at community, city and population levels (112).
Not all reviews in Table 3 report consistent findings in the expected direction for a particular intervention or action. This may be attributed to differences in: the aim of each review; the types of study included within each review; and the methodological quality of individual studies with a review.
It is also important to consider that some potential solutions may only have an impact on one type of cycling; as an example, the provision of new cycle paths in a city centre may lead to an increase in cycling for transport but have no effect on cycling for recreation, or vice versa. Additionally, when designing and evaluating interventions and policies to increase active transport cycling is often combined with walking; this can make it difficult to identify what actions are specifically targeted towards cycling and what the impact of the intervention is on cycling.
There are clearly some challenges to identifying the optimal solutions to promote cycling from the existing evidence base. However, acknowledging these challenges, it is possible to identify a range of promising and potential solutions from across the different levels of the socio-ecological model.
7.1.1. The individual level
The evidence base is relatively small and inconsistent at this level. Several studies implemented walking and cycling actions in the form of self-help materials and targeted behaviour change programmes for active travel. These have been found to be effective in shifting trips being made by car to walking and cycling. However, few studies have robustly evaluated individual level intervention solutions for cycling in isolation; these actions are typically included as part of a multi-component or multi-behaviour strategy. Several studies evaluating individualised travel planning do report positive findings although it should be noted these typically contain several accompanying social and physical environment actions. There is mixed evidence for the impact of financial incentives on cycling although some studies do demonstrate short-term positive effects. There is little evidence that education and awareness campaigns by themselves are sufficient to prompt behaviour change. Such campaigns may be an important first step to changing attitudes around cycling, but additional accompanying actions to identify and remove barriers appear to be required.
7.1.2. Social level solutions
At this level, the evidence base is still early in its development. Again, it is often difficult to identify actions that would be considered purely at the social level; there is often overlap with individual level actions or they contribute to a multi-component, community wide project also including changes to the physical environment. Currently, there is insufficient evidence to support the promotion of several potential solutions at this level by themselves in promoting cycling. Such actions include: workplace transport planning, one-off large-scale cycling events (e.g., a Ride to Work Day), conducting workplace challenges, and having workplace cycling champions.
Again there are instances where such programmes have been effective, and others where they have not. Whilst such solutions by themselves may not produce behaviour change, they may be useful for the purposes of reinforcing and reminding people about their behaviour, enhancing social support and contributing to the creation of a cycling culture within a community or organisation.
7.1.3. Physical environment level solutions
The strongest and largest body of evidence exists at this level. Early reviews found inconsistent findings in associations between the physical environment and cycling, potentially due to a lack of studies and low methodological quality. More recent reviews reflect the increased research focus on the physical environment as an important determinant of physical activity behaviours such as cycling.
Observational evidence consistently demonstrates that several characteristics related to the design of the physical environment including the connectivity of streets, distance and access to destinations, and perceived safety are associated with levels of cycling. There is also emerging evidence that changes to these characteristics are associated with changes in cycling. Most recently, there has been an increase in more robust evaluations of cycling infrastructure projects—both in improvements to existing infrastructure and the creation of new infrastructure.
The evidence is becoming increasingly strong that introducing actions such as appropriate signage, local facilities (bicycle racks, showers etc), dedicated and high-quality cycle paths, comprehensive networks, and traffic calming measures leads to an increase in cycling. It should be noted that such infrastructure improvements may work best when combined with actions at other levels of the socio-ecological model. There is also a substantial body of evidence emerging, demonstrating the consistently positive effects of bicycle hire and sharing schemes within organisations and at wider community and city levels. However, it is important to recognise, as Fell and Kivenen state, that “Infrastructure is generally regarded as necessary but not sufficient to boost cycling” (115).
7.1.4. Policy level solutions
The evidence on the impact of interventions at the policy level is the least developed. Much of the evidence appraised by the key reviews in Table 3, proposes potential policies that could be created and implemented based around interventions at other levels of the social-ecological model (i.e., utilising policy-related evidence). For example, using the evidence base around improvements to infrastructure and the physical environment to suggest policies should be generated to improve cycle routes. Similarly, several reviews recommend an increase in government investment in cycling related projects to support attempts to increase cycling but without a formal evaluation of any previous funding strategies. However, there is some mixed evidence which suggests that introducing policy and legislation to lower vehicle speed limits (i.e., introduction of 20 mph zones and limits) may result in an increase in cycling.
7.2. Summary of solutions to increase the number of people cycling
Cycling is a complex, multi-faceted behaviour, with barriers and facilitators operating at multiple levels for different individuals and sub-groups of the population. Accordingly, in order to address these barriers, multiple solutions will be required. What is clearly evident from this overview of the evidence base is that no single intervention, programme or policy will be sufficient to produce long-lasting, population-wide increases in cycling.
Research has demonstrated that it is essential to target both the “place” through improving cycling infrastructure at the physical environmental level, and also the “person” through individual and social level support. Whilst intervening at the level of the physical environment and improving the infrastructure for cycling is possible and undoubtedly necessary, doing so in isolation is unlikely to be sufficient to prompt behaviour change for many individuals. Thus, what will be needed to best promote cycling has been described as “a coordinated package of complementary infrastructure measures, programs and policies” (77). It will also require time following introduction of such packages in order for cycling to become normalised and imbedded in a workplace or in society in general.
However, large-scale infrastructure and national policy changes require substantial financial and political investment and are simply not feasible for several organisations such as schools, business, charities and workplaces who may wish to promote cycling. Therefore, it is imperative that there is further development and a rigorous examination of the types of interventions and programmes that these stakeholders can implement—namely those at the individual and social levels. Critically, this is where the evidence base is weakest and it has been acknowledged that there is “a paucity of studies that investigate and rigorously evaluate the independent effects of behaviour-based cycling promotion initiatives” (113).
Table 4 provides a summary of what we know and what is not yet know about how best to promote cycling. The existing evidence base for the promotion of cycling is not complete, and this limits our ability to affect the sort of change that would impact population health. In addition to the limitations of the current evidence base noted above, there are two important reasons why the existing evidence base does not give the full picture.
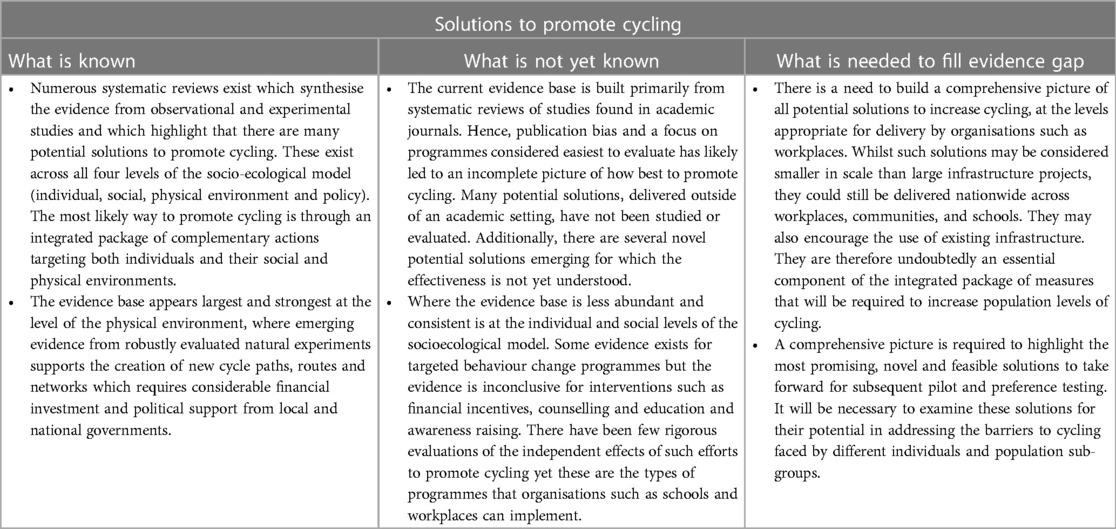
Table 4. What is known and what is not yet know about how best to promote cycling.
First, since the evidence base is comprised of what has been studied and evaluated, typically in an academic setting. Therefore, it will always tend to be influenced by what is quick, convenient, and cheap to study and evaluate. It is likely to be further influenced by what is of interest to academic journals and research funders (this is known as publication bias). In short, not all things get evaluated, and not all things that get evaluated make it into journals and reports. The outcome is that the “accepted” evidence base can give a very limited picture of the full scope of approaches.
Second, there are some novel and fast changing approaches, for which the effectiveness is not yet fully understood. These include potential strategies such as; the introduction of e-Bikes (electric assisted bicycles) (125), the use of evolving technologies such as Smart Phone applications (126), and Intelligent Transport using the Internet of Things (127).
There is a need to understand how to increase cycling through interventions that can be delivered effectively, cost-effectively and at scale to benefit population health. For the reasons given above, it is important to look beyond what is already evaluated and deemed effective. It is clear that a critical next step is to build the evidence base in terms of possible approaches to promote cycling. An efficient way to do this would be to undertake a scoping review of all existing approaches utilising traditional electronic record searching, and importantly the databases of key cycling promotion organisations, and expert stakeholder consultation. This would generate a more comprehensive evidence base, identifying interventions which have been rigorously evaluated and published and also interventions which have not been evaluated but may provide alternative and potentially novel solutions to promote cycling. This would facilitate mapping of the actions and functions of the different intervention approaches (the active ingredients) as well as specified intervention characteristics including; duration (how long the intervention lasts for), scale (at level of socio-ecological model), setting (e.g., workplace, community, school, etc.), and target population (e.g., adults).
A conceptual version of this is presented in Figure 3, which maps intervention actions against the socio-ecological model. It is apparent from this figure that moving up the socio-ecological model into Physical Environment (yellow) and Policy (pink), the implementation of the actions requires greater resource and influence. As stated, actions at these levels are likely to be necessary, but not sufficient, to induce substantial shifts in cycling participation at the population level, and actions at the Individual (green) and Social (blue) levels are also likely to be needed. Thus, a map of potential interventions across the socio-ecological model will enable identification of actions which are feasible for implementation by organisations, workplaces, schools, and local stakeholders and can complement interventions at the level of policy and the macro-physical environment and provide the base for preference testing and ultimately intervention piloting, on the route to creating an evidence based tool-kit for promoting cycling.
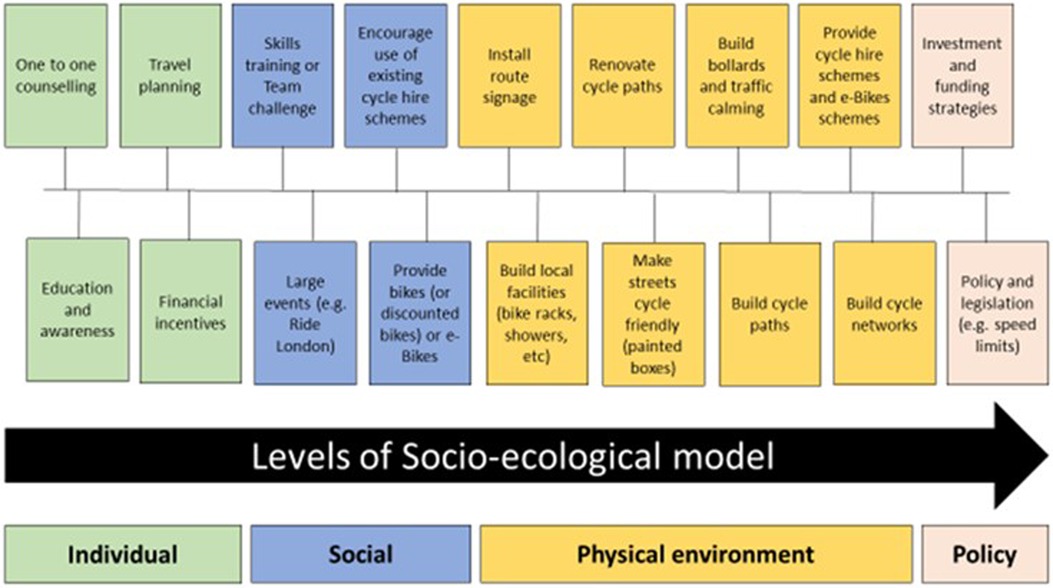
Figure 3. Interventions and actions to promote cycling mapped on the socio-ecological model.
7.3. Case study: the cycle nation project
In recognition of the need to address barriers at different levels of the socio-ecologial model, the Cycle Nation Project (CNP) aimed to develop, test the feasibility of, and optimise a multi-component workplace-based intervention to increase cycling among office staff at a multinational bank (107). To ensure that the most appropriate strategies were utilised in the intervention, focus groups were conducted with bank employees to understand any context-specific barriers and ways in which these might be overcome. This led to identification of 10 individual-level, two social-level, and five organizational-level modifiable factors, which were mapped to candidate intervention components previously identified in the Kelly et al. scoping review of cycling initiatives (5). The resultant pilot intervention included 32 core components across six intervention functions (education, persuasion, incentivisation, training, environmental restructuring, enablement). Participants received a loan bike for 12-weeks (or their own bike serviced), and a 9-week cycle training course (condensed to 6 weeks for those already confident in basic cycling skills), including interactive information sharing activities, behaviour change techniques (e.g., weekly goal setting), bike maintenance training, practical off-road cycling skill games and on-road group rides. To address the sustainability of the intervention, sessions were delivered by trained bank staff members who were experienced cyclists.
The CNP pilot intervention was delivered across three sites with 68 participants. It was completed in two sites (the third site was stopped due to COVID-19) and was feasible and acceptable to both women and men and across different ethnicities. In addition, the CNP intervention was successful (at least in the short term) in increasing cycling by 3 rides/week on average, and improving perceptions of safety, vitality, confidence, and motivation to cycle (107). This case study affirms how targeted intervention strategies can be applied to specific populations to successfully improve cycling behaviours. For successful large-scale rollout, there is need for development and evaluation of interventions, like the CNP, which use multi-component strategies.
8. Summary
Given the potential positive impact sustained uptake in cycling can have on public health, wellbeing, the economy, and the environment, it is important to invest in effective solutions to improve cycling behaviour. Although still in its infancy, research insights into behaviour change strategies show potential to foster increased cycling levels when applied to target populations. From reviewing the available literature, we observed that programme design for interventions to increase cycling may be most effective when a multi-component approach is utilised. Therefore, there is further need to develop and evaluate multi-component cycling interventions for successful large-scale application to maximise cycling uptake.
Author contributions
JG, CG, PK, GB, and EM contributed to conception and design of the study. All authors contributed to the article and approved the submitted version.
Funding
This work was supported by a Research Grant from British Cycling and HSBC UK.
Acknowledgments
We would like to thank Allison Coles and Sarah Broadfield from British Cycling for work in development of the Cycle Nation Project.
Conflict of interest
The authors declare that the research was conducted in the absence of any commercial or financial relationships that could be construed as a potential conflict of interest.
The nature of the Cycle Nation Project meant that the funders, British Cycling and HSBC UK, were intimately involved as representatives in this review. All analysis was performed by the authors without input from British Cycling or HSBC UK.
Publisher's note
All claims expressed in this article are solely those of the authors and do not necessarily represent those of their affiliated organizations, or those of the publisher, the editors and the reviewers. Any product that may be evaluated in this article, or claim that may be made by its manufacturer, is not guaranteed or endorsed by the publisher.
Supplementary material
The Supplementary Material for this article can be found online at: https://www.frontiersin.org/articles/10.3389/fspor.2023.1168357/full#supplementary-material
References
1. Varela AR, Hallal PC, Grueso JM, Pedišić Ž, Salvo D, Nguyen A, et al. Status and trends of physical activity surveillance, policy, and research in 164 countries: findings from the global observatory for physical activity—GoPA! 2015 and 2020 surveys. J Phys Activity Heal. (2022) 20(2):1–17. doi: 10.1123/jpah.2022-0464
2. Murphy J, Milton K, Mclaughlin M, Shilton T, McLoughlin GM, Reece LJ, et al. Advocating for implementation of the global action plan on physical activity: challenges and support requirements. J Phys Activity Heal. (2023) 20(1):10–9. doi: 10.1123/jpah.2022-0357
3. Kelly P, Kahlmeier S, Götschi T, Orsini N, Richards J, Roberts N, et al. Systematic review and meta-analysis of reduction in all-cause mortality from walking and cycling and shape of dose response relationship. Int J Behav Nutr Phy. (2014) 11(1):132. doi: 10.1186/s12966-014-0132-x
4. Götschi T, Garrard J, Giles-Corti B. Cycling as a part of daily life: a review of health perspectives. Transport Rev. (2016) 36(1):45–71. doi: 10.1080/01441647.2015.1057877
5. Kelly P, Williamson C, Baker G, Davis A, Broadfield S, Coles A, et al. Beyond cycle lanes and large-scale infrastructure: a scoping review of initiatives that groups and organisations can implement to promote cycling for the cycle nation project. Br J Sport Med. (2020) 11(132). doi: 10.1136/bjsports-2019-101447
6. Koolhaas CM, Dhana K, Schoufour JD, Lahousse L, van Rooij FJA, Ikram MA, et al. Physical activity and cause-specific mortality: the Rotterdam study. Int J Epidemiol. (2018) 47(5):1705–13. doi: 10.1093/ije/dyy058
7. Oja P, Kelly P, Pedisic Z, Titze S, Bauman A, Foster C, et al. Associations of specific types of sports and exercise with all-cause and cardiovascular-disease mortality: a cohort study of 80 306 British adults. Brit J Sport Med. (2017) 51(10):812. doi: 10.1136/bjsports-2016-096822
8. Celis-Morales CA, Lyall DM, Welsh P, Anderson J, Steell L, Guo Y, et al. Association between active commuting and incident cardiovascular disease, cancer, and mortality: prospective cohort study. Br Med J. (2017) 357:j1456. doi: 10.1136/bmj.j1456
9. Andersen ZJ, de Nazelle A, Mendez MA, Garcia-Aymerich J, Hertel O, Tjønneland A, et al. A study of the combined effects of physical activity and air pollution on mortality in elderly urban residents: the danish diet, cancer, and health cohort. Environ Health Persp. (2015) 123(6):557–63. doi: 10.1289/ehp.1408698
10. Warburton DE, Charlesworth S, Ivey A, Nettlefold L, Bredin SS. A systematic review of the evidence for Canada’s physical activity guidelines for adults. Int J Behav Nutr Phy. (2010) 7(1):39. doi: 10.1186/1479-5868-7-39
11. Sofi F, Capalbo A, Cesari F, Abbate R, Gensini GF. Physical activity during leisure time and primary prevention of coronary heart disease: an updated meta-analysis of cohort studies. Eur J Cardiov Prev R. (2008) 15(3):247–57. doi: 10.1097/HJR.0b013e3282f232ac
12. Nocon M, Hiemann T, Müller-Riemenschneider F, Thalau F, Roll S, Willich SN. Association of physical activity with all-cause and cardiovascular mortality: a systematic review and meta-analysis. Eur J Prev Cardiol. (2007) 15(3):239–46. doi: 10.1097/HJR.0b013e3282f55e09
13. Sattelmair J, Pertman J, Ding EL , K HW III, Haskell W, Lee IM. Dose response between physical activity and risk of coronary heart disease. Circulation. 2011;124(7):789–95. doi: 10.1161/CIRCULATIONAHA.110.010710
14. Zhao Y, Hu F, Feng Y, Yang X, Li Y, Guo C, et al. Association of cycling with risk of all-cause and cardiovascular disease mortality: a systematic review and dose–response meta-analysis of prospective cohort studies. Sports Med. (2021) 51(7):1439–48. doi: 10.1007/s40279-021-01452-7
15. Sahlqvist S, Goodman A, Simmons RK, Khaw KT, Cavill N, Foster C, et al. The association of cycling with all-cause, cardiovascular and cancer mortality: findings from the population-based EPIC-norfolk cohort. BMJ Open. (2013) 3(11):e003797. doi: 10.1136/bmjopen-2013-003797
16. Johnsen NF, Ekblond A, Thomsen BL, Overvad K, Tjønneland A. Leisure time physical activity and mortality. Epidemiology. (2013) 24(5):717–25. doi: 10.1097/EDE.0b013e31829e3dda
17. Schnohr P, Marott JL, Jensen JS, Jensen GB. Intensity versus duration of cycling, impact on all-cause and coronary heart disease mortality: the Copenhagen City heart study. Eur J Prev Cardiol. (2010) 19(1):73–80. doi: 10.1177/1741826710393196
18. Tanasescu M, Leitzmann MF, Rimm EB, Willett WC, Stampfer MJ, Hu FB. Exercise type and intensity in relation to coronary heart disease in men. Acc Curr J Rev. (2003) 12(1):29–30. doi: 10.1016/S1062-1458(02)01011-5
19. Besson H, Ekelund U, Brage S, Luben R, Bingham S, Khaw K, et al. Relationship between subdomains of total physical activity and mortality. Medicine Sci Sports Exerc. (2008) 40(11):1909–15. doi: 10.1249/MSS.0b013e318180bcad
20. Matthews CE, Jurj AL, Shu X-o, Li HL, Yang G, Li Q, et al. Influence of exercise, walking, cycling, and overall nonexercise physical activity on mortality in Chinese women. Am J Epidemiol. (2007) 165(12):1343–50. doi: 10.1093/aje/kwm088
21. Blond K, Jensen MK, Rasmussen MG, Overvad K, Tjønneland A, Østergaard L, et al. Prospective study of bicycling and risk of coronary heart disease in Danish men and women. Circulation. (2016) 134(18):1409–11. doi: 10.1161/CIRCULATIONAHA.116.024651
22. Kubesch NJ, Jørgensen JT, Hoffmann B, Loft S, Nieuwenhuijsen MJ, Raaschou-Nielsen O, et al. Effects of leisure-time and transport-related physical activities on the risk of incident and recurrent myocardial infarction and interaction with traffic-related air pollution: a cohort study. J Am Heart Assoc. (2018) 7(15):e009554. doi: 10.1161/JAHA.118.009554
23. Hoevenaar-Blom MP, Wendel-Vos GW, Spijkerman AM, Kromhout D, Verschuren W. Cycling and sports, but not walking, are associated with 10-year cardiovascular disease incidence: the MORGEN study. Eur J Prev Cardiol. (2010) 18(1):41–7. doi: 10.1097/HJR.0b013e32833bfc87
24. Johnsen NF, Christensen J, Thomsen BL, Olsen A, Loft S, Overvad K, et al. Physical activity and risk of colon cancer in a cohort of danish middle-aged men and women. Eur J Epidemiol. (2006) 21(12):877–84. doi: 10.1007/s10654-006-9076-z
25. Johnsen NF, Tjønneland A, Thomsen BLR, Christensen J, Loft S, Friedenreich C, et al. Physical activity and risk of prostate cancer in the European prospective investigation into cancer and nutrition (EPIC) cohort. Int J Cancer. (2009) 125(4):902–8. doi: 10.1002/ijc.24326
26. Steindorf K, Friedenreich C, Linseisen J, Rohrmann S, Rundle A, Veglia F, et al. Physical activity and lung cancer risk in the European prospective investigation into cancer and nutrition cohort. Int J Cancer. (2006) 119(10):2389–97. doi: 10.1002/ijc.22125
27. Millett C, Agrawal S, Sullivan R, Vaz M, Kurpad A, Bharathi AV, et al. Associations between active travel to work and overweight, hypertension, and diabetes in India: a cross-sectional study. Plos Med. (2013) 10(6):e1001459. doi: 10.1371/journal.pmed.1001459
28. Laverty AA, Mindell JS, Webb EA, Millett C. Active travel to work and cardiovascular risk factors in the United Kingdom. Am J Prev Med. (2013) 45(3):282–8. doi: 10.1016/j.amepre.2013.04.012
29. Baan CA, Stolk RP, Grobbee DE, Witteman JCM, Feskens EJM. Physical activity in elderly subjects with impaired glucose tolerance and newly diagnosed diabetes Mellitus. Am J Epidemiol. (1999) 149(3):219–27. doi: 10.1093/oxfordjournals.aje.a009795
30. Ansari RM. Effect of physical activity and obesity on type 2 diabetes in a middle-aged population. J Environ Public Heal. (2009) 2009:195285. doi: 10.1155/2009/195285
31. Rasmussen MG, Grøntved A, Blond K, Overvad K, Tjønneland A, Jensen MK, et al. Associations between recreational and commuter cycling, changes in cycling, and type 2 diabetes risk: a cohort study of danish men and women. Plos Med. (2016) 13(7):e1002076. doi: 10.1371/journal.pmed.1002076
32. Villegas R, Shu XO, Li H, Yang G, Matthews CE, Leitzmann M, et al. Physical activity and the incidence of type 2 diabetes in the Shanghai women’s health study. Int J Epidemiol. (2006) 35(6):1553–62. doi: 10.1093/ije/dyl209
33. Hu G, Qiao Q, Silventoinen K, Eriksson JG, Jousilahti P, Lindström J, et al. Occupational, commuting, and leisure-time physical activity in relation to risk for type 2 diabetes in middle-aged Finnish men and women. Diabetologia. (2003) 46(3):322–9. doi: 10.1007/s00125-003-1031-x
34. Aune D, Norat T, Leitzmann M, Tonstad S, Vatten LJ. Physical activity and the risk of type 2 diabetes: a systematic review and dose–response meta-analysis. Eur J Epidemiol. (2015) 30(7):529–42. doi: 10.1007/s10654-015-0056-z
35. Østergaard L, Grøntved A, Børrestad LAB, Froberg K, Gravesen M, Andersen LB. Cycling to school is associated with lower BMI and lower odds of being overweight or obese in a large population-based study of Danish adolescents. J Phys Activity Heal. (2012) 9(5):617–25. doi: 10.1123/jpah.9.5.617
36. Hollingworth M, Harper A, Hamer M. Dose–response associations between cycling activity and risk of hypertension in regular cyclists: the UK cycling for health study. J Hum Hypertens. (2015) 29(4):219–23. doi: 10.1038/jhh.2014.89
37. Mytton OT, Ogilvie D, Griffin S, Brage S, Wareham N, Panter J. Associations of active commuting with body fat and visceral adipose tissue: a cross-sectional population based study in the UK. Prev Med. (2018) 106:86–93. doi: 10.1016/j.ypmed.2017.10.017
38. Flint E, Cummins S. Active commuting and obesity in mid-life: cross-sectional, observational evidence from UK biobank. Lancet Diabetes Endocrinol. (2016) 4(5):420–35. doi: 10.1016/S2213-8587(16)00053-X
39. Nordengen S, Andersen LB, Solbraa AK, Riiser A. Cycling and cardiovascular disease risk factors including body composition, blood lipids and cardiorespiratory fitness analysed as continuous variables: part 2—systematic review with meta-analysis. Brit J Sport Med. (2019) 53(14):879. doi: 10.1136/bjsports-2018-099778
40. Grøntved A, Koivula RW, Johansson I, Wennberg P, Østergaard L, Hallmans G, et al. Bicycling to work and primordial prevention of cardiovascular risk: a cohort study among Swedish men and women. J Am Heart Assoc. (2016) 5(11):e004413. doi: 10.1161/JAHA.116.004413
41. Mytton OT, Panter J, Ogilvie D. Longitudinal associations of active commuting with body mass index. Prev Med. (2016) 90:1–7. doi: 10.1016/j.ypmed.2016.06.014
42. Lusk AC, Mekary RA, Feskanich D, Willett WC. Bicycle riding, walking, and weight gain in premenopausal women. Arch Intern Med. (2010) 170(12):1050–6. doi: 10.1001/archinternmed.2010.171
43. Ekelund U, Besson H, Luan J, May AM, Sharp SJ, Brage S, et al. Physical activity and gain in abdominal adiposity and body weight: prospective cohort study in 288,498 men and women. Am J Clin Nutrition. (2011) 93(4):826–35. doi: 10.3945/ajcn.110.006593
44. Troy KL, Mancuso ME, Butler TA, Johnson JE. Exercise early and often: effects of physical activity and exercise on women’s bone health. Int J Environ Res Pu. (2018) 15(5):878. doi: 10.3390/ijerph15050878
45. Harding AT, Beck BR. Exercise, osteoporosis, and bone geometry. Sports. (2017) 5(2):29. doi: 10.3390/sports5020029
46. Beck BR, Daly RM, Singh MAF, Taaffe DR. Exercise and sports science Australia (ESSA) position statement on exercise prescription for the prevention and management of osteoporosis. J Sci Med Sport. (2017) 20(5):438–45. doi: 10.1016/j.jsams.2016.10.001
47. Rong K, Liu X-y, Wu X-h, Li X-l, Xia Q-q, Chen J, et al. Increasing level of leisure physical activity could reduce the risk of hip fracture in older women. Medicine (Baltimore). (2016) 95(11):e2984. doi: 10.1097/MD.0000000000002984
48. Kemmler W, Häberle L, von Stengel S. Effects of exercise on fracture reduction in older adults. Osteoporosis Int. (2013) 24(7):1937–50. doi: 10.1007/s00198-012-2248-7
49. Olmedillas H, González-Agüero A, Moreno LA, Casajus JA, Vicente-Rodríguez G. Cycling and bone health: a systematic review. Bmc Med. (2012) 10(1):168–168. doi: 10.1186/1741-7015-10-168
50. Wilks DC, Gilliver SF, Rittweger J. Forearm and tibial bone measures of distance- and sprint-trained master cyclists. Medicine Sci Sports Exerc. (2009) 41(3):566–73. doi: 10.1249/MSS.0b013e31818a0ec8
51. Warner SE, Shaw JM, Dalsky GP. Bone mineral density of competitive male mountain and road cyclists. Bone. (2002) 30(1):281–6. doi: 10.1016/S8756-3282(01)00704-9
52. Oja P, Titze S, Bauman A, de Geus B, Krenn P, Reger-Nash B, et al. Health benefits of cycling: a systematic review. Scand J Med Sci Spor. (2011) 21(4):496–509. doi: 10.1111/j.1600-0838.2011.01299.x
53. Oja P, Mänttäri A, Heinonen A, Kukkonen-Harjula K, Laukkanen R, Pasanen M, et al. Physiological effects of walking and cycling to work. Scand J Med Sci Spor. (1991) 1(3):151–7. doi: 10.1111/j.1600-0838.1991.tb00288.x
54. Hendriksen IJM, Zuiderveld B, Kemper HCG, Bezemer PD. Effect of commuter cycling on physical performance of male and female employees. Medicine Sci Sports Exerc. (2000) 32(2):504. doi: 10.1097/00005768-200002000-00037
55. Geus BD, Hoof EV, Aerts I, Meeusen R. Cycling to work: influence on indexes of health in untrained men and women in flanders. Coronary heart disease and quality of life. Scand J Med Sci Spor. (2008) 18(4):498–510. doi: 10.1111/j.1600-0838.2007.00729.x
56. Geus BD, Joncheere J, Meeusen R. Commuter cycling: effect on physical performance in untrained men and women in flanders: minimum dose to improve indexes of fitness. Scand J Med Sci Spor. (2009) 19(2):179–87. doi: 10.1111/j.1600-0838.2008.00776.x
57. Østergaard L, Børrestad LAB, Tarp J, Andersen LB. Bicycling to school improves the cardiometabolic risk factor profile: a randomised controlled trial. BMJ Open. (2012) 2(6):e001307. doi: 10.1136/bmjopen-2012-001307
58. Møller NC, Østergaard L, Gade JR, Nielsen JL, Andersen LB. The effect on cardiorespiratory fitness after an 8-week period of commuter cycling — a randomized controlled study in adults. Prev Med. (2011) 53(3):172–7. doi: 10.1016/j.ypmed.2011.06.007
59. Kelly P, Williamson C, Niven AG, Hunter R, Mutrie N, Richards J. Walking on sunshine: scoping review of the evidence for walking and mental health. Brit J Sport Med. (2018) 52(12):800. doi: 10.1136/bjsports-2017-098827
60. King AC, Whitt-Glover MC, Marquez DX, Buman MP, Napolitano MA, Jakicic J, et al. Physical activity promotion: highlights from the 2018 physical activity guidelines advisory committee systematic review. Medicine Sci Sports Exerc. (2019) 51(6):1340–53. doi: 10.1249/MSS.0000000000001945
61. Avila-Palencia I, de Nazelle A, Cole-Hunter T, Donaire-Gonzalez D, Jerrett M, Rodriguez DA, et al. The relationship between bicycle commuting and perceived stress: a cross-sectional study. BMJ Open. (2017) 7(6):e013542. doi: 10.1136/bmjopen-2016-013542
62. Brutus S, Javadian R, Panaccio AJ. Cycling, car, or public transit: a study of stress and mood upon arrival at work. Int J Work Heal Management. (2017) 10(1):13–24. doi: 10.1108/IJWHM-10-2015-0059
63. Rissel C, Crane M, Wen LM, Greaves S, Standen C. Satisfaction with transport and enjoyment of the commute by commuting mode in inner Sydney: satisfaction and enjoyment by commute mode. Health Promot J Aust. (2015) 27(1):80–3. doi: 10.1071/HE15044
64. Scheepers CE, Wendel-Vos GCW, van Wesemael PJV, den Hertog FRJ, Stipdonk HL, Panis LLRI, et al. Perceived health status associated with transport choice for short distance trips. Prev Medicine Reports. (2015) 2:839–44. doi: 10.1016/j.pmedr.2015.09.013
65. Bopp M, Kaczynski AT, Campbell ME. Health-Related factors associated with mode of travel to work. J Environ Public Heal. (2013) 2013:242383. doi: 10.1155/2013/242383
66. Koolhaas CM, Dhana K, van Rooij FJA, Schoufour JD, Hofman A, Franco OH. Physical activity types and health-related quality of life among middle-aged and elderly adults: the rotterdam study. J Nutrition Heal Aging. (2018) 22(2):246–53. doi: 10.1007/s12603-017-0902-7
67. Crane M, Rissel C, Standen C, Greaves S. Associations between the frequency of cycling and domains of quality of life. Health Promot J Aust. (2014) 25(3):182–5. doi: 10.1071/HE14053
68. Ward AL, Cameron C, McGee R, Freeman C, Gendall PJ. Is the ‘happy wanderer’ really happy? Transport and life satisfaction among older teenagers in rural New Zealand. J Transp Health. (2018) 10:391–400. doi: 10.1016/j.jth.2018.06.005
69. Hendriksen IJM, Simons M, Garre FG, Hildebrandt VH. The association between commuter cycling and sickness absence. Prev Med. (2010) 51(2):132–5. doi: 10.1016/j.ypmed.2010.05.007
70. Mytton OT, Panter J, Ogilvie D. Longitudinal associations of active commuting with wellbeing and sickness absence. Prev Med. (2016) 84:19–26. doi: 10.1016/j.ypmed.2015.12.010
71. Mindell JS, Leslie D, Wardlaw M. Exposure-based, ‘like-for-like’ assessment of road safety by travel mode using routine health data. Plos One. (2012) 7(12):e50606. doi: 10.1371/journal.pone.0050606
72. Pucher J, Buehler R. Making cycling irresistible: lessons from The Netherlands, Denmark and Germany. Transport Rev. (2008) 28(4):495–528. doi: 10.1080/01441640701806612
73. Teschke K, Harris MA, Reynolds CCO, Winters M, Babul S, Chipman M, et al. Route infrastructure and the risk of injuries to bicyclists: a case-crossover study. Am J Public Health. (2012) 102(12):2336–43. doi: 10.2105/AJPH.2012.300762
74. Lusk AC, Furth PG, Morency P, Miranda-Moreno LF, Willett WC, Dennerlein JT. Risk of injury for bicycling on cycle tracks versus in the street. Inj Prev J Int Soc Child Adolesc Inj Prev. (2011) 17(2):131–5. doi: 10.1136/ip.2010.028696
75. Reynolds CC, Harris MA, Teschke K, Cripton PA, Winters M. The impact of transportation infrastructure on bicycling injuries and crashes: a review of the literature. Environ Health-uk. (2009) 8(1):47–47. doi: 10.1186/1476-069X-8-47
76. Andersen LB, Riiser A, Rutter H, Goenka S, Nordengen S, Solbraa AK. Trends in cycling and cycle related injuries and a calculation of prevented morbidity and mortality. J Transp Heal. (2018) 9:217–25. doi: 10.1016/j.jth.2018.02.009
77. Pucher J, Dill J, Handy S. Infrastructure, programs, and policies to increase bicycling: an international review. Prev Med. (2010) 50:S106–25. doi: 10.1016/j.ypmed.2009.07.028
78. Maizlish N, Woodcock J, Co S, Ostro B, Fanai A, Fairley D. Health cobenefits and transportation-related reductions in greenhouse gas emissions in the San Francisco bay area. Am J Public Health. (2013) 103(4):703–9. doi: 10.2105/AJPH.2012.300939
79. Welsh C, Celis-Morales CA, Ho F, Lyall DM, Mackay D, Ferguson L, et al. Association of injury related hospital admissions with commuting by bicycle in the UK: prospective population based study. Br Med J. (2020) 368:m336. doi: 10.1136/bmj.m336
80. de Nazelle A, Nieuwenhuijsen MJ, Antó JM, Brauer M, Briggs D, Braun-Fahrlander C, et al. Improving health through policies that promote active travel: a review of evidence to support integrated health impact assessment. Environ Int. (2011) 37(4):766–77. doi: 10.1016/j.envint.2011.02.003
81. Karanasiou A, Viana M, Querol X, Moreno T, de Leeuw F. Assessment of personal exposure to particulate air pollution during commuting in European cities—recommendations and policy implications. Sci Total Environ. (2014) 490:785–97. doi: 10.1016/j.scitotenv.2014.05.036
82. Mueller N, Rojas-Rueda D, Cole-Hunter T, de Nazelle A, Dons E, Gerike R, et al. Health impact assessment of active transportation: a systematic review. Prev Med. (2015) 76:103–14. doi: 10.1016/j.ypmed.2015.04.010
83. Tainio M, de Nazelle AJ, Götschi T, Kahlmeier S, Rojas-Rueda D, Nieuwenhuijsen MJ, et al. Can air pollution negate the health benefits of cycling and walking? Prev Med. (2016) 87:233–6. doi: 10.1016/j.ypmed.2016.02.002
84. Gössling S, Choi AS. Transport transitions in Copenhagen: comparing the cost of cars and bicycles. Ecol Econ. (2015) 113:106–13. doi: 10.1016/j.ecolecon.2015.03.006
87. Rutter H, Cavill N, Racioppi F, Dinsdale H, Oja P, Kahlmeier S. Economic impact of reduced mortality due to increased cycling. Am J Prev Med. (2013) 44(1):89–92. doi: 10.1016/j.amepre.2012.09.053
88. Kahlmeier S, Racioppi F, Cavill N, Rutter H, Oja P. “Health in all policies” in practice: guidance and tools to quantifying the health effects of cycling and walking. J Phys Activity Heal. (2010) 7(s1):S120–5. doi: 10.1123/jpah.7.s1.s120
89. Woodcock J, Givoni M, Morgan AS. Health impact modelling of active travel visions for England and Wales using an integrated transport and health impact modelling tool (ITHIM). Plos One. (2013) 8(1):e51462. doi: 10.1371/journal.pone.0051462
90. Cavill N, Kahlmeier S, Rutter H, Racioppi F, Oja P. Economic analyses of transport infrastructure and policies including health effects related to cycling and walking: a systematic review. Transp Policy (Oxf). (2008) 15(5):291–304. doi: 10.1016/j.tranpol.2008.11.001
92. Jarrett J, Woodcock J, Griffiths UK, Chalabi Z, Edwards P, Roberts I, et al. Effect of increasing active travel in urban England and Wales on costs to the national health service. Lancet. (2012) 379(9832):2198–205. doi: 10.1016/S0140-6736(12)60766-1
93. Fishman E, Schepers P, Kamphuis CBM. Dutch Cycling: quantifying the health and related economic benefits. Am J Public Health. (2015) 105(8):e13–5. doi: 10.2105/AJPH.2015.302724
94. Andersen B, Weinreich J, Riisgaard-Dam MN. Collection of cycling concepts. Copenhagen: Cycling Embassy of Denmark (2012).
96. Creutzig F, Mühlhoff R, Römer J. Decarbonizing urban transport in European cities: four cases show possibly high co-benefits. Environ Res Lett. (2012) 7(4):044042. doi: 10.1088/1748-9326/7/4/044042
97. Fraser SDS, Lock K. Cycling for transport and public health: a systematic review of the effect of the environment on cycling. Eur J Public Health. (2011) 21(6):738–43. doi: 10.1093/eurpub/ckq145
98. Iwińska K, Blicharska M, Pierotti L, Tainio M, de Nazelle A. Cycling in Warsaw, Poland—perceived enablers and barriers according to cyclists and non-cyclists. Transp Res Part Policy Pract. (2018) 113:291–301. doi: 10.1016/j.tra.2018.04.014
99. Swiers R, Pritchard C, Gee I. A cross sectional survey of attitudes, behaviours, barriers and motivators to cycling in university students. J Transp Health. 2017;6:379–85. doi: 10.1016/j.jth.2017.07.005
100. de Souza AA, Sanches SP, Ferreira MAG. Influence of attitudes with respect to cycling on the perception of existing barriers for using this mode of transport for commuting. Procedia - Soc Behav Sci. (2014) 162:111–20. doi: 10.1016/j.sbspro.2014.12.191
101. Molina-García J, Castillo I, Sallis JF. Psychosocial and environmental correlates of active commuting for university students. Prev Med. 2010;51(2):136–8. doi: 10.1016/j.ypmed.2010.05.009
102. Manaugh K, Boisjoly G, El-Geneidy A. Overcoming barriers to cycling: understanding frequency of cycling in a university setting and the factors preventing commuters from cycling on a regular basis. Transportation (Amst). 2017;44(4):871–84. doi: 10.1007/s11116-016-9682-x
103. Macmillan A, Woodcock J. Understanding bicycling in cities using system dynamics modelling. J Transp Health. (2017) 7(Pt B):269–79. doi: 10.1016/j.jth.2017.08.002
104. Titze S, Stronegger WJ, Janschitz S, Oja P. Association of built-environment, social-environment and personal factors with bicycling as a mode of transportation among Austrian city dwellers. Prev Med. (2008) 47(3):252–9. doi: 10.1016/j.ypmed.2008.02.019
105. de Geus B, Bourdeaudhuij ID, Jannes C, Meeusen R. Psychosocial and environmental factors associated with cycling for transport among a working population. Health Educ Res. (2008) 23(4):697–708. doi: 10.1093/her/cym055
106. Engbers LH, Hendriksen IJ. Characteristics of a population of commuter cyclists in The Netherlands: perceived barriers and facilitators in the personal, social and physical environment. Int J Behav Nutr Phy. (2010) 7(1):89. doi: 10.1186/1479-5868-7-89
107. Connell H, Logan G, Somers C, Baker G, Broadfield S, Bunn C, et al. Development and optimisation of a multi-component workplace intervention to increase cycling for the cycle nation project. Front Sports Act Living. (2022) 4:857554. doi: 10.3389/fspor.2022.857554
108. Bauman A, Rissel C, Garrard J, Ker I, Speidel R, Fishman E. Cycling: getting Australia moving: barriers, facilitators and interventions to get more Australians physically active through cycling. (2008).
109. Lee Y, Park S. Understanding of physical activity in social ecological perspective: application of multilevel model. Front Psychol. (2021) 12:622929. doi: 10.3389/fpsyg.2021.622929
110. Michie S, van Stralen MM, West R. The behaviour change wheel: a new method for characterising and designing behaviour change interventions. Implement Sci. (2011) 6(1):42–42. doi: 10.1186/1748-5908-6-42
111. Kärmeniemi M, Lankila T, Ikäheimo T, Koivumaa-Honkanen H, Korpelainen R. The built environment as a determinant of physical activity: a systematic review of longitudinal studies and natural experiments. Ann Behav Med. (2018) 52(3):239–51. doi: 10.1093/abm/kax043
112. Winters M, Buehler R, Götschi T. Policies to promote active travel: evidence from reviews of the literature. Curr Environ Heal Reports. (2017) 4(3):278–85. doi: 10.1007/s40572-017-0148-x
113. Savan B, Cohlmeyer E, Ledsham T. Integrated strategies to accelerate the adoption of cycling for transportation. Transp Res Part F Traffic Psychol Behav. (2017) 46:236–49. doi: 10.1016/j.trf.2017.03.002
114. Giles-Corti B, Vernez-Moudon A, Reis R, Turrell G, Dannenberg AL, Badland H, et al. City planning and population health: a global challenge. Lancet. (2016) 388(10062):2912–24. doi: 10.1016/S0140-6736(16)30066-6
115. Fell D, Kivinen E. Investing in cycling & walking: Rapid evidence assessment. A report for the department of transport. London: Brooks Lyndhurst (2016).
116. Stewart G, Anokye NK, Pokhrel S. What interventions increase commuter cycling? A systematic review. BMJ Open. (2015) 5(8):e007945. doi: 10.1136/bmjopen-2015-007945
117. Hunter RF, Christian H, Veitch J, Astell-Burt T, Hipp JA, Schipperijn J. The impact of interventions to promote physical activity in urban green space: a systematic review and recommendations for future research. Soc Sci Med. (2015) 124:246–56. doi: 10.1016/j.socscimed.2014.11.051
118. Mayne SL, Auchincloss AH, Michael YL. Impact of policy and built environment changes on obesity-related outcomes: a systematic review of naturally occurring experiments. Obes Rev Official J Int Assoc Study Obes. (2014) 16(5):362–75. doi: 10.1111/obr.12269
119. Communtity Preventive Services Task Force. Physical activity: built environment approaches combining transportation system interventions with land use and environmental design. The community guide. (2016).
120. Scheepers CE, Wendel-Vos GCW, den Broeder JM, van Kempen EEMM, van Wesemael PJV, Schuit AJ. Shifting from car to active transport: a systematic review of the effectiveness of interventions. Transp Res Part Policy Pract. (2014) 70:264–80. doi: 10.1016/j.tra.2014.10.015
121. Bird EL, Baker G, Mutrie N, Ogilvie D, Sahlqvist S, Powell J. Behavior change techniques used to promote walking and cycling: a systematic review. Health Psychol. (2013) 32(8):829–38. doi: 10.1037/a0032078
122. Walking and cycling: Local measures to promote walking and cycling as forms of travel or recreation. London: National Institute for Health and Care Excellence (2012).
123. Yang L, Sahlqvist S, McMinn A, Griffin SJ, Ogilvie D. Interventions to promote cycling: systematic review. Br Med J. (2010) 341(oct18 2):c5293. doi: 10.1136/bmj.c5293
124. Ogilvie D, Egan M, Hamilton V, Petticrew M. Promoting walking and cycling as an alternative to using cars: systematic review. Br Med J. (2004) 329(7469):763. doi: 10.1136/bmj.38216.714560.55
125. Bjørnarå HB, Berntsen S, te Velde SJ, Fegran L, Fyhri A, Deforche B, et al. From cars to bikes—the feasibility and effect of using e-bikes, longtail bikes and traditional bikes for transportation among parents of children attending kindergarten: design of a randomized cross-over trial. BMC Public Health. (2017) 17(1):981. doi: 10.1186/s12889-017-4995-z
126. Andersson A, Hiselius LW, Adell E. Promoting sustainable travel behaviour through the use of smartphone applications: a review and development of a conceptual model. Travel Behav Soc. (2018) 11:52–61. doi: 10.1016/j.tbs.2017.12.008
Keywords: cycling, physical activity, active travel, public health, economic
Citation: Logan G, Somers C, Baker G, Connell H, Gray S, Kelly P, McIntosh E, Welsh P, Gray CM and Gill JMR (2023) Benefits, risks, barriers, and facilitators to cycling: a narrative review. Front. Sports Act. Living 5:1168357. doi: 10.3389/fspor.2023.1168357
Received: 17 February 2023; Accepted: 5 September 2023;
Published: 19 September 2023.
Edited by:
Jessica Bourne, University of Bristol, United KingdomReviewed by:
Simone Annabella Tomaz, University of Stirling, United KingdomSolveig Nordengen, Western Norway University of Applied Sciences, Norway
© 2023 Logan, Somers, Baker, Connell, Gray, Kelly, McIntosh, Welsh, Gray and Gill. This is an open-access article distributed under the terms of the Creative Commons Attribution License (CC BY). The use, distribution or reproduction in other forums is permitted, provided the original author(s) and the copyright owner(s) are credited and that the original publication in this journal is cited, in accordance with accepted academic practice. No use, distribution or reproduction is permitted which does not comply with these terms.
*Correspondence: Greig Logan Z3JlaWcubG9nYW5AZ2xhc2dvdy5hYy51aw==