 Luz Adriana Meneses Urrea1*†
 Manuel Vaquero Abellán2*†
 Narly Benachi Sandoval1,3,4Dolly Villegas Arenas1Olga Osorio Murillo5Guillermo Molina-Recio6
- 1Universidad Santiago de Cali, Healthcare Research Group (group Recognized By Colciencias), Cali, Colombia
- 2IMIBIC GC12 Clinical and Epidemiological Research in Primary Care (GICEAP), Department of Nursing, Pharmacology and Physiotherapy, University of Córdoba, Córdoba, Spain
- 3CAP Casanova, Consorci D’Atenció Primària de Salut Barcelona Esquerra, España, Spain
- 4Department of Public Health, Mental Health and Perinatal Nursing, University of Barcelona, Barcelona, Spain
- 5Pontificia Universidad Javeriana de Cali, Cali, Colombia
- 6Lifestyles, Innovation and Health (GA-16), Maimonides Biomedical Research Institute of Cordoba (IMIBIC), Department of Nursing, Pharmacology and Physiotherapy, University of Córdoba, Córdoba, Spain
This study aimed to construct and validate dietary patterns in Colombian individuals aged between 15 and 64 years. The study sample consisted of 16,216 individuals who participated in the 2015 National Survey on the Nutritional Situation of Colombia (ENSIN). To identify dietary patterns, an exploratory analysis was first conducted with 16 food groups with 70% of the study sample, followed by a confirmatory analysis with the remaining 30%. Four eating patterns were identified, referred to as traditional, industrialized, conservative, and grilled foods/drinks. The traditional pattern presented the highest variance (17.65%), followed by the industrialized (14.36%), conservative (10.74%), and grilled foods/drinks (7.57%) patterns. Regarding the frequency of food consumption, the preference for the consumption of rice/pasta and panela/sugar/honey was evident. In contrast, low consumption of whole foods, energizers, light foods, supplements, and salt was observed. The dietary patterns in Colombia continue to be characterized by a high consumption of panela/sugar/honey and low consumption of fruits/vegetables, which is why the development of public health interventions to improve these habits, such as health promotion and chronic disease prevention tools, is considered necessary.
Introduction
In recent decades, industrialization, changes in agricultural production, and resource availability have affected peoples’ lifestyles, causing disturbances in eating patterns, among other changes. These modifications have led to the abandonment of diets that are rich in complex carbohydrates, fiber (cereals and potatoes), proteins, and vegetable fats and a low intake of foods that are rich in animal proteins and fats. In contrast, there has been an adoption of dietary patterns characterized by a high consumption of processed or ultra-processed foods and foods rich in animal fats and hypercaloric foods and a low intake of fruits and vegetables (Ministerio de Salud y Protección Social, 2017).
Heath indicators have been significantly affected by this change in dietary patterns, leading to an increase in the prevalence of chronic non-communicable diseases, such as diabetes, cardiovascular diseases, and cancer (Khoury et al., 2014). Chronic diseases are estimated to cost €115 billion or 0.8% of the gross domestic product of European Union (EU) economies per year. Approximately 70–80% of EU health budgets are spent on treating chronic diseases (European Commission, 2021). In Colombia, patients with chronic diseases account for 49.4% of health care costs (Prada and Pérez-Castaño, 2017). For these reasons, in 2004, the World Health Organization (WHO), at its 57th World Health Assembly, approved the Global Strategy on Diet, Physical Activity and Health. This strategy was developed with the purpose of promoting and protecting communities’ health, thereby encouraging the creation of a favorable environment for the adoption of sustainable measures that would lead to a reduction in morbidity and mortality associated with inadequate nutrition and lack of physical activity (OMS, 2004).
In 2005, the Colombian Institute of Family Welfare (ICBF) launched the National Survey on the Nutritional Situation of Colombia (ENSIN) to identify the population’s nutritional problems as well as their social determinants, indicators, and trends in the country (ICBF. ENSIN, 2021) every 5 years. Similarly, to promote the adoption of healthy, sustainable, and culturally appropriate eating styles and practices, ICBF designed the Information, Education, and Comunication (IEC) Strategy in Food and Nutritional Safety (SAN) (ICBF and FAO, 2019).
The effectiveness of food policies and strategies are based on the knowledge and contextualization of the performance of the population’s eating behavior, culture, and other factors that may influence the modification of their lifestyles, influencing the adoption of new dietary patterns. In this context, researchers such as Popkin et al. stated that in societies with greater economic and structural development, the dietary pattern is usually marked by a high consumption of mainly saturated fats, sugars, processed foods, animal proteins, and foods poor in fiber and complex carbohydrates (Popkin, 1994) (Popkin et al., 2012) (Popkin and Gordon-Larsen, 2004). In contrast, in societies in low- and middle-income countries, such as the Latin American and Caribbean countries, traditional dietary patterns are usually modified primarily based on a person’s culture (Ocampo T et al., 20102014) (Herrán et al., 2018) (Lim et al., 2014) (Quintero-Lesmes and Herran, 2019), demonstrating high consumption of basic foods, such as cereal, roots, and tubers. The contribution of these foods in the Caribbean and South America is around 37%, while in Mesoamerica, it is 44% (Zapata and Rovirosa, 2021). In Argentina, cereal consumption contributes 50% of daily caloric energy (Zapata and Rovirosa, 2021). In Chile, according to the 2010 Food Consumption Survey, 100% of the population reported consuming cereals and tubers (Ministerio de Salud Chile, 2022), while in Ecuador and Colombia, 50% of those surveyed reported regular consumption of tubers. Concerning the regular intake of grains in Ecuador and Colombia, 50 and 90% were reported (Morejón-Terán et al., 2017) (Instituto Colombiano de Bienestar Familiar, 2011). On the other hand, unhealthy foods have displaced the consumption of the traditional diet in Latin American countries, a consumption that increases in the male gender, lower schooling (Zapata et al., 2020) (Freitas et al., 2017), and decreases in the medium-high socioeconomic level (Pinto et al., 2019) (de Paula Matos Souza et al., 2019) (Gil-Toro et al., 2017).
Regarding studies related to the evaluation of dietary patterns in the different regions of Colombia, Quintero-Lesmes et al. conducted an exploratory factor analysis (EFA) of the data obtained in the 2010 ENSIN and identified three dietary patterns in the Colombian population between 18 and 64 years of age (Quintero-Lesmes and Herran, 2019). The first dietary pattern was classified as “fruits–vegetables/dairy” and was characterized by the consumption of milk and its derivatives, chicken, fruits, raw and cooked vegetables, whole fruits and juices, bread/arepa/cookies, grains, beef viscera, light foods, tuna, and sardines. The second was called the “traditional/starch” pattern, highlighting the intake of panela, sugar, honey, rice or pasta, fried foods, bananas, eggs, beef/pork, shellfish, coffee or tea, legumes, eggs, etc.). The third was referred to as the “snack” pattern and was defined by the predominance of fast foods, soft drinks, packaged foods, butter, sausages, chicken offal, etc. (Quintero-Lesmes and Herran, 2019). Besides identifying these patterns, they also established that the most frequent dietary pattern in the Colombian population was the “traditional” one (Quintero-Lesmes and Herran, 2019).
Considering that dietary patterns are related to the risk of developing chronic non-communicable diseases (Al-Maskari, 2021) and that they are influenced by demographic transitions and changes that have occurred over time, this study aimed to construct and validate the current dietary patterns in the Colombian population aged between 15 and 64 years using EFA and confirmatory factor analysis of the data obtained via ENSIN 2015. The purpose of this study was to offer more detailed information to facilitate future research related to the association between dietary patterns, sociodemographic characteristics, and the occurrence of different chronic non-communicable diseases, as well as the development and implementation of health strategies that promote the consumption of healthy foods.
Materials and Methods
This was a cross-sectional descriptive study to determine dietary patterns in the different regions of Colombia.
The sample consisted of 16,216 individuals aged between 15 and 64 years who participated in ENSIN 2015, a descriptive cross-sectional population survey with probabilistic, cluster, stratified, and multistage sampling (Instituto Colombiano de Bienestar Familiar, 2018).
The following sociodemographic variables were included: age, sex, educational level, social security system, demographic setting (urban or rural), wealth quartile based on housing materials, provision of services and asset position, Colombian region, and frequency of consumption of 37 foods over the previous month (milk, cheese, eggs, chicken, meat, fish/shellfish, tuna/sardine, chicken offal, sausages, black pudding/beef offal, bienestarina, other vegetable mixtures, dry grains, rice/pasta, bread, arepa, crackers, tubers/bananas, cooked vegetables, raw vegetables, fruit juice, whole fruit, butter, coffee, panela/sugar/honey, candy, soda/tea/soft drinks, whole-grain foods, alcoholic drinks, energy drinks, fast foods, packaged foods, light foods, fried foods, grilled foods, supplements, and salt).
To facilitate the establishment of eating patterns and to obtain an explanation variance greater than 45%, the response options to the food consumption frequency variables were recorded (initial values from 1 to 4 [1 = daily; 2 = weekly; 3 = monthly; and 4 = not usual consumption], passed to scores from 0 to 3 [0 = not usual consumption; 1 = monthly; 2 = weekly; and 3 = daily]) and transformed to a scale of 0–100, with 0 indicating “no consumption” and 100 indicating “maximum consumption,” using the following formula: [(sum of the items that comprise the variable (raw score) − lowest possible score)/maximum possible range] *100. With the transformed variables, new food variable groups were constructed to be tested in the construction of food patterns.
For data analysis, the sample was divided into two groups (Ortiz-Martinez et al., 2019). The first was the “design group,” which represented 70% (11,382) of the subjects selected randomly and stratified by age and sex and in which the EFA was applied for the construction of dietary patterns. The second was the “validation group,” which comprised the remaining 30% (4,879) of subjects and in which the confirmatory factor analysis (CFA) was applied to validate the construction of the eating patterns obtained in the confirmatory factor analysis. SPSS Amos 26 was used for CFA.
A descriptive analysis was performed to detail the population characteristics. The analysis included mean, median, standard deviation, and interquartile range (IQR) values for the quantitative variables and frequencies and percentages for the qualitative variables. Both groups (design and validation) were compared using chi-square statistics for qualitative variables and the Mann–Whitney U test for quantitative variables. We used nonparametric statistics because the data did not meet the normality criterion, evaluated using the Kolmogórov–Smirnov test.
The relevance of performing EFA in the design group was evaluated using the Bartlett sphericity index and the Kaiser–Meyer–Olkin sample adequacy measure. The extraction and rotation of the factors was performed using the principal components method with Varimax rotation and the maximum likelihood method. The number of dietary patterns (factors) was selected according to the Kaiser rule (minimum number: eigenvalues >1; maximum number: eigenvalues >0.7), sedimentation graph, and criteria of the research team. The food groups that had correlation values of <0.30 were considered irrelevant in the definition of each factor and, in the case of values > 1, a cutoff point of 0.50 was established to decide in which factor the affected variable should be placed. Communality values were assessed to determine the variables to be included in the EFA.
The dietary patterns constructed in the EFA were tested in the validation group by the calculation of global or absolute fit indices, incremental or comparative fit measures, and parsimony fit measures of the model. In addition, the path diagram of the model with the best fit was plotted.
An alpha error of less than 5% (p < 0.05) was set to establish statistical significance in all tests performed.
Results
Sociodemographic Characteristics
The mean age of the study population was 31.5 ± 15.0 years (design group: 31.3 ± 14.9 years; median: 27.0; IQR: 17–43; validation group: 31.5 ± 15 years, median: 27.0, IQR: 17–44; p = 0.333). Overall, 57.0% were women, 74.6% lived in urban areas, 45.3% had an education level between complete secondary school and incomplete higher studies, 58.0% had social security coverage in the subsidized regime, 45.4% were in the first quartile of the wealth index, and 24.5% were from the central region. Table 1 shows the sociodemographic characteristics of the study population compared by analysis group (design and validation). No significant differences were found between the subgroups upon comparing the categories of the variables.
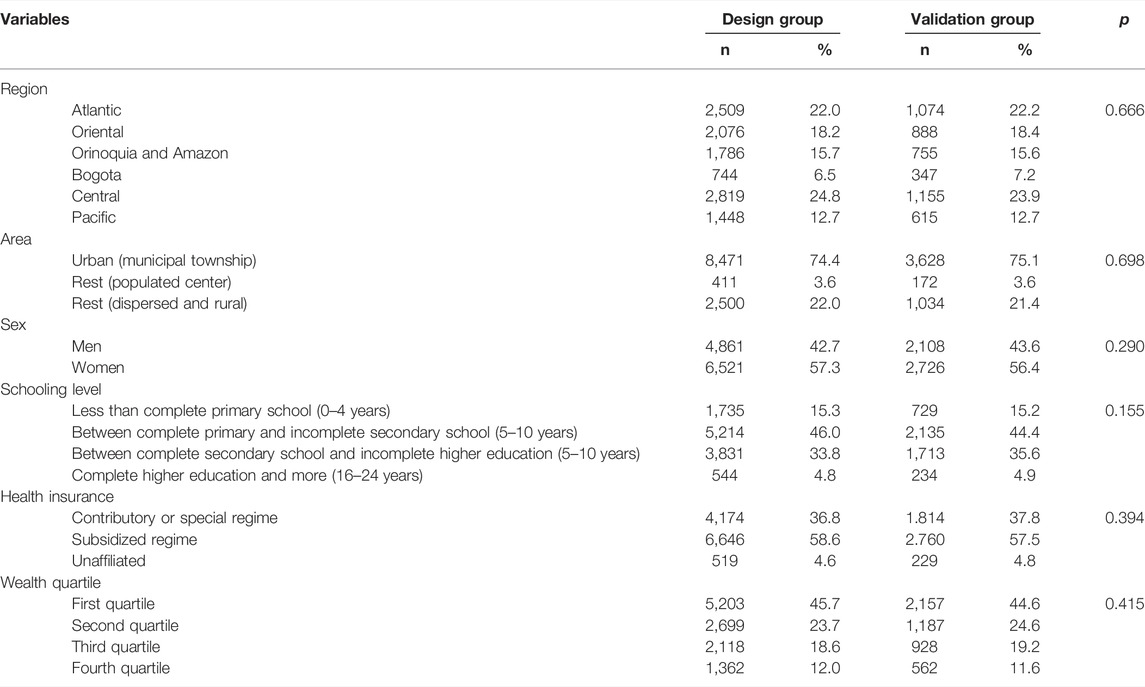
TABLE 1. Sociodemographic characteristics of the study sample.
Frequency of Food Consumption During the Previous Month
More than 79% of the population reported daily consumption of rice/pasta and panela/sugar/honey. Regarding weekly consumption, ≥60% reported consuming eggs, chicken, meat, dry grains, and fried foods. Only 28% stated that they consumed fish/shellfish and tuna/sardines on a monthly basis. More than 80% reported not having a usual consumption of bienestarina, other vegetable mixes, whole-grain foods, energizing drinks, light foods, supplements, and salt. Table 2 shows the distribution of the frequency of food consumption during the previous month between the design and validation groups. The frequency of consumption of whole-grain foods was significantly different. Supplementary Table S1 presents the descriptive analysis of the frequency of consumption of the food groups included in the EFA.
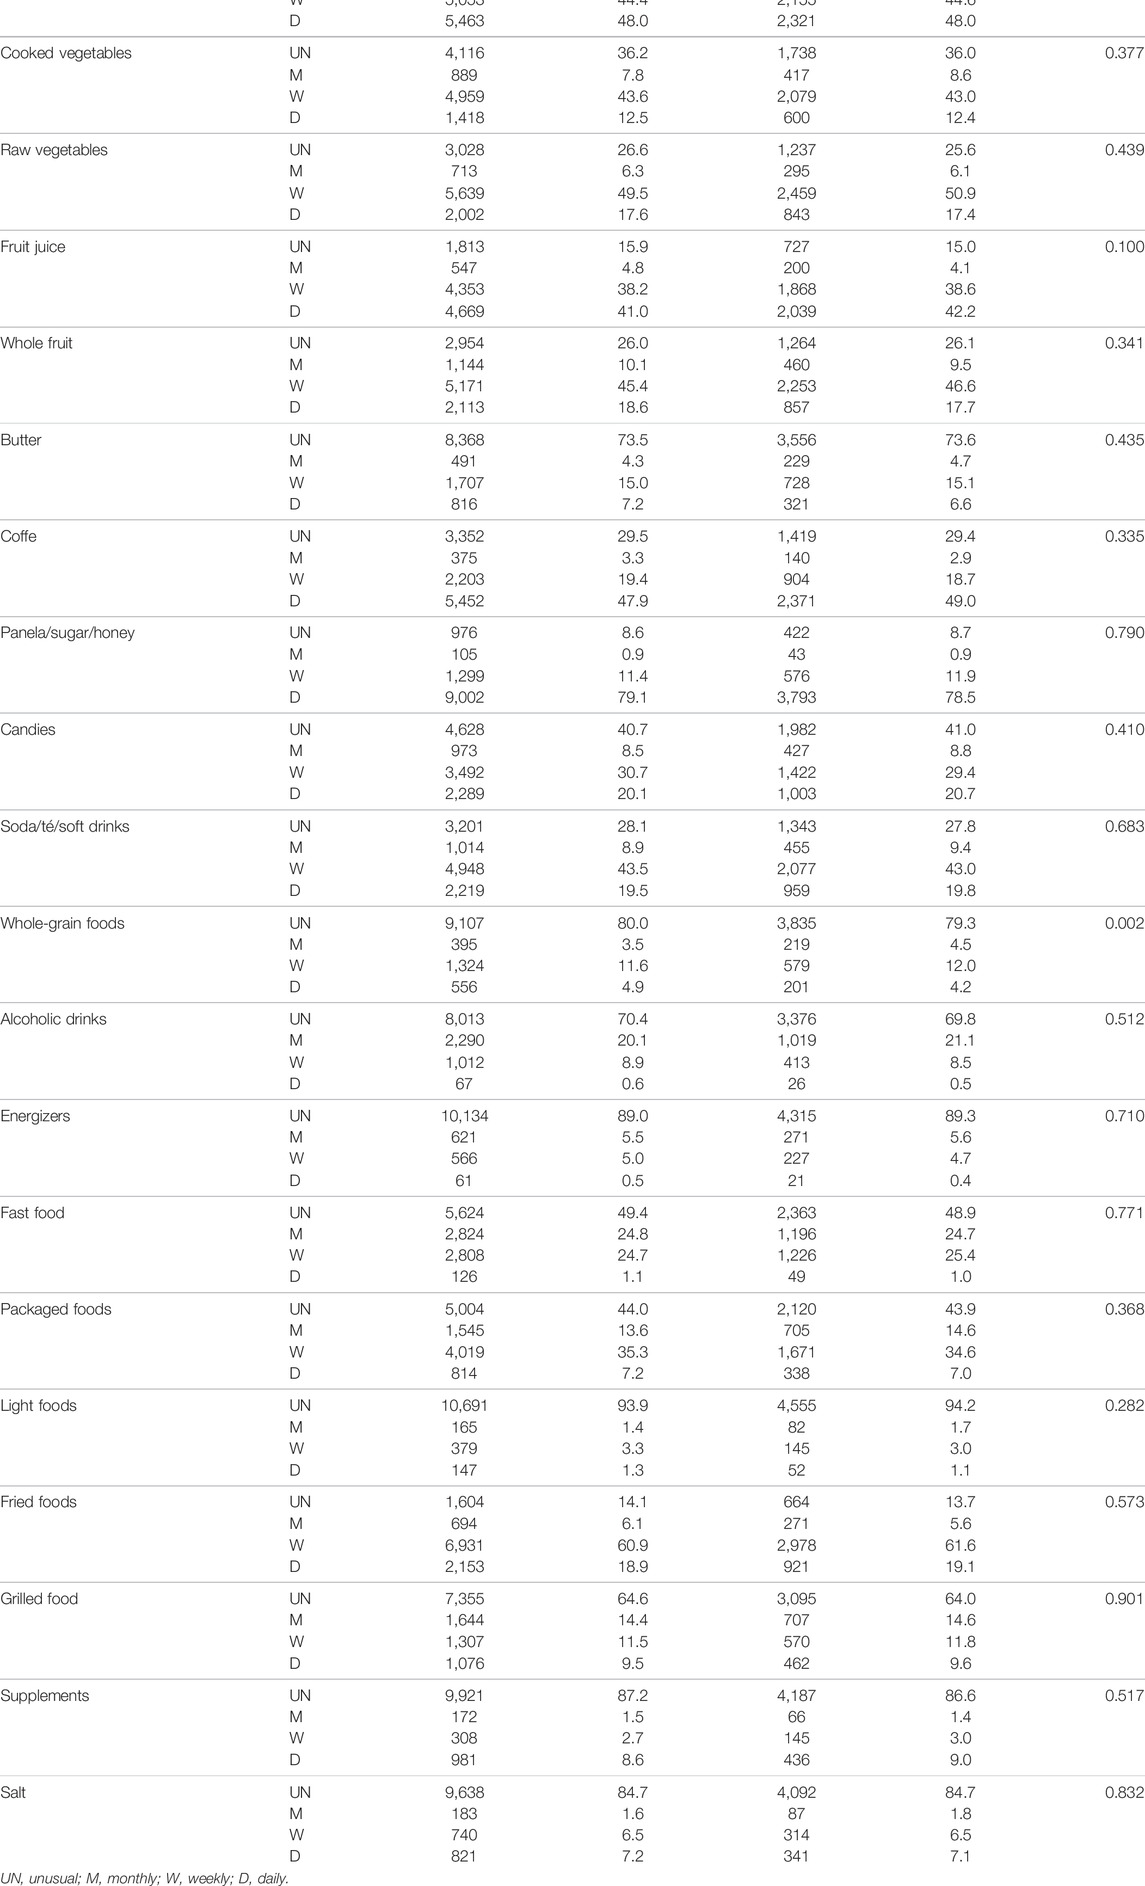
TABLE 2. Frequency of food consumption during the previous month.
Exploratory Factor Analysis
EFA was tested with five models. In all five models, the Bartlett sphericity index, with its respective chi-square test and statistical significance at p < 0.001, confirmed that the correlation coefficients were not zero. Similarly, the Kaiser–Meyer–Olkin sample adequacy measure provided sufficient information to verify the relevance of factor analysis in the establishment of Colombian food patterns.
Table 3 shows the statistics of the EFA models evaluated as well as the communality values, factors, and total variances explained.
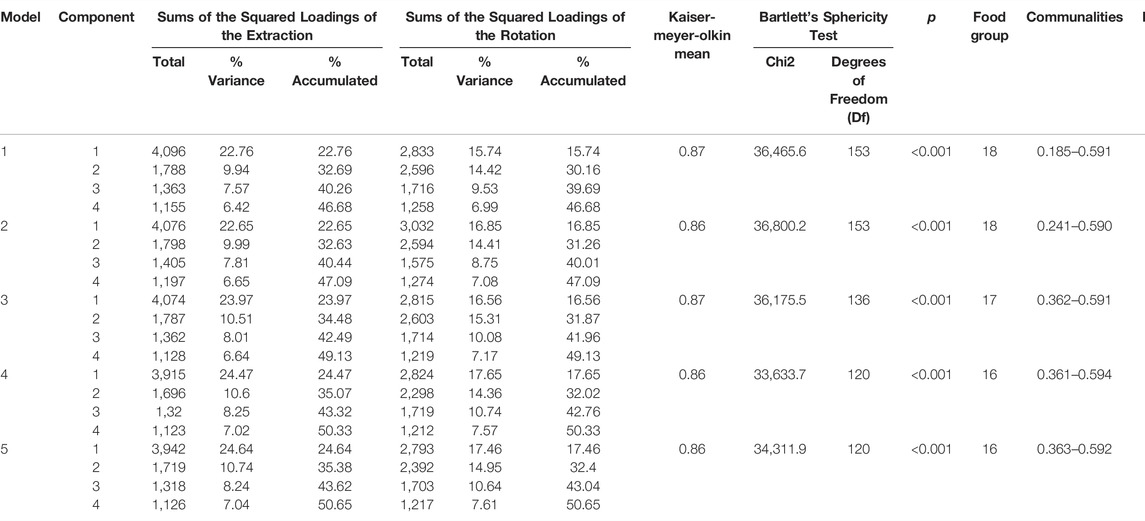
TABLE 3. Statistics of the exploratory factor analysis models evaluated. Communality values. factors. and total explained variance.
The communality values of the 16 food groups included in the EFA of models 4 and 5 were 0.361–0.594 and 0.363–0.592, respectively. The four factors with initial eigenvalues >1 accounted for more than 50% of the variance in both models.
The rotated component matrix with the principal components analysis extraction method for models 1–5 is presented in Table 4.
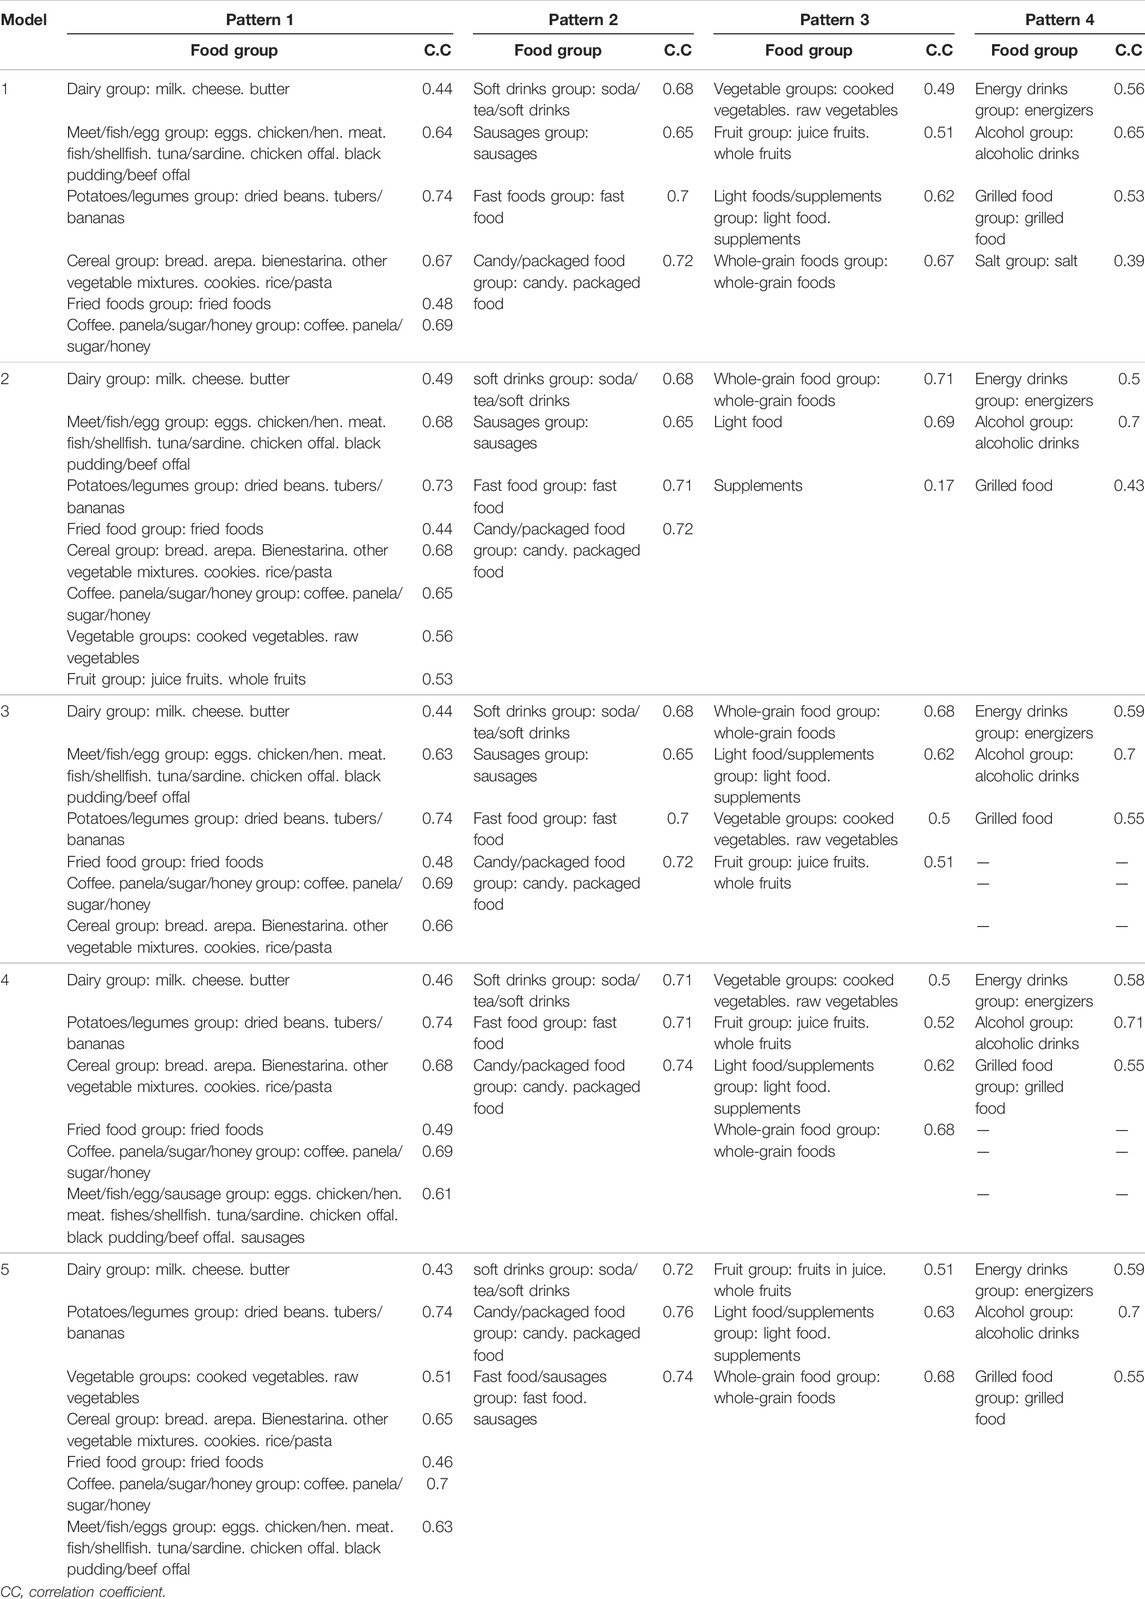
TABLE 4. Rotated component matrix with the principal component analysis extraction method of the evaluated models.
Confirmatory Factor Analysis
The likelihood ratio of the chi-square value showed statistically significant differences between the compared covariance matrices, but because this test is highly influenced by the sample size, the other measures of goodness of fit should be considered to determine the validity of the models. In this sense, the approximation error (root mean square error of approximation) being lower than 0.08 in all the models allowed us to consider that the sample had a good fit (Steiger and Lind, 1984) (Hair et al., 2009) (30) (Bentler, 1990). It is also recommended that the incremental fit measures be between 0 and 1, preferably NFI ≥ 0.90 (Marôco, 2014) (31). As a result, we obtained a Comparative Fit Index (CFI) close to 0.9 for models 1, 3 and 4. Furthermore, we found the best Tucker Lewis index (TLI) in model 4 (value close to 0.9) concerning the incremental fit index. Finally, regarding the parsimonious fit measures, the PRATIO statistic had values close to 0.90, and the Akaike Information Criterion (AIC) index showed that model 4 had a better fit. Therefore, of the nine statistics used to determine the best model, it was found that model 4 was the best fit as it was the lowest value of all the models. Hence, the authors considered it the most appropriate when determining dietary patterns in the different regions of Colombia. The measures of absolute, incremental, and parsimony fit obtained by means of the EFA for models 1–5 are shown in Table 5 and Figure 1 shows the path diagram of model 4.
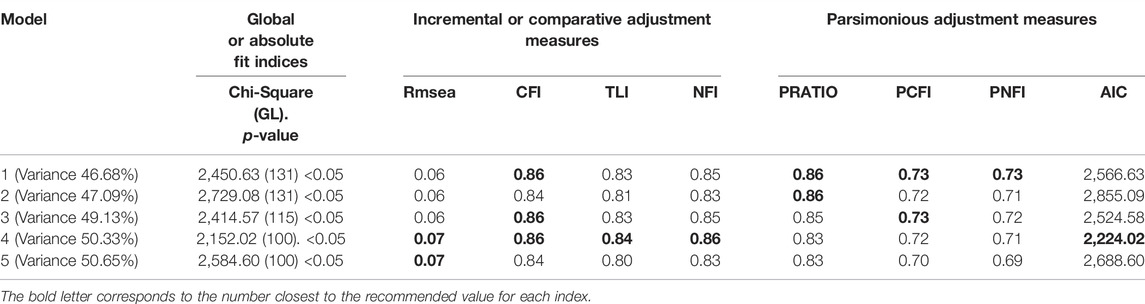
TABLE 5. Confirmatory factor analysis: absolute. incremental. and parsimony fit measures of the evaluated models.
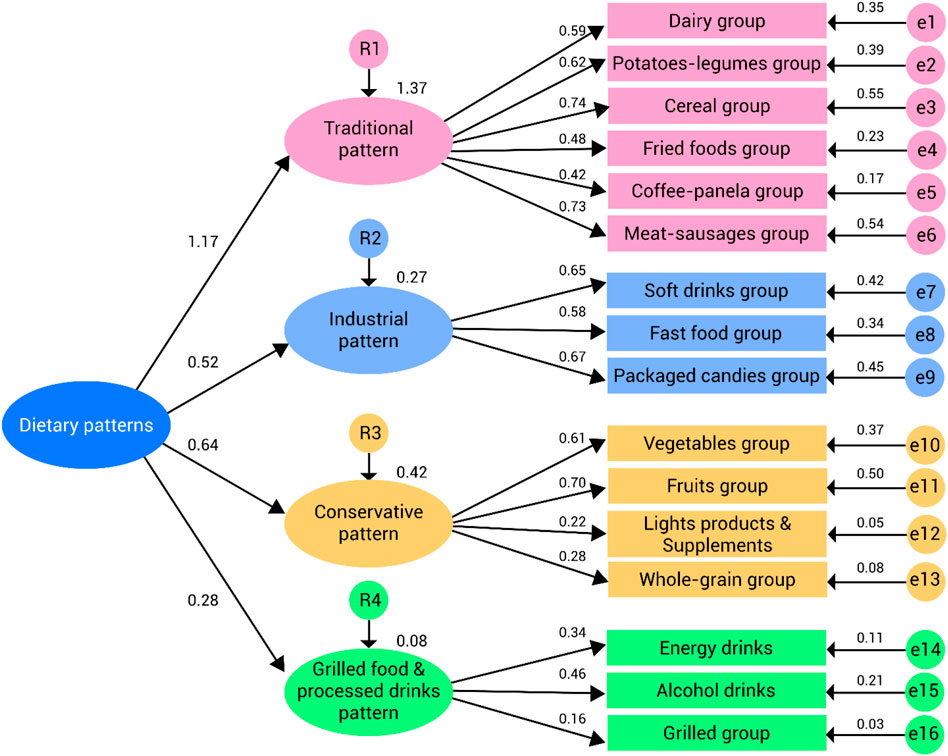
FIGURE 1. Path diagram of model 4.
Discussion
In this study, an investigation was conducted to identify dietary patterns in Colombian people using data from ENSIN 2015.
When evaluating the sociodemographic characteristics of the studied sample, we found that the variables of sex and distribution of the population by area and geographic region had a behavior similar to that reported by the National Administrative Department of in its 2018 report (Departamento Administrativo Nacional de Estadistica, 2018).
Regarding the frequency of food consumption, the results showed a clear preference for the consumption of rice/pasta and panela/sugar/honey. However, low consumption of whole foods, energizers, light foods, supplements, and salt was observed. Alcoholic drinks also had low consumption. In contrast, Leme et al. stated in their study “The Latin American Nutrition and Health Study” that the consumption of sugary drinks and alcoholic drinks in Colombian young people and adults was 48.29% (B. Leme et al., 2021).
Regarding the construction of patterns using EFA, the Bartlett sphericity index and the Kaiser–Meyer–Olkin measure of sample adequacy indicated the relevance of conducted this analysis on the sample studied and, despite model 5 showing a higher explanatory variance than the other models, model 4 yielded the best fit indicators in the subsequent validation.
Thus, 4 dietary patterns were determined in Colombia. The first one, called “traditional pattern,” refers to natural, minimally or moderately processed food that includes domestic preparation and cooking techniques and with little presence of ultra-processed foods. Had an explanatory variance of 17.65% and was made up of the following food groups: dairy (milk, cheese, butter); potatoes/legumes (dried grains, tubers/bananas); cereals (bread, arepa, bienestarina, other vegetable mixtures, cookies, rice/pasta); fried foods; coffee; panela/sugar/honey; and meat/fish/eggs/sausages (meat, black pudding/beef offal, fish/seafood, tuna/sardine, chicken offal, chicken/hen, eggs, sausages). In this dietary pattern, the potatoes/legumes group yielded the highest factor load (0.74) and had a mean frequency of consumption of 70%. However, other authors have reported a reduction in the consumption of legumes in recent years (Gámbaro et al., 2011) (Fundación Española de la Nutrición, 2022) (Miller et al., 2017) (Téllez, 2019). Further, the Food and Agriculture Organization of the United Nations (FAO) indicated in its 2019 report that the consumption of legumes decreased in countries of the Mesoamerica Region, increased in the countries of the Caribbean Region and remained stable in South American countries (Rapallo and Rivera, 2019) (FAO and FIDA, 2020).
The other food groups that were represented in the traditional pattern were (in descending order): coffee, panela/sugar/honey; cereals (bread, arepa, bienestarina, other vegetable mixtures, cookies, rice/pasta); meats/fish/eggs/sausages (meat, black pudding/beef offal, fish/seafood, tuna/sardines, chicken offal, chicken/hen, eggs, sausages) and fried foods; and dairy (milk, cheese, butter). In line with these results, the International Coffee Organization, in its 2020 report, determined that Colombia is one of the Latin American countries with the highest frequency of coffee consumption, along with Mexico, Honduras, and Venezuela (International Coffe Organization, 2021). Likewise, Petuz et al. found that during the Covid-19 pandemic, 80% of the population consumed coffee (Pertuz-Cruz et al., 2021). Regarding sugar consumption, a study carried out related to the addition of sugars in eight Latin American countries compared the frequency of consumption in absolute terms of grams/day and showed that Colombia is among the countries with the highest intake values (Fisberg et al., 2018). In regards to the consumption of dairy products, the results were similar to those reported in the analysis of the dairy situation, where Colombia was found in the lower limit of intake with respect to other Latin American countries such as Uruguay, Argentina, and Costa Rica (Unidad de Planificación Rural Agropecuaria, 2020). In other states, several studies identified the low frequency of dairy consumption. The gap between actual consumption versus the one recommended by the WHO and other food safety policies was evident on those studies (GBD 2017 Diet Collaborators, 2019) (Herrera-Cuenca et al., 2020). However, Pertuz-Cruz et al. noticed that during the COVID-19 pandemic, Colombians increased the frequency of consumption of dairy products (Pertuz-Cruz et al., 2021).
The second dietary pattern was called the “industrial pattern.” It yielded an explanatory variance of 14.36% and was composed of the following food groups, in descending order (correlations between 0.74 and 0.71): sweets/packaged foods and fast food; soft drinks (soda/tea/soft drinks).
The high consumption of foods that made up this pattern provide more calories, threaten the quality of the diet, promote dental caries and could increase subjects’ predisposition to the development of Chronic Non-communicable Diseases such as diabetes, overweight or obesity (Silva et al., 2018) (Cediel et al., 2018) (Machado et al., 2020) (Cárdenas Sánchez et al., 2019) (Zheng et al., 2017). In this sense, FAO published that the consumption of soft drinks or sugar-sweetened beverages has increased in Latin America with an average intake of 0.8 servings per day (FAO et al., 2020), similar to what was reported in a study conducted in 195 countries, where it was found that the amount ingested (49 g per day) was much higher than that considered optimal (GBD 2017 Diet Collaborators, 2019). Another recently published study reported a reduction in the consumption of sugary drinks in the Colombian population (Pertuz-Cruz et al., 2021).
The third dietary pattern called “conservative pattern” obtained an explanatory variance of 10.74% and was made up of the following food groups, in descending order (correlations between 0.68 and 0.50): whole foods and light foods/supplements; fruits (juice fruits, whole fruits) and vegetables (cooked vegetables, raw vegetables). Several authors agree that the consumption of whole grains could reduce plasma glucose concentration and have a favorable effect on serum concentrations of triglycerides (TG) and high-density lipoprotein cholesterol (HDL-C) in overweight children (Hajihashemi et al., 2021) (Hollænder et al., 2015). Besides, this pattern also included the food groups of fruits and vegetables, essential pillars in populations’ dietary security and health. Seeking to promote increased consumption of these foods, WHO and FAO have deployed policies and strategies (FAO et al., 2020).
Finally, the fourth dietary pattern, called the “grilled food and processed drinks pattern”, which includes individuals with high consumption of grilled meat products and frequent consumption of processed or ultra-processed alcoholic and non-alcoholic beverages, where sodas, processed juices with added sugar, industrialized juices and energizers stand out. This pattern obtained an explanatory variance of 7.57% and was made up of the following food groups, in descending order (correlations between 0.71 and0.55): alcohol group (alcoholic drinks), grilled foods, and energy drinks (energizers). The high consumption of these foods constitutes a risk factor for health because of its relationship with chronic diseases: alcohol consumption is associated with the main causes of morbidity and mortality (Chrystoja et al., 2021), and high intake of grilled food, like red meat, is related to mortality from cancer and cardiovascular and respiratory diseases (Zheng et al., 2019).
In this respect, the 2020 report about alcohol and health in the Americas showed that the average total consumption of Alcohol Per Capita (APC) was 25% higher in countries of the Region of the Americas than in the rest of the world population. Regarding the presence of alcohol use disorders, Colombia was among the countries of the Americas with one of the highest percentages (OPS, 2021), a concerning fact considering that this intake is associated with the main causes of morbidity and mortality (Chrystoja et al., 2021).
Regarding the results obtained in the CFA, it should be noted that all the proposed models had measures of reasonable fit, with model 4 being the most appropriate, as it presented the best values in 5 of the 9 measures of fit evaluated.
In this model, the flowchart showed standardized correlations greater than 0.30 in most of the food groups, except for the light food/supplement group (0.22) and the whole food group (0.28) in the conservative pattern (pattern 3) and the grilled food group (0.16) in the drinks/grilled food pattern (pattern 4). Although these food groups did not have acceptable correlations, they were kept in the corresponding pattern following the theoretical coherence that supports the definition of each dietary pattern (Herrán et al., 2016).
Overall, the traditional and conservative eating patterns showed a grouping of healthy foods, while the industrial and drinks/grilled foods patterns included the foods mostly associated with the occurrence of non-communicable diseases. When comparing these dietary patterns with those described by Herrán et al. (Quintero-Lesmes and Herran, 2019), a redistribution was observed in the food groups and with it, the consequent division of the “snack” pattern into two new patterns referred to in this study as “industrial pattern” and “drinks/grilled food pattern.”
This study had some limitations. First, the 2015 ENSIN reported a low percentage of consumption of some foods, such as alcohol, grilled foods, and salt, among others, compared to the results reported in other studies (Chrystoja et al., 2021) (OPS, 2021) (FAO., 2012). These differences could be conditioned by the type of survey conducted and, in the case of the report on the consumption of alcoholic drinks, it could also be related to the bias towards social or cultural rejection, in which interviewees could perceive alcohol consumption as socially unacceptable, conditioning them to give biased answers. Nevertheless, as it was a population survey with a sample of 16,216 participants, the data could be analyzed, and new food groups were created and later included in the construction of dietary patterns. In addition, the ENSIN 2015 did not contemplate the inclusion of the population over 65 years of age, so the inference of the results to this population group should be handled cautiously.
Regarding the strengths of our study, we point out: first, the type of sampling (probabilistic, cluster, stratified, and multistage) allowed us to have a representative sample of the different geographical areas of the country; on the other hand, using the CFA as a tool for the validation of dietary patterns provided a solid statistical basis for the determination of the patterns derived from the EFA.
Conclusions Y Future Perspectives
In conclusion, the four patterns obtained through the factor analysis reflect the variety and quality of the diet in the different regions of Colombia. The traditional and conservative patterns include foods with high nutritional power to cover the needs in the different stages of life. The industrial and drinks/grilled foods patterns group ultra-processed foods and beverages with a high caloric content, which threaten the quality of the diet and are mostly associated with the occurrence of non-communicable diseases.
Future research may examine associations between dietary patterns and sociodemographic characteristics, chronic non-communicable diseases, and cancer mortality. This will make it possible to identify at-risk population groups and, in this way, design specific and sustainable interventions that increase population’s health.
Data Availability Statement
The original contributions presented in the study are included in the article/Supplementary Material, further inquiries can be directed to the corresponding authors.
Ethics Statement
This study was reviewed and approved by The Human Research Ethics Committee of Santiago de Cali University (Act N°11 from the May 29th session). Written informed consent for participation was not required for this study in accordance with national legislation (Resolution 8430 of 1993) and international requirements (Declaration of Helsinki and standards of Good Clinical Practice/Harmonized Tripartite Guide of the International Council for Harmonisation).
Author Contributions
ML, VA, and MR conceived this study. All the authors made substantial contributions to the study design, analysis, and interpretation of results. ML, BS, and VD drafted the first version of the manuscript, and all authors reviewed that version and later drafts. All authors read and approved the final manuscript.
Funding
This study was funded by the General Directorate of Research of Santiago de Cali University under call No. 03-2020, 01-2021, 05-2021. The authors thank the Colombian Institute of Family Welfare (ICBF), University Santiago de Cali, for providing the original database of the National Survey of the Nutritional Situation of Colombia (ENSIN); Cordoba University for providing the methodological tools for data analysis; and Universidad Santiago de Cali for funding the study (No. 441-621120-1947).
Conflict of Interest
The authors declare that the research was conducted in the absence of any commercial or financial relationships that could be construed as a potential conflict of interest.
Publisher’s Note
All claims expressed in this article are solely those of the authors and do not necessarily represent those of their affiliated organizations, or those of the publisher, the editors and the reviewers. Any product that may be evaluated in this article, or claim that may be made by its manufacturer, is not guaranteed or endorsed by the publisher.
Supplementary Material
The Supplementary Material for this article can be found online at: https://www.frontiersin.org/articles/10.3389/frfst.2022.897877/full#supplementary-material
References
Al-Maskari, F. (2021). Enfermedades relacionadascon el estilo de vida : Una carga económica para los servicios de salud [Internet]. Naciones Unidas. [cited 2021 Sep 1]Available from: https://www.un.org/es/chronicle/article/enfermedades-relacionadascon-el-estilo-de-vida-una-carga-economica-para-los-servicios-de-salud.
Bentler, P. M. (1990). Comparative Fit Indexes in Structural Models. Psychol. Bull. 107 (2), 238–246. doi:10.1037/0033-2909.107.2.238
B. Leme, A. C., Ferrari, G., Fisberg, R. M., Kovalskys, I., Gómez, G., Cortes, L. Y., et al. (2021). Co-Occurrence and Clustering of Sedentary Behaviors, Diet, Sugar-Sweetened Beverages, and Alcohol Intake Among Adolescents and Adults: The Latin American Nutrition and Health Study (ELANS). Nutrients 13 (6), 1809. doi:10.3390/nu13061809
Cárdenas Sánchez, D. L., Calvo Betancur, V. D., Flórez Gil, S., Sepúlveda Herrera, D. M., and Manjarrés Correa, L. M. (2019). Consumption of Sugary Drinks and Sugar Added to Beverages and Their Relation Ship with Nutritional Status in Young People of Medellin (Colombia). Nutr. Hosp. 36 (6), 1346–1353.
Cediel, G., Reyes, M., da Costa Louzada, M. L., Martinez Steele, E., Monteiro, C. A., Corvalán, C., et al. (2018). Ultra-processed Foods and Added Sugars in the Chilean Diet (2010). Public Health Nutr. 21 (1), 125–133. doi:10.1017/S1368980017001161
Chrystoja, B. R., Monteiro, M. G., Owe, G., Gawryszewski, V. P., Rehm, J., and Shield, K. (2021). Mortality in the Americas from 2013 to 2015 Resulting from Diseases, Conditions and Injuries Which Are 100% Alcohol-Attributable. Addiction 10, 2685–2696. doi:10.1111/add.15475
de Paula Matos Souza, J., Magela de Lima, M., and Martins Horta, P. (2019). Diet Quality Among the Brazilian Population and Associated Socioeconomic and Demographic Factors: Analysis from the National Dietary Survey 2008-2009. J. Acad. Nutr. Dietetics 119 (11), 1866–1874. doi:10.1016/j.jand.2019.04.014
Departamento Administrativo Nacional de Estadistica, (2018). Resultados preliminares Censo de población y Vivienda 2018. [Internet]Available from: https://geoapps.esri.co/censo2018/index.html.
European Commission, (2021). Horizon Europe Work Programme 2021-2022 [Internet]. Available from: https://ec.europa.eu/info/funding-tenders/opportunities/docs/2021-2027/horizon/wp-call/2021-2022/wp-4-health_horizon-2021-2022_en.pdf.
Fao., (2012). Escala Latinoamericana y Caribeña de Seguridad Alimentaria (ELCSA) [Internet]. Available from: https://www.fao.org/3/cb2395es/cb2395es.pdf.
Fao, Fida, (2020). El estado de la seguridad alimentaria y la nutrición en el mundo. Roma: OMS, PMA y UNICEF. [Internet]Available from: https://www.fao.org/3/ca9699es/CA9699ES.pdf.
Fao, Ifad, Unicef, Wfp, Who, (2020). Versión resumida de El estado de la seguridad alimentaria y la nutrición en el mundo 2020. Roma: Transformación de los sistemas alimentarios para que promuevan dietas asequibles y saludables [Internet]. Available from: https://www.fao.org/3/ca9699es/CA9699ES.pdf.
Fisberg, M., Kovalskys, I., Gómez, G., Rigotti, A., Sanabria, L., García, M., et al. ELANS Study Group (2018). Total and Added Sugar Intake: Assessment in Eight Latin American Countries. Nutrients 10, 4389. doi:10.3390/nu10040389
Freitas, T. I. d., Previdelli, Á. N., Ferreira, M. P. d. N., Marques, K. M., Goulart, R. M. M., and Aquino, R. d. C. d. (2017). Factors Associated with Diet Quality of Older Adults. Rev. Nutr. 30 (3), 297–306. doi:10.1590/1678-98652017000300003
Fundación Española de la Nutrición, (2022). Baja adherencia a las guías alimentarias en España, especialmente en población con sobrepeso u obesidad: estudio científico ANIBES [Internet]. Available from: https://www.fen.org.es/anibes/archivos/documentos/ANIBES_numero_17.pdf.
Gámbaro, A., Raggio, L., Dauber, C., Ellis, A. C., and Toribio, Z. (2011). Conocimientos nutricionales y frecuencia de consumo de alimentos: un estudio de caso. Arch. Latinoam. Nutr. 61 (3), 308–315.
Gbd 2017 Diet Collaborators, (2019). Health Effects of Dietary Risks in 195 Countries, 1990-2017: a Systematic Analysis for the Global Burden of Disease Study 2017. Lancet 393, 1958–1972. doi:10.1016/S0140-6736(19)30041-8
Gil-Toro, D., Giraldo-Giraldo, N. A., and Estrada-Restrepo, A. (2017). Ingesta de alimentos y su relación con factores socioeconómicos en un grupo de adultos mayores. Rev. Salud Publica 19, 3304–3310. doi:10.15446/rsap.v19n3.54804
Hair, J. F., Black, W. C., Babin, B. J., and Anderson, R. E. (2009). Multivariate Data Analysis. 7th ed. Upper Saddle River: Prentice-Hall.
Hajihashemi, P., Azadbakht, L., Hashemipour, M., Kelishadi, R., Saneei, P., and Esmaillzadeh, A. (2021). Whole Grain Intake Favorably Affects Blood Glucose and Serum Triacylglycerols in Overweight and Obese Children: A Randomized Controlled Crossover Clinical Trial. Nutrition 87-88, 111200. doi:10.1016/j.nut.2021.111200
Herrán, O. F., Patiño, G. A., and Del Castillo, S. E. (2016). La transición alimentaria y el exceso de peso en adultos evaluados con base en la Encuesta de la Situación Nutricional en Colombia, 2010. Biomedica 36, 109–120.
Herrán, O. F., Patiño, G. A., and Zea, M. D. P. (2018). Patrones de consumo alimentario y pobreza monetaria en Colombia. Rev. Chil. Nutr. 45 (4), 372–380. doi:10.4067/s0717-75182018000500372
Herrera-Cuenca, M., Previdelli, A. N., Koletzko, B., Hernandez, P., Landaeta-Jimenez, M., Sifontes, Y., et al. On Behalf Of The Elans Study Group (2020). Childbearing Age Women Characteristics in Latin America. Building Evidence Bases for Early Prevention. Results from the ELANS Study. Nutrients 13, 45. doi:10.3390/nu13010045
Hollænder, P. L., Ross, A. B., and Kristensen, M. (2015). Whole-grain and Blood Lipid Changes in Apparently Healthy Adults: a Systematic Review and Meta-Analysis of Randomized Controlled Studies1-3. Am. J. Clin. Nutr. 102 (3), 556–572. doi:10.3945/ajcn.115.109165
Icbf, Fao, (2019). Estrategia de Información Educación y Comunicación IEC en Seguridad Alimentaria y Nutricional SAN del ICBF [Internet]. Available from: https://www.icbf.gov.co/sites/default/files/caritlla_iec_baja_final_18_09_2020.pdf.
Icbf. Ensin, (2021). Encuesta Nacional de Situación Nutricional [Internet].Instituto Colombiano de Bienestar Familiar. Available from: https://www.icbf.gov.co/bienestar/nutricion/encuesta-nacional-situacion-nutricional#ensin1.
Instituto Colombiano de Bienestar Familiar, (2018). Ministerio de Protección social , Instituto Nacional de Salud, Profamilia. Resumen Ejecutivo Encuesta Nacional de la Situacion Nutricional en Colombia. Bogotá. ENSIN 2010. 2011 [Internet]. Available from: https://www.icbf.gov.co/sites/default/files/resumenfi.pdf.
Instituto Colombiano de Bienestar Familiar, (2011). Ministerio de Protección social , Instituto Nacional de Salud, Profamilia. Resumen Ejecutivo Encuesta Nacional de la Situacion Nutricional en Colombia. ENSIN 2010. [Internet]Available from: https://www.icbf.gov.co/sites/default/files/resumenfi.pdf.
International Coffe Organization, (2021). Domestic Consumption by All Exporting Countries in Thousand 60kg Bags [Internet]. London: International Coffe Organization. Available from: https://www.ico.org/ (Accessed October 1, 2021).
Khoury, C. K., Bjorkman, A. D., Dempewolf, H., Ramirez-Villegas, J., Guarino, L., Jarvis, A., et al. (2014). Increasing Homogeneity in Global Food Supplies and the Implications for Food Security. Proc. Natl. Acad. Sci. U.S.A. 111 (11), 4001–4006. doi:10.1073/pnas.1313490111
Lim, H., Kim, S. Y., Wang, Y., Lee, S. J., Oh, K., Sohn, C. Y., et al. (2014). Preservation of a Traditional Korean Dietary Pattern and Emergence of a Fruit and Dairy Dietary Pattern Among Adults in south korea: Secular Transitions in Dietary Patterns of a Prospective Study from 1998 to 2010. Nutr. Res. 34 (9), 760–770. doi:10.1016/j.nutres.2014.08.002
Machado, P. P., Steele, E. M., Levy, R. B., da Costa Louzada, M. L., Rangan, A., Woods, J., et al. (2020). Ultra-processed Food Consumption and Obesity in the Australian Adult Population. Nutr. Diabetes 10, 39. doi:10.1038/s41387-020-00141-0
Marôco, J. (2014). Análise de equações estruturais: fundamentos teóricos,.software e aplicações. Lisboa: Report Number.
Miller, V., Mente, A., Dehghan, M., Rangarajan, S., Zhang, X., Swaminathan, S., et al. (2017). Fruit, Vegetable, and Legume Intake, and Cardiovascular Disease and Deaths in 18 Countries (PURE): a Prospective Cohort Study. Lancet 390, 2037–2049. doi:10.1016/S0140-6736(17)32253-5
Ministerio de Salud y Protección Social, (2017). Instituto Colombiano de Bienestar Familiar, Ministerio de Educacional Nacional. Colombia: Lineamiento Nacional de Educación Alimentaria y Nutricional Bogotá. Available from https://www.icbf.gov.co/sites/default/files/lineamiento_nacional_de_educacion_alimentaria_y_nutricional_validacion_ctean.pdf.
Ministerio de Salud Chile, (2022). Escuela de Nutrición. Escuela de Salud Publica, Facultad de Medicina .Encuesta Nacional de Consumo Alimentario.Informe final [internet]. Available from: https://www.minsal.cl/sites/default/files/ENCA-INFORME_FINAL.pdf.
Morejón-Terán, Y. A., Manzano, A. S., Betancourt-Ortiz, S., Ulloa, V. A., Sandoval, V. E., Espinoza-Fajardo, A. C., et al. (2017). Construcción de un Cuestionario de Frecuencia de Consumo de Alimentos para Adultos Ecuatorianos, estudio transversal. Rev. Esp. Nutr. Hum. Diet. 29 (3), 394–402. doi:10.14306/renhyd.25.4.1340
Ocampo T, P. R., Prada G, G. E., and Herrán F, O. F. (20102014). Patrones de consumo alimentario y exceso de peso infantil; encuesta de la situación nutricional en Colombia, 2010. Rev. Chil. Nutr. 41 (4), 351–359. doi:10.4067/s0717-75182014000400002
Oms, (2004). Estrategia mundial sobre régimen alimentario, actividad física y salud [Internet]. Available from: https://apps.who.int/iris/bitstream/handle/10665/21211/A57_9-sp.pdf.
Ops, (2021). Informe sobre la situación del alcohol y la salud en la Región de las Américas 2020 [Internet]. Washington, DC: Informe sobre la situación del alcohol y la salud en la Región de las Américas 2020. [Internet]Available from: https://iris.paho.org/handle/10665.2/53579.
Ortiz-Martinez, E., Diaz-Granados, O. S., and Peña, A. M. (2019). Estructura factorial de un instrumento para valorar el riesgo de consumo de alcohol entre escolares. Apunt. Psicol. 37, 2169–2174.
Pertuz-Cruz, S. L., Molina-Montes, E., Rodríguez-Pérez, C., Guerra-Hernández, E. J., Cobos de Rangel, O. P., Artacho, R., et al. (2021). Exploring Dietary Behavior Changes Due to the COVID-19 Confinement in Colombia: A National and Regional Survey Study. Front. Nutr. 8, 644800. doi:10.3389/fnut.2021.644800
Pinto, V., Landaeta-Díaz, L., Castillo, O., Villarroel, L., Rigotti, A., Echeverría, G., et al. (2019). Assessment of Diet Quality in Chilean Urban Population through the Alternate Healthy Eating Index 2010: A Cross-Sectional Study. Nutrients 11 (4), 891. doi:10.3390/nu11040891
Popkin, B. M., Adair, L. S., and Ng, S. W. (2012). Global Nutrition Transition and the Pandemic of Obesity in Developing Countries. Nutr. Rev. 70 (1), 3–21. doi:10.1111/j.1753-4887.2011.00456.x
Popkin, B. M., and Gordon-Larsen, P. (2004). The Nutrition Transition: Worldwide Obesity Dynamics and Their Determinants. Int. J. Obes. 28, S2–S9. doi:10.1038/sj.ijo.0802804
Popkin, B. M. (1994). The Nutrition Transition in Low-Income Countries: An Emerging Crisis. Nutr. Rev. 52 (9), 285–298. doi:10.1111/j.1753-4887.1994.tb01460.x
Prada, S. I., and Pérez-Castaño, A. M. (2017). Las enfermedades crónicas y el gasto asegurado en Colombia. Salud Publica Mex. 59 (3), 210–211. doi:10.21149/8379
Quintero-Lesmes, D. C., and Herran, O. F. (2019). Food Changes and Geography: Dietary Transition in Colombia. Ann. Glob. Heal 85 (1), 28–10. doi:10.5334/aogh.1643
Rapallo, R., and Rivera, R. (2019). Nuevos patrones alimentarios, mas desafíos para los sistemas alimentarios 2030- Alimentación, agricultura y desarrollo rural en América Latina y el Caribe. [Internet]Available from: https://www.fao.org/3/ca5449es/ca5449es.pdf.
Silva, F. M., Giatti, L., de Figueiredo, R. C., Molina, M. D. C. B., de Oliveira Cardoso, L., Duncan, B. B., et al. (2018). Consumption of Ultra-processed Food and Obesity: Cross Sectional Results from the Brazilian Longitudinal Study of Adult Health (ELSA-Brasil) Cohort (2008-2010). Public Health Nutr. 21, 2271–2279. doi:10.1017/S1368980018000861
Steiger, J. H., and Lind, C. (1984). Statistically Based Tests for the Number of Common Factors. Iowa: Annu Meet Psychom Soc.
Téllez, J. (2019). Un Nuevo Consumidor Colombiano: Hábitos Y Tendencias. [Internet]Available from: https://www.bbvaresearch.com/publicaciones/un-nuevo-consumidor-colombiano-habitos-y-tendencias/#:∼:text=.
Unidad de Planificación Rural Agropecuaria, (2020). Cadena Láctea Colombiana.Analisis Situacional Cadena Láctea [Internet]. Available from: http://www.andi.com.co/Uploads/20200430_DT_AnalSitLecheLarga_AndreaGonzalez.pdf.
Zapata, M. E., Moratal, I. L., and López, L. B. (2020). Calidad de la dieta según el Índice de Alimentación Saludable: Análisis en la población adulta de la ciudad de Rosario, Argentina. Diaeta 38, 1708–1715.
Zapata, M. E., and Rovirosa, A. (2021). La alimentación en la Una mirada desde distintas aproximaciones. CAPA II:Consumo aparente de alimentos y nutrientes a nivel hogar [internet]. Centro de estudios sobre Nutricion Infantil: Disponibilidad de alimentos y nutrientes a nivel país. Available from: https://cesni.
Zheng, M., Sui, Z., Li, Z., and Rangan, A. (2017). A Modeling Study of Beverage Substitution and Obesity Outcomes Among Australian Adults. Nutrition 39-40, 71–75. doi:10.1016/j.nut.2017.03.010
Keywords: feeding behavior, food, food consumption, factor analysis, Colombia
Citation: Meneses Urrea LA, Vaquero Abellán M, Benachi Sandoval N, Villegas Arenas D, Osorio Murillo O and Molina-Recio G (2022) Dietary Patterns in Colombia: An Exploratory and Confirmatory Factor Analysis. Front. Food. Sci. Technol. 2:897877. doi: 10.3389/frfst.2022.897877
Received: 16 March 2022; Accepted: 29 April 2022;
Published: 17 June 2022.
Edited by:
Amparo Gamero, University of Valencia, SpainReviewed by:
Anna Christina PInheiro Fernandes, Universidad del Desarrollo, ChileRaquel Guiné, Instituto Politecnico de Viseu, Portugal
Copyright © 2022 Meneses Urrea, Vaquero Abellán, Benachi Sandoval, Villegas Arenas, Osorio Murillo and Molina-Recio. This is an open-access article distributed under the terms of the Creative Commons Attribution License (CC BY). The use, distribution or reproduction in other forums is permitted, provided the original author(s) and the copyright owner(s) are credited and that the original publication in this journal is cited, in accordance with accepted academic practice. No use, distribution or reproduction is permitted which does not comply with these terms.
*Correspondence: Luz Adriana Meneses Urrea, bHV6Lm1lbmVzZXMwMEB1c2MuZWR1LmNv; Manuel Vaquero Abellán, bXZhcXVlcm9AdWNvLmVz
†Meneses Urrea Luz Adriana, orcid.org/0000-0002-7327-2635; Vaquero Abellan Manuel, orcid.org/0000-0002-0602-317X