 Rodrigo Fernandes Caldeira1Lucas de Paiva Gouvêa1Tatiana de Lima Azevedo2Allan Eduardo Wilhelm2Daniela de Grandi Castro Freitas de Sá2Melicia Cintia Galdeano2
 Ilana Felberg2
 Rosemar Antoniassi2
 Caroline Grassi Mellinger2
 Janice Ribeiro Lima2*
- 1Graduate Program in Food Science and Technology, Federal Rural University of Rio de Janeiro, Rio de Janeiro, Brazil
- 2Embrapa Food Technology, Rio de Janeiro, Brazil
Chickpea (Cicer arietinum L.) is the third most cultivated and consumed pulses worldwide, after bean and pea, and is commonly commercialized in the form of seeds, flour or canned. Grains are rich in proteins with the potential to be an alternative source of protein for human nutrition. The use of pulse proteins is highly dependent on composition, functional and structural properties. The objective of this study was to determine the best processing parameters for the wet extraction of protein from chickpea, as well as to analyze the technical-functional properties and physical characteristics of the protein concentrate. The application of the concentrate in fish-like croquette was also evaluated. The processing route was carried out by alkaline extraction and acid precipitation of proteins where pH, stirring time, and solute:solvent ratio were evaluated. The best results for alkaline extraction were at pH 8.5, solute:solvent ratio of 1:12, and stirring time of 20 min. For acid precipitation, the best results were at pH 4.5 and stirring time of 10 min. The final protein concentrate presented 78% protein (dry basis) and a mass yield of 10.2%. Regarding techno-functional properties, the results for defatted flour (CF) and protein concentrate (CPC) were as follows: solubility (CF pH 3 = 7.60% and pH 9 = 83.82%; CPC pH 3 = 51.45% and pH 9 = 90.72%), water holding activity (CF = 2.18 g/g and CPC = 1.23 g/g), oil holding capacity (CF = 1.69 g/g and CPC = 1.59 g/g), foaming capacity (CF = 82.22% and CPC = 77.78%), foam stability up to 60 min (CF = 92.67% and CPC = 93.82%), emulsifying capacity (CF = 18.79 m2/g and CPC = 16.49 m2/g), emulsion stability (CF = 28.69 min and CPC = 36.64 min) and the lowest degree of gelation for CF (0.10 g/mL) and CPC (0.18 g/mL). As demonstrated in the sensory test, the overall acceptance, flavor, and texture of croquettes added CPC showed no differences when compared to croquettes added with commercial fava bean concentrate. CPC proved to be a promising protein alternative for the plant-based market.
1 Introduction
The forecast is that global demand for proteins will increase to 943.5 million metric tons by 2054, which means it is necessary to introduce protein alternatives into the market, including those of plant origin (Hewage et al., 2022). This increase in protein is expected to more than double by 2050, in line with projections of population growth to approximately 10 billion people worldwide (Boukid, 2021; Henchion et al., 2017; Joehnke et al., 2021; Lonnie and Johnstone, 2020).
Several plant-based food products are being launched possibly due to consumers’ restrictions on animal origin products, lifestyle, the popularization of veganism, vegetarianism, and also the increase of flexitarians (Batista et al., 2023). Chickpeas (Cicer arietinum L.), a member of the Fabaceae family, contain 18%–29% protein, 4%–7% lipids, and 50%–60% starch, (Boukid, 2021; Espinosa-Ramírez and Serna-Saldívar, 2019; Gupta et al., 2021). In 2021, approximately 15.9 million tons of dry grains were produced, with the Asian continent responsible for 84.4% of world production, followed by Oceania 5.5%, Africa 5.1%, the Americas 2.9%, and Europe 2.1%. India is the largest producer of chickpeas in the world, with 11.9 tons in 2021, which represents 74.84% of world production, followed by Australia and Turkey (FAOSTAT, 2022).
Two varieties are the most explored worldwide, Desi, which is characterized by relatively small angular seeds, with varied and sometimes spotted colors, and Kabuli, which is characterized by larger, smoother, and generally light-colored seeds (Merga and Haji, 2019). Kabuli is the most used in Brazil, while Desi has a greater demand in Asian countries. Brazil imports chickpeas from Argentina and Mexico to meet its domestic demand, as its annual production is almost non-existent. Cultivars adapted to the Brazilian climate have recently been launched, such as IAC Morocco, BRS Aleppo, BRS Cristalino, BRS Toro, BRS Cícero, and BRS Kalifa, which will allow the country to be an important producing country in the future (Embrapa Hortaliças, 2023).
The biggest challenge for producing vegetable proteins and their derived ingredients is ensuring that they can provide structural qualities and texture to foods. Diversity of ingredients to serve the market is also a challenge. Its main functions are in the stabilization of emulsions and foams, and production of gels that are suitable for protein drinks and meat analogues (Aschemann-Witzel et al., 2020). Despite all the available literature concerning studies on chickpea and different processes to obtain chickpea protein, there was a lack of studies that evaluated the variable processing parameters altogether when using the classical alkaline protein extraction followed by acid precipitation. Furthermore, reported results are mainly focused on lab-scale tests, so a step ahead was to check on a first scaling up processing of 10 times the initial mass of flour to validate the results obtained. In addition, as innovation in the process, the whole seed flour was used avoiding dehulling step, which implies fewer unit operations for a possible commercial production of the protein concentrate.
Therefore, the objective of this study was to determine the best processing parameters for extracting protein from chickpea grains using the classic wet method, as well as analyzing the technical-functional properties and physical characteristics of the chickpea protein concentrate obtained. The application of the concentrate in fish-like croquettes was tested to verify its suitability as a replacement for other vegetal proteins.
2 Materials and methods
2.1 Materials
Commercial chickpea grains (Cicer arietinum L.) were purchased in the local market, Rio de Janeiro, Brazil. The grains were ground in an LM3100 hammer mill (Perten Instruments AB, Huddinge, Sweden) equipped with a 0.8 mm sieve to obtain chickpea flour. The flour was defatted in a soxhlet extractor for 48 h using petroleum ether, dried in an oven at 40 °C overnight, and stored under refrigeration at 6 °C to 8 °C until use. Fat values were determined with automatic extraction (method Am 5.04) according to AOCS (2009).
2.2 Obtaining chickpea protein concentrate (CPC)
CPC was obtained through alkaline extraction followed by acid precipitation. The following parameters related to the alkaline extraction step were analyzed: pH, stirring time, and solute-solvent ratio; while for the acid precipitation step: stirring time and pH, as described by Caldeira et al. (2024) with adjustments. All experiments were performed in triplicate and submitted to analysis of variance and comparison of means by Tukey’s test (5% probability) to define the best response parameters.
2.2.1 Alkaline extraction of proteins
The pH testing values of 8.0, 8.5, 9.0, 9.5, and 10.0 were achieved by adjusting the pH with 0.1 M NaOH. In the first step, the defatted chickpea flour (CF) was mixed with water, observing a 1:10 ratio (3 g/30 mL) in a 50 mL falcon tube. The pH was adjusted and the mixture was gently stirred (150 rpm) for 60 min using an orbital shaker (Alcacer, Paraná, Brazil). The material was centrifuged at 5,600 g for 15 min (Thermo Scientific Heraeus Multifinge-R, Osterode, Germany). The supernatant was collected and the soluble protein content was determined (Bradford, 1976). The pH value that resulted in the highest soluble protein content was selected for the next step of alkaline extraction testing.
Stirring time (10, 20, 30, 60, 90, and 120 min) was the second variable studied in protein solubilization. The same proportion of CF and water as mentioned above (1:10) and the best extraction pH in the first step were used. The time that resulted in the highest soluble protein content was selected for the next step of alkaline extraction testing.
In the third step, the solute-solvent ratio was evaluated. For this purpose, the CF was mixed with water in different proportions: 1:6 (5 g/30 mL), 1:8 (4 g/32 mL), 1:10 (3 g/30 mL), 1:12 (2 g/24 mL), 1:14 (2 g/28 mL), and 1:16 (2 g/32 mL). The other process variables were kept fixed, using the best previously defined pH and extraction time. The proportion of CF and water that resulted in the highest soluble protein content was selected for the extraction process.
2.2.2 Acid precipitation of proteins
CF (100 g) was used to obtain alkaline extracts through the conditions previously defined and subjected to acid precipitation by using 0.1 M HCl. The pH values tested were 4.0, 4.5, 5.0, and 5.5. The suspensions were maintained for 30 min under agitation (150 rpm) using a magnetic stirrer. Then, the samples were centrifuged at 5,600 g for 15 min (Thermo Scientific Heraeus Multifinge-R, Osterode, Germany) and the precipitates were dried in a forced air oven at 60 °C for 24 h. The dried CPC was then analyzed for moisture (925.09) and protein content (2001.11) with correction factor of 6.25 x N (AOAC, 2010). The best pH for acid precipitation was determined by comparing the CPC protein content (%) and the protein recovery (%) (g protein concentrate/g protein flour x 100) in dry basis.
Stirring times (10, 15, 20, and 25 min) were evaluated using the pH defined in the previous test at the same test conditions. The precipitated suspensions were subjected to centrifugation (5,600 g, 15 min) and the precipitates were dried following the same conditions described above. Again, the definition of the best stirring time was determined by evaluating the protein content and the protein recovery.
2.2.3 Scaling-up the process for obtaining CPC
Based on the conditions determined on the laboratory scale, an experiment was carried out to scale up the process by 10 times (1 kg of CF), to evaluate its reproducibility. After obtaining the protein precipitate, a washing step was added to reduce the acidity of the product. For that, the precipitate was re-suspended in water (1:1 in weigh), stirred for 10 min, and centrifuged at 5,600 g for 15 min (Thermo Scientific Heraeus Multifinge-R, Osterode, Germany). The CPC was dried in a pilot-scale spray dryer (NIRO Atomizer, Soborg, Dinamarca) with inlet air temperature of 160 °C, outlet air temperature of 85 °C, air flow of 460 m/s, and process flow of 10 L/h. Moisture, protein content (N × 6.25) (AOAC, 2010), mass yield (g concentrate/100 g of flour), and protein yield (g protein in the concentrate/100 g protein in the flour) were determined. The CPC obtained in this step was analyzed for its techno-functional properties, morphology, particle size, and for food application.
2.3 Characterization of chickpea protein concentrate
2.3.1 Morphology
SEM (scanning electron microscope) images were obtained using a scanning electron microscope TM-3000 (Hitachi High-Tech, Japan) operated at 15 kV. The dried samples were directly placed on aluminum stubs using sticky double-sided conductive metal tape and the images were obtained at 1,000x magnification, as described by Caldeira et al. (2024).
2.3.2 Particle size
The particle size was determined by light scattering according to the methodology cited by Gouvêa et al. (2023) using a MICROTRAC S3500 laser diffraction equipment (Microtrac Inc., Montgomery Ville, Unites States). The analysis was carried out in duplicate and three reading cycles, using isopropyl alcohol as dispersant fluid (refractive index 1.376). The sample was dispersed in alcohol and immediately fed into the equipment. For the particle size, a refractive index of 1.50 was adopted.
2.3.3 Techno-functional properties
The techno-functional characteristics of water solubility, water and oil holding capacities, emulsifying activity and stability indexes, foam formation capacity and foam stability, and least gelling concentration were determined as described by Silva et al. (2022).
2.3.3.1 Water solubility
The ingredients were solubilized in water (1 g/100 g) and the pH was adjusted from 3 to 9 with NaOH or HCl. The solutions were kept under constant agitation on an orbital shaker for 30 min at room temperature (∼25 °C), followed by centrifugation at 7,224 g for 15 min. The supernatants were collected, and the quantification of the soluble protein was performed (Bradford, 1976). A control solution (1 g/100 g) of each ingredient was obtained by solubilizing the ingredient in 0.1 M NaOH instead of water and kept under the same previous conditions. The protein content present in the supernatant of the control solution was considered to be 100% of the soluble protein (alkaline medium) and the solubility percentage of each sample was determined by the equation:
2.3.3.2 Water and oil holding capacities
Approximately 0.01 g of each ingredient was weighed into micro tubes and 1 mL of water or soybean oil was added, followed by vortexing (Vixar-Vortex Mixer EC) for 1 min. After homogenization, they were left to rest for 30 min at room temperature and centrifuged at 10,836 g for 20 min (Eppendorf AG 22331 Hamburg Centrifuge, series 5452 XM 344604). The supernatant was discarded and the excess (water or oil) on the lid and edge of the tube was removed with the aid of a paper towel. The weight was recorded and the water and oil holding capacity were defined by equations:
where M1 is the mass of the microtube with the dry sample, M2 is the mass of the tube with the sample after discarding the oil or water, and M0 is the initial mass of the sample.
2.3.3.3 Emulsifying activity index and emulsion stability index
Twenty milliliters of soybean oil were added to 60 mL of protein solution (0.5 g/100 g) with pH adjusted to 7 using 0.1 M NaOH or 0.1 M HCl. The mixture was mechanically homogenized at 9,500 rpm for 1 min, using an Ultra-Turrax (T25 basic, IKA, Werke, Germany) with a S25 KV-18 probe. Fifty microliters of the emulsion were withdrawn between the middle and the bottom of the beaker and added of 5 mL of dodecyl-sodium sulfate (SDS) (0.1 g/100 g) at times 0 and 10 min after homogenization. Absorbances were determined at 500 nm with a spectrophotometer (Biospectro, Unites States) at times 0 (A0) and 10 min (A10) after emulsion formation. The emulsifying activity index (EAI) and the emulsion stability index (ESI) were calculated using the equations:
where DF is the dilution factor (100), c is the initial concentration of the protein solution (g/mL), θ is the oily volume of the emulsion (0.25), A0 and A10 are the absorbances of the emulsion at times 0 min and 10 min, respectively.
2.3.3.4 Foaming capacity and foam stability
Protein solutions of 2.5 g/100 g were prepared and adjusted to pH 7 using 0.1 M NaOH or 0.1 M HCl. Fifteen milliliters were transferred to a 100 mL beaker and homogenized for 2 min using an ultra-turrax (Probe S 25 KV-18 G), following the rotation/time ramp of 6,500 rpm/30 s, 9,500 rpm/30 s, and 13,500 rpm/60 s. The foam formed was carefully transferred to a 50 mL graduated cylinder with the aid of a spatula. Foaming capacity (FC) and foam stability (FS) were calculated according to the equations:
where, V1 is the total volume after stirring, V0 is the initial volume before stirring and V2 is the total volume after the times of 10, 30, and 60 min.
2.3.3.5 Least gelling concentration
Suspensions varying in concentration (2–20 g/100 g) were prepared into 5 mL of distilled water and transferred to sealed glass test tubes. The tubes were immersed in a water bath (Ultrathermostatic SL 152-Solab) at 100 °C for 1 h, followed by immediately cooling in an ice bath and kept overnight at 4 °C. The samples were then poured and divided into 3 classifications, regarding gel formation: (1) no gel formation, when the solution was liquid and flowed with no resistance, (2) weak gel, when the solution flowed with some resistance, (3) gel formation, when the tube was inverted and the solution did not flow. The minimum concentration for gel formation was defined as the lowest concentration to form a firm gel in all three replicates from the same sample.
2.3.4 Statistical analysis
The analyzed parameters were submitted to ANOVA. All analyzes were performed in triplicate, unless for the food application test, and means and standard deviations were calculated, and when F values were significant (p < 0.05), Tukey’s test was applied at the significance level of 0.05 for comparison of mean values using STATISTICA software, version 7.0 (StatSoft Inc., Tulsa, OK, Unites States).
2.4 Food application
For testing the food application of the ingredient, fish-like croquettes were prepared by using water (65.2%), textured soybean protein (14.2%), wheat flour (8.9%), tomato paste (3.4%), fresh cilantro (3.2%), salt (1.2%), crude palm oil (1.2%), CPC (1.0%), soybean oil (1.0%), dehydrated onion (0.4%), dehydrated garlic (0.3%). Control samples were prepared replacing the CPC for commercial faba bean concentrate (Ingredion Vitessence clean taste, 60% protein). Ingredients were mixed and cooked until a homogeneous mass was formed, which was shaped into croquettes with individual weight of 20 g. The fish-like croquettes were packed in polyethylene plastic bags and stored frozen (−18 °C) until testing.
Sensory acceptance test (Meilgaard et al., 2006) was carried out with 101 judges, who were asked to rate their overall, flavor and texture acceptance of the croquettes using a 9-point structured hedonic scale ranging from 1 (I disliked extremely) to 9 (I liked extremely). The croquettes were prepared in an air fryer at 180 °C for 10 min. Samples were served on white disposable plates, coded with random three-digit numbers and presented in a monadic and balanced manner to minimize the effect of sample positioning. A glass of water was offered between samples to eliminate residual taste in the mouth. Results were submitted to analysis of variance (5% probability).
Participants in sensory tests gave informed consent via the statement “I am aware that my responses are confidential, and I agree to participate in this survey” where an affirmative reply was required to enter the survey. They were able to withdraw from the survey at any time without giving a reason. The products tested were safe for consumption.
3 Results and discussions
3.1 Alkaline extraction
Lipids can interfere as a barrier to solvent penetration during protein extraction (Sánchez-Vioque et al., 1999; Soto-Madrid et al., 2023; Toews and Wang, 2013). Therefore, a defatting procedure was previously applied to the flour. Whole chickpea flour lipid content was 6.08 g/100 g and in the defatted flour it was 2.37 g/100 g on dry basis.
Regarding the effect of pH on the protein content of the extract, higher value was obtained (p ≤ 0.05) when pH ranged from 8.5 to 9.5 (Figure 1A). According to Gao et al. (2020), extreme alkaline and acidic pH during extraction and precipitation, together with high temperatures during spray drying, can denature yellow pea proteins. Likewise, Lee et al. (2007) reported that alkaline extraction at pH 9.5 for lentil protein isolate resulted in greater denaturation compared to extraction at pH 8. So, pH 8.5 was chosen for alkaline extraction to preserve the quality of the protein as much as possible and reduce the amount of alkali in the process.
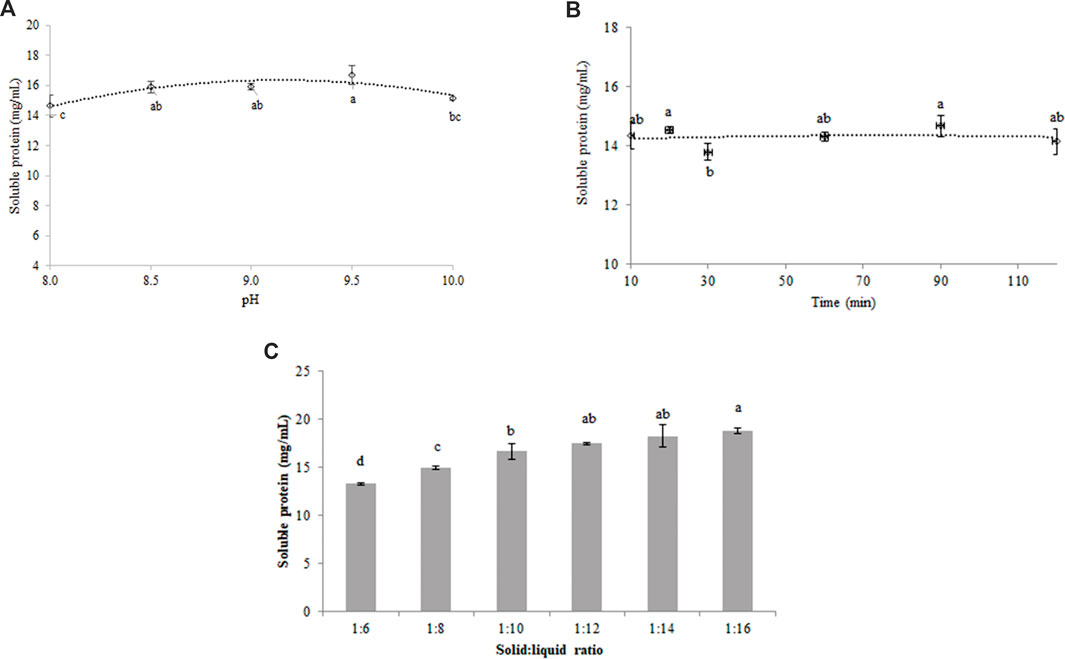
Figure 1. (A) Effect of pH on chickpea protein extraction; (B) Effect of stirring time on chickpea protein extraction, and (C) Effect of solute:solvent ratio on chickpea protein extraction. Different letters mean significant difference among samples (p ≤ 0.05). Lines are tendency curves.
Small differences were observed among protein extraction times (Figure 1B). However, as 10 min is considered a very strict time for process control, the stirring time of 20 min was defined as the ideal time to perform the protein extraction. Jarpa-Parra et al. (2014) found that time did not influence the extraction of proteins from green lentils.
No differences were observed (p > 0.05) in the protein content of extracts obtained with the solid:liquid proportions of 1:12, 1:14, and 1:16, and the results were higher than the values obtained at lower dilution level (1:6, 1:8 and 1:10 ratios) (Figure 1C), so 1:12 was selected considering less water use. In the literature, several studies used the 1:10 ratio in the chickpea protein extraction by alkali solubilization, however, none of them evaluated the ideal solid-liquid ratio for extraction (Ghribi et al., 2015; Karaca et al., 2011; Papalamprou et al., 2010; Perović et al., 2022; Sánchez-Vioque et al., 1999).
3.2 Acid precipitation
There were no significant differences (p > 0.05) in the protein content of the CPC obtained in pH 4.5, 5.0 and 5.5, while protein recovery was greater at pH 4.0 and 4.5 (66.65% and 65.08%, respectively) (Figure 2A). Thus, pH 4.5 was chosen for the precipitation process due to the higher protein content in the CPC compared to pH 4.0. Other studies have also used pH 4.5 for producing chickpea protein concentrates and isolates (Chang et al., 2022; Kaur and Singh, 2007; Peyrano et al., 2016; Tontul et al., 2018).
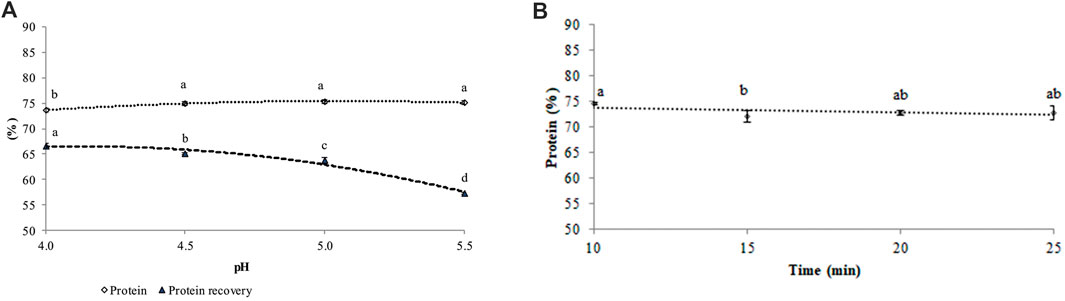
Figure 2. (A) Effect of pH on chickpea protein precipitation and protein recovery, and (B) effect of time on chickpea protein precipitation. Different letters mean significant differences among samples (p ≤ 0.05). Lines are tendency curves.
The stirring time during precipitation practically did not affect the protein content of the concentrates (Figure 2B) and, it was observed visually that the precipitation occurs immediately, so the shortest process time (10 min) was selected for the process.
3.3 Scaling up the process
The CPC obtaining process (Figure 3) showed mass yield of 10.2% and the final product presented a protein content of 77.5% (N x 6.25) on a dry basis, which corresponds to 73.2% on a wet basis with a moisture content of 5.6%. Considering an initial protein content of 20.3% in the CF, the process increased the protein content in 3.8 times. Reported results on yield for obtaining protein concentrates and isolates from chickpea range from 11.79% to 16.77%, while the reported protein content range from 63.9% to 89% (Boye et al., 2010a; Chang et al., 2022; Espinosa-Ramirez and Serna-Saldiva, 2019). Results obtained in our study are high when compared to chickpea commercial protein concentrates, that range from 50% to 60% in protein and are mainly produced by air classification, which has economic and environmental advantages. However, the low protein yields and purity are still drawbacks to the dry method and additional wet methods are required to enhance the protein content and purity (Boukid et al., 2021).
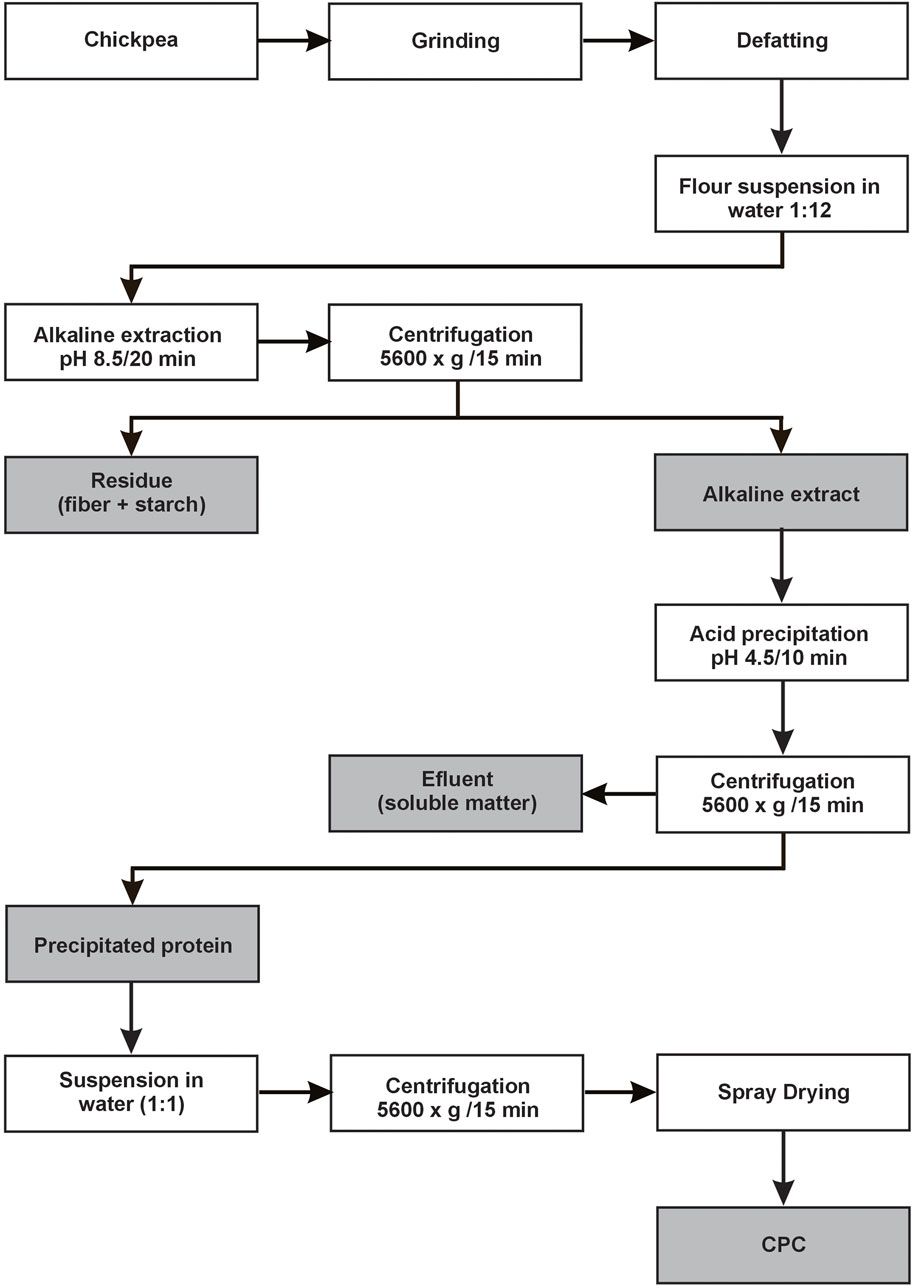
Figure 3. Flow chart for obtaining chickpea protein concentrate (CPC).
3.4 Morphology
Figure 4A shows the micrograph of defatted chickpea flour (CF) and the protein concentrate (CPC) obtained as described in Figure 3. Oval-shaped structures are observed in CF, representing starch granules, with approximate sizes of 20–40 μm (length) and 15–25 μm (width), typical of chickpeas starch (Kaur and Prasad, 2023; Ruckmangathan et al., 2022). The irregular and small structures on the surface of starch granules are cell wall fragments (CW) and protein bodies (PB), respectively. In CF, the starch granules have a smooth surface and are clearly visible, consistent with findings by Kaur and Prasad (2023) and Ruckmangathan et al. (2022). The main components of the CPC (Figure 4B) are protein bodies (77% protein), with hollow and wrinkled characteristics and varying sizes of up to 20 μm. Impurities (starch and cell wall material) are also observed. The hollow and wrinkled characteristics observed are common when proteins are subjected to spray-drying process, due to the existence of a high concentration gradient between the drops and the drying medium (hot air), as already reported by other authors (Rezvankhah et al., 2021; Gouvêa et al., 2023).
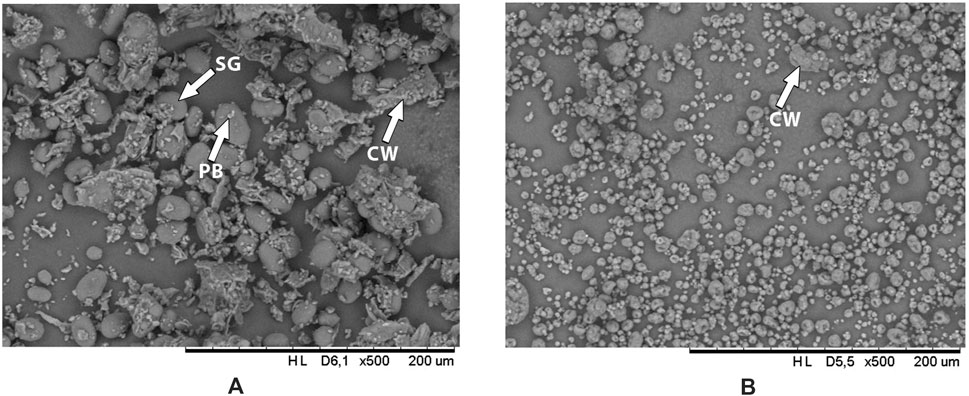
Figure 4. SEM micrographs of (A) defatted chickpea flour and (B) chickpea protein concentrate. SG: starch granule, PB: protein bodies, CW: cell wall fragments.
3.5 Particle size
The mean diameter of the samples [D (4.3)] and their percentiles (D10, D50, and D90) are listed in Table 1. The particle size of CPC was approximately 4 times smaller than the CF (26.16 μm and 107.30 μm, respectively), with 90% of the particles smaller than 60.81 μm. This is probably due to the process of CPC obtaining, as it is known that spray drying conditions (atomizing nozzle, air pressure) have a strong influence on particle size (Shen et al., 2021). Other studies have reported smaller particle sizes for protein concentrates and isolates obtained by the spray drying method when compared to other drying techniques (Brishti et al., 2020; Gouvêa et al., 2023; Özdemir et al., 2022; Shen et al., 2021).
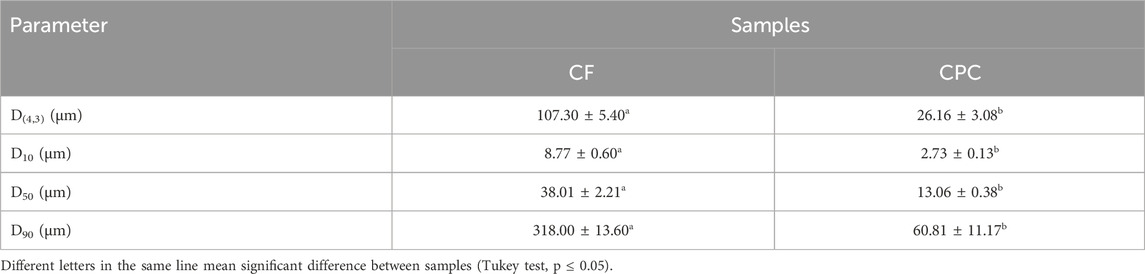
Table 1. Particle size of defatted chickpea flour (CF) and chickpea protein concentrate (CPC).
Higa et al. (2022), in their studies on fine and coarse chickpea flours, found particle size in μm for fine flour as follows: D10 8.53, D50 23.23, D90 194.63, and D (4.3) 62.84; and for coarse flour: D10 15.97, D50 229.57, D90 769.54, and D (4.3) 312.33. They observed that the flour with the smallest particle size increased the extraction yield by 2.80%, protein yield by 10.70% and protein content by 5.80%, when extracted in a solute:solvent ratio of 1:10, using the classic wet route, reinforcing the importance of particle size in protein extraction Particle size also affects the techno-functional characteristics of the materials and, consequently, their performance in the final product. The equipment, sieve, variety and peeling or not of the grain used to obtain the flour directly influence the particle size.
3.6 Water solubility
The solubilities of CF and CPC were studied at pH ranging from 3 to 9 (Figure 5). The samples presented a U-shaped solubility, showing a lower solubility between pH 4 and 5, which is be due to the isoelectric point of these proteins (Sofi et al., 2020). The highest solubilities of CF and CPC were observed at pH 9 (83.82% and 90.72%, respectively).
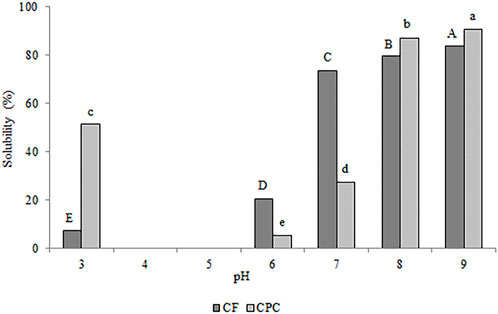
Figure 5. Solubility in water of defatted chickpea flour (CF) and chickpea protein concentrate (CPC) at different pH values. Different letters mean significant difference among samples (p ≤ 0.05), CF capital letters, CPC lowercase letters.
Chang et al. (2022) reported slightly lower values of CPC solubility at pH 9 (85%). The lowest solubility was 1% at pH 4 to 6, similar to the present work. Several studies have shown that cultivars and genotypes have a significant impact on the functional performance of vegetable proteins, in addition to the techniques adopted for drying protein concentrates, which is the most likely cause for the small differences reported (Ma et al., 2022).
The results obtained were in accordance with our previous work comparing the properties of eight protein ingredients from different legumes (soy protein isolate, soy protein concentrate, pea protein isolate, pea protein concentrate, common bean protein concentrate, common bean flour, fava bean protein concentrate, and fava bean flour) that also showed a V-shape solubility curve with the lowest solubility values between pH 4 and 5 and higher ones in pH values between 8 and 9 (Gouvêa et al., 2023).
The most likely cause for the increased high and low pH solubility of proteins is related to the net positive and negative charges, resulting in an electrostatic repulsive force that helps keep the protein molecules separated, altering the protein’s native structure to unfolded form, exposing its hidden functional groups, thus increasing solubility (Ettoumi and Chibane, 2015; Lima et al., 2023; Sofi et al., 2020; Tontul et al., 2018). Close to the isoelectric point, proteins aggregate due to strong intermolecular interactions, resulting in less interaction with water and, therefore, lower protein solubility (Lima et al., 2023).
3.7 Water holding capacity (WHC) and oil holding capacity (OHC)
The WHC values of CF and CPC were 2.18 g/g and 1.23 g/g, respectively, while the OHC of CF was 1.69 g/g and of CPC was 1.59 g/g (Figure 6). Sanjeewa et al. (2010) reported lower values for chickpeas flours from Kabuli and Desi cultivars for both properties: WHC of 0.71 and 0.84 g/g and OHC of 0.81 and 0.88 g/g, respectively. Ruckmangathan et al. (2022) found WHC for chickpea flour ranging from 0.78 to 1.20 g/g and OHC from 1.05 to 1.24 g/g, while for CPC, WHC was 2.28 g/g and OHC was between 2.08 and 3.96 g/g. Ghribi et al. (2015), reported WHC for CPC from 2.3 to 5.0 g/g, and OHC from 1.1 to 4.1 g/g. The results were in accordance with our previous work comparing the properties of eight protein ingredients, soy protein isolate, soy protein concentrate, pea protein isolate, pea protein concentrate, common bean protein concentrate, common bean flour, fava bean protein concentrate, and fava bean flour that showed water holding capacity ranging from 1.34 to 4.52 g water/g, oil holding capacity from 1.22 to 2.84 g oil/g (Gouvêa et al., 2023).
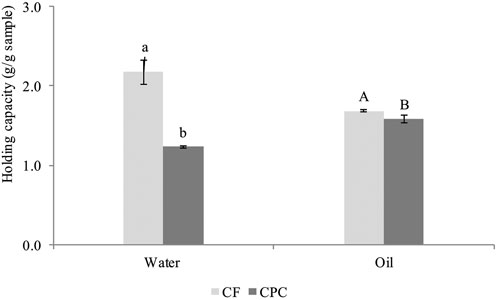
Figure 6. Water holding capacity (WHC) and oil holding capacity (OHC) of defatted chickpea flour (CF) and chickpea protein concentrate (CPC). Different letters mean significant difference between samples (p ≤ 0.05).
A possible explanation for the flour absorbing more water than the protein concentrate is that spray drying can affect the particles by forming a hydrophobic layer on them, making their interaction with water difficult (Brishti et al., 2020; Gouvêa et al., 2023). Another explanation would be that during grain grinding, starch damage can occur due to either mechanical force or to temperature increase, which could increase the water retention capacity in consequence of the increase in starch levels exposed to hydration. Furthermore, damaged starch absorbs more water than undamaged starch due to interactions between starch and non-starch components such as proteins and cell wall matrices (Rao et al., 2016; Drakos et al., 2017).
Furthermore, although smaller particles have a greater surface area to interact with water and can have high WHC values, very fine particles can have collapsed structures, resulting in the opposite effect (Gouvêa et al., 2023). Ghribi et al. (2015) reported in their studies that during the spray drying process, a very smooth, thin surface film is formed that is highly resistant to water absorption, in addition to denaturation of the protein. Other conditions that affect the absorption of water and oil are varieties used and moisture content.
3.8 Emulsifying activity index (EAI), emulsion stability index (ESI), foaming capacity, and foam stability
Figures 7A,B show the EAI and ESI results obtained for CPC (16.49 m2/g and 36.64 min, respectively) and CF (18.79 m2/g and 28.69 min, respectively). EAI were similar for both materials while the ESI of CPC was higher than that of CF. Similar findings to our studies were reported by Gouvêa et al. (2023) in their work with legume protein ingredients (isolates and concentrates) that found EAI ranging from 14.03 m2/g to 19.39 m2/g. For whole chickpea flour Ettoumi and Chibane (2015) obtained EAI of 47.38 m2/g and ESI of 32.73 min. In protein concentrates obtained from chickpeas by freeze drying, Karaca et al. (2011) obtained EAI of 47.90 m2/g and ESI of 82.94 min.
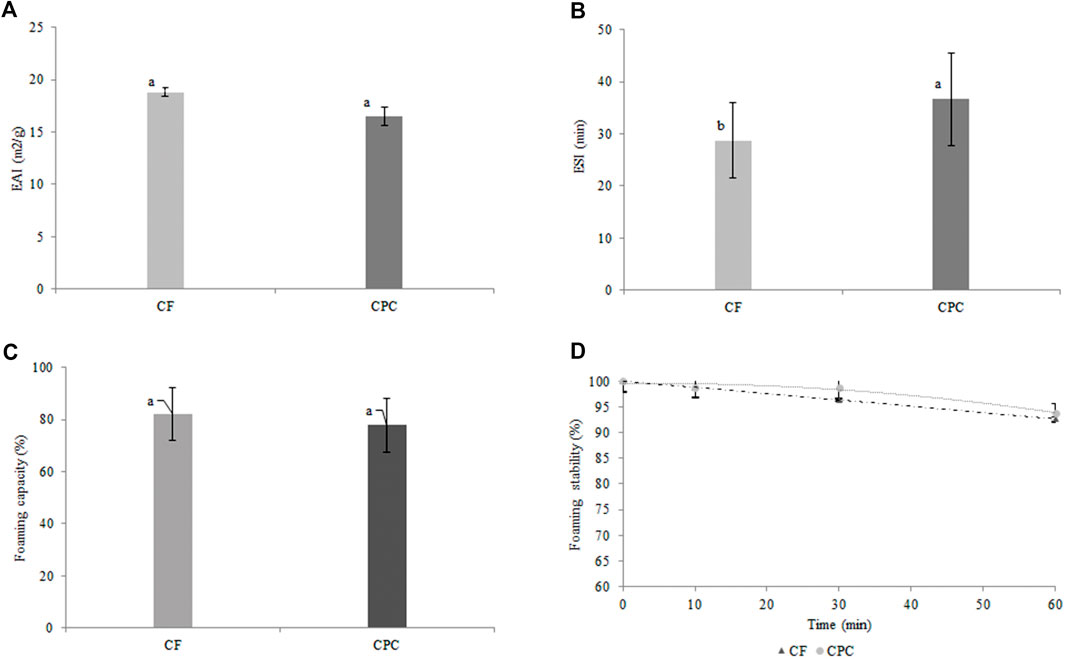
Figure 7. (A) Emulsifying activity index - EAI, (B) Emulsion stability index - ESI, (C) Foaming capacity, (D) Foam stability, for defatted chickpea flour (CF) and chickpea protein concentrate (CPC). Different letters mean significant difference between samples (p ≤ 0.05). Lines are tendency curves.
Many differences in results for emulsifying activity and emulsion stability are observed in different studies, even when using the same obtaining method, which may be due to the origin and concentration of the protein (Ma et al., 2022). The pH is a parameter that influences the emulsifying properties of legume proteins, higher pH values present higher EAI compared to proteins at pH values close to their isoelectric points. Zhang et al. (2009) observed that a chickpea protein isolate obtained by isoelectric precipitation exhibited higher EAI at alkaline pH than at pH close to the isoelectric point of the protein, where the emulsifying activity of the protein decreased drastically. Similar behavior was observed for water solubility of proteins; higher pH values, higher EAI and greater solubility; an observation also detected in our studies, where the protein showed high solubility at alkaline pH values.
The chickpea protein concentrate showed excellent emulsifying activity and emulsion stability, making it possible to apply it in food matrices such as in the preparation of mayonnaise, soups, cakes, sausages and salad dressings.
Figures 7C,D show the foaming capacity (FC) and foam stability (FS) of chickpea flour and its protein concentrate. In foam formation, the protein must unfold and be molecularly flexible to form interfacial membranes around the air bubbles (Shen et al., 2021).
The FC and FS values of the CF were, respectively, 82.22% and 92.67% (60 min), while for the CPC the values obtained were 77.78% and 93.82% (60 min), respectively. Both materials presented similar FC and after 60 min the CF and CPC foam stability values were very close, and no differences were observed at each time tested (p > 0.05, Tukey test). The good stability of the CF and CPC foam suggests that the proteins soluble in the continuous phase (water) are very surfactant (Kaur and Singh, 2005). The high FC values observed are because the most soluble proteins (globulin and albumin) are in their native form, in addition to the flour defatting, as that fat reduces the ability of proteins to diffuse to the interface (Stone et al., 2019).
According to studies carried out by Tang et al. (2021), several samples of legume isolates (chickpeas, lentils, beans, and peas) showed foam stability greater than 80% for a resting time of 90 min. Proteins that have high solubility typically have a high foaming capacity, which is due to their high surface charge and excellent balance of hydrophilic-hydrophobic amino acids (Gundogan and Karaca, 2020).
The results were in accordance with our previous work comparing the properties of eight protein ingredients (soy protein isolate, soy protein concentrate, pea protein isolate, pea protein concentrate, common bean protein concentrate, common bean flour, fava bean protein concentrate, and fava bean flour) that showed emulsifying activity index from 14.03 m2/g to 19.39 m2/g and, foaming capacity from 73.33% to 93.33% (Gouvêa et al., 2023).
3.9 Least gelling concentration (LGC)
For the LGC the lower the concentration of the protein ingredient, the better its gelling capacity. The LGC results obtained for CF and CPC were 0.10 g/mL and 0.18 g/mL, respectively (Table 2). Kaur and Singh (2007) reported LGC values between 0.14 g/mL and 0.18 g/mL for chickpea protein isolates and lower values (0.10 g/mL to 0.14 g/mL) for their corresponding flours, like the data found in our studies. Other studies that used the same wet extraction technique to obtain CPC reported responses for LGC of 0.11 g/mL and 0.18 g/mL (Boye et al., 2010b; Kaur and Singh, 2007; Papalamprou et al., 2009).
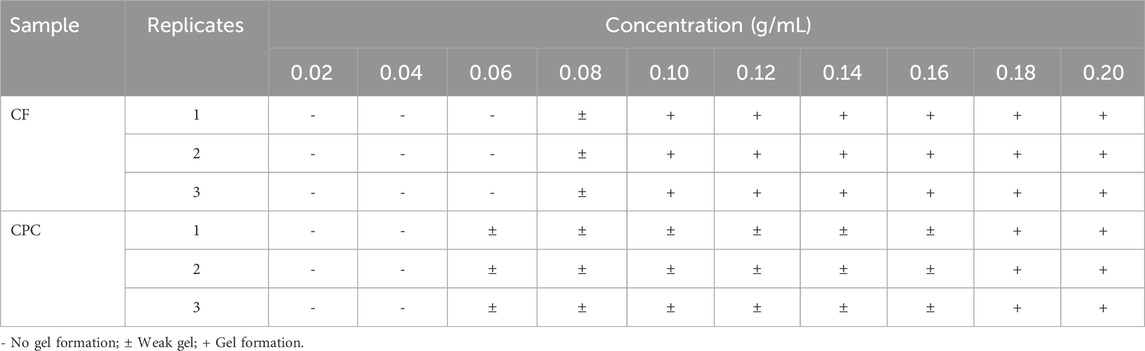
Table 2. Least gelling concentration of defatted chickpea flour (CF) and chickpea protein concentrate (CPC).
The lower gelation concentration of CF is related to its composition, not only depending on its total protein content, but also on the type, denaturation, state of aggregation of the proteins and the presence of any non-protein substance. Therefore, the gelling capacity of CF is influenced by a physical competition for water between protein gelation and starch gelatinization (Kaur and Singh, 2005; Kaur and Singh, 2007; Ma et al., 2022). These behavior can be seen in the various values observed for eight different protein ingredients, with the minimum concentration required for gel formation for fava bean protein concentrate (0.12 g/mL), similar gelling properties for soy protein isolate, soy protein concentrate, pea protein concentrate and, common bean flour (0.14 g/mL), pea protein isolate (0.18 g/mL), common bean protein concentrate, and fava bean flour (0.20 g/mL) (Gouvêa et al., 2023).
3.10 Food application
No differences were observed (p > 0.05) between fish-like croquettes made with the CPC and the ones with the commercial faba bean concentrate (Table 3) for all the tested attributes. These results indicate that the CPC obtained in the present work presented similar sensory performance to the commercial clean taste ingredient. The means of the hedonic values for sensory acceptance were between the categories “like slightly” and “like moderately”. All scores were among the acceptance range of the scale, which comprises notes between 5 and 9. Therefore, it can be concluded that the fish-like croquettes made from both ingredients were accepted by consumers.
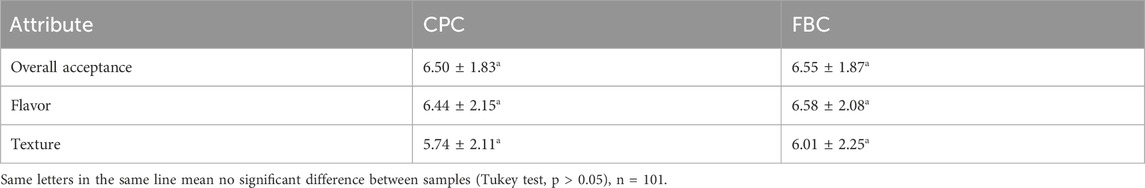
Table 3. Sensory acceptance of fish-like croquettes made with chickpea protein concentrate (CPC) and commercial faba bean concentrate (FBC).
Although the sensory test was performed using the CPC as an ingredient instead of CF, based on the techno-functional properties presented by the CF it is expected that this flour would work as well.
4 Conclusion
The CPC obtained by the classic wet method using the parameter in alkaline extraction (pH 8.5), stirring time (20 min), solute:solvent ratio (1:12) and acid precipitation (pH 4.5) and stirring time (10 min), had a protein content of approximately 78% (N x 6.25) on a dry basis and a mass yield of approximately 10.2%. The techno-functional characteristics found were quite interesting, demonstrating that it can be applied to different types of foods. In general, this study provides information on the appropriate parameters for obtaining the protein concentrate, techno-functional characterization, physical properties, and application in food that can be used to optimize the use of CPC by the food industry. Although the conventional method employed for protein obtainment has some drawbacks, including production of wastewater, the association with other methods such as a previous air classification step can diminish this effect as well as help to improve the extraction process yield, which can be subject for further studies.
Data availability statement
The raw data supporting the conclusions of this article will be made available by the authors, without undue reservation.
Ethics statement
Ethical approval was not required for the studies involving humans because Participants in sensory tests gave informed consent via the statement “I am aware that my responses are confidential, and I agree to participate in this survey” where an affirmative reply was required to enter the survey. They were able to withdraw from the survey at any time without giving a reason. The products tested were safe for consumption. The studies were conducted in accordance with the local legislation and institutional requirements. The participants provided their written informed consent to participate in this study.
Author contributions
RC: Writing – original draft, Formal Analysis. Ld: Formal Analysis, Writing – review and editing. TA: Formal Analysis, Writing – review and editing. AW: Formal Analysis, Writing – review and editing. DF: Formal Analysis, Writing – review and editing. MG: Formal Analysis, Conceptualization, Methodology, Writing – review and editing. IF: Conceptualization, Formal Analysis, Writing – review and editing. RA: Formal Analysis, Writing – review and editing, Investigation, Methodology. CM: Conceptualization, Data curation, Formal Analysis, Investigation, Project administration, Writing – original draft, Writing – review and editing. JL: Conceptualization, Investigation, Project administration, Writing – original draft, Writing – review and editing, Funding acquisition, Methodology.
Funding
The author(s) declare that financial support was received for the research and/or publication of this article. The authors thank Brazilian Agricultural Research Corporation - Embrapa (Grant number 20.19.03.008.00.01.001 – Development of plant based proteins supplies from pulses for animal protein substitution in food). This study was also financed in part by the Coordenação de Aperfeiçoamento de Pessoal de Nível Superior - Brasil (CAPES) - Finance Code 001.
Conflict of interest
The authors declare that the research was conducted in the absence of any commercial or financial relationships that could be construed as a potential conflict of interest.
Generative AI statement
The author(s) declare that no Generative AI was used in the creation of this manuscript.
Any alternative text (alt text) provided alongside figures in this article has been generated by Frontiers with the support of artificial intelligence and reasonable efforts have been made to ensure accuracy, including review by the authors wherever possible. If you identify any issues, please contact us.
Publisher’s note
All claims expressed in this article are solely those of the authors and do not necessarily represent those of their affiliated organizations, or those of the publisher, the editors and the reviewers. Any product that may be evaluated in this article, or claim that may be made by its manufacturer, is not guaranteed or endorsed by the publisher.
References
AOAC (2010). Official methods of analysis of AOAC international. Washington, DC:Association of Official Analysis Chemists International.
AOCS (2009). American Oil Chemist's Society, Official methods and recommended practices. Champaign: American Oil Chemists' Society.
Aschemann-Witzel, J., Gantriis, R. F., Fraga, P., and Perez-Cueto, F. J. A. (2020). Plant-based food and protein trend from a business perspective: markets, consumers, and the challenges and opportunities in the future. Crit. Rev. Food Sci. Nutr. 61 (18), 3119–3128. doi:10.1080/10408398.2020.1793730
Batista, L. F., Rocha, F., Dias, M. M., dos, S., Pires, A. C., dos, S., et al. (2023). Comfort plant-based food: what do consumers want? - a focus group study with different consumers group. Int. J. Gastr. Food Sci. 34, 100810. doi:10.1016/j.ijgfs.2023.100810
Boukid, F. (2021). Chickpea (Cicer arietinum L.) protein as a prospective plant-based ingredient: a review. Int. J. Food Sci. Technol. 56 (11), 5435–5444. doi:10.1111/ijfs.15046
Boukid, F., Rosell, C. M., and Castellari, M. (2021). Pea protein ingredients: a mainstream ingredient to (re)formulate innovative foods and beverages. Trends Food Sci. Technol. 110, 729–742. doi:10.1016/j.tifs.2021.02.040
Boye, J., Zare, F., and Pletch, A. (2010a). Pulse proteins: processing, characterization, functional properties and applications in food and feed. Food Res. Int. 43 (2), 414–431. doi:10.1016/j.foodres.2009.09.003
Boye, J., Aksay, S., Roufik, S., Ribéreau, S., Mondor, M., Farnworth, E., et al. (2010b). Comparison of the functional properties of pea, chickpea and lentil protein concentrates processed using ultrafiltration and isoelectric precipitation techniques. Food Res. Int. 43 (2), 537–546. doi:10.1016/j.foodres.2009.07.021
Bradford, M. M. (1976). A rapid and sensitive method for the quantitation of microgram quantities of protein utilizing the principle of protein-dye binding. Anal. Biochem. 72 (5), 248–254. doi:10.1006/abio.1976.9999
Brishti, F. H., Chay, S. Y., Muhammad, K., Ismail-Fitry, M. R., Zarei, M., Karthikeyan, S., et al. (2020). Effects of drying techniques on the physicochemical, functional, thermal, structural and rheological properties of mung bean (Vigna radiata) protein isolate powder. Food Res. Int. 138, 109783. doi:10.1016/j.foodres.2020.109783
Caldeira, R. F., de Paiva Gouvêa, L., Azevedo, T. L., Conte, C., Freitas de Sá, D. G. C., Galdeano, M. C., et al. (2024). Processing parameters, techno-functional properties and potential food application of lentil protein concentrate as an ingredient for the plant-based market. Food Res. Int. 189, 114569. doi:10.1016/j.foodres.2024.114569
Chang, L., Lan, Y., Bandillo, N., Ohm, J. B., Chen, B., and Rao, J. (2022). Plant proteins from green pea and chickpea: extraction, fractionation, structural characterization and functional properties. Food Hydr. 123, 107165. doi:10.1016/j.foodhyd.2021.107165
Drakos, A., Kyriakakis, G., Evageliou, V., Protonotariou, S., Mandala, I., and Ritzoulis, C. (2017). Influence of jet milling and particle size on the composition, physicochemical and mechanical properties of barley and rye flours. Food Chem. 215, 326–332. doi:10.1016/j.foodchem.2016.07.169
Embrapa Hortaliças (2023). Cultivares da Embrapa Hortaliças (1981-2023). Brasília, DF, Brazil, 237. Available online at: https://ainfo.cnptia.embrapa.br/digital/bitstream/doc/1156800/1/livro-cultivares-embrapa-hortalicas.pdf.
Espinosa-Ramírez, J., and Serna-Saldívar, S. O. (2019). Wet-milled chickpea coproduct as an alternative to obtain protein isolates. LWT–Food Sci. Technol. 115, 108468. doi:10.1016/j.lwt.2019.108468
Ettoumi, L., and Chibane, M. (2015). Some physicochemical and functional properties of pea, chickpea and lentil whole flours. Int. Food Res. J. 22 (3), 987–996. Available online at: http://www.ifrj.upm.edu.my/22%20(03)%202015/(16).pdf.
Faostat (2022). Food Agric. Organ. U. N. Available online at: https://www.fao.org/faostat/en/#rankings/countries_by_commodity.
Gao, Z., Shen, P., Lan, Y., Cui, L., Ohm, J. B., Chen, B., et al. (2020). Effect of alkaline extraction pH on structure properties, solubility, and beany flavor of yellow pea protein isolate. Food Res. Int. 131, 109045. doi:10.1016/j.foodres.2020.109045
Ghribi, A. M., Gafsi, I. M., Blecker, C., Danthine, S., Attia, H., and Besbes, S. (2015). Effect of drying methods on physico-chemical and functional properties of chickpea protein concentrates. J. Food Eng. 165, 179–188. doi:10.1016/j.jfoodeng.2015.06.021
Gouvêa, L., de, P., Caldeira, R. F., de Lima Azevedo, T., Galdeano, M. C., Felberg, I., et al. (2023). Physical and techno-functional properties of a common bean protein concentrate compared to commercial legume ingredients for the plant-based market. Food Hydr. 137, 108351. doi:10.1016/j.foodhyd.2022.108351
Gundogan, R., and Karaca, A. (2020). Physicochemical and functional properties of proteins isolated from local beans of Turkey. LWT–Food Sci. Technol. 130, 109609. doi:10.1016/j.lwt.2020.109609
Gupta, N., Tiwari, S., Tripathi, M. K., and Bhagyawant, S. S. (2021). Antinutritional and protein based profiling of diverse desi and wild chickpea accessions. Cur. J. Appl. Sci. Technol. 40 (6), 7–18. doi:10.9734/cjast/2021/v40i631312
Henchion, M., Hayes, M., Mullen, A. M., Fenelon, M., and Tiwari, B. (2017). Future protein supply and demand: Strategies and factors influencing a sustainable equilibrium. Foods 6 (7), 53–21. doi:10.3390/foods6070053
Hewage, A., Olatunde, O. O., Nimalaratne, C., Malalgoda, M., Aluko, R. E., and Bandara, N. (2022). Novel Extraction technologies for developing plant protein ingredients with improved functionality. Trends Food Sci. Technol. 129, 492–511. doi:10.1016/j.tifs.2022.10.016
Higa, F. A., Boyd, L., Sopiwnyk, E., and Nickerson, M. T. (2022). Effect of particle size, flour:water ratio and type of pulse on the physicochemical and functional properties of wet protein extraction. Cereal Chem. 99 (5), 1049–1062. doi:10.1002/cche.10552
Jarpa-Parra, M., Bamdad, F., Wang, Y., Tian, Z., Temelli, F., Han, J., et al. (2014). Optimization of lentil protein extraction and the influence of process pH on protein structure and functionality. LWT–Food Sci. Technol. 57 (2), 461–469. doi:10.1016/j.lwt.2014.02.035
Joehnke, M. S., Jeske, S., Ispiryan, L., Zannini, E., Arendt, E. K., Bez, J., et al. (2021). Nutritional and anti-nutritional properties of lentil (Lens culinaris) protein isolates prepared by pilot-scale processing. Food Chem. 9 (30), 100112. doi:10.1016/j.fochx.2020.100112
Karaca, A. C., Low, N., and Nickerson, M. (2011). Emulsifying properties of chickpea, faba bean, lentil and pea proteins produced by isoelectric precipitation and salt extraction. Food Res. Int. 44 (9), 2742–2750. doi:10.1016/j.foodres.2011.06.012
Kaur, R., and Prasad, K. (2023). Process optimization for the development of traditionally roasted chickpea flour for meal replacement beverages. Food Chem. Adv. 3, 100452. doi:10.1016/j.focha.2023.100452
Kaur, M., and Singh, N. (2005). Studies on functional, thermal and pasting properties of flours from different chickpea (Cicer arietinum L.) cultivars. Food Chem. 91 (3), 403–411. doi:10.1016/j.foodchem.2004.06.015
Kaur, M., and Singh, N. (2007). Characterization of protein isolates from different Indian chickpea (Cicer arietinum L.) cultivars. Food Chem. 102 (1), 366–374. doi:10.1016/j.foodchem.2006.05.029
Lee, H. C., Htoon, A. K., Uthayakumaran, S., and Paterson, J. L. (2007). Chemical and functional quality of protein isolated from alkaline extraction of Australian lentil cultivars: Matilda and Digger. Food Chem. 102 (4), 1199–1207. doi:10.1016/j.foodchem.2006.07.008
Lima, R. R., Stephani, R., Perrone, Í. T., and de Carvalho, A. F. (2023). Plant-based proteins: a review of factors modifying the protein structure and affecting emulsifying properties. Food Chem. Adv. 3, 100397. doi:10.1016/j.focha.2023.100397
Lonnie, M., and Johnstone, A. M. (2020). The public health rationale for promoting plant protein as an important part of a sustainable and healthy diet. Nut. Bull. 45 (3), 281–293. doi:10.1111/nbu.12453
Ma, K. K., Greis, M., Lu, J., Nolden, A. A., McClements, D. J., and Kinchla, A. J. (2022). Functional performance of plant proteins. Foods 11 (4), 594. doi:10.3390/foods11040594
Meilgaard, M., Civille, G. V., and Carr, B. T. (2006). Sensory evaluation techniques. 4. Boca Raton: CRC Press, 448.
Merga, B., and Haji, J. (2019). Economic importance of chickpea: production, value, and world trade. Cogent Food Agr 5 (1), 1615718. doi:10.1080/23311932.2019.1615718
Özdemir, E. E., Görgüç, A., Gençdağ, E., and Yılmaz, F. M. (2022). Physicochemical, functional and emulsifying properties of plant protein powder from industrial sesame processing waste as affected by spray and freeze drying. LWT–Food Sci. Technol. 154, 112646. doi:10.1016/j.lwt.2021.112646
Papalamprou, E. M., Doxastakis, G. I., Biliaderis, C. G., and Kiosseoglou, V. (2009). Influence of preparation methods on physicochemical and gelation properties of chickpea protein isolates. Food Hydr. 23 (2), 337–343. doi:10.1016/j.foodhyd.2008.03.006
Papalamprou, E. M., Doxastakis, G. I., and Kiosseoglou, V. (2010). Chickpea protein isolates obtained by wet extraction as emulsifying agents. J. Sci. Food Agr. 90 (2), 304–313. doi:10.1002/jsfa.3816
Perović, M. N., Pajin, B. S., and Antov, M. G. (2022). The effect of enzymatic pretreatment of chickpea on functional properties and antioxidant activity of alkaline protein isolate. Food Chem. 374, 131809. doi:10.1016/j.foodchem.2021.131809
Peyrano, F., Speroni, F., and Avanza, M. V. (2016). Physicochemical and functional properties of cowpea protein isolates treated with temperature or high hydrostatic pressure. Inn. Food Sci. Emerg. Technol. 33, 38–46. doi:10.1016/j.ifset.2015.10.014
Rao, B., Anis, M., Kalpana, K., Sunooj, K. V., Patil, J. V., and Ganesh, T. (2016). Influence of milling methods and particle size on hydration properties of sorghum flour and quality of sorghum biscuits. LWT–Food Sci. Technol. 67, 8–13. doi:10.1016/j.lwt.2015.11.033
Rezvankhah, A., Yarmand, M. S., Ghanbarzadeh, B., and Mirzaee, H. (2021). Characterization of bioactive peptides produced from green lentil (Lens culinaris) seed protein concentrate using Alcalase and Flavourzyme in single and sequential hydrolysis. J. Food Process. Preserv. 45 (11). doi:10.1111/jfpp.15932
Ruckmangathan, S., Ganapathyswamy, H., Sundararajan, A., Thiyagamoorthy, U., Green, R., and Subramani, T. (2022). Physico-chemical, structural, and functional properties of protein concentrate from selected pulses: a comparative study. J. Food Process. Preserv. 46, e17169. doi:10.1111/jfpp.17169
Sánchez-Vioque, R., Clemente, A., Vioque, J., Bautista, J., and Millaâ N, F. (1999). Protein isolates from chickpea (Cicer arietinum L.): chemical composition, functional properties and protein characterization. Food Chem. 64, 237–243. doi:10.1016/s0308-8146(98)00133-2
Sanjeewa, W. G., Wanasundara, J. P. D., Pietrasik, Z., and Shand, P. J. (2010). Characterization of chickpea (Cicer arietinum L.) flours and application in low-fat pork bologna as a model system. Food Res. Int. 43 (2), 617–626. doi:10.1016/j.foodres.2009.07.024
Shen, Y., Tang, X., and Li, Y. (2021). Drying methods affect physicochemical and functional properties of quinoa protein isolate. Food Chem. 339, 127823. doi:10.1016/j.foodchem.2020.127823
Silva, C. M., Felberg, I., Lima, J. R., Gouvêa, L., Galdeano, M. C., Caldeira, R. F., et al. (2022). “Guide for Technological-functional characterization of protein ingredients for the plant-based market,”, 146. Rio de Janeiro, 27p.Embrapa Food Technol. Available online at: https://ainfo.cnptia.embrapa.br/digital/bitstream/doc/1150307/1/CP-06-22-DOC-146-pronto.pdf.
Sofi, S. A., Singh, J., Muzaffar, K., Majid, D., and Dar, B. N. (2020). Physicochemical characteristics of protein isolates from native and germinated chickpea cultivars and their noodle quality. Int. J. Gastr. Food Sci. 22, 100258. doi:10.1016/j.ijgfs.2020.100258
Soto-Madrid, D., Pérez, N., Gutiérrez-Cutiño, M., Matiacevich, S., and Zúñiga, R. N. (2023). Structural and physicochemical characterization of extracted proteins fractions from chickpea (Cicer arietinum L.) as a potential food ingredient to replace ovalbumin in foams and emulsions. Polymers 15, 110. doi:10.3390/polym15010110
Stone, A. K., Nosworthy, M. G., Chiremba, C., House, J. D., and Nickerson, M. T. (2019). A comparative study of the functionality and protein quality of a variety of legume and cereal flours. Cereal Chem. 96 (6), 1159–1169. doi:10.1002/cche.10226
Tang, X., Shen, Y., Zhang, Y., Schilling, M. W., and Li, Y. (2021). Parallel comparison of functional and physicochemical properties of common pulse proteins. LWT–Food Sci. Technol. 146, 111594. doi:10.1016/j.lwt.2021.111594
Toews, R., and Wang, N. (2013). Physicochemical and functional properties of protein concentrates from pulses. Food Res. Int. 52 (2), 445–451. doi:10.1016/j.foodres.2012.12.009
Tontul, İ., Kasimoglu, Z., Asik, S., Atbakan, T., and Topuz, A. (2018). Functional properties of chickpea protein isolates dried by refractance window drying. Int. J. Bio. Macromol. 109, 1253–1259. doi:10.1016/j.ijbiomac.2017.11.135
Keywords: pulse protein, plant protein, protein extraction, protein characterization, food ingredient, sensory analysis
Citation: Caldeira RF, de Paiva Gouvêa L, Azevedo TdL, Wilhelm AE, Freitas de Sá DdGC, Galdeano MC, Felberg I, Antoniassi R, Mellinger CG and Lima JR (2025) Chickpea processing to obtain a protein ingredient for the plant-based market. Front. Food Sci. Technol. 5:1547684. doi: 10.3389/frfst.2025.1547684
Received: 18 December 2024; Accepted: 05 August 2025;
Published: 29 August 2025.
Edited by:
Sze Ying Leong, University of Otago, New ZealandReviewed by:
Ahmed A. Zaky, National Research Centre, EgyptDiego Fernando Roa-Acosta, University of Cauca, Colombia
Eng-Tong Phuah, Taylor’s University, Malaysia
Copyright © 2025 Caldeira, de Paiva Gouvêa, Azevedo, Wilhelm, Freitas de Sá, Galdeano, Felberg, Antoniassi, Mellinger and Lima. This is an open-access article distributed under the terms of the Creative Commons Attribution License (CC BY). The use, distribution or reproduction in other forums is permitted, provided the original author(s) and the copyright owner(s) are credited and that the original publication in this journal is cited, in accordance with accepted academic practice. No use, distribution or reproduction is permitted which does not comply with these terms.
*Correspondence: Janice Ribeiro Lima, amFuaWNlLmxpbWFAZW1icmFwYS5icg==