 Tapiwa Reward Sithole
 Yu-Xiang Ma
 Zhao Qin
 Xue-De Wang
 Hua-Min Liu
- College of Food Science and Engineering and Institute of Special Oilseed Processing and Technology, Henan University of Technology, Zhengzhou, China
Introduction: In light of lifestyle changes and rising health concerns, there is a growing emphasis on reevaluating food processing and preparation techniques to enhance nutritional quality and safety, prioritizing simplicity and minimal processing.
Method: This research evaluated the impact of two thermal processing techniques, boiling and roasting, on peanut butter’s macronutrient composition, color, texture, structure, and volatile component profile. Three samples of peanut butter were prepared: the first from peanuts that were boiled, dried, and ground to a paste (BPS1, 99 °C for 75 min, 1:3 v/v peanut to water ratio); the second from raw blanched peanuts (RPS2); and the third from conventional dry oven roasted peanuts (CPS3, 147 °C for 45 min).
Results: Proximate analysis indicated no significant differences (p > 0.05) in the nutritional composition among the three samples (BPS1, RPS2, and CPS3), except for specific amino acid variations. Significant differences were noted in peroxide and acid values, color, particle size, texture, structure, and volatile compound composition (p < 0.05). The composition of volatile components varied significantly; BPS1 exhibited a predominance of methyl ester variants (17.6%), RPS2 showed the highest concentration of 1-hexanol (22.2%), and CPS3 was characterized by a dominance of pyrazines, particularly 2,5-dimethyl pyrazine (15.6%).
Discussions: The observed differences in volatile composition and minor variations in amino acids indicate distinct reaction pathways for roasting, specifically, Maillard reactions. At the same time, flavor development in boiled peanuts may involve a mechanism that has yet to be fully understood. The cooking method did not significantly change the macronutrient composition; however, the observed structural and textural changes may indicate notable differences in subsequent processing, digestibility, and nutrient bioavailability in the digested chyme. This highlights the importance of specific processing and food preparation protocols on food’s nutritional quality and safety characteristics.
1 Introduction
Peanut butter, a colloidal dispersion of protein and carbohydrates in peanut oil, is increasingly gaining global popularity as a highly affordable, nutritious, and functional food product (Bonku and Yu, 2020; Golani et al., 2024; Amba et al., 2019). It is finding extensive use among individuals seeking high-quality sources of protein and fats, such as those following fitness and bodybuilding routines, vegan and keto diets, and as a highly convenient, ready-to-use therapeutic food aid package (RUTF) for managing malnutrition and kwashiorkor in children suffering from hunger and starvation in poverty-stricken and conflict-ridden areas (Arya et al., 2016). However, the escalating demand for enhanced nutritional and food quality standards, coupled with increased awareness of the impacts of food processing and preparation on dietary outcomes and the potential formation of toxic compounds, has necessitated a reevaluation of various food processing and preparation protocols.
The standard conventional process for peanut butter production includes dehulling dried peanuts, followed by dry oven roasting and grinding to achieve a uniform creamy paste.
Sanders et al. (2014) Dry air oven roasting is almost invariably employed in peanut butter production because it confers to the peanut butter those defining characteristic properties of color, texture, and flavor, which are the key properties that determine consumer acceptability (Shakerardekani et al., 2013; Lykomitros, Fogliano, and Capuano, 2016b; Yang K. M et al., 2022; García et al., 2021). However, several recent reports suggest that consuming boiled peanuts might have more nutritional and health benefits than roasted peanuts (Guo et al., 2020). The concerns with roasted peanuts center around the aspect of increased allergenicity (Beyer et al., 2001; Maleki et al., 2014; Zhang et al., 2018; Chung et al., 2003; Cohen et al., 2024), potential of a loss of vital phytochemicals through phytosterol oxidation (Chukwumah et al., 2007; Acar et al., 2009; Guo et al., 2020) and the potential generation of deleterious compounds (advanced glycation end products (AGEs), heterocyclic amins (HAs), hydroxymethylfurfural (HMF), and acrylamide) linked to the initiation and progression of numerous chronic illnesses like cancers, diabetes, cardiovascular diseases, neurodegenerative diseases, and renal diseases (Uribarri et al., 2010; Wei et al., 2018; Guo et al., 2020; Yu et al., 2023). Nonetheless, the impact of boiling on the intricate equilibrium of peanut butter’s critical physicochemical attributes (nutritional value, texture, rheology, color, and flavor), which consumers have come to appreciate, remains largely unknown.
The heat treatment processes of roasting and boiling induce notable and, in some cases, uniquely distinct modifications in the spatial configuration and interactions of nutrient and chemical components in food matrices, thus resulting in different physical and chemical properties. Depending on the degree and duration of the heat treatment, water activity, pH, salt content, and other active ingredients, the protein components, for example, may be denatured, resulting in more compact structures (polymerization), hydrophilic groups may become encapsulated, decreasing their water solubility and susceptibility to enzymatic degradation (Liu S et al., 2022). Further, again, to varying degrees, depending on the heat treatment method, there is a possibility of protein inactivation, change in flocculation and precipitation in water, and diminished nutritional potency (Liu Y et al., 2022). In the case of peanuts, dry oven roasting at times results in the destruction of quaternary structures of cupins and the breakdown of disulfide bonds in albumins, and even secondary structures may be severely disrupted, resulting in a fully unfolded conformation and possibly depolymerization (Vissers et al., 2011). With heat treatment, the α-helical structures of peanut protein would transform to antiparallel β-sheets or form random coils (Bonku and Yu, 2020). Such heat-induced changes in protein conformation significantly impact allergenicity, nutritional value, and functional properties (Liu Y et al., 2022). Again, heat treatment under varying moisture content levels can affect the degree of gelatinization, crystallinity, amylose, and amylopectin degradation of the starch component (Wang et al., 2022; Altay and Gunasekaran, 2006). Invariably, changes in physicochemical properties will likely differ under varying hydration conditions, such as between boiling and dry roasting.
The physicochemical properties of peanut butter (particle size, texture, structure, nutrient and chemical composition, and organoleptic properties) to variable extents affect the technical and economic aspects of peanut butter production, the resultant nutritional and health benefits, and overall product acceptability (Alpaslan and Hayta, 2002; Shakerardekani et al., 2013). For the more significant part, these physicochemical properties are a function of both the inherent qualities of the peanuts used and the processing they undergo, most notably the heat treatment and grinding steps (Kita and Figiel, 2007; Shakerardekani et al., 2013; Zhang et al., 2019; Fennema, 1985; Igual and Martínez-Monzó, 2022). In the food industry, the viscosity and texture of the food matrix are some of the most important technical parameters with significant economic implications in designing its production and processing equipment (Shakerardekani et al., 2013; Alpaslan and Hayta, 2002). It influences the size and type of pumping required, the size and type of heating and heat exchange equipment needed, and the overall power requirements (Shakerardekani et al., 2013).
On the other hand, viscosity and texture determine a food system’s overall quality and stability. Further, peanut butter’s viscosity and flow behavior are intricately associated with texture as it relates to its spreadability on other materials and its mouthfeel (sticky, gummy) characteristics (Alpaslan and Hayta, 2002). Understanding the microstructure and particle interactions, for example, as determined by the mechanical measurement of texture in conjunction with optical images obtained by Confocal laser scanning microscopy (CLSM), might be crucial in defining some of these critical peanut butter sensory properties like spreadability, hardness, gumminess and overall peanut butter stability (Shi et al., 2018; Zhang et al., 2019). Organoleptic properties such as flavor, color, appearance, taste, and aroma are critical qualities of peanut butter that depend on heat treatment and significantly influence consumer acceptance (Sanders et al., 2014; García et al., 2021; Liu S et al., 2022; Ding et al., 2023). Little is known about the mechanism and development of color and flavor in boiled peanuts. On the other hand, the Maillard reaction, caramelization, fatty acid autoxidation, lipid degradation, and the breakdown of sulfur-containing amino acids, which produce the color and desirable flavor compounds in roasted peanuts, have all been extensively studied (García et al., 2021; Hu et al., 2021; Liu Y et al., 2022; Lykomitros Dimitrios et al., 2016; Zhang et al., 2024). However, most of these findings have been for peanuts and peanut oil, and it is yet to be established whether these same flavor compounds are present or not, or if present, their relative quantities and amounts in peanut butter, which has a different matrix altogether, let alone in butter made from boiled peanuts. The volatile profile, organoleptic properties, textural, rheology, oxidation stability, oil leakage, and consumer acceptance of peanut butter prepared from boiled peanuts are barely known.
This study aimed to develop a peanut butter paste from boiled and subsequently dried peanut seeds and evaluate its physicochemical properties compared to conventional peanut butter made from dry oven-roasted peanuts to make inferences about consumer acceptance and technological production implications of adopting this method. Moreover, investigations into the chemical and physical transformations that take place during the roasting, boiling, and drying of peanuts, along with the ensuing physicochemical properties of the resulting peanut butter, could enhance the comprehension and scope of current knowledge regarding the use of peanuts as a healthy and nutritious food ingredient.
2 Materials and methods
2.1 Materials
Dried, sound, and mature seeds of peanuts (Arachis hypogaea L.) runner type (2023 crop) were purchased from a Qingdao City, Shandong, China market.
2.2 Sample preparation
Three sets of 1.5 kg samples of mature and sound peanut seed were randomly sampled and randomly assigned to the following treatment: boiling, raw/no treatment, and roasting, and given sample identities BPS1, RPS2, and CPS3, respectively. BPS1 (boiled) peanut butter was prepared by cooking 1.5 kg of peanut seeds in an electric nonstick ceramic pot (Lejiaqi Co. Ltd., Guangzhou, China) with an initial peanut-to-water ratio of 1:3 v/v and heated at a constant temperature of 99 °C for 75min then dried in an oven (DHG-9140A, Shanghai, China) maintained at 45 °C for 32 h. After drying, the peanut testa were removed by hand and the peanuts were and ground using a colloid mill (JM-L80; Dongchen Fluid Equipment Co. Ltd., Zhengzhou, China) to make consistent peanut paste. RPS2 (raw/no treatment) was prepared by manually cold-water blanching 1.5 kg of peanut seeds and oven drying (DHG-9140A, Shanghai, China) at 45 °C for 32 h. After drying the peanuts, they were ground using a colloid mill (JM-L80; Dongchen Fluid Equipment Co. Ltd.). CPS3 (roasted) peanut butter sample was prepared by roasting 1.5 kg peanut seeds in a dry rotary oven (ENG002, Weihai, China) at 165 °C for 47 m to attain a medium roast color of about Hunter color Lightness (L) value of 57. After roasting, the peanuts were rapidly cooled to room temperature by a suction fan to prevent further cooking and moisture loss. The next step involved removing the peanut testa by hand to achieve consistent colour. Grinding was then done using a colloid mill (JM-L80; Dongchen Fluid Equipment Co. Ltd., Zhengzhou, China). For all three samples, grinding was done in a single pass open circuit at 1550rpm, gape size of 0.3 mm, and pressure of 0.6 MPa. Upon completion of the grinding process, BPS1, RPS2, and CPS3 were cooled and stored in airtight sealed 1000 mL glass jars at 4 °C for future use.
2.3 Peanut paste proximate analysis and oil quality evaluation
Proximate analysis of BPS1, RPS2, and CPS3 was done following AOAC standard guidelines. Moisture content was determined by oven-drying at 105 °C to constant weight according to AOAC Method, 925.40, Ash content by combustion of the sample in a muffle furnace at 550 C for 4 hours (AOAC Method, 950.49), total oil content by the Soxhlet extraction method (AOAC Method, 995.19), and protein content by the Kjeldahl method (AOCS Method Ac 4–91) and a factor of 5.3 was used to multiply the nitrogen values to obtain protein content estimates. All experiments were performed in triplicate, and the standard deviation for each determination was calculated and reported. Standards (AOCS Method Cd 3d-63) and (AOCS Method Cd8-53) were used to determine the Acid and Peroxide values of the oils in the peanut butter samples, respectively.
2.4 Monosaccharide, fatty acids, and amino acid composition determination
Soxhlet extraction was used to obtain peanut oil and defatted peanut cakes for the three peanut butter samples in accordance with a method used by Wang B et al. (2024) with minor modifications. Briefly, double filter paper packs containing about 5 g each of peanut butter were put in a Soxhlet extraction equipment and extracted for 12 h by petroleum ether. The thermostatic water bath pot (HH-S8, Kewei Co. China) was maintained at 48 °C; thereafter, crude oil was then obtained by evaporating the organic solvents under low pressure using a rotary evaporator (RV 10, IKA) maintained at 45 °C. The defatted peanut cake remaining in the double filter paper packs was then stored in sealed plastic bags at 4 °C for further analysis.
High-performance anion-exchange chromatography (HPAEC) was used to determine the monosaccharide composition of the defatted peanut butter samples using an apparatus equipped with an AS50 auto-sampler and an ICS5000 system (Thermo Fisher Scientific, USA). According to the procedure used by Guo et al. (2023). 5 mg of each sample was hydrolyzed with 0.125 mL of 72% H2SO4 at room temperature for 45 min, thereafter, 1.35 mL of deionized water was added to the hydrolysate and continuously heated at 105 °C for 2.5 h. Subsequently, the hydrolysates were filtered through a 0.22 µm nylon filter and then injected into the HPAEC system for analysis.
Agilent 7890B gas chromatograph (GC) machine equipped with a flame ionization detector was used to analyze the fatty acid composition of the oil components of the peanut butter samples in a method similar to Xu et al. (2023). Firstly, methylation was conducted using boron trifluoride. Thereafter, the supernatant layer of the solution was separated and loaded into a gas chromatograph (GC, Agilent 7890B, America) coupled with an HP-88 column (100 m × 0.25 mm × 0.2 μm). The FID detector and injection port temperature were set and maintained at 240 °C and 280 °C, respectively. The GC oven temperature was ramped at 4 °C/min from 140 °C to 240 °C. Internal standards were used to quantify the amount of each fatty acid present using their respective retention times. Each fatty acid’s relative concentration (g/100 g) was determined by employing peak area normalization.
Peanut amino acids of the three samples were analyzed using a previous method with minor modifications (Guo et al., 2023). In brief, 30 mg of each of the defatted peanut samples was hydrolyzed with 10 mL of 6 mol/L HCl, after which three drops of phenol were added to each of the samples. Nitrogen was then blown over the hydrolyzed samples for 2 min, there after all the samples were put in an oven at 110 °C for 22 h. The hydrolysates were filtered and diluted with deionized water in a 50 mL volumetric flask. Then, 1 mL of each solution was concentrated and evaporated to dryness, and this step was repeated thrice. Subsequently, the dried samples were dissolved in 1 mL of citric acid solution (pH 2.2) and then filtered through a 0.22 μm PES membrane (Merck, Darmstadt, Germany). An S433D Automatic Amino Acid Analyzer (Syknm, Germany) was then used to dictate the concentration of the amino acids as w/w %
2.5 Color measurement
The surface color of peanut butter samples was measured using a handheld Minolta CR-400 colorimeter (Konica Minolta Sensing, Inc., Osaka, Japan) and expressed as L*, a*, and b* values. Instrument calibration was done using the white color tiles supplied with the instrument. The L* value indicates color lightness, with a higher number indicating lighter color; a* value gives the span of red-green color, with a higher positive a* value signifying redder; the b* value indicates the extent of yellow-blue color, with a higher positive b* representing more yellow.
2.6 Fourier-transform infrared spectroscopy (FT-IR)
In a method similar to the one used by Wang S et al. (2024), FT-IR spectra of defatted BPS1, RPS2, and CPS3 were recorded using an IR spectrometer (Perkin Elmer Frontier, USA). 3 mg of the defatted samples were finely ground with 300 mg KBr and then pressed into a pellet. The pellet was scanned in a frequency range of 4,000 to 400 cm−1 using a resolution of 4 cm−1 to obtain the respective spectra.
2.7 Particle size distribution
Following the procedure by (Wang B et al., 2024) with minor modifications, the particle size distribution of peanut butter was analyzed using a laser diffractometer (Malvern Instruments Ltd., Malvern, United Kingdom. The wet analysis technique was used with a 5%–15% shading ratio. The sample was dispersed uniformly in deionized water by stirring to reach 80% light transmission, after which a computer analyzed the results automatically. The volume diameters D10, D50, and D90 were determined at a cumulative volume of 10%, 50%, and 90%, respectively.
2.8 Microstructure determination by scanning electron microscopy (SEM)
Changes in granule morphology of the peanut butter samples were observed using SEM (S4800, Hitachi, Japan). In brief, peanut paste samples were transferred to the SEM specimen chamber (Hitach S-570, 228 Tokyo, Japan) after being fixed on a pin stub using carbon tape and sputter coated with approximately 20 nm of gold-palladium. The accelerating voltage was set at 3.0 kV. Specimens were examined under vacuum, and digital pictures were taken (Quartz PCI Imaging Software, Version 8, 230 Quartz Imaging Corp., Vancouver, BC). Every sample was photographed and scanned at a magnification of 3,000x and 1,500x.
2.9 Microstructure determination by Confocal laser scanning microscopy (CLSM)
Following the method by Jin et al. (2022), the three peanut butter paste samples (BPS1, RPS2, and CPS3) were observed with an inverted Confocal laser scanning microscopy (CLSM) (LSM710 Carl Zeiss AG, Germany). 1 g of paste was stained with 20 μL of FITC and 20 μL of Nile red for labeling proteins (green fluorescence) and lipids (red fluorescence), respectively.
2.10 Oil leakage test
Oil leakage was determined using the method used by Zhang et al. (2019) with some minor modifications. Briefly, (30 g) of peanut butter was measured into a 50-mL centrifuge tube, warmed in a water bath maintained at 45 °C for 20 min, and then allowed to cool down to 25 °C under running tap water for 15 min. The peanut butter samples were centrifuged at 4,000 g for 40 min at 25 °C. After centrifuging, the separated oil was removed with a pipette, and oil leakage was calculated using the formula shown in Equation 1
2.11 Texture
The hardness, adhesiveness, gumminess, and chewiness of the peanut butter samples were analyzed according to the method by Wang S et al. (2024) using a TA-XT Plus texture analyzer (Stable Micro System, England). During the test, a cylindrical perspex probe with a diameter of 25 mm was used with a trigger force of 5 g; the velocity of the cylindrical probe was constant at 1.00 mm/s, and the single compression distance was 10 mm.
2.12 Extraction and analysis of volatile compounds
Volatile compounds in peanut pastes were extracted by the headspace solid-phase microextraction (HS-SPME) and analyzed by and analyzed by Gas Chromatography-Mass Spectroscopy (GC-MS) using a method optimized previously in our laboratory by (Yin et al., 2022). Briefly, 3 g peanut paste was mixed with 24 μL of 4-nonanol (0.8 μg/μL) (internal standard) in a 20 mL vial with a Teflon-septum cover. A fiber (2cm, 50/30 μm) coated with divinylbenzene/carboxy-en/polydimethylsiloxane (SPX Corporation, USA) was used. The sample incubation was done at 60 °C for 20 min with moderate mixing of 100 rpm. Finally, the loaded fiber was extracted for 50 min in the sample headspace before being put into GC at 250 °C for 5 min of desorption.
The volatile compounds in peanut batter samples were detected using a 7890B GC-MS using an Agilent electron ionization mass spectrometer and an ODP-3 olfactometry (Gerstel Inc., USA). Volatile chemicals were separated using HP-5MS (30 m × 0.25 mm × 0.25 μm) and VF-WAXMS (30 m × 0.25 mm × 0.25 μm) capillary columns. The carrier gas was high-purity helium (≥99.999%, flow rate of 1.8 mL min-1). The GC oven temperature was set to 40 °C for 3.5 min, then increased to 230 °C at 4 °C/min for 8 min. The temperatures for the injection port, ion source, interface, and quadrupole were 250 °C, 230 °C, 280 °C, and 150 °C, respectively. The volatile chemicals were identified by matching their mass spectra to the NIST 17 library. The n-alkanes (C7-C30) were used to derive linear retention indices (RIs) of volatile chemicals.
2.13 Statistical analysis
All analyses were performed in triplicates reported as mean values (± standard deviation). Data from all three batches was averaged and reported as final mean values (± standard deviation). One-way ANOVA and separation of means were analyzed using Tukey’s honestly significant differences test (p < 0.05) using Origin Software (OriginLab Cooperation, USA).
3 Results and discussion
3.1 Proximate analysis of peanut pastes produced from boiled, raw, and roasted peanuts
The proximate analysis results obtained for all three peanut butter samples in Table 1, all fall within the ranges of peanut nutrient constituents recently reported by others: protein 20.7%–25.3%, crude fat 31%–46%, ash 1.2%–2.3%, (Bonku and Yu, 2020). With the moisture content having been controlled during the drying stages of this experiment to be within a comparable range (0.2%–1.2%), the protein, oil content, and ash content of the three samples BPS1 (boiled), RPS2 (raw) and CPS3 (roasted) did not show any appreciable differences (p > 0.05) except for the ash content in the roasted sample CPS3. This could be explained by the fact that roasting and boiling processes would not ordinarily result in a net loss of matter. Similar findings have been reported by other researchers, such as Zhou et al. (2021), who noted structural changes in the proteins with roasting but did not observe any significant changes in the total protein content. For the first part, protein content during proximate analysis is determined based on nitrogen content; hence, since both processes do not result in volatilization of the nitrogen in the protein bodies, no significant changes in protein content would be expected; furthermore, the temperatures employed for both boiling (99 °C) and (160 °C) for roasting do not appear to be sufficient for pyrolysis or cracking of the peanut oil. Hence, it is expected that the proximate analysis results of the three samples (boiled, raw, and roasted) would be comparable. From these results boiling or roasting, did not result in net loss of nutrients or compositional change, however, the proximate analysis does not show the state and nature of the protein and fats in these respective samples and does not provide information on their respective digestibility and bioavailability of which such parameters are key in nutrient utilization by the body.
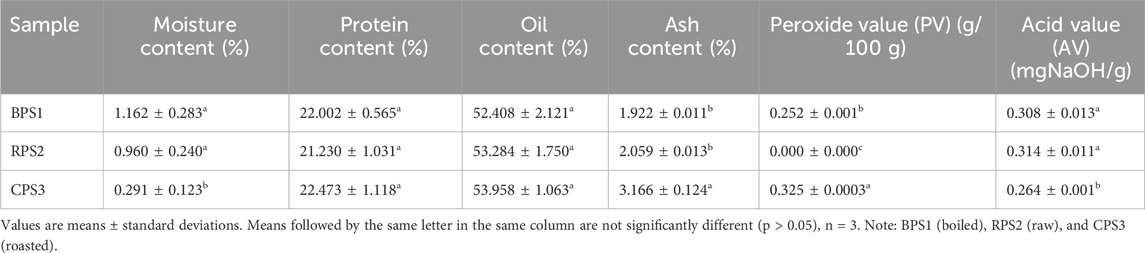
Table 1. Proximate, peroxide and acidic values analysis of peanut pastes.
The onset of deterioration of peanut butter during processing or storage may be determined by the concentration of peroxide and hydroperoxide formed during the early phases of lipid oxidation. It can be measured by Peroxide Value (PV) (Shi et al., 2017). The results show that PV was higher in the roasted sample (0.325 g/100 g) after preparation compared to the boiled sample (0.252 g/100 g) and the raw sample. In the raw sample, an undetectable concentration of peroxide and hydroperoxide proved the importance of temperature in catalyzing the oxidation process. Studies on the dry roasting of peanuts have shown that PV increases with the roasting temperature, reaching a peak at approximately 160 °C and then decreasing with further temperature increases to 180 °C (Suri et al., 2019). Hydro-peroxide formation due to the free radical attack on unsaturated fatty acids may result in the initial rise in PV. Afterward, because these peroxides are unstable, their concentration falls at higher roasting temperatures (Suri et al., 2019).
On the other hand, acid value (AV) is an oil quality indicator for the degradation of oil that measures the free fatty acids formed via the hydrolysis of triacylglycerols (Sakaino et al., 2022). However, recent studies have shown that oxidation of triacylglycerols can also possibly result in the formation of carboxylic acids with a glycerol backbone, which is also calculated as AV (Sakaino et al., 2022). The initial acid value of the boiled sample was higher than that of the roasted sample Table 1. Higher moisture levels during boiling could have contributed to the increase in the boiled sample’s acid value compared to the roasted sample. During the hydrolysis of fat in complex food matrices like peanut butter, water acts as a diffusion process controller and promotes solute dissolution (Adawiyah et al., 2012; Sruthi et al., 2021). In addition, water also acts as the reactant and co-substrate in this process (Adawiyah et al., 2012).
3.2 Monosaccharide composition
The most abundant monosaccharide in peanut seed was glucose (>1,000 μg/g), followed by arabinose and galactose, while fructose was the least (<10 μg/g), Table 2. No significant difference (p > 0.05) in the total and individual monosaccharide content of the boiled, raw, and roasted peanut paste samples was observed, except for mannose, which was slightly lower in the roasted sample Table 2. While it has been a firmly established concept that the brown color in roasted peanuts is a result of the Millard reaction involving amino acids and reducing sugars (Chung and Champagne, 1999), an investigation into the role of mannose in the Millard reactions of peanut seeds during roasting, given the observed decrease, might be worth considering. McDaniel (McDaniel et al., 2012) reported that the concentration of glucose and fructose increases with light roasting; however, as roasting time increases, it decreases due to the complexity of competing reaction that happens during roasting. However, our present results make it difficult to ascertain or draw conclusions on the extent and level of participation of the other monosaccharides in the peanut Maillard reactions.
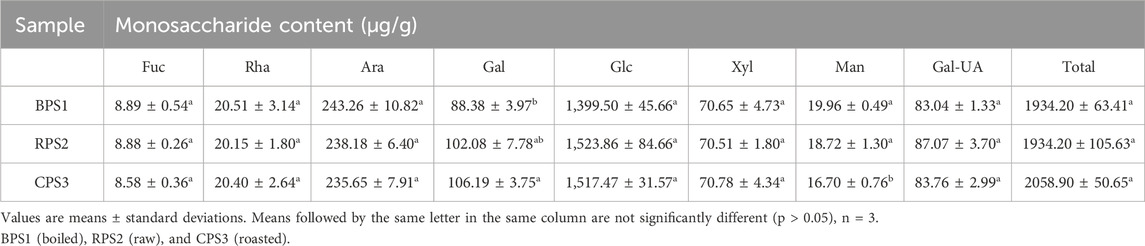
Table 2. Peanut paste monosaccharide content.
3.3 Fatty acid composition
According to the results in Table 3, palmitic, oleic, and linoleic constitute 90% of the peanut oil and the other fatty acids were only in trace amounts which is in agreement with some previous researches specifying average ranges of peanut oil fatty acid compositions C16:0 = 9.3–13.0%, C18:0 = 1.1–3.6%, C18:1 = 35.6–58.3%, C18:2 = 20.9–43.2%, C20:0 = 0.3–2.4%, C20:1 = 0.7–3.2%, C22:0 = 1.8–4.4%, and C24:0 = 0.4–1.9% (Yang Y et al., 2022; Carrín and Carelli, 2010). There was no significant difference in the fatty acid composition of the three treated samples, except for eicosenoic acid, of which the overall effect of that difference could be negligible given that it only exists in trace amounts. The ratio of oleic/linoleic and that of unsaturated/unsaturated were also not significantly different between the three samples, suggesting that the thermal treatment processes did not result in a substantial change in the fatty acid composition of peanut oil. While not usually reported by other researchers undertaking studies on the composition of peanut oil, of interest in our results was the presence of dihomo-γ-linolenic fatty acids, a 20-carbon, long-chain, polyunsaturated fatty acid (LC-PUFA) that can also be derived from linoleic acid (LA). However, this finding is not unique because its presence has been widely reported in other oil seeds such as borage Borago officinalis oil, blackcurrant Ribes nigrum oil, and evening primrose Oenothera biennis oil (Mustonen and Nieminen, 2023; Fan and Chapkin, 1998). It is worth noting that its presence in this particular case in peanut oil is of interest in that there are still considerable disagreements on the roles and biological functions of dihomo-γ-linolenic fatty acids, as an anti-inflammatory fatty acid or as a precursor to arachidonic acid (ARA), which is pro-inflammatory (Mustonen and Nieminen, 2023; Sergeant et al., 2016; Wang et al., 2012), its role in triggering apoptosis-induced neurodegeneration via its metabolites that are downstream of cytochrome P450-epoxide hydrolase (CYP-EH) (Sarparast et al., 2023), while on the other hand, it is generally believed to provide potential treatment for inflammatory conditions such as psoriasis, asthma, atopic eczema, and arthritis, as well as for atherosclerosis, and arthritis as well as suppressing the growth of cancer and strengthening the immune system (Fan and Chapkin, 1998; Mustonen and Nieminen, 2023; Abu-Ghosh et al., 2021; Yokoi et al., 2023).
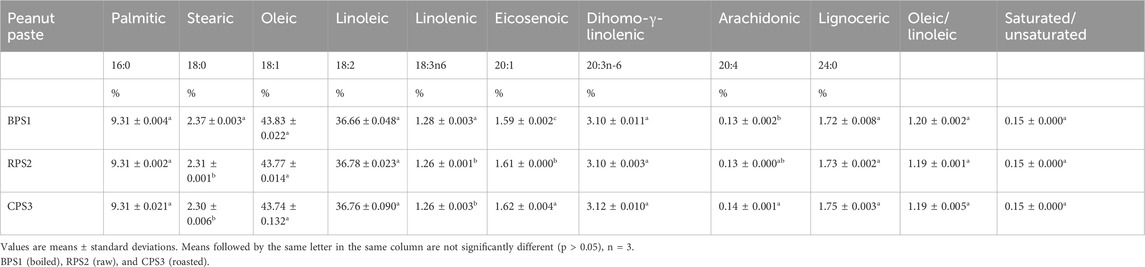
Table 3. Peanut oil fatty acid composition.
3.4 Amino acid composition
When subjected to high-temperature processing (above 125 °C), food matrices containing reducing sugars and organonitrogen compounds (proteins, peptides, and free amino acids undergo a series of complex and varied chemical reactions like the Millard and caramelization reactions which result in changes in food color and flavor, with an expected corresponding decrease in amino acid content (Liu S et al., 2022; Hemmler et al., 2018). The progression of reactions along these varied and complex physicochemical reaction pathways depends on the properties of the amino acids and sugar precursors present, pH, the water activity, and the temperature of the processing environment (Hemmler et al., 2018; Liu Y et al., 2022). Notable color and flavor changes for boiled and roasted peanuts were observed in this study, Table 4 and Figure 1. However, to a significantly varying degree, possibly due to different Millard reaction pathways in these processes. The results in Table 4 show that, in general, the total amino acid content of the defatted roasted (CPS3) and boiled (BPS1) samples decreased overall by 30% and 40%, respectively, in comparison to the raw defatted paste (RPS2). For the roasted sample (CPS3), the most significant decrease in specific amino acids was in Valine > Histidine > Lysine > Alanine, while for boiled (BPS1), the most significant decrease was observed for Methionine > Tyrosine > Phenylalanine > Leucine. On the other hand, for both samples, roasted and boiled, Cysteine appears to have increased from 0.05% to 0.08%. (Sun et al., 2024). observed that in roasted peanut oil, Phenylalanine, Lysine, Glutamic acid, Arginine, and Isoleucine had significant associations with both pyrazine and nut flavors. (Hemmler et al., 2018). concluded that the order of Maillard reaction products (MRPs) produced after 10 hours of reacting ribose with four amino acids (Lysine, Cysteine, Isoleucine, and Glycine) was Lysine > Cysteine > Isoleucine ≈ Glycine. Both results confirm our finding that Lysine could be a critical precursor in peanut Millard reactions. The differences in the results further suggest the complexity and variability of Millard reactions under different reaction conditions. Further, the apparent differences might be because the assessment by Hemmler et al. (2018) was primarily focused on the number (numerical count) of possible Millard reaction products formed from these four (lysine, cysteine, isoleucine and glycine) amino acid precursors thus differing fundamentally in scope from our attempt to quantify the changes in the native amino acid content of defatted peanut cakes produced from peanuts subjected to different processing condition (boiling and roasting). In our results in Table 4, the three branched-chain essential amino acids Valine, Isoleucine, and Leucine (Simon, 2019) were observed to have a comparatively higher concentration in the raw RPS2 in comparison to both boiled BPS1 and roasted CPS3. Apart from the Millard reactions, thermal treatment of protein-containing systems can result in post-translational modification of reactive amino acid side chains, which do not involve reducing sugars, resulting in variations in the composition of amino acids (Kutzli et al., 2021). This effect is more pronounced with dry heating conditions, such as the case when peanuts are roasted, which may cause proteins to crosslink by forming sugar-free amino acid crosslinks like isopeptides and dehydroalanine adducts (Kutzli et al., 2021). Isopeptide bonds may be formed between the ε-amino groups of lysine residues and the γ- or β-carboxamide groups of the glutamine or asparagine residues (Kutzli et al., 2021). The same may not be authoritatively confirmed for boiled peanuts.
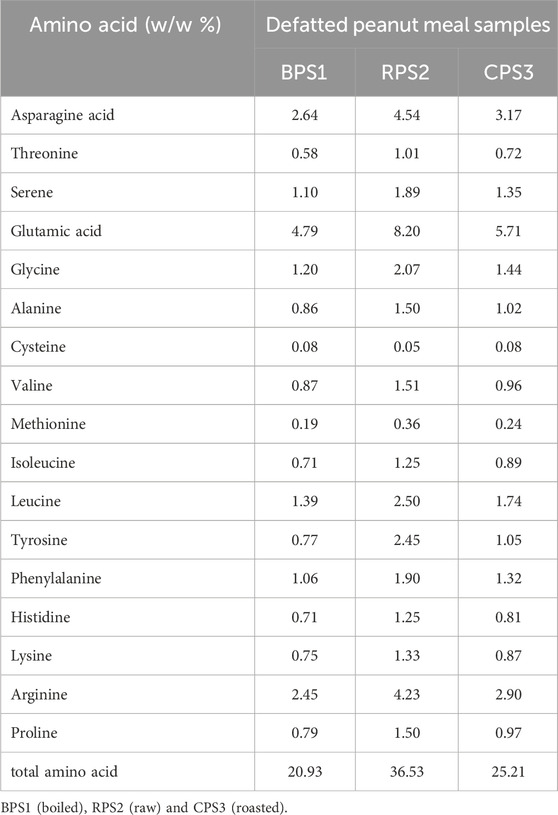
Table 4. Amino acid composition of defatted boiled, raw, and roasted peanut butter meals.
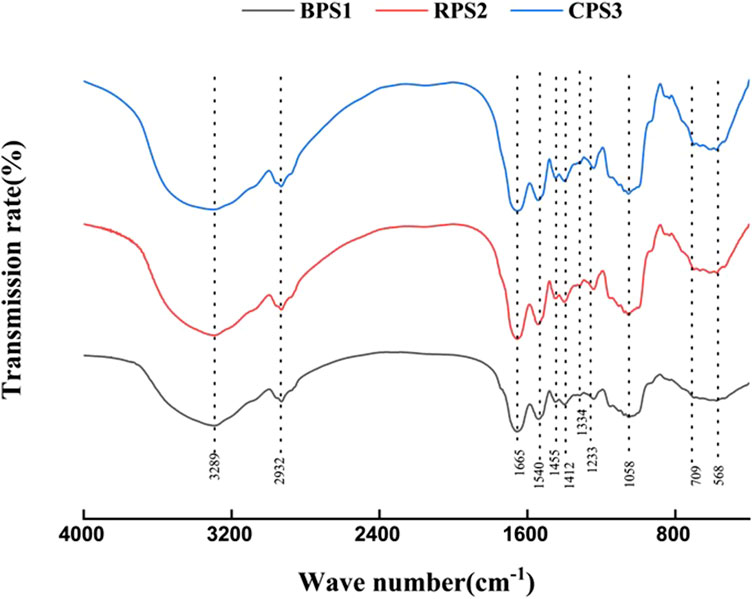
Figure 1. Structural characterization of peanut cake proteins by Fourier-Transform Infrared Spectroscopy (FT-IR). Note: BPS1 (boiled), RPS2 (raw), and CPS3 (roasted) defatted peanut pastes.
3.5 Color
With thermal treatment, the L* value for boiled and roasted peanuts decreased significantly to 54.95 and 56.71, respectively, compared to 61.54 for the raw peanuts, indicating a shift towards a darker coloration (Table 5). Earlier studies (Pattee et al., 1991) recommended an L* value of 58–59 for the optimum roast color; however, recent studies have shown that optimum roast color is strongly linked to the peanut variety (Lykomitros Dimitrios et al., 2016; Lykomitros D. et al., 2016; Yulan et al., 2021). A similar trend was also observed for the a* redness/greenness tone, shifting towards a red coloration with thermal treatment. The overall color difference (ΔE) of the three samples was observed to be significantly different, possibly indicating the different chemical and physical changes taking place with thermal treatment. Given the difference in color between roasted and boiled peanut butter, it will likely be a hard sell for some consumers accustomed to standard peanut butter color. Attaining the expected color is particularly important because, for example, in the US, color is one of the critical considerations in grading peanut butter, accounting for 20% of the total quality grading score (Phillips, 2023). Color variation is not just interpreted as an issue of aesthetics but can be easily misinterpreted as a sign of diminished quality, leading to diminished appeal (Phillips, 2023).

Table 5. Color properties of peanut paste made from defatted meal of boiled, raw, and roasted peanuts.
3.6 Fourier-transform infrared spectroscopy (FT-IR)
The changes in specific functional groups and modifications in secondary structures of proteins can be analyzed by FT-IR spectroscopy (Wang B et al., 2024). The FT-IR spectra of defatted peanut cakes for boiled, raw, and roasted peanuts are shown in Figure 1. The absorption peaks in the ranges of 1,600–1700 cm-1, and those near 1,542 cm-1, and between 1,220 cm-1 - 1,350 cm-1 represent the amide I, II, and III bands of proteins, respectively (Wang B et al., 2024). These absorption peaks usually reflect changes in protein chemical bond vibrations, where for peanut protein, the amide I band represents the stretching vibration of C=O and C-N, and the amide III band typically represents the stretching vibration of C-N and the bending vibration of N-H (Wang S et al., 2024). As shown in Figure 1, the absorption peak positions and intensities of the amide I, II, and III bands showed no significant changes. This shows that boiling and roasting did not result in observable changes in the protein structure of the respective defatted cakes. Standard FTIR spectra could not resolve the expected changes and differences in protein conformations of the boiled and roasted samples without applying spectra curve deconvolution. However, significant alterations in polysaccharides after boiling can be observed in FTIR spectra within the range of 800–1,040 cm-1, indicating significant modifications in polysaccharides, mainly cellulose, pectin, and xyloglucan, which mostly exhibit absorption peaks in these regions of the spectra (Szymanska-Chargot and Zdunek, 2013). This change indicates the substantial degradation of the plant cell wall, particularly under high hydrothermal conditions, such as those achieved through boiling, which can facilitate extensive starch gelatinization in the boiled samples (Edwards et al., 2015; Zhang et al., 2025).
3.7 Particle size distribution
The particle size distribution of all three samples approximately followed a bimodal distribution with the smaller crests centered between 33 and 37 µm and the more prominent crests centered between 197 and 290 µm, Figure 2. Others have reported a comparable distribution for sesame butter (Zhang et al., 2019). It can be observed that the roasted sample had a higher fraction of larger particles and a smaller fraction of the smaller particles compared to boiled and raw samples. In contrast, the opposite is true for the boiled sample. While the expectation was that roasted peanuts CPS3 would be frailer due to substantial dehydration from the high temperatures of dry roasting compared to the boiled and dried peanuts BPS1, consequently yielding a finer particle size, it was not the case. During boiling, significant chemical transformation happens, resulting in a more coherent bonding of the oil-protein-carbohydrate complex of the boiled sample BPS1. Given that the boiled peanuts appeared to have higher springiness when compressed by hand, it is suggested that the particle breakdown mechanism during grinding in the colloid mill could have been predominantly due to attrition and less fracturing, hence the finer particle sizes in BPS1 as compared to CPS3.
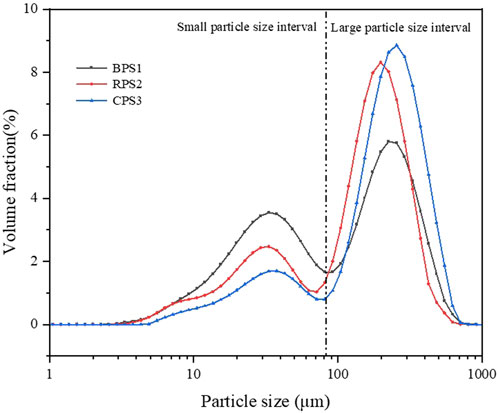
Figure 2. Particle size distribution of peanut butter (boiled, raw, roasted). Note: BPS1 (boiled), RPS2 (raw) and CPS3 (roasted) peanut paste samples.
When the particle size distribution is multimodal, the particle size distribution becomes more important than the mean size (Mohd Rozalli et al., 2015). Comparing the Dv (10) values, it was observed that the smallest particle size fractions were higher in boiled (BPS1) than in the other two samples, while the Dv (50) and Dv (90) were comparable. Considering the slopes of the cumulative distribution curves in Figure 3, it can be observed that the roasted sample CPS3 had a smaller particle size range that is skewed toward the larger size fraction. In contrast, the boiled samples appeared to have a relatively evenly distributed size distribution. The observed particle size distribution would probably explain why the oil leakage rate Figure 4) was higher in the roasted sample than in the boiled sample. With near-sized and large particle sizes in the roasted sample, the void fraction would be higher and allow higher oil seepage compared to the boiled sample, which had a broader and nearly evenly distributed particle size range, allowing for better closing packing and lower void fraction.
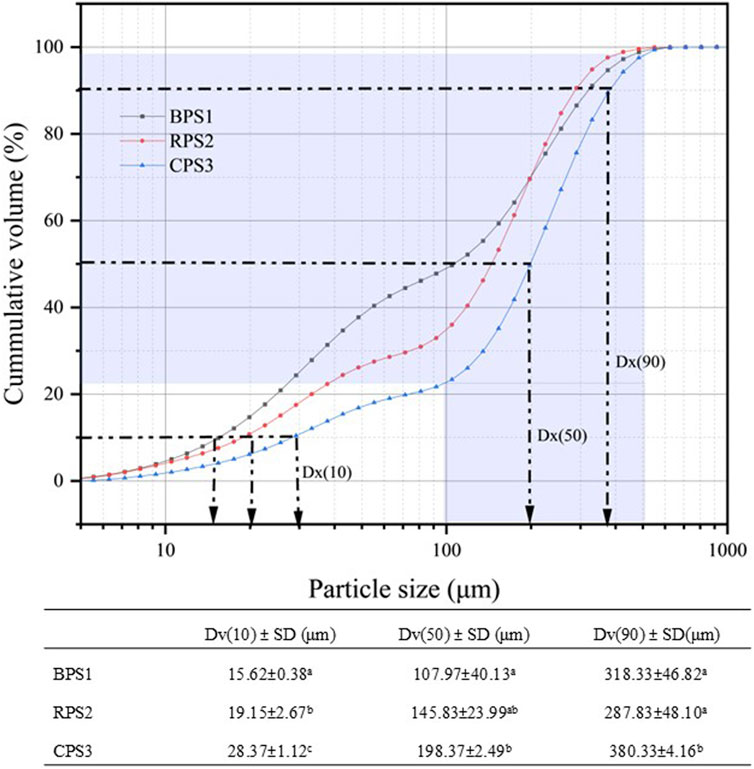
Figure 3. Cumulative particle size distribution of peanut butter samples (boiled, raw, roasted). Values are means ± standard deviations. Means followed by different letters in the same column are significantly different (p < 0.05), n = 3. Note: BPS1 (boiled), RPS2 (raw), and CPS3 (roasted) peanut paste samples.
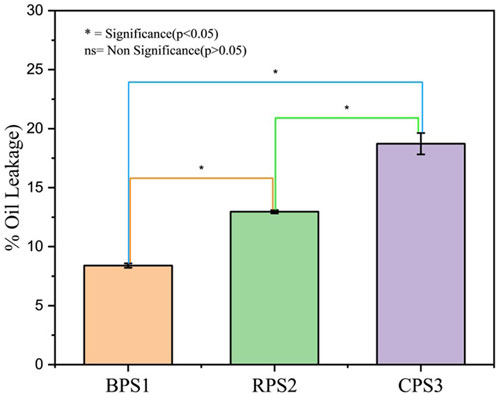
Figure 4. Peanut butter oil leakage/separation Values are expressed as means and standard deviations. Means highlighted by “ns” are not significantly different from each other (p > 0.05), while those highlighted with “*” are statistically different (p < 0.05), n = 3. Note: BPS1 (boiled), RPS2 (raw), and CPS3 (roasted).
3.8 Scanning electron microscopy (SEM) of boiled BPS1, raw RPS2, and CPS3 defatted paste samples
As shown in Figure 5 The surface morphology of defatted peanut butter consists of fragments of cell wall, protein bodies, and starch granules, which are observed in the micrographs as rough spherical, irregular spherical, ellipsoidal, and flat particles (Tanti et al., 2016; He et al., 2023). The spherical and ellipsoidal particles could be assigned to starch granules (Tanti et al., 2016), and the large irregular and round particles could be proteins (Liu et al., 2018), while the flat flakes could be fragments of ruptured cell walls. In the boiled BPS1, the starch granules appear larger than the roasted samples CPS3; furthermore, they appear to have agglomerated more with the protein bodies than the roasted sample. In the roasted CPS3, the starch and protein bodies are more dispersed, forming a looser association. Compared to the other samples, larger cell wall fragments can be observed in the raw sample. The agglomeration observed in the boiled defatted sample could result from starch gelatinization and subsequent rupturing of the cell walls, resulting in a stickier surface that agglomerates the protein bodies and ruptured cell wall particles. On the other hand, the moisture content is too low for dry roasting to support the gelatinization of starch particles, hence the loose association. Further, the high temperature and dry roasting conditions are sufficient to make the particles brittle and easily crumble during grinding.
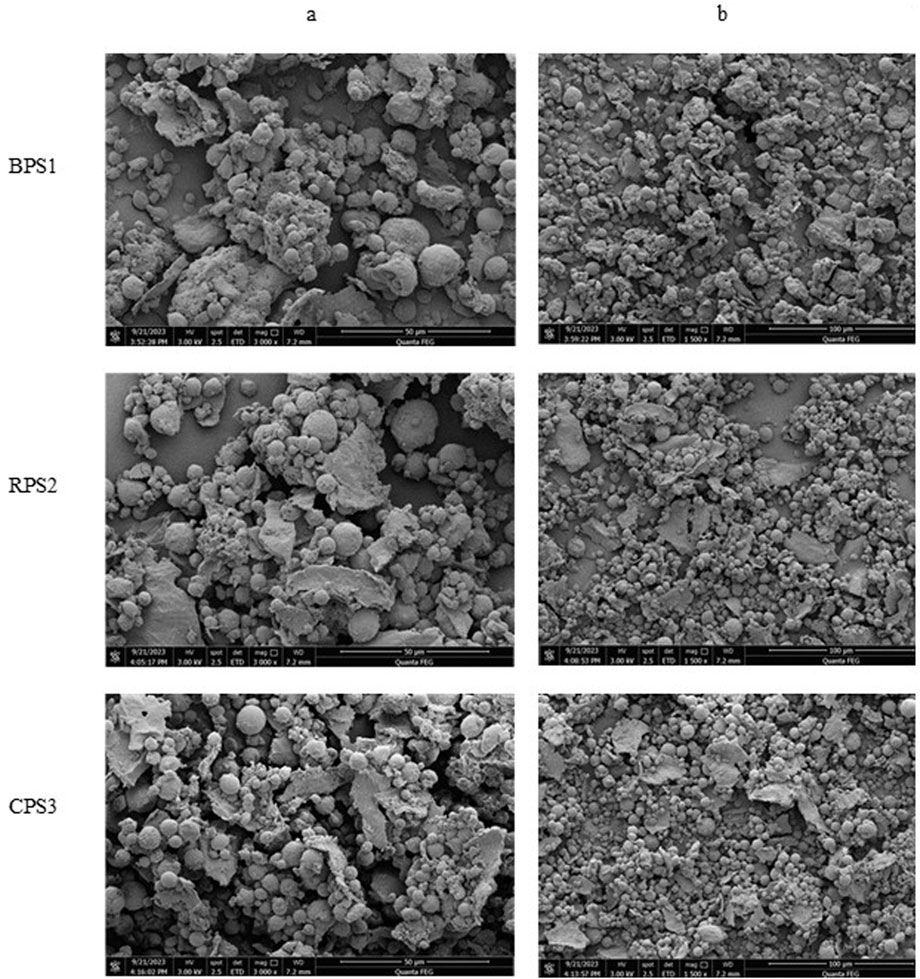
Figure 5. Scanning electron micrographs at a magnification of ×3,000 (A) and x1,500 (B) for peanut butter made from boiled peanuts (BPS1) raw peanuts (RPS2) and roasted peanuts (CPS3).
3.9 Confocal laser scanning microscopy (CLSM) of boiled BPS1, raw RPS2, and CPS3 defatted paste samples
Using CLSM, the microstructural differences in peanut paste, particularly the distribution of oils and proteins may be directly observed (Jin et al., 2022). These observations may provide valuable insights into the stability of peanut butter processed by different heat treatment methods (boiling and roasting). In Figure 6, the continuous fat phase is shown in red (b), while protein bodies are shown in green (a), and (c) is the combined oil phase and protein components. Large protein-starch clusters were observed in boiled samples compared to the roasted samples’ more fragmented, severed, almost needle protein bodies. Better dispersion of the protein and starch was also observed for the roasted CPS3 compared to the boiled BPS1.
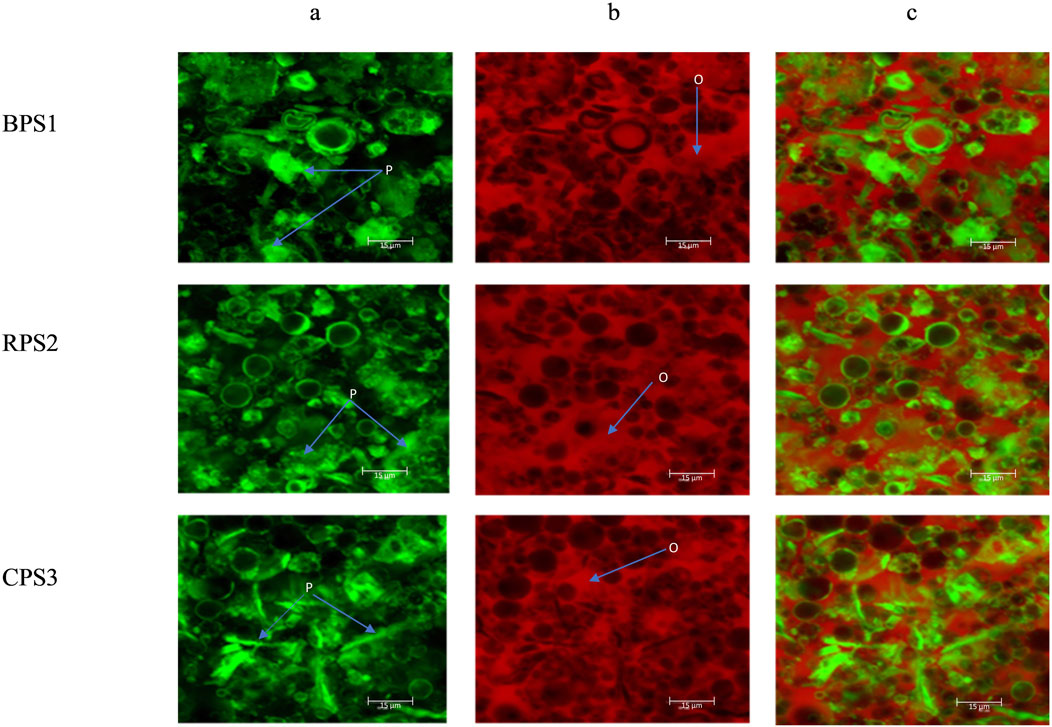
Figure 6. Micrographs of peanut butter structure under confocal laser scanning microscopy (CLSM) for peanut butter made from boiled peanuts (BPS1), raw peanuts (RPS2), and roasted peanuts (CPS3), (a) are proteins in green color (marked as P) (b) is the oil phase red (marked as O), and (c) co-distribution oil and proteins.
3.10 Oil separation
Oil separation is of particular concern in the stability of peanut butter because high oil separation is usually linked to an increased propensity to rancidity. Once the oil is separated from the peanut butter matrix, it becomes highly susceptible to the initiators of oxidation (air and light) (Gills and Resurreccion, 2000). There was a significant difference (p < 0.05) between the three samples for oil leakage. The highest oil leakage was observed in the roasted sample (18.7%), followed by the raw (13.0%), and the least was the boiled sample (8.34%). Unlike other high-fat foods structured by a fat crystal network, natural peanut butter stability results from the compact packing of peanut particles within the continuous oil phase (Tanti et al., 2016). It has been established that with a solid particles/liquid ratio of about 50/50 peanut, the packing in peanut butter is comparable to a random close packing fraction for monodispersed spheres (∼0.64) (Tanti et al., 2016). However, peanut butter particle-particle interaction significantly stabilizes the structure and the subsequent rheological properties. As shown in Figures 2, 3, particle size and distribution differences could have contributed to the variation in oil separation rates. Particle size and particle size distribution are a function of grindability, whereas grindability is a function of thermal pretreatment. Further, while the boiled sample had lower percent oil leakages, the separated oil had much better clarity than the roasted sample, with milky coloration of highly stabilized fine emulsions. Starch retrogradation during the drying of boiled samples may bind back the oil within the matrix of boiled peanuts via amylose lipid interactions resulting in the formation of amylose-lipid -V type complex (Li, 2024), whereas roasting disrupts the cell walls irreversibly, facilitating the free movement of oil within the matrix. This observation may have significant implications for quality and production operations. Peanut butter samples exhibiting significant oil leakage are likely to undergo rapid oxidation and develop rancidity. Oil separation results in suboptimal texture, contributing to an unsatisfactory eating experience characterized by an excessively oily surface and a hard crust at the bottom. Conversely, reduced oil leakage is expected to lead to diminished oxidation, enhanced flavor retention, and an improved overall eating experience. A higher oil leakage is undesirable in peanut butter but advantageous for oil extraction. It is important to note that while the roasted sample exhibited the highest oil leakage, which would benefit oil extraction, the subsequent oil clarification process is likely to be more complex and costly than oil extracted from boiled nuts.
3.11 Textual properties of peanut butter
The textural properties of peanut butter significantly influence mastication quality, thereby impacting consumer preferences and acceptance. (Yu et al., 2022). Hardness denotes the force necessary to deform raw food materials; chewiness refers to the energy required to reduce solid food to a swallowable state, and adhesiveness indicates the force needed to detach material that adheres to the mouth, typically the palate, during mastication (Yu et al., 2022; Ahmed and Ali, 1986) All the four textual parameters evaluated in Figure 7 (hardness, adhesiveness, gumminess and chewiness) were all statistically different (p < 0.05) in particular for the boiled and roasted samples. The boiled sample was firmer, highly adhesive, and gummy than the raw and roasted samples. While the chewiness attributes for the boiled and raw were comparable, both differed significantly (p < 0.05) from the roasted sample. In general, texture variation in peanut butter is usually attributed to differences in the oil content of the samples and the grinding process (Ahmed and Ali, 1986); however, in this instance, the oil content was comparable, and the same grinding process and procedure were employed for all the samples. This indicates that the textural variation may be linked to microstructural differences resulting from distinct heat treatments (boiling versus roasting). Specifically, the pasting properties (gelatinization and retrogradation) of the starch component in these samples are expected to differ markedly, considering that boiling and roasting were conducted at significantly different hydration levels (nearly dry for roasting and fully submerged in water for boiling). According to (Shi et al., 2018), high-temperature dry roasting may affect peanut butter spreadability by causing significant internal cell damage in peanut seeds as well as denaturation of protein structure, the release of proteins, carbohydrates, and lipids from the cell structure during pasting, increasing the volume fraction of particles, and a strengthening of the interaction between particles. Considering the inverse correlation often observed between the adhesiveness and separability of peanut butter (Ferdaus et al., 2022), it is evident that the boiling sample would exhibit more firmness, reduced spreadability, and increased stickiness after consumption, in contrast to the roasted peanut butter sample. These texture variations will have important implications for the eating quality and subsequent consumer acceptance. The actual consumer acceptance of the high adhesiveness, hardness, gumminess, and chewiness of the boiled BPS1, which is a significant deviation from the conventional textural property expectations of most consumers who are used to roasted peanut butter (BPS1), might need to be investigated.
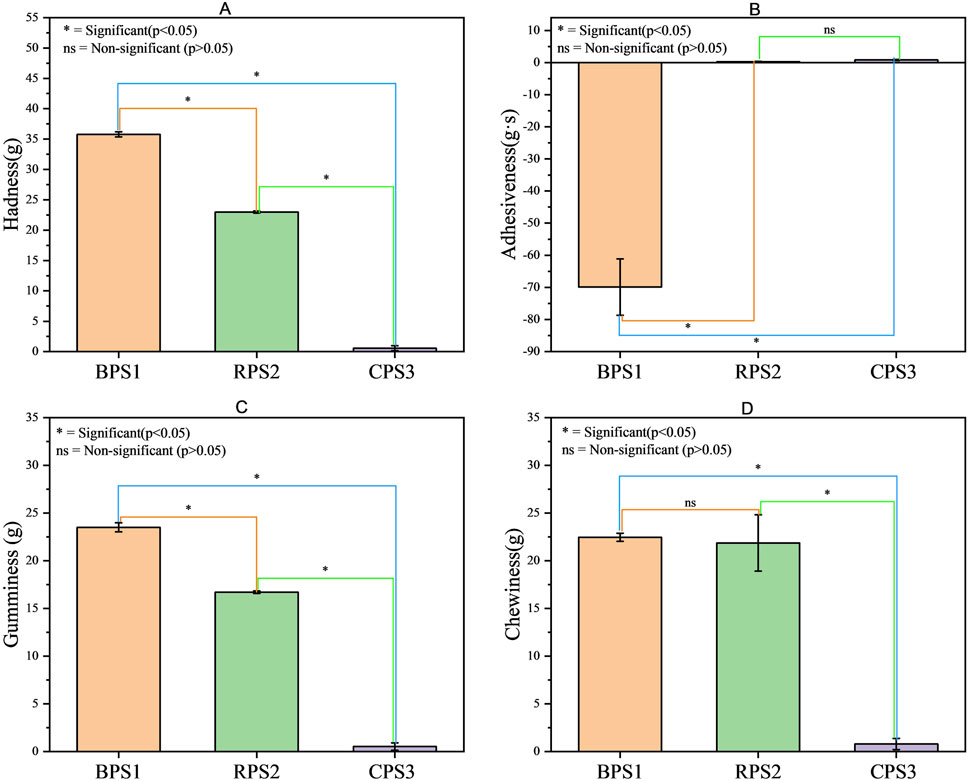
Figure 7. Evaluation of textural properties of peanut butter (boiled, raw, roasted). (A) shows the hardness and (B) adhesiveness, (C) gumminess, and (D) chewiness of the peanut butter paste. Results are expressed as mean values of triplicate ± standard deviation. Means highlighted by “ns” are not significantly different from each other (p > 0.05), while those highlighted with “*” are statistically different (p < 0.05) n = 3. Note: BPS1 (boiled), RPS2 (raw), and CPS3 (roasted).
3.12 Peanut butter volatile compounds
The primary volatile components of the peanut butter samples made from boiled, raw, and roasted peanuts were remarkably different, for the roasted sample, pyrazines were the most dominant volatile compounds, while on the other hand, no pyrazines were observed in both boiled and raw samples Figure 8. Previous studies confirm that pyrazines are the most abundant volatile substances in roasted peanuts (Zhang et al., 2024). They are formed when α-amino ketones from the products of the Strecker degradation undergo condensation reactions (Zhang et al., 2024). In this study, a total of sixty volatile compounds were identified in the roasted peanut butter sample, of which ten were pyrazines, fifteen aldehydes, eleven alcohols, seven acids, six ketones, nine esters, and some two other compounds. 2,5-dimethylpyrazine (15.6%), 2-ethyl-5-methyl pyrazine (5.7%), trimethyl-pyrazine (4.1%), methylpyrazine (4.0%), and 3-ethyl-2,5-dimethylpyrazine (3%) had the highest relative percentage content. Studies confirm that 5-dimethylpyrazine and 3-ethyl-2,5-dimethylpyrazine have low odor thresholds, making them characteristic flavor substances of roasted peanuts (Zhang et al., 2024). After pyrazines, aldehydes > alcohols > acids> and esters in decreasing order also contributed to the volatile components of the peanut butter made from the roasted peanuts. The absence of pyrazines in both raw and boiling samples, contrasted with their presence in roasted samples, indicates that the flavor formation in boiled peanuts occurred via a distinct reaction pathway that may exclude Maillard reactions. For the boiled sample, a total of thirty-six compounds were identified: six types of aldehydes, four alcohols, three acids, five ketones, ten esters, two furans, two alkenes, and four other compounds (mainly amide derivatives). The main volatile compounds in the boiled peanut butter sample BPS1 were trans-13-octadecenoic acid, methyl ester (5.7%), octadecanoic acid, 9-oxo-, methyl ester (4.2%) and 9-octadecenoic acid, methyl ester, (E)- (3.7%) which have a “soapy,” “waxy,” and slightly “grassy” aroma with a somewhat neutral, fat-like quality (Nadhifa et al., 2022). These octadecenoic methyl esters have also been reported to be some of the significant flavor contributors in mango, apricot, and carrot juices (El-Aziz et al., 2018). The high concentration of esters in the boiled peanut butter sample suggests a flavor development pathway that is not in line with the Maillard reactions but rather closely resembles the fermentation processes. In sample RPS1, only seventeen volatile compounds were identified: six esters, three ketones, three alkenes, one furan, one alcohol, and three other compounds, and no pyrazines, aldehydes, or acids were observed. The relative concentration of these compounds in decreasing order was alcohols > furans > other (mostly amides) > esters > ketones > hydrocarbons. The alcohol group was the dominant group in the raw peanut butter sample, of which 1- 1-hexanol was the main contributor to the raw peanut butter sample flavor. Although 1- hexanol was also present in both boiled and roasted samples it was however by far the most predominant volatile compounds contributing to the overall aroma of the raw peanut butter sample due to its relatively high concentration (22.2%) and aroma intensity thus giving the raw peanut butter sample a distinct “green, fruity, sweet, floral” note (Lu et al., 2023; Gao et al., 2023).
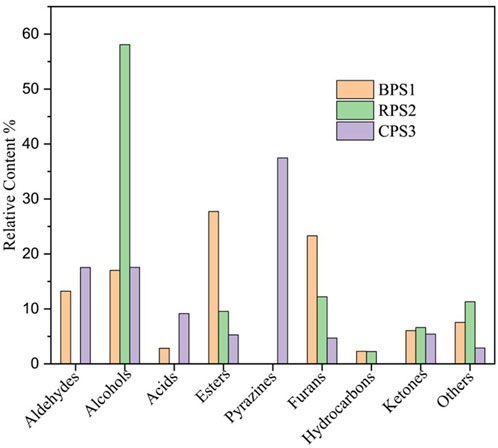
Figure 8. Evaluation of volatile compounds in peanut butter made from boiled BPS1, raw RPS2, and roasted CPS3 peanuts.
4 Conclusion
From the results obtained, it was noted that without a net loss in mass during processing, neither boiling nor roasting resulted in a substantial decrease in the nutrient composition as determined by proximate analysis. Differences in peanut amino acids, possibly monosaccharides, and fatty acids might be observed due to the different reaction mechanisms during boiling or roasting, but do not result in substantial changes in macronutrient compositions. Peanuts experience notable alterations in the spatial organization and interactions of their nutrient and chemical constituents as a result of roasting and boiling, resulting in distinct physical properties. The physical changes, chemical reaction mechanisms, and resultant organoleptic properties of peanut butter produced are distinctly different for the roasting and boiling processes. Neither boiling nor roasting resulted in significant changes to macronutrients; however, notable differences in physical properties were observed. The observed changes will likely significantly impact the production process, product acceptability, digestibility, and nutrient bioavailability during the digestion process of peanut butter.
5 Practical application
This research examines the comparative effects of boiling and roasting on peanut butter’s nutritional profile and physicochemical properties. The findings could serve as a foundation for evaluating an alternative minimal processing protocol that peanut butter consumers and producers could consider for circumventing some of the deleterious effects of roasting, highlighting the implications of using a boiling and drying procedure on peanut butter’s organoleptic, technical, and nutritional properties.
Data availability statement
The raw data supporting the conclusions of this article will be made available by the authors, without undue reservation.
Author contributions
TS: Writing – original draft, Investigation, Software, Data curation, Validation, Writing – review and editing, Formal Analysis, Methodology. Y-XM: Formal Analysis, Data curation, Validation, Writing – review and editing. ZQ: Data curation, Validation, Writing – review and editing, Formal Analysis. X-DW: Supervision, Formal Analysis, Resources, Visualization, Project administration, Writing – review and editing, Funding acquisition, Validation. H-ML: Resources, Formal Analysis, Project administration, Funding acquisition, Writing – review and editing, Supervision, Validation.
Funding
The author(s) declare that financial support was received for the research and/or publication of this article. This work was supported by the China Agriculture Research System of MOF and MARA (Grant number CARS-14-1-29).
Conflict of interest
The authors declare that the research was conducted in the absence of any commercial or financial relationships that could be construed as a potential conflict of interest.
Generative AI statement
The author(s) declare that no Generative AI was used in the creation of this manuscript.
Any alternative text (alt text) provided alongside figures in this article has been generated by Frontiers with the support of artificial intelligence and reasonable efforts have been made to ensure accuracy, including review by the authors wherever possible. If you identify any issues, please contact us.
Publisher’s note
All claims expressed in this article are solely those of the authors and do not necessarily represent those of their affiliated organizations, or those of the publisher, the editors and the reviewers. Any product that may be evaluated in this article, or claim that may be made by its manufacturer, is not guaranteed or endorsed by the publisher.
References
Abu-Ghosh, S., Dubinsky, Z., Verdelho, V., and Iluz, D. (2021). Unconventional high-value products from microalgae: a review. Bioresour. Technol. 329, 124895. doi:10.1016/j.biortech.2021.124895
Acar, C., Fogliano, V., Pellegrini, N., and Fogliano, V. (2009). Direct evaluation of the total antioxidant capacity of raw and roasted pulses, nuts and seeds. Eur. Food Res. Technol. 229:961–969. doi:10.1007/s00217-009-1131-z
Adawiyah, D. R., Soekarto, T. S., and Hariyadi, P. (2012). Fat hydrolysis in a food model system: effect of water activity and glass transition. Int. Food Res. J. 19 (2).
Ahmed, E. M., and Ali, T. (1986). Textural quality of peanut butter as influenced by peanut seed and oil Contents1. Peanut Sci. 13 (1), 18–20. doi:10.3146/i0095-3679-13-1-6
Alpaslan, M., and Hayta, M. (2002). Rheological and sensory properties of pekmez (grape molasses)/tahin (sesame paste) blends. J. Food Eng. 54 (1), 89–93. doi:10.1016/S0260-8774(01)00197-2
Altay, F., and Gunasekaran, S. (2006). Influence of drying temperature, water content, and heating rate on gelatinization of corn starches. J. Agric. Food Chem. 54 (12), 4235–4245. doi:10.1021/jf0527089
Amba, V., Murphy, G., Etemadi, A., Wang, S., Abnet, C. C., and Hashemian, M. (2019). Nut and peanut butter consumption and mortality in the national institutes of Health-AARP diet and health study. Nutrients 11 (7), 1508. doi:10.3390/nu11071508
Arya, S. S., Salve, A. R., and Chauhan, S. (2016). Peanuts as functional food: a review. J. Food Sci. Technol. 53 (1), 31–41. doi:10.1007/s13197-015-2007-9
Beyer, K., Morrow, E., Li, X. M., Bardina, L., Bannon, G. A., Burks, A. W., et al. (2001). Effects of cooking methods on peanut allergenicity. J. Allergy Clin. Immunol. 107 (6), 1077–1081. doi:10.1067/mai.2001.115480
Bonku, R., and Yu, J. (2020). Health aspects of peanuts as an outcome of its chemical composition. Food Sci. Hum. Wellness 9 (1), 21–30. doi:10.1016/j.fshw.2019.12.005
Carrín, M. E., and Carelli, A. A. (2010). Peanut oil: compositional data. Eur. J. Lipid Sci. Technol. 112 (7), 697–707. doi:10.1002/ejlt.200900176
Chukwumah, Y., Walker, L., Vogler, B., and Verghese, M. (2007). Changes in the phytochemical composition and profile of raw, boiled, and roasted peanuts. J. Agric. Food Chem. 55 (22), 9266–9273. doi:10.1021/jf071877l
Chung, S. Y., and Champagne, E. T. (1999). Allergenicity of maillard reaction products from peanut proteins. J. Agric. Food Chem. 47 (12), 5227–5231. doi:10.1021/jf9904416
Chung, S.-Y., Butts, C., Maleki, S., and Champagne, E. (2003). Linking peanut allergenicity to the processes of maturation, curing, and roasting. J. Agric. food Chem. 51, 4273–4277. doi:10.1021/jf021212d
Cohen, C. G., Mazer, B. D., and Jean-Claude, B. J. (2024). Molecular profiling of peanut under raw, roasting, and autoclaving conditions using high-resolution magic angle spinning and solution 1H NMR spectroscopy. Molecules 29 (1), 162. doi:10.3390/molecules29010162
Ding, B., Wang, F., Zhang, B., Feng, M., Chang, L., Shao, Y., et al. (2023). Flavor characteristics of ten peanut varieties from China. Foods 12 (24), 4380. doi:10.3390/foods12244380
Edwards, C. H., Warren, F. J., Campbell, G. M., Gaisford, S., Royall, P. G., Butterworth, P. J., et al. (2015). A study of starch gelatinisation behaviour in hydrothermally-processed plant food tissues and implications for in vitro digestibility. Food Funct. 6 (12), 3634–3641. doi:10.1039/c5fo00754b
El-Aziz, M., Sharoba, P. A., El-Desouky, A., Khalaf, H., and Morsy, O. (2018). Identification and determination of aroma components of some juice and its blends, 56, 361, 378. doi:10.21608/assjm.2018.214399
Fan, Y.-Yi, and Chapkin, R. S. (1998). Importance of dietary γ-Linolenic acid in human health and nutrition. J. Nutr. 128 (9), 1411–1414. doi:10.1093/jn/128.9.1411
Fennema, O. (1985). “Chemical changes in food during processing—an overview,” in Chemical changes in food during processing. Editors T. Richardson, and J. W. Finley (Dordrecht: Springer Netherlands), 1–16.
Ferdaus, Md J., Blount, R. J. S., and Roberta, C. S. (2022). Assessment of natural waxes as stabilizers in peanut butter. Foods 11 (19), 3127. doi:10.3390/foods11193127
Gao, H., Liu, M., Zheng, L., Zhang, T., Chang, X., Liu, He, et al. (2023). Comparative analysis of key odorants and aroma characteristics in hot-pressed yellow horn (Xanthoceras sorbifolia bunge) seed oil via gas chromatography–ion mobility spectrometry and gas Chromatography–olfactory-mass spectrometry. Foods 12 (17), 3174. doi:10.3390/foods12173174
García, V., Romero, R. S., Polo, A. J., Moya, S. P., Pérez, S. E. M., and Sanahuja, A. B. (2021). Volatile profile of nuts, key odorants and analytical methods for quantification. Foods 10 (7), 1611. doi:10.3390/foods10071611
Gills, L. A., and Resurreccion, A. V. A. (2000). Sensory and physical properties of peanut butter treated with palm oil and hydrogenated vegetable oil to prevent oil separation. J. Food Sci. 65, 173–180. doi:10.1111/j.1365-2621.2000.tb15975.x
Golani, R., Leishangthem, C., Xiao, H., Qi, Z., and Sutar, P. P. (2024). Effect of high temperature short time infrared roasting of peanuts. J. Future Foods 4 (2), 173–178. doi:10.1016/j.jfutfo.2023.06.009
Guo, C., Xie, Y.-J., Zhu, M.-T., Xiong, Q., Chen, Yi, Yu, Q., et al. (2020). Influence of different cooking methods on the nutritional and potentially harmful components of peanuts. Food Chem. 316, 126269. doi:10.1016/j.foodchem.2020.126269
Guo, Q., Jin, L., Guan, M.-C., Xu, S., Wang, C.-Xu, Liu, M.-W., et al. (2023). Investigations on color and flavor formed by roasting sesame polysaccharide-protein mixtures. Food Res. Int. 163, 112118. doi:10.1016/j.foodres.2022.112118
He, Z., Cheng, H. N., and He, J. (2023). Initial formulation of novel peanut butter-like products from glandless cottonseed. Foods 12 (2), 378. doi:10.3390/foods12020378
Hemmler, D., Roullier-Gall, C., Marshall, J. W., Rychlik, M., Taylor, A. J., and Schmitt-Kopplin, P. (2018). Insights into the chemistry of non-enzymatic browning reactions in different ribose-amino acid model systems. Sci. Rep. 8 (1), 16879. doi:10.1038/s41598-018-34335-5
Hu, H., Shi, A., Liu, H., Liu, L., Fauconnier, M. L., and Wang, Q. (2021). Study on key aroma compounds and its precursors of peanut oil prepared with Normal- and high-oleic peanuts. Foods 10 (12), 3036. doi:10.3390/foods10123036
Igual, M., and Martínez-Monzó, J. (2022). Physicochemical properties and structure changes of food products during processing. Foods 11 (15), 2365. doi:10.3390/foods11152365
Jin, L., Guo, Q., Zhang, M., Xu, Y.-T., Liu, H.-M., Ma, Y.-X., et al. (2022). Effects of non-lipid components in roasted sesame seed on physicochemical properties of sesame paste. LWT 165, 113745. doi:10.1016/j.lwt.2022.113745
Kita, A., and Figiel, A. (2007). Effect of parameters of thermal process on the properties of peanuts. Pol. J. Food Nutr. Sci. 57 (4B), 285–290.
Kutzli, I., Weiss, J., and Gibis, M. (2021). Glycation of plant proteins via maillard reaction: reaction chemistry, technofunctional properties, and potential food application. Foods 10 (2), 376. doi:10.3390/foods10020376
Li, C. (2024). Unraveling the complexities of starch retrogradation: insights from kinetics, molecular interactions, and influences of food ingredients. Food Rev. Int. 40 (9), 3159–3182. doi:10.1080/87559129.2024.2347467
Liu, J., Pengfei, li, Jiang, Z., Yang, R., and Zhang, W. (2018). Characterisation of peanut protein concentrates from industrial aqueous extraction processing prepared by spray and freeze drying methods. Int. J. Food Sci. and Technol. 54, 1597–1608. doi:10.1111/ijfs.14028
Liu S, S., Sun, H., Ma, G., Zhang, T., Wang, L., Pei, H., et al. (2022). Insights into flavor and key influencing factors of maillard reaction products: a recent update. Front. Nutr. 9, 973677. doi:10.3389/fnut.2022.973677
Liu Y, Y., Hu, H., Liu, H., and Wang, Q. (2022). Recent advances for the developing of instant flavor peanut powder: generation and challenges. Foods 11 (11), 1544. doi:10.3390/foods11111544
Lu, C., Zhang, Y., Zhan, P., Wang, P., and Tian, H. (2023). Characterization of the key aroma compounds in four varieties of pomegranate juice by gas chromatography-mass spectrometry, gas chromatography-olfactometry, odor activity value, aroma recombination, and omission tests. Food Sci. Hum. Wellness 12 (1), 151–160. doi:10.1016/j.fshw.2022.07.033
Lykomitros, D., Fogliano, V., and Capuano, E. (2016a). Flavor of roasted peanuts (Arachis hypogaea) - part I: effect of raw material and processing technology on flavor, color and fatty acid composition of peanuts. Food Res. Int. 89 (Pt 1), 860–869. doi:10.1016/j.foodres.2016.09.024
Lykomitros, D., Fogliano, V., and Capuano, E. (2016b). Flavor of roasted peanuts (Arachis hypogaea) — part II: correlation of volatile compounds to sensory characteristics. Food Res. Int. 89, 870–881. doi:10.1016/j.foodres.2016.08.017
Maleki, S. J., Schmitt, D. A., Galeano, M., and Hurlburt, B. K. (2014). Comparison of the digestibility of the major peanut allergens in thermally processed peanuts and in pure form. Foods 3 (2), 290–303. doi:10.3390/foods3020290
McDaniel, K., White, B., Dean, L., Sanders, T., and Davis, J. (2012). Compositional and mechanical properties of peanuts roasted to equivalent colors using different time/temperature combinations. J. food Sci. 77, C1293–C1299. doi:10.1111/j.1750-3841.2012.02979.x
Mohd Rozalli, N. H., Chin, N. L., and Yusof, Y. A. (2015). Particle size distribution of natural peanut butter and its dynamic rheological properties. Int. J. Food Prop. 18 (9), 1888–1894. doi:10.1080/10942912.2014.971184
Mustonen, A. M., and Nieminen, P. (2023). Dihomo-γ-Linolenic acid (20:3n-6)-Metabolism, derivatives, and potential significance in chronic inflammation. Int. J. Mol. Sci. 24 (3), 2116. doi:10.3390/ijms24032116
Nadhifa, A., Fibri, D. L. N., Handoko, D., David, W., Budijanto, S., Shirakawa, H., et al. (2022). The volatile compounds and aroma profile of some pigmented rice brans after fermentation. Curr. Nutr. and Food Sci. 10, 145–170. doi:10.12944/CRNFSJ.10.1.11
Pattee, H. E., Giesbrecht, F. G., and Young, C. T. (1991). Comparison of peanut butter color determination by CIELAB l*,a*,B* and hunter color-difference methods and the relationship of roasted peanut color to roasted peanut flavor response. J. Agric. Food Chem. 39 (3), 519–523. doi:10.1021/jf00003a018
Phillips, K. (2023). Measuring the color of peanut butter to ensure product quality and appeal. HunterLab. Available online at: https://www.hunterlab.com/blog/measuring-the-color-of-peanut-butter-to-ensure-product-quality-and-appeal/ (Accessed November 11).
Sakaino, M., Sano, T., Kato, S., Shimizu, N., Ito, J., Rahmania, H., et al. (2022). Carboxylic acids derived from triacylglycerols that contribute to the increase in acid value during the thermal oxidation of oils. Sci. Rep. 12 (1), 12460. doi:10.1038/s41598-022-15627-3
Sanders, C. T., DeMasie, C. L., Kerr, W. L., Hargrove, J. L., Pegg, R. B., and Swanson, R. B. (2014). Peanut skins-fortified peanut butters: effects on consumer acceptability and quality characteristics. LWT - Food Sci. Technol. 59 (1), 222–228. doi:10.1016/j.lwt.2014.04.001
Sarparast, M., Pourmand, E., Hinman, J., Vonarx, D., Reason, T., Zhang, F., et al. (2023). Dihydroxy-metabolites of Dihomo-γ-linolenic acid drive ferroptosis-mediated neurodegeneration. ACS Central Sci. 9 (5), 870–882. doi:10.1021/acscentsci.3c00052
Sergeant, S., Rahbar, E., and Chilton, F. H. (2016). Gamma-linolenic acid, Dihommo-gamma linolenic, eicosanoids and inflammatory processes. Eur. J. Pharmacol. 785, 77–86. doi:10.1016/j.ejphar.2016.04.020
Shakerardekani, A., Karim, R., Ghazali, H. M., and Chin, N. L. (2013). Textural, rheological and sensory properties and oxidative stability of nut spreads—a review. Int. J. Mol. Sci. 14, 4223–4241. doi:10.3390/ijms14024223
Shi, X., Davis, J. P., Xia, Z., Sandeep, K. P., Sanders, T. H., and Dean, L. O. (2017). Characterization of peanuts after dry roasting, oil roasting, and blister frying. LWT 75, 520–528. doi:10.1016/j.lwt.2016.09.030
Shi, X., Dean, L. O., Davis, J. P., Sandeep, K. P., and Sanders, T. H. (2018). The effects of different dry roast parameters on peanut quality using an industrial belt-type roaster simulator. Food Chem. 240, 974–979. doi:10.1016/j.foodchem.2017.07.130
Simon, S. (2019). Amino acids and biogenic amines as food quality factors. 91 (2):289–300. doi:10.1515/pac-2018-0709
Sruthi, N. U., Premjit, Y., Pandiselvam, R., Kothakota, A., and Ramesh, S. V. (2021). An overview of conventional and emerging techniques of roasting: effect on food bioactive signatures. Food Chem. 348, 129088. doi:10.1016/j.foodchem.2021.129088
Sun, J., Zhang, C., Song, Yu, Chu, B., Wang, M., Zhang, Z., et al. (2024). Characterization of key aroma compounds and main contributing amino acids in hot-pressed oil prepared from various peanut varieties. Molecules 29 (9), 1947. doi:10.3390/molecules29091947
Suri, K., Singh, B., Kaur, A., and Singh, N. (2019). Impact of roasting and extraction methods on chemical properties, oxidative stability and maillard reaction products of peanut oils. J. Food Sci. Technol. 56 (5), 2436–2445. doi:10.1007/s13197-019-03719-4
Szymanska-Chargot, M., and Zdunek, A. (2013). Use of FT-IR spectra and PCA to the bulk characterization of cell wall residues of fruits and vegetables along a fraction process. Food Biophys. 8 (1), 29–42. doi:10.1007/s11483-012-9279-7
Tanti, R., Barbut, S., and Marangoni, A. G. (2016). Oil stabilization of natural peanut butter using food grade polymers. Food Hydrocoll. 61, 399–408. doi:10.1016/j.foodhyd.2016.05.034
Uribarri, J., Woodruff, S., Goodman, S., Cai, W., Chen, X., Pyzik, R., et al. (2010). Advanced glycation end products in foods and a practical guide to their reduction in the diet. J. Am. Diet. Assoc. 110 (6), 911–16.e12. doi:10.1016/j.jada.2010.03.018
Vissers, Y. M., Blanc, F., Skov, P. S., Johnson, P. E., Rigby, N. M., Przybylski-Nicaise, L., et al. (2011). Effect of heating and glycation on the allergenicity of 2S albumins (ara h 2/6) from peanut. PLoS One 6 (8), e23998. doi:10.1371/journal.pone.0023998
Wang B, B., Hou, L., Yang, M., Jin, L., Liu, H., and Wang, X. (2024). An evaluation of the physicochemical properties of sesame paste produced by ball milling compared against conventional colloid milling. J. Oleo Sci. 73 (5), 645–655. doi:10.5650/jos.ess23178
Wang, X., Lin, H., and Gu, Y. (2012). Multiple roles of dihomo-γ-linolenic acid against proliferation diseases. Lipids Health Dis. 11 (1), 25. doi:10.1186/1476-511X-11-25
Wang, B., Dong, Y., Fang, Y., Gao, W., Kang, X., Liu, P., et al. (2022). Effects of different moisture contents on the structure and properties of corn starch during extrusion. Food Chem. 368, 130804. doi:10.1016/j.foodchem.2021.130804
Wang S, S., Guo, Y., Zhu, X., Xie, D., and Wang, Z. (2024). Effects of the roasting-assisted aqueous ethanol extraction of peanut oil on the structure and functional properties of dreg proteins. Foods 13 (5), 758. doi:10.3390/foods13050758
Wei, Q., Liu, T., and Sun, D.-W. (2018). Advanced glycation end-products (AGEs) in foods and their detecting techniques and methods: a review. Trends Food Sci. and Technol. 82, 32–45. doi:10.1016/j.tifs.2018.09.020
Xu, S., Zhao, J.-R., Guo, Q., Liu, H.-M., Qin, Z., and Wang, X.-De (2023). Comparative evaluation of different enzyme pretreatment on the oxidative stability and volatile compounds of sunflower oil. LWT 187, 115385. doi:10.1016/j.lwt.2023.115385
Yang K. M, K. M., Cheng, M. C., Ye, Z. S., Chu, L. P., and Chen, H. C. (2022). Chemical properties of peanut oil from Arachis hypogaea L. 'Tainan 14' and its oxidized volatile formation. Molecules 27 (20), 6811. doi:10.3390/molecules27206811
Yang Y, Y., Yuan, B., Pei, Yu, Jia, Y., Qi, Z., and Sun, J. (2022). Flavor characteristics of peanut butter pretreated by radio frequency heating, explosion puffing, microwave, and oven heating. Food Chem. 394, 133487. doi:10.1016/j.foodchem.2022.133487
Yin, W.-ting, Shi, R., Li, Ke, Wang, X.-de, Wang, A.-na, Zhao, Y.-hang, et al. (2022). Effect of microwave pretreatment of sunflower kernels on the aroma-active composition, sensory quality, lipid oxidation, tocopherols, heterocyclic amines and polycyclic aromatic hydrocarbons of sunflower oil. LWT 170, 114077. doi:10.1016/j.lwt.2022.114077
Yokoi, K., Yanagimoto, K., and Hayamizu, K. (2023). Supplementation of Dihomo-γ-Linolenic acid for pollen-induced allergic symptoms in healthy subjects: a randomized, double-blinded, placebo-controlled trial. Nutrients 15 (15), 3465. doi:10.3390/nu15153465
Yu, J., Song, L., Xiao, H., Xue, Y., and Xue, C. (2022). Structuring emulsion gels with peanut protein isolate and fish oil and analyzing the mechanical and microstructural characteristics of surimi gel. LWT 154, 112555. doi:10.1016/j.lwt.2021.112555
Yu, J., Yu, X., Shi, L., and Liu, W. (2023). Comprehensive analyses of advanced glycation end products and heterocyclic amines in peanuts during the roasting process. Molecules 28, 7012. doi:10.3390/molecules28207012
Yulan, L. I. U., Yao, S. H. U., Sun, G., Yuxiang, M. A., Jiang, Y., and Chen, N. (2021). Effects of different varieties of peanuts on the flavor and quality of peanut butter. J. Food Sci. 42 (9), 15–21. doi:10.7506/spkx1002-6630-20200705-063
Zhang, T., Shi, Y., Zhao, Y., Tang, G., Niu, B., and Chen, Q. (2018). Boiling and roasting treatment affecting the peanut allergenicity. Ann. Transl. Med. 6 (18), 357. doi:10.21037/atm.2018.05.08
Zhang, W., Xu, T., and Yang, R. (2019). Effect of roasting and grinding on the processing characteristics and organoleptic properties of sesame butter. Eur. J. Lipid Sci. Technol. 121 (7), 1800401. doi:10.1002/ejlt.201800401
Zhang, L., Shi, P., Sun, J., Xie, M., Wang, H., Shi, T., et al. (2024). Analysis of roasted peanuts based on GC-MS combined with GC-IMS. Food Sci. Nutr. 12 (3), 1888–1901. doi:10.1002/fsn3.3882
Zhang, S., Wu, W., Zhu, J., Wu, J., Gan, Z., Deng, H., et al. (2025). Multi-scale structural evolution during simulated gelatinization process of sweet potato starch by heat-moisture treatment. Food Chem. X 25, 102123. doi:10.1016/j.fochx.2024.102123
Keywords: physicochemical properties, peanut butter, boiling, roasting, flavor
Citation: Sithole TR, Ma Y-X, Qin Z, Wang X-D and Liu H-M (2025) A comparative analysis of the nutritional and physicochemical properties of peanut butter paste produced from raw, roasted, and boiled peanuts. Front. Food Sci. Technol. 5:1642316. doi: 10.3389/frfst.2025.1642316
Received: 06 June 2025; Accepted: 29 September 2025;
Published: 20 October 2025.
Edited by:
Nutsuda Sumonsiri, Teesside University, United KingdomReviewed by:
Dennis Valino Cantre, University of the Philippines Los Baños, PhilippinesAlkasim Kabiru Yunusa, Kano University of Science and Technology, Nigeria
Copyright © 2025 Sithole, Ma, Qin, Wang and Liu. This is an open-access article distributed under the terms of the Creative Commons Attribution License (CC BY). The use, distribution or reproduction in other forums is permitted, provided the original author(s) and the copyright owner(s) are credited and that the original publication in this journal is cited, in accordance with accepted academic practice. No use, distribution or reproduction is permitted which does not comply with these terms.
*Correspondence: Xue-De Wang, d2FuZ3h1ZWRlMTk2MkAxMjYuY29t; Hua-Min Liu, bGl1aHVhbWluNTEwOEAxNjMuY29t