 Shenyang Hu
 Benjamin Beeler
- 1Pacific Northwest National Laboratory, Richland, WA, United States
- 2Idaho National Laboratory, Idaho Falls, ID, United States
- 3Department of Nuclear Engineering, North Carolina State University, Raleigh, NC, United States
In monolithic UMo fuels, the interaction between the Al cladding and large gas bubble volumetric swelling causes both elastic-plastic and creep deformation. In this work, a phase-field model of gas bubble evolution in polycrystalline UMo under elastic-plastic deformation was developed for studying the dynamic interaction between evolving gas bubble/voids and deformation. A crystal plasticity model, which assumes that the plastic strain rate is proportional to resolved shear stresses of dislocation slip systems on their slip planes, was used to describe plastic deformation in polycrystalline UMo. Xe diffusion and gas bubble evolution are driven by the minimization of chemical and deformation energies in the phase-field model, while evolving gas bubble structure was used to update the mechanical properties in the crystal plasticity model. With the developed model, we simulated the effect of gas bubble structures (different volume fractions and internal gas pressures) on stress-strain curves and the effect of local stresses on gas bubble evolution. The results show that 1) the effective Young’s modulus and yield stress decrease with the increase of gas bubble volume fraction; 2) the hardening coefficient increases with the increase of gas bubble volume fraction, especially for gas bubbles with higher internal pressure; and 3) the pressure dependence of Xe thermodynamic and kinetic properties in addition to the local stress state determine gas bubble growth or shrinkage. The simulated results can serve as a guide to improve material property models for macroscale fuel performance modeling.
Introduction
The measured thickness increase of a UMo fuel meat in monolithic UMo plate-type fuel as a function of the local fission density is shown in Figure 1. The profile of an irradiated UMo fuel plate and gas bubble structures at different fission densities are also shown in Figure 1. Irradiation results in a nonuniform thickness of the UMo fuel meart and large changes in the gas bubble structure with respect to fission density. The interaction between gas bubble volumetric swelling of the UMo fuel meat and the Al cladding in monolithic UMo fuels results in a non-uniform stress field in both the UMo fuel meat and Al cladding, which drives elastic-plastic and/or creep deformation, defect diffusion, and microstructure evolution (Kim et al., 2013; Meyer et al., 2014; Meyer et al., 2017; Ozaltun and Rabin, 2017; Medvedev et al., 2018). The fission product induced swelling generates high stresses within both the fuel and the cladding, leading to plasticity and creep. The interaction of gas bubble swelling with this induced mechanical deformation will subsequently affect the nature of gas bubble evolution, due to accommodation of stress. On the other hand, since the gas bubbles have different thermo-mechanical properties from UMo matrix, the evolution of gas bubbles impacts the thermo-mechanical properties of the entire fuel system. Therefore, to predict the fuel performance including mechanical integrity, geometric stability, and stable irradiation behavior, it is crucial to validate the correlation among deformation, gas bubble evolution, and material properties, and develop physics-based constitutive equations of swelling, elastic-plastic deformation, and creep.
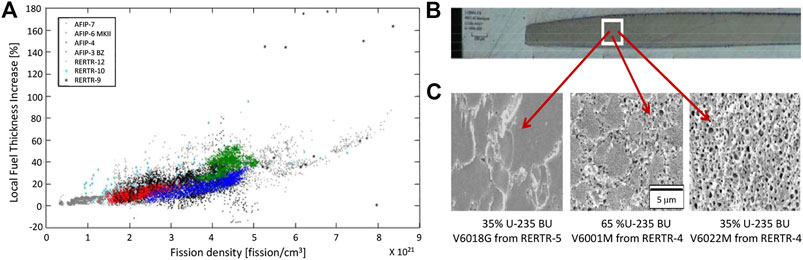
FIGURE 1. Experimental results reproduced from references (Kim et al., 2013; Meyer et al., 2017). (A) UMo fuel meat thickness change vs. fission density (Meyer et al., 2017), (B) profile of radiated UMo fuel meat, and (C) evolution of recrystallized grains and gas bubbles in UMo fuel meat (Kim et al., 2013).
The existing constitutive models for swelling, elastic-plastic deformation, and creep utilized in monolithic UMo fuel performance modeling (Miller et al., 2010; Ozaltun and Rabin, 2017; Medvedev et al., 2018; Yan et al., 2019) are empirical and developed primarily by fitting experimental data (Burkes et al., 2010; Burkes and Wachs, 2010; Kim et al., 2013) and secondarily to fit the results of finite element analyses. The mechanisms of deformations such as plastic and creep deformation and the coupling of gas bubble structure, stress, and property evolution are not sufficiently considered, which limits the predictive capability of the existing models.
In the absence of irradiation damage, a number of microstructure-dependent plastic and creep deformation models have been developed (Deutchman et al., 2012; Cottura et al., 2016; Wu and Sandfeld, 2017; Yang et al., 2018). A homogenized crystal plasticity FEM Model (Deutchman et al., 2012), which uses crystal plasticity parameters (such as activation energy, passing stress and activation volume) provided by a dislocation-density based crystal plasticity modeling, was developed to study the effect of various microstructures (precipitate shape and volume fraction, and channel width) on plastic deformation in Ni based superalloys. An empirical constitutive model-based phase-field model (Tsukada et al., 2011), which uses the von Mises yield criterion for plastic deformation and a simple creep evolution equation, was developed to study the evolution of microstructure and inelastic (plastic and creep) deformation during high temperature creep in nickel-based superalloys. Yang et al. (2018) developed a phase-field model combining a simple creep damage model (Vladimirov et al., 2009) and a dislocation dynamics model (Wu and Sandfeld, 2017) for studying the evolution of
Phase-Field Model of Gas Bubble Evolution in Polycrystalline UMo Under Elastic-Plastic Deformation
We consider gas bubble evolution in a representative volume of polycrystalline UMo in monolithic UMo fuels as shown in Figure 2. The axes
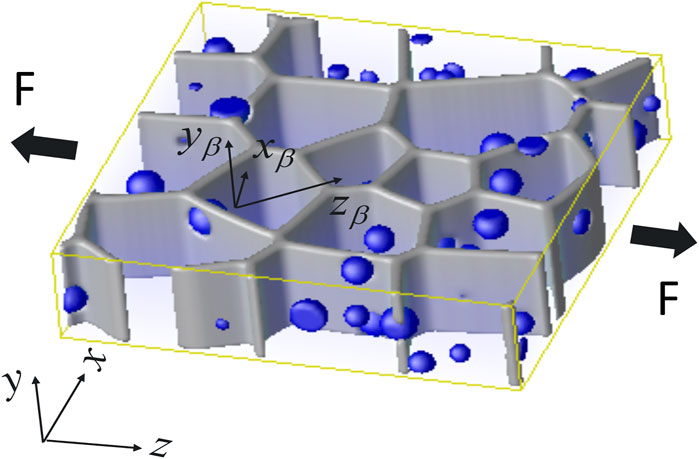
FIGURE 2. Illustration of polycrystalline UMo with distributed gas bubbles, where F is the applied force.
A phase-field model of grain growth (Chen, 2002) is used to generate polycrystalline structures. The grain boundaries are defined by a shape function
In UMo fuels, 235U fission generates high-energy neutrons and fission fragments that cause radiation damage. A cluster dynamics model (Mansur, 1994; Kohnert and Wirth, 2015; Brimbal et al., 2016; Kohnert et al., 2018) is used to describe the evolution of vacancies, interstitials, and their clusters in polycrystalline structures with distributed gas bubbles. The generation of gas atoms, vacancies, and interstitials are calculated with the fission product yields and the kinetic energy distribution of the fission products. Grain boundaries, gas bubbles, and dislocations are treated as sink and emission sites of defects. The description of the cluster dynamics model of defect evolution is given in (Hu et al., 2020). In this work, we focused on the static or dynamic interaction between elastic-plastic deformation and gas bubbles. For simplicity, we assumed that interstitial concentration is low and fission gas Xe atoms occupy the vacancy or vacancy cluster sites. For a given Xe concentration, the vacancy concentration affects thermodynamic and kinetic properties such as lattice mismatch and diffusivity. So only Xe concentration
The KKS model (Kim et al., 1999) is used to describe the gas bubble evolution in polycrystalline UMo. The total free energy
where V is the material volume of the simulation cell,
For simplicity, the free-energy densities are approximated as quadratic functions of concentrations:
where
The KKS model assumes that 1) at any material point the chemical potentials of the matrix and gas bubble phases are the same; and 2) Xe concentration is conserved. These two assumptions are described as:
From Eqs 6, 7, we obtain a single solution of
The temporal evolution of the field variables are given by Allen-Cahn (Cahn and Allen, 1977) and Cahn-Hilliard (Cahn, 1961) equations:
where
There are three unknown model parameters in the evolution Eqs 8, 9, i.e.,
where
Elastic-Plastic Deformation Under Crystal Plasticity Framework
With the assumption of small deformation, the deformation energy density can be calculated by:
where
The elastic strain is expressed as
where
where
According to crystal plasticity theory, the plastic strain rate at the point
where
where
We use
where
Assuming that gas bubble phase has isotropic elastic constants
To calculate deformation energy density in Eq. 12, we need to solve the shear strain rate
Here we summarize the method as follows. At time
where
The Euler implicit time discretization scheme is used to solve the solution of Eq. 21. The expression, in small strains, of the stress tensor at material point r at
where
and associated boundary conditions.
For known plastic deformation strain
Step 1. Seek solutions of
by removing the superscript
The strains,
We use iteration and FFT to solve Eqs 25, 27 and let the obtained stresses and displacements satisfy the given boundary condition. The boundary condition is satisfied in the concept of average values. For example,
(1) For a polycrystal under uniaxial tensile stress along the x1-axis with a strain rate of
(2) For a polycrystal under a constant pressure stress
Stresses,
Step 2. To get the final solutions of
where
where the superscript l denotes the l-th iteration step. The iteration is stopped when
For materials with strength hardening,
Through Steps 1 and 2,
Material Properties of UMo
The thermal and mechanical properties of UMo that depend on temperature and neutron fluence (Medvedev et al., 2018) have been assessed by experiments (Farrell and King, 1979; Polkinghorne and Lacy, 1991; Kaufman, 1999; Farrell; Meyer et al., 2016). The temperature dependence of Young’s modulus
where T is the temperature (K).
The Poisson’s ratio was adapted from (Burkes et al., 2010) and it is constant 0.324. The temperature dependence of yield strength
Since we do not have the yield stress of single crystal UMo, Eq. 32 is used to estimate the critical resolved stress in the crystal plasticity model. Formation energy and migration energy of Xe are calculated by atomistic simulations (Smirnova et al., 2012; Smirnova et al., 2013; Smirnova et al., 2015).
Both experiments and atomistic simulations show that gamma UMo has isotropic elastic properties. Thus, two of the three elastic moduli, i.e., Young’s modulus
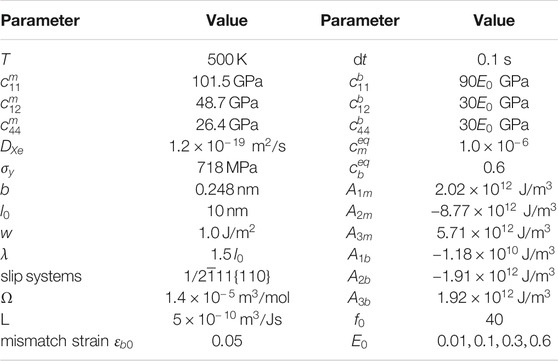
TABLE 1. Model parameters of crystal plasticity and phase-field model of gas bubble evolution for UMo crystals.
Results
Figure 2 illustrates the simulation cell with dimensions of
Effect of Gas Bubble Structures on Mechanical Properties
Three gas bubble structures with gas bubble volume fractions
Stress Field Around Pressured Gas Bubbles
In the elastic-plastic deformation model, the iteration approach (Hu and Chen, 2001) is used to solve the mechanical equilibrium equations and the stress field in an elastic inhomogeneous material with a distribution of stress-free strains as described in Eq. 15. The stress field around gas bubbles with average radius of 50 nm and different internal pressures (
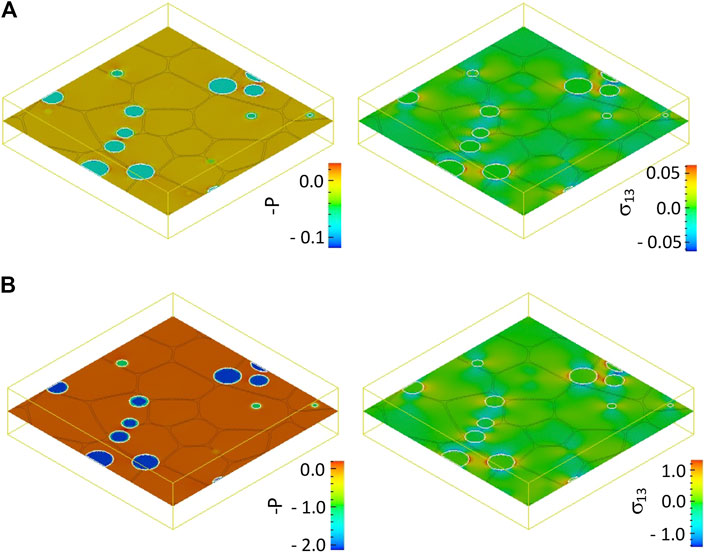
FIGURE 3. Pressure
Effect of Gas Bubble Structures on Stress-Strain Curves
Gas bubble structures with different volume fractions
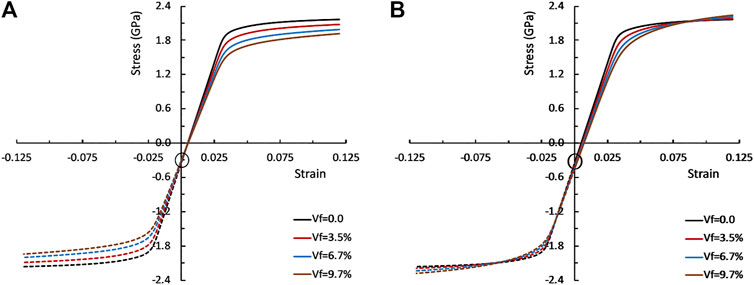
FIGURE 4. Effect of gas bubble volume fraction and internal pressure on stress strain curves. Results shown are for gas bubbles with a pressure of (A)
Comparing the results in Figure 4, we can conclude that 1) for all the cases the effective Young’s modulus, which is the slope at the linear part of the stress-strain curves, decreases with the increase of gas bubble volume fraction. This is expected because the gas phase has a lower Young’s modulus than that of the matrix UMo phase. 2) The Young’s modulus depends on both gas bubble structure (gas bubble volume fraction and internal pressure) and applied stress (tensile or compress). 3) the yield stress decreases with the increase of gas bubble volume fraction. The yield stress has a similar dependence on gas bubble structure and applied stress as that of the Young’s modulus; and 4) the hardening coefficient increases with the increase of gas bubble volume fraction, especially for gas bubbles with higher internal pressures, which is indicated by the slop of stress-strain curves in the plastic deformation stage.
The strain hardening is determined by the plastic strain rate. The distributions of plastic strain
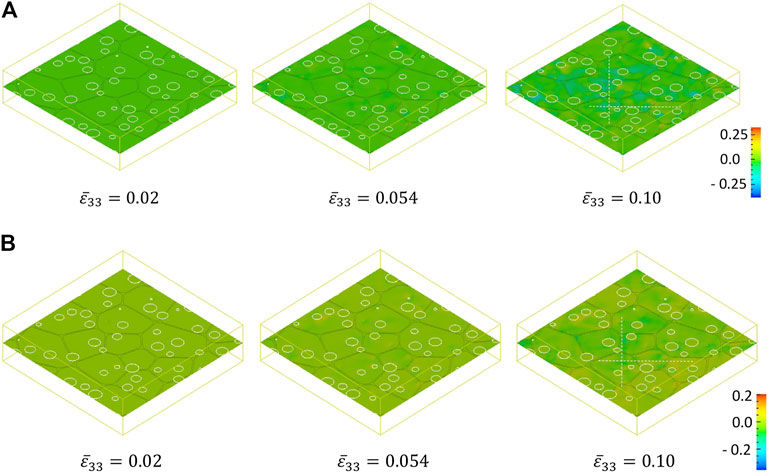
FIGURE 5. Distributions of plastic strain
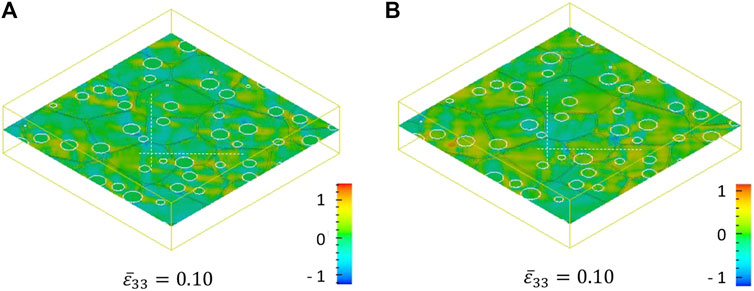
FIGURE 6. Distribution of shear stress
For a given gas bubble structure, the average pressures
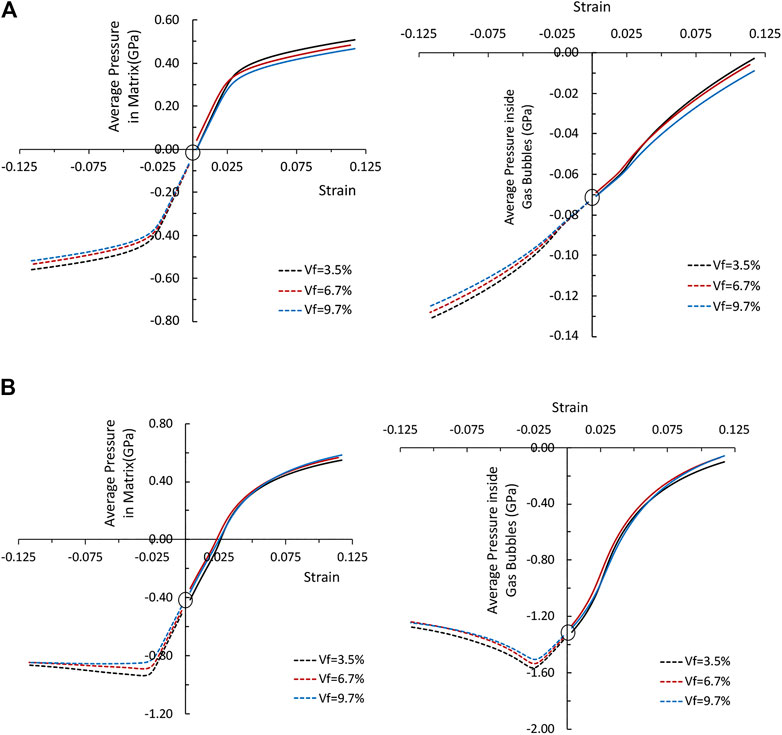
FIGURE 7. Average pressure vs applied strain in matrix and inside gas bubbles in UMo with gas bubbles, (A) for gas bubbles with initial internal pressure 0.07 GPa, and (B) for gas bubbles with initial internal pressure 1.2 GPa.
Effect of Elastic-Plastic Deformation on Gas Bubble Evolution
The gas bubble evolution model presented in Section Phase-Field Model of Gas Bubble Evolution in Polycrystalline UMo Under Elastic-Plastic Deformation requires thermodynamic and kinetic properties including diffusivities and the equilibrium concentration of Xe in the matrix and inside gas bubbles. We describe the diffusivity and equilibrium concentration as a function of average pressure in the matrix and inside gas bubbles. In principle, these thermodynamic and kinetic properties can be obtained from atomic simulations (Valikova and Nazarov, 2008; Sueoka et al., 2012). For instance, the equation of state of Xe gas phase can be used to determine the correlation between the equilibrium Xe concentration and pressure inside gas bubbles. The pressure dependent formation energy of Xe in the matrix can be used to develop the chemical free energy of Xe in the matrix phase, and the pressure dependent migration energy can be used to assess the correlation between Xe diffusivity and pressure. Since we don’t have the data for UMo, a linear correlation of the thermodynamic and kinetic properties in terms of pressure near the equilibrium state are used to validate the effect of elastic-plastic deformation on gas bubbles.
In the simulations, an initial Xe concentration of 0.005 and distributed gas bubbles with a volume fraction 3.5% and initial pressure 2.1 GPa are introduced into polycrystalline UMo. The stress-free strain,
The simulations are carried out in three steps: 1) apply a strain rate,
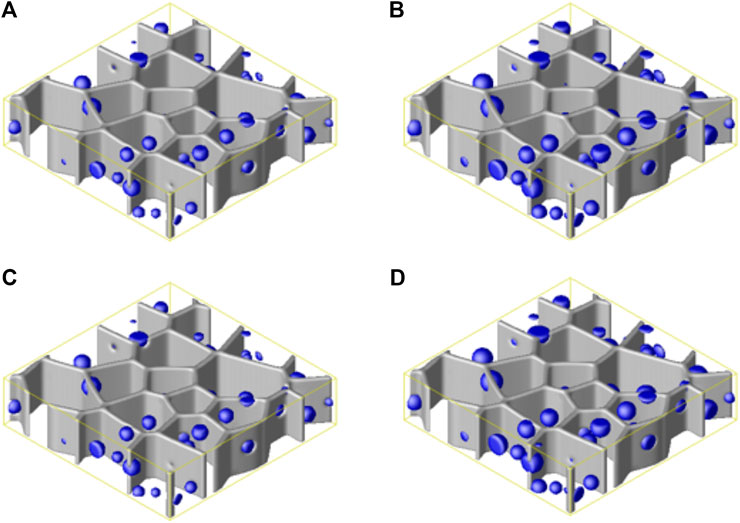
FIGURE 8. Gas bubble structures at time
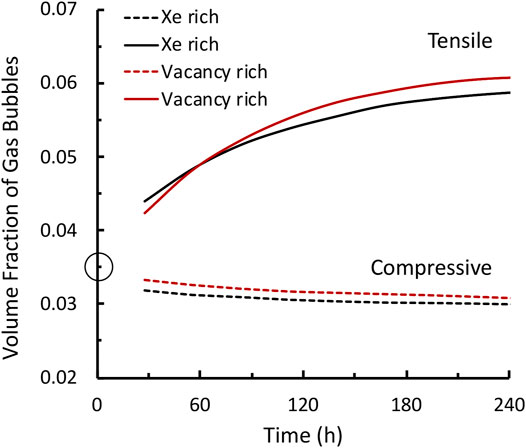
FIGURE 9. Effect of local stress state and thermodynamic and kinetic properties of defects on gas bubble evolution.
Figure 10 shows the Xe concentration distribution on the center plane S at time
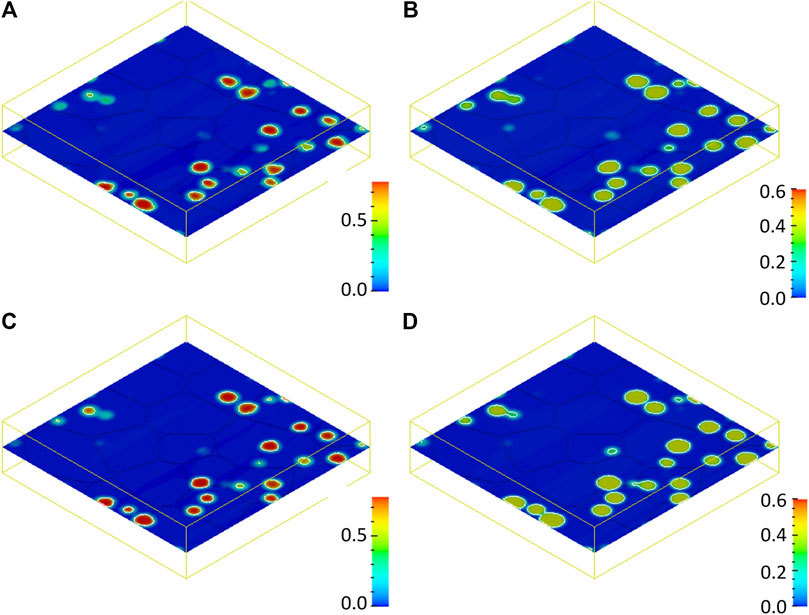
FIGURE 10. Xe concentration distribution on the center plane S at time
Conclusion
In this work we developed a phase-field model of gas bubble evolution in polycrystalline UMo under elastic-plastic deformation. Plastic strain rate-based crystal plasticity is employed to describe the elastic-plastic deformation. The effect of local pressure on the thermodynamic and kinetic properties of Xe is taken into account. With the developed model, we simulated the effect of gas bubble structures (different volume fraction and internal pressure) on stress-strain curves and the effect of local stress fields on gas bubble evolution. The results show that 1) the effective Young’s modulus decreases with the increase of gas bubble volume fraction; 2) the yield stress decreases with the increase of gas bubble volume fraction; 3) the hardening coefficient increases with the increase of gas bubble volume fraction, especially for gas bubbles with higher internal pressure; 4) a tensile stress state leads to gas bubble growth while a compressive stress states causes a slight shrink of gas bubbles; 5) a vacancy rich environment promotes gas bubble growth under a tensile stress state while preventing gas bubble shrinkage under a compressive stress state; and 6) an inhomogeneous stress field around the gas bubble results in an inhomogeneous plastic deformation, pressure, and non-uniform equilibrium concentration, hence, an irregular gas bubble shape. The results demonstrate that the developed model is capable of studying the effect of gas bubble structures on mechanical properties and studying the dynamic interaction between elastic-plastic deformation and evolving gas bubbles. However, additional thermodynamic and kinetic properties, such as the effect of pressure on chemical free energy and mobility of Xe in matrix and gas phases, are required for more quantitative simulations. The model also needs to be extended to take radiation defect accumulation and potential creep deformation into account.
Data Availability Statement
The original contributions presented in the study are included in the article/Supplementary Material, further inquiries can be directed to the corresponding author.
Author Contributions
SH: model and code development, simulation, visualization, and writing-original draft and editing. BB: conceptualization, writing-review and editing.
Funding
This work was supported by the U.S. Department of Energy, National Nuclear Security Administration Office of Material Management and Minimization, under DE-AC07–05ID14517. Pacific Northwest National Laboratory is a multiprogram national laboratory operated by Battelle Memorial Institute for the U.S. Department of Energy under DE-AC05–76RL01830. Computations were performed on the Constance cluster at Pacific Northwest National Laboratory.
Conflict of Interest
The authors declare that the research was conducted in the absence of any commercial or financial relationships that could be construed as a potential conflict of interest.
Supplementary Material
The Supplementary Material for this article can be found online at: https://www.frontiersin.org/articles/10.3389/fmats.2021.682667/full#supplementary-material.
References
Beeler, B., Hu, S., Zhang, Y., and Gao, Y. (2020). A Improved Equation of State for Xe Gas Bubbles in γU-Mo Fuels. J. Nucl. Mater. 530, 151961. doi:10.1016/j.jnucmat.2019.151961
Beghi, G. (1968). Gamma Phase Uranium-Molybdenum Fuel Alloys. EURATOM Report No: EUR-4053e. Brussels, Europe: European Atomic Energy Community-EURATOM. Van Muysewinkel, Ispra - Italy.
Brimbal, D., Fournier, L., and Barbu, A. (2016). Cluster Dynamics Modeling of the Effect of High Dose Irradiation and Helium on the Microstructure of Austenitic Stainless Steels. J. Nucl. Mater. 468, 124–139. doi:10.1016/j.jnucmat.2015.11.007
Burkes, D. E., G. S., K., and Wachs, D. M., Thermaphysical Properties of U-10Mo Alloy. INL/EXT-10-19373, (2010).
Burkes, D. E., Papesch, C. A., Maddison, A. P., Hartmann, P. J., and Rice, F. J. (2010). Thermo-physical Properties of DU-10 wt.% Mo Alloys. J. Nucl. Mater. 403 (1-3), 160–166. doi:10.1016/j.jnucmat.2010.06.018
Cahn, J. W., and Allen, S. M. (1977). A Microscopic Theory for Domain Wall Motion and its Experimental Verification IN Fe-Al Alloy Domain Growth Kinetics. J. Phys. Colloques. 38, C7–C51. doi:10.1051/jphyscol:1977709
Cahn, J. W. (1961). On Spinodal Decomposition. Acta Metallurgica 9 (9), 795–801. doi:10.1016/0001-6160(61)90182-1
Chen, L.-Q. (2002). Phase-field Models for Microstructure Evolution. Annu. Rev. Mater. Res. 32, 113–140. doi:10.1146/annurev.matsci.32.112001.132041
Cheng, T.-L., Wen, Y.-H., and Hawk, J. A. (2019). Diffuse Interface Approach to Modeling crystal Plasticity with Accommodation of Grain Boundary Sliding. Int. J. Plasticity 114, 106–125. doi:10.1016/j.ijplas.2018.10.012
Cottura, M., Appolaire, B., Finel, A., and Le Bouar, Y. (2016). Coupling the Phase Field Method for Diffusive Transformations with Dislocation Density-Based crystal Plasticity: Application to Ni-Based Superalloys. J. Mech. Phys. Sol. 94, 473–489. doi:10.1016/j.jmps.2016.05.016
Deutchman, H. Z., Phillips, P. J., Zhou, N., Samal, M. K., Ghosh, S., Wang, Y., et al. (2012). “Deformation Mechanisms Coupled With Phase Field And Crystal Plasticity Modeling In A High Temperature Polycrystalline Ni-Based Superalloy,” in Superalloys 2012: 12th International Symposium on Syperalloys. TMS. doi:10.7449/2012/superalloys_2012_25_33
Eshelby, J. D. (1957). The Determination of the Elastic Field of an Ellipsoidal Inclusion, and Related Problems. Proceeding R. Soc. A 241 (1226), 376–396.
Farrell, K., and King, R. (1979). “Tensile Properties of Neutron- Irradiated 6061 Aluminum Alloy in Annealed and Precipitation-Hardened Conditions,” in Effects of Radiation on Structural Materials. Editor J. Sprague, and D. Kramer (West Conshohocken, PA: ASTM International), 440–449. doi:10.1520/STP38180S
Farrell, K. Assessment Of Aluminum Structural Materials For Service Within The ANS Reflector Vessel in Report Number ORNL/TM-13049. 1995. Oak Ridge/TN: Oak Rige National Laboratory. doi:10.2172/201578
Gan, J., Miller, B. D., Keiser, D. D., Jue, J. F., Madden, J. W., Robinson, A. B., et al. (2017). Irradiated Microstructure of U-10Mo Monolithic Fuel Plate at Very High Fission Density. J. Nucl. Mater. 492, 195–203. doi:10.1016/j.jnucmat.2017.05.035
Harrison, J. W. (1969). An Extrapolated Equation of State for Xenon for Use in Fuel Swelling Calculations. J. Nucl. Mater. 31 (1), 99–106. doi:10.1016/0022-3115(69)90047-6
Hochrainer, T., Sandfeld, S., Zaiser, M., and Gumbsch, P. (2014). Continuum Dislocation Dynamics: Towards a Physical Theory of crystal Plasticity. J. Mech. Phys. Sol. 63, 167–178. doi:10.1016/j.jmps.2013.09.012
Hochrainer, T. (2016). Thermodynamically Consistent Continuum Dislocation Dynamics. J. Mech. Phys. Sol. 88, 12–22. doi:10.1016/j.jmps.2015.12.015
Hu, S. Y., and Chen, L. Q. (2001). A Phase-Field Model for Evolving Microstructures with strong Elastic Inhomogeneity. Acta Materialia 49 (11), 1879–1890. doi:10.1016/s1359-6454(01)00118-5
Hu, S. Y., Murray, J., Weiland, H., Liu, Z. K., and Chen, L. Q. (2007). Thermodynamic Description and Growth Kinetics of Stoichiometric Precipitates in the Phase-Field Approach. Calphad 31 (2), 303–312. doi:10.1016/j.calphad.2006.08.005
Hu, S., Burkes, D. E., Lavender, C. A., Senor, D. J., Setyawan, W., and Xu, Z. (2016). Formation Mechanism of Gas Bubble Superlattice in UMo Metal Fuels: Phase-Field Modeling Investigation. J. Nucl. Mater. 479, 202–215. doi:10.1016/j.jnucmat.2016.07.012
Hu, S., Joshi, V., and Lavender, C. A. (2017). A Rate-Theory-Phase-Field Model of Irradiation-Induced Recrystallization in UMo Nuclear Fuels. JOM 69 (12), 2554–2562. doi:10.1007/s11837-017-2611-4
Hu, S., Setyawan, W., Joshi, V. V., and Lavender, C. A. (2017). Atomistic Simulations of Thermodynamic Properties of Xe Gas Bubbles in U10Mo Fuels. J. Nucl. Mater. 490, 49–58. doi:10.1016/j.jnucmat.2017.04.016
Hu, S. Y., Setyawan, W., Beeler, B. W., Gan, J., and Burkes, D. E. (2020). Defect Cluster and Nonequilibrium Gas Bubble Associated Growth in Irradiated UMo Fuels – a Cluster Dynamics and Phase Field Model. J. Nucl. Mater. 542, 152441. doi:10.1016/j.jnucmat.2020.152441
Kaufman, J. G. (1999). Properties of aluminum alloys: tensile, creep and fatigue data at high and low temperatures. 3rd Edn. Novelty, OH: ASM International.
Kim, S. G., Kim, W. T., and Suzuki, T. (1999). Phase-field Model for Binary Alloys. Phys. Rev. E 60 (6), 7186–7197. doi:10.1103/physreve.60.7186
Kim, Y. S., Hofman, G. L., and Cheon, J. S. (2013). Recrystallization and Fission-Gas-Bubble Swelling of U-Mo Fuel. J. Nucl. Mater. 436 (1-3), 14–22. doi:10.1016/j.jnucmat.2013.01.291
Klein, J. L. “Uranium and its Alloys,” in Nuclear Reactor Fuel Elements. Editor A. R. Kaufmann 1662 (New York, NY: Wiley), 31.
Kohnert, A. A., and Wirth, B. D. (2015). Cluster Dynamics Models of Irradiation Damage Accumulation in Ferritic Iron. II. Effects of Reaction Dimensionality. J. Appl. Phys. 117 (15), 154306. doi:10.1063/1.4918316
Kohnert, A. A., Wirth, B. D., and Capolungo, L. (2018). Modeling Microstructural Evolution in Irradiated Materials with Cluster Dynamics Methods: A Review. Comput. Mater. Sci. 149, 442–459. doi:10.1016/j.commatsci.2018.02.049
Koslowski, M., and Ortiz, M. (2004). A Multi-phase Field Model of Planar Dislocation Networks. Model. Simul. Mater. Sci. Eng. 12 (6), 1087–1097. doi:10.1088/0965-0393/12/6/003
Koslowski, M., Cuitiño, A. M., and Ortiz, M. (2002). A Phase-Field Theory of Dislocation Dynamics, Strain Hardening and Hysteresis in Ductile Single Crystals. J. Mech. Phys. Sol. 50 (12), 2597–2635. doi:10.1016/s0022-5096(02)00037-6
Lebensohn, R. A., Kanjarla, A. K., and Eisenlohr, P. (2012). An Elasto-Viscoplastic Formulation Based on Fast Fourier Transforms for the Prediction of Micromechanical fields in Polycrystalline Materials. Int. J. Plasticity 32-33, 59–69. doi:10.1016/j.ijplas.2011.12.005
Ma, A., and Roters, F. (2004). A Constitutive Model for Fcc Single Crystals Based on Dislocation Densities and its Application to Uniaxial Compression of Aluminium Single Crystals. Acta Materialia 52 (12), 3603–3612. doi:10.1016/j.actamat.2004.04.012
Ma, A., Roters, F., and Raabe, D. (2006). A Dislocation Density Based Constitutive Model for crystal Plasticity FEM Including Geometrically Necessary Dislocations. Acta Materialia 54 (8), 2169–2179. doi:10.1016/j.actamat.2006.01.005
Mansur, L. K. (1994). Theory and Experimental Background on Dimensional Changes in Irradiated Alloys. J. Nucl. Mater. 216, 97–123. doi:10.1016/0022-3115(94)90009-4
Medvedev, P. G., Ozaltun, H., Robinson, A. B., and Rabin, B. H. (2018). Shutdown-induced Tensile Stress in Monolithic Miniplates as a Possible Cause of Plate Pillowing at Very High Burnup. Nucl. Eng. Des. 328, 161–165. doi:10.1016/j.nucengdes.2018.01.004
Meyer, M. K., Gan, J., Jue, J. F., Keiser, D. D., Perez, E., Robinson, A., et al. (2014). Irradiation Performance of U-Mo Monolithic Fuel. Nucl. Eng. Technol. 46 (2), 169–182. doi:10.5516/net.07.2014.706
Meyer, M., Rabin, B. H., Cole, J., Glagolenko, I., Jones, W., Jue, J. F., et al. (2016). Research and Development Report for U-Mo Monolithic Fuel. Technical Report, INL/EXT-17-40975. Idaho Falls: Idaho National Laboratory.
Meyer, M., Rabin, B. H., Cole, J., Glagolenko, I., Jones, W., Jue, J. F., et al. (2017). Preliminary Report on U-Mo Monolithic Fuel for Research Reactors. Technical Report, INL/EXT-17-40975. Idaho Falls: Idaho National Laboratory.
Miller, G. K., Burkes, D. E., and Wachs, D. M. (2010). Modeling thermal and Stress Behavior of the Fuel-Clad Interface in Monolithic Fuel Mini-Plates. Mater. Des. 31 (7), 3234–3243. doi:10.1016/j.matdes.2010.02.016
Miller, B. D., Gan, J., Keiser, D. D., Robinson, A. B., Jue, J. F., Madden, J. W., et al. (2015). Transmission Electron Microscopy Characterization of the Fission Gas Bubble Superlattice in Irradiated U–7 wt%Mo Dispersion Fuels. J. Nucl. Mater. 458, 115–121. doi:10.1016/j.jnucmat.2014.12.012
Ozaltun, H., and Rabin, B. H. (2017). Thermo-mechanical Performance Assessment of Selected Plates from MP-1 High Power Experiments, in Proceedings of the ASME 2017 Nuclear Forum collocated with the ASME 2017 Power Conference Joint With ICOPE-17, the ASME 2017 11th International Conference on Energy Sustainability, and the ASME 2017 15th International Conference on Fuel Cell Science, Engineering and Technology. ASME 2017 Nuclear Forum, Charlotte, NC, June 26–30, 2017. ASME. doi:10.1115/nuclrf2017-3271
Polkinghorne, S. T., and Lacy, J. M. (1991). Thermo-physical and Mechanical Properties of ATR Core Materials. EG&G Inc. Technical Report, PG-T-91-031. Idaho Falls: Idaho National Laboratory.
Smirnova, D. E., Starikov, S. V., and Stegailov, V. V. (2012). New Interatomic Potential for Computation of Mechanical and Thermodynamic Properties of Uranium in a Wide Range of Pressures and Temperatures. Phys. Met. Metallogr. 113 (2), 107–116. doi:10.1134/s0031918x12020147
Smirnova, D. E., Kuksin, A. Y., Starikov, S. V., Stegailov, V. V., Insepov, Z., Rest, J., et al. (2013). A Ternary EAM Interatomic Potential for U-Mo Alloys with Xenon. Model. Simulation Mater. Sci. Eng. 21 (3), 1–24. doi:10.1088/0965-0393/21/3/035011
Smirnova, D. E., Kuksin, A. Y., Starikov, S. V., and Stegailov, V. V. (2015). Atomistic Modeling of the Self-Diffusion in γ-U and γ-U-Mo. Phys. Met. Metallogr. 116 (5), 445–455. doi:10.1134/s0031918x1503014x
Sueoka, K., Kamiyama, E., and Kariyazaki, H. (2012). A Study on Density Functional Theory of the Effect of Pressure on the Formation and Migration Enthalpies of Intrinsic point Defects in Growing Single crystal Si. J. Appl. Phys. 111 (9), 093529. doi:10.1063/1.4712632
Tsukada, Y., Murata, Y., Koyama, T., Miura, N., and Kondo, Y. (2011). Creep Deformation and Rafting in Nickel-Based Superalloys Simulated by the Phase-Field Method Using Classical Flow and Creep Theories. Acta Materialia 59 (16), 6378–6386. doi:10.1016/j.actamat.2011.06.050
Valikova, I. V., and Nazarov, A. V. (2008). Simulation of Characteristics Determining Pressure Effects on the Concentration and Diffusivity of Vacancies in BCC Metals: A New Approach. Phys. Met. Metallogr. 105 (6), 544–552. doi:10.1134/s0031918x08060033
Vladimirov, I. N., Reese, S., and Eggeler, G. (2009). Constitutive Modelling of the Anisotropic Creep Behaviour of Nickel-Base Single crystal Superalloys. Int. J. Mech. Sci. 51 (4), 305–313. doi:10.1016/j.ijmecsci.2009.02.004
Wu, R., and Sandfeld, S. (2017). A Dislocation Dynamics-Assisted Phase Field Model for Nickel-Based Superalloys: The Role of Initial Dislocation Density and External Stress during Creep. J. Alloys Compd. 703, 389–395. doi:10.1016/j.jallcom.2017.01.335
Xiao, H. X., and Long, C. S. (2014). A Modified Equation of State for Xe at High Pressures by Molecular Dynamics Simulation. Chin. Phys. B 23 (2), 1–5. doi:10.1088/1674-1056/23/2/020502
Yan, F., Jian, X., and Ding, S. (2019). Effects of UMo Irradiation Creep on the Thermo-Mechanical Behavior in Monolithic UMo/Al Fuel Plates. J. Nucl. Mater. 524, 209–217. doi:10.1016/j.jnucmat.2019.07.006
Yang, M., Zhang, J., Wei, H., Gui, W., Su, H., Jin, T., et al. (2018). A Phase-Field Model for Creep Behavior in Nickel-Base Single-crystal Superalloy: Coupled with Creep Damage. Scripta Materialia 147, 16–20. doi:10.1016/j.scriptamat.2017.12.008
Keywords: gas bubble, UMo fuel, mechanical property, elastic-plastic deformation, phase-field model
Citation: Hu S and Beeler B (2021) Gas Bubble Evolution in Polycrystalline UMo Fuels Under Elastic-Plastic Deformation: A Phase-Field Model With Crystal-Plasticity. Front. Mater. 8:682667. doi: 10.3389/fmats.2021.682667
Received: 18 March 2021; Accepted: 04 May 2021;
Published: 07 June 2021.
Edited by:
Shiyu Du, Ningbo Institute of Materials Technology & Engineering (CAS), ChinaReviewed by:
Yaolin Guo, Ningbo Institute of Materials Technology & Engineering (CAS), ChinaShurong Ding, Fudan University, China
Copyright © 2021 Hu and Beeler. This is an open-access article distributed under the terms of the Creative Commons Attribution License (CC BY). The use, distribution or reproduction in other forums is permitted, provided the original author(s) and the copyright owner(s) are credited and that the original publication in this journal is cited, in accordance with accepted academic practice. No use, distribution or reproduction is permitted which does not comply with these terms.
*Correspondence: Shenyang Hu, c2hlbnlhbmcuaHVAcG5ubC5nb3Y=