 Liang Li
 Haoyue Hao*
- School of Physics and Optoelectronic Engineering, Shandong University of Technology, Zibo, China
In this study, the up-conversion luminescence and optical temperature sensing properties of Ho3+/Tm3+/Yb3+-co-doped NaLuF4 phosphors were investigated. The visible (475, 540, and 650 nm) and near-infrared light (692 and 800 nm) radiated from 1Ho3+/4Tm3+/Yb3+-co-doped NaLuF4 phosphors were obvious enough for subsequent detection. The slopes in the lnI–lnP plot of the emissions located in the first biological window (650, 692, and 800 nm) were both ∼1.5, which mean that the power had little effect on the three fluorescence peak ratios. Based on the florescence intensity ratios (FIRs) of 650 and 692 nm, the relative sensing sensitivity reaches 0.029 K−1 (476 K). The relative sensing sensitivity based on the FIRs of 800 and 692 nm reaches 0.0076 K−1 (476 K). The results reveal that 1Ho3+/4Tm3+/Yb3+-co-doped NaLuF4 phosphors have potential applications in FIR-based temperature sensing in biological tissue for their high sensing sensitivity. In addition, the emission colors of the sample stabilize in the white light region as the temperature increased from 303 to 467 K, implying that it can also be used in white display.
Introduction
Temperature (T) is a basic physical parameter in scientific research, production, and living. Therefore, it is crucial to obtain accurate T. Traditional methods of temperature measurement are based on different thermometers, thermal resistance, thermocouples, semiconductor temperature sensor, etc. However, these methods require the physical contact with the object and cannot be used in a corrosive environment or organism. To overcome this issue, numerous types of luminescent thermometers, made up of quantum dots, polymer-based systems, organic dyes, and lanthanide ion (Ln3+)–doped materials, have been investigated (Feng et al., 2011; Vlaskin et al., 2010; Yan et al., 2010; Jia et al., 2020). Among these luminescent thermometers, Ln3+-doped up-conversion materials have drawn extensive attention in the research of non-invasive temperature measurement due to their fast response, high resolution, low toxicity, remote detection, and so on (Labrador-Páez et al., 2018; Ximendes et al., 2016; Skripka et al., 2017; Nexha et al., 2021). In recent years, the florescence intensity ratio (FIR) from the Ln3+-doped up-conversion materials has often been utilized in thermometry, rather than emission lifetime, peak position, and emission color (Runowski et al., 2019; Yuan et al., 2017; Qiu et al., 2020; Du et al., 2018). The FIR temperature sensing method is based on the emissions, radiated from thermally coupled energy levels (200 cm−1<ΔE<2000 cm−1) (Runowski et al., 2019; Yuan et al., 2017; Du et al., 2018) or non-thermally coupled energy levels (ΔE>2000 cm−1 or different Ln3+) (Han et al., 2019; Peng et al., 2021; Chen et al., 2015). Er3+ ion is promising in FIR temperature sensing for its bright green emission from 2H11/2/4S3/2 and excellent thermal coupling property owing to the suitable energy gap (700–800 cm−1), whereas the sensing sensitivity is restricted by the constant energy gap (Xiang et al., 2020; Wang et al., 2018). As far as we know, the sensing sensitivity value is decided by the variation rate of FIR with the temperature. Thus, many strategies are utilized to improve sensitivity, such as choosing the suitable co-doped ions (Lu et al., 2017), changing the suitable host (Huang et al., 2015), distorting local symmetric (Xiang et al., 2020), and using stark sublevels (Suo et al., 2018), while the commonly used fluorescence peaks are located in the visible range, like 520 and 550 nm from Er3+, which limit the penetration depth in biological tissues. Therefore, the selected emissions should be located in biological windows to decrease light scattering when they were used in biological tissue temperature sensing (Runowski et al., 2019; del Rosal et al., 2017).
In this study, the emissions (450–850 nm) from Ho3+/Tm3+/Yb3+-co-doped NaLuF4 phosphors are systemically investigated. High absolute and relative temperature sensitivity can be achieved via choosing suitable FIR. Moreover, the slopes in the lnI–lnP plot of emissions located in the first biological window (650, 692 and 800 nm) are both ∼1.5, which means that power has little effect on the three fluorescence peak ratios. We can take the advantages of these and detect the three emissions for non-invasive temperature measure in biological tissues.
Experimental Details
Sample Preparation
Materials
Lu(NO3)3·6H2O (99.9%), Yb(NO3)3·6H2O (99.9%), Tm(NO3)3·6H2O (99.9%), and Ho(NO3)3·6H2O (99.9%) were all purchased from Jining Zhong Kai New Type Material Science Co., Ltd. Ammonium fluoride (AR), sodium hydroxide (AR), oleic acid (AR), and cyclohexane (AR) were purchased from Tianjin Tianli Chemical reagent Co. Ltd. All the chemicals were used directly without further purification.
Preparation of NaLuF4:1 mol% Ho3+, 4 mol% Tm3+, and 20 mol% Yb3+ Phosphors
The NaLuF4:1 mol% Ho3+, 4 mol% Tm3+, and 20 mol% Yb3+ phosphors were prepared using a typical hydrothermal method. The preparation processes of NaLuF4: Ho3+, Tm3+, and Yb3+ phosphors were as follows. First, calculated amounts of sodium hydroxide were dissolved into 2 ml deionized water. Second, 10 ml absolute ethyl alcohol and 18 ml oleic acid were added in the nitrate solution and then stirred for 5 min at room temperature to form a faint yellow solution. Third, 5 ml aqueous solution was then added, which contained a calculated amount of Lu(NO3)3·6H2O, Yb(NO3)3·6H2O, Ho(NO3)3·6H2O, and Tm(NO3)3·6H2O C6H8O7·H2O and 5 ml ammonium fluoride aqueous solution. After stirring for 30 min at room temperature, the mixed solution was transferred into a 50-ml autoclave and heated at 180°C for 12 h in a drying oven. After cooling down to room temperature and adding ethanol and cyclohexane, the khaki suspension was centrifuged (8,000 rpm, 2 min) for collection and washed three times with ethanol and deionized water. Finally, phosphors were obtained after drying at 60°C for 10 h.
Instruments
The X-ray diffraction (XRD) pattern of the sample was tested using an X-ray diffractometer (D8-02, Bruker AXS, Germany). The morphology was tested using a transmission electron microscope (TEM: Tecnai G2F 20, FEI, America). The spectra of the samples were tested with an iHR550 grating spectrograph (iHR550, Horiba, France). The 980-nm laser, used to excite the sample, was purchased from Beijing Kipling Photoelectric technology Co., Ltd. The sample was heated by the Linkam THMS 600 heating stage. The temperature of sample was monitored by thermocouple.
Results and Discussions
XRD Analysis
The XRD pattern of NaLuF4: Ho3+, Tm3+, and Yb3+ phosphors is presented in Figure 1. We can find that the XRD patterns of the samples can be indexed to a hexagonal NaLuF4 crystal (the JCPDS standard card no. 27-0726), indicating that the dopants (Ho3+, Tm3+, and Yb3+ ions) were successfully incorporated into the host lattice and did not cause significant changes to the crystal structure. The inset showed the TEM images of the sample and the morphology was approximately rod-like.
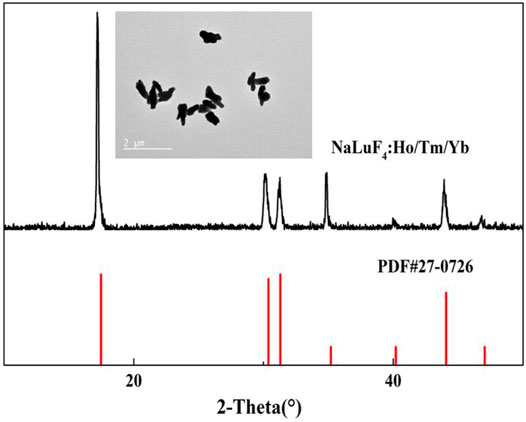
FIGURE 1. XRD patterns of NaLuF4: Ho3+, Tm3+, and Yb3+ phosphors (the inset displays the TEM image of the phosphors).
Power-dependent Up-Conversion Luminescence
Figure 2 showed the room temperature up-conversion luminescence of NaLuF4: Ho3+, Tm3+, and Yb3+ phosphors. Under 980-nm laser excitation, the sample exhibited five obvious emission bands centered at 475, 540, 650, 692, and 800 nm. The emissions were attributed to 1G4→3H6 (Tm3+), 5S2/5F4→5I8 (Ho3+), 1G4→3F4 (Tm3+)/5F5→5I8 (Ho3+), 3F2/3→3H6 (Tm3+), and 3H4→3H6 (Tm3+). It was obvious that the Ho3+, Tm3+, and Yb3+-co-doped NaLuF4 could provide visible light (475, 540, 650 and 692 nm), which can be used for colorful displaying. Meanwhile, the emissions (650, 692, and 800 nm) located in the first biological window can be utilized to florescent location and temperature detection in biological tissue.
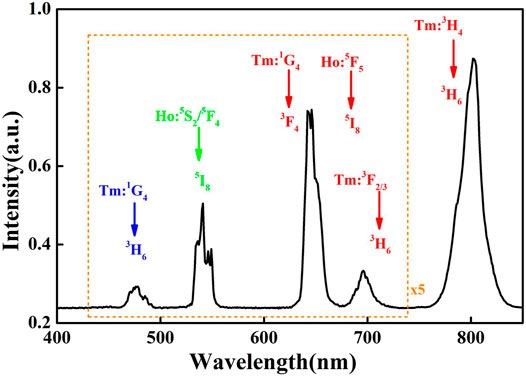
FIGURE 2. Up-conversion spectra of the sample under the excitation of 980-nm laser (the emission intensities of 475, 540, 650, and 692 nm was magnified five times).
The power-dependent up-conversion spectra of the sample are exhibited in Figure 3A, and the emission intensity increased obviously with the power rising. The relationship between laser power (P) and emission intensity (I) can be expressed as
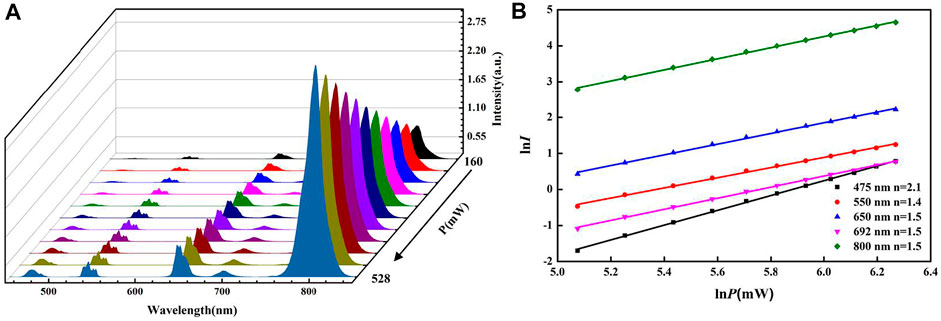
FIGURE 3. (A) Up-conversion spectra with the increasing power of 980-nm laser; (B) lnI–lnP plot.
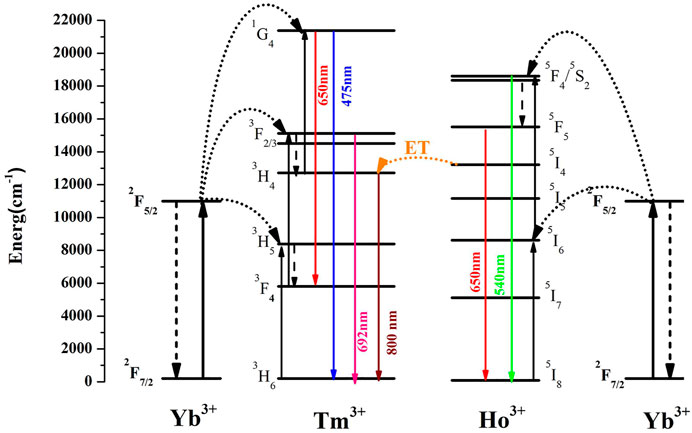
FIGURE 4. Schematic energy levels, possible up-conversion processes, and energy transfer processes in Ho3+, Tm3+, and Yb3+-co-doped materials.
Temperature-dependent Up-Conversion Luminescence Analysis
For FIR-based non-contact thermometry, we studied the temperature-dependent emissions (visible light and the first biological window range) of Ho3+, Tm3+, and Yb3+-co-doped NaLuF4 powder. The temperature-dependent emission spectra are shown in Figure 5A, and the emission intensities changed as the temperature varied from 303 to 476 K (as shown in Figure 5B). In the visible light range, we choose 475 and 550-nm emissions in the FIR-based non-contact thermometry. In addition, the emission colors of the sample stabilized in the white light region as the temperature increased from 303 to 467 K, implying that it can also be used in white display. The detail calculated chromaticity coordinates (x,y) at different temperature are shown in Supplementary Table S1.
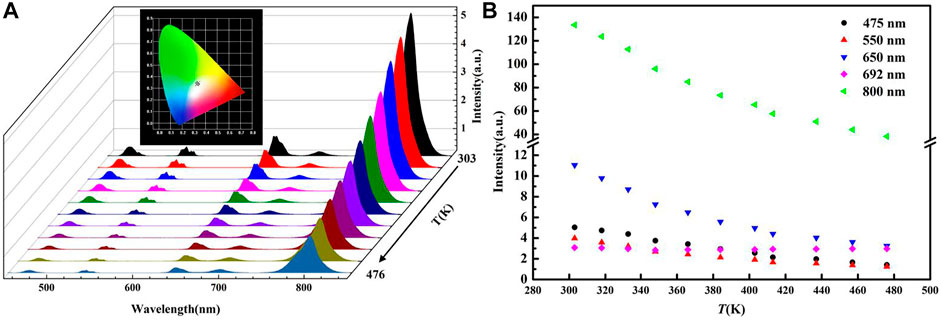
FIGURE 5. (A) Up-conversion luminescence of the sample at different temperature, the inset shows the CIE chromaticity coordinates of the sample at different temperature; (B) temperature-dependent integrated intensity of the emissions located at different wavelength.
Figure 6A showed the ratio (R) of blue to green (R475/550) at varied temperature. The temperature dependence of FIR from the non-thermal coupled levels was commonly fitted by polynomial (Lu et al., 2017). Here, we fitted it by mean of a cubic function
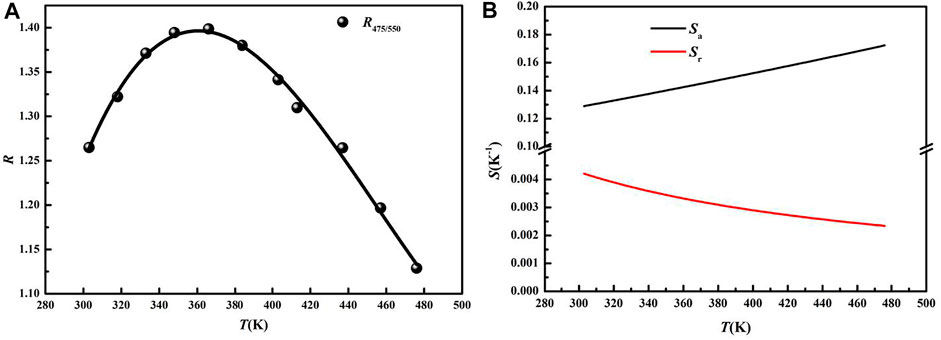
FIGURE 6. (A) Temperature-dependent R475/550; (B) Sa and Sr from 303–476 K.
Figures 7A,B showed the values of R650/692 and R800/692 at different temperatures. The values were fitted via cubic function and the fitting parameters are displayed in Supplementary Table S2. The absolute sensing sensitivity and relative sensing sensitivity are displayed in Figures 8A,B. The maximum values of Sa reached 0.042 K−1 (R650/692) and 0.29 K−1 (R800/692) at 303 K, respectively. The maximum values of Sr reached 0.028 K−1 at 467 K (R650/692) and 0.0076 at 303 K (R800/692). The ratio of emissions in the first biological window showed higher relatively sensing sensitivity than in the visible range, indicating its extensive application value in temperature measurement, especially in biological temperature measurement. To compare the thermometric capacities of this sample, relevant parameters of other related research studies are listed in Table 1. It can be seen that the sensing sensitivities of our samples are relatively high in these studies. In addition, this method is flexible and practical in thermometry application, such as the selection of detection wavelengths, exciting powers, and detection materials.
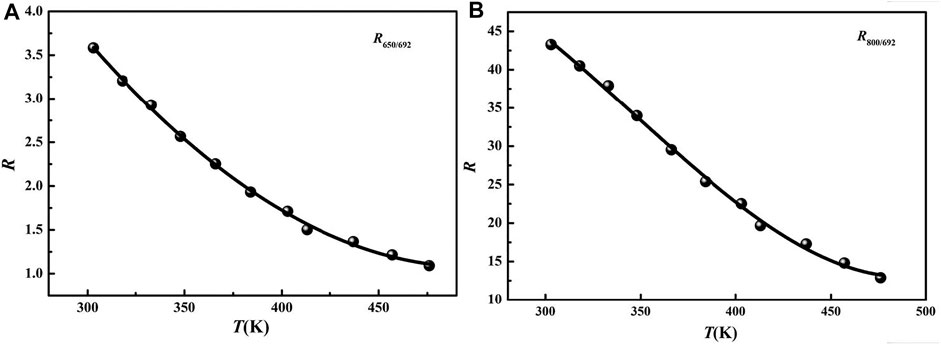
FIGURE 7. Temperature-dependent (A) R650/692 and (B) R800/692.
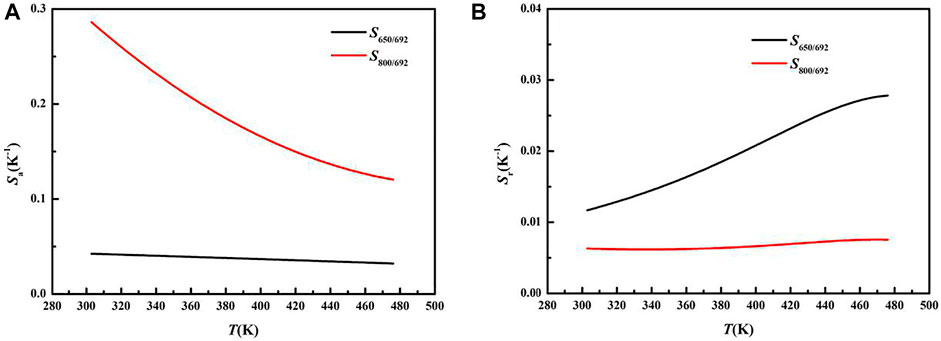
FIGURE 8. Temperature-dependent (A) Sa and (B) Sr of I650/I692 and I800/I692, respectively.
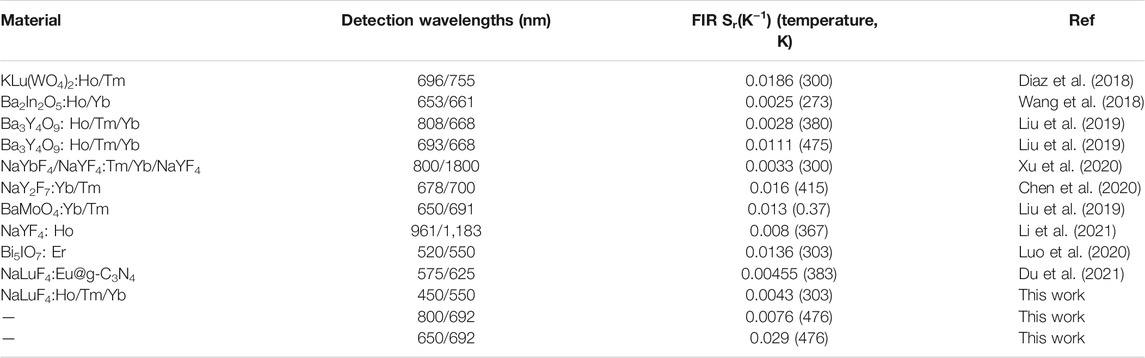
TABLE 1. Comparison of sensing sensitivities in FIR thermometry.
Conclusion
In conclusion, up-conversion luminescence and temperature-dependent emissions of the transitions 1G4→3H6 (475 nm), 5S2/5F4→5I8 (550 nm), 1G4→3F4/5F5→5I8 (650 nm), 3F2/3→3H6 (692 nm), and 3H4→3H6 (800 nm) from Ho3+/Tm3+/Yb3+-co-doped NaLuF4 phosphors were studied under 980 excitation, and the slopes in the lnI–lnP plot of the emissions were ∼2.1, ∼1.4, ∼1.5, ∼1.5, and ∼1.5, respectively. It implied that the 475, 540, 650, 692, and 800-nm emissions were three-photon, two-photon, two-photon, two-photon, and two-photon processes, respectively. More importantly, the values of n for the emissions located in the first biological window were similar to each other, which means that power had little effect on the three fluorescence peak ratios. Based on FIRs of 450 and 550 nm, Sr reached 0.0043 K−1. Based on the emissions in the first biological window (R650/692 and R800/692), Sr reached 0.29 and 0.0076 K−1, respectively. The result reveals that 1Ho3+/4Tm3+/Yb3+-co-doped NaLuF4 phosphors have potential applications in FIR-based temperature sensing in biological tissue for their high sensing sensitivity. In addition, the emission colors of the sample stabilized in the white light region as the temperature increased from 303 to 467 K, implying that it can also be used in white display.
Data Availability Statement
The original contributions presented in the study are included in the article/Supplementary Material; further inquiries can be directed to the corresponding author.
Author Contributions
All authors listed have made a substantial, direct, and intellectual contribution to the work and approved it for publication.
Funding
The work was financially supported by the National Natural Science Foundation of China (Grant No. 12004217) and the Natural Science Foundation of Shandong province (Grant Nos. ZR201910230199 and ZR201910230202).
Conflict of Interest
The authors declare that the research was conducted in the absence of any commercial or financial relationships that could be construed as a potential conflict of interest.
Publisher’s Note
All claims expressed in this article are solely those of the authors and do not necessarily represent those of their affiliated organizations, or those of the publisher, the editors, and the reviewers. Any product that may be evaluated in this article, or claim that may be made by its manufacturer, is not guaranteed or endorsed by the publisher.
Supplementary Material
The Supplementary Material for this article can be found online at: https://www.frontiersin.org/articles/10.3389/fmats.2021.767812/full#supplementary-material
References
Chen, D., Liu, S., Xu, W., and Li, X. (2017). Yb3+/Ln3+/Cr3+ (Ln = Er, Ho) Doped Transparent Glass Ceramics: Crystallization, Ln3+ Sensitized Cr3+ Upconversion Emission and Multi-Modal Temperature Sensing. J. Mater. Chem. C 5 (45), 11769–11780. doi:10.1039/c7tc04410k
Chen, S., Song, W., Cao, J., Hu, F., and Guo, H. (2020). Highly Sensitive Optical Thermometer Based on FIR Technique of Transparent NaY2F7:Tm3+/Yb3+ Glass Ceramic. J. Alloys Compd. 825, 154011. doi:10.1016/j.jallcom.2020.154011
del Rosal, B., Ximendes, E., Rocha, U., and Jaque, D. (2017). In Vivo luminescence Nanothermometry: from Materials to Applications. Adv. Opt. Mater. 5 (1), 1600508. doi:10.1002/adom.201600508
Du, P., Luo, L., Huang, X., and Yu, J. S. (2018). Ultrafast Synthesis of Bifunctional Er3+/Yb3+-Codoped NaBiF4 Upconverting Nanoparticles for Nanothermometer and Optical Heater. J. Colloid Interf. Sci. 514, 172–181. doi:10.1016/j.jcis.2017.12.027
Du, P., Tang, J., Li, W., and Luo, L. (2021). Exploiting the Diverse Photoluminescence Behaviors of NaLuF4:xEu3+ Nanoparticles and G-C3n4 to Realize Versatile Applications in white Light-Emitting Diode and Optical Thermometer. Chem. Eng. J. 406, 127165. doi:10.1016/j.cej.2020.127165
Feng, J., Tian, K., Hu, D., Wang, S., Li, S., Zeng, Y., et al. (2011). A Triarylboron-Based Fluorescent Thermometer: Sensitive over a Wide Temperature Range. Angew. Chem. 123 (35), 8222–8226. doi:10.1002/ange.201102390
Han, Q., Hao, H., Yang, J., Sun, Z., Sun, J., Song, Y., et al. (2019). Optical Temperature Sensing Based on thermal, Non-thermal Coupled Levels and Tunable Luminescent Emission Colors of Er3+/Tm3+/Yb3+ Tri-doped Y7O6F9 Phosphor. J. Alloys Compd. 786, 770–778. doi:10.1016/j.jallcom.2019.02.047
Huang, F., Gao, Y., Zhou, J., Xu, J., and Wang, Y. (2015). Yb3+/Er3+ Co-doped CaMoO4: a Promising green Upconversion Phosphor for Optical Temperature Sensing. J. Alloys Compd. 639, 325–329. doi:10.1016/j.jallcom.2015.02.228
Jia, M., Sun, Z., Xu, H., Jin, X., Lv, Z., Sheng, T., et al. (2020). An Ultrasensitive Luminescent Nanothermometer in the First Biological Window Based on Phonon-Assisted thermal Enhancing and thermal Quenching. J. Mater. Chem. C 8 (44), 15603–15608. doi:10.1039/d0tc04082g
Labrador-Páez, L., Pedroni, M., Speghini, A., García-Solé, J., Haro-González, P., and Jaque, D. (2018). Reliability of Rare-Earth-Doped Infrared Luminescent Nanothermometers. Nanoscale 10 (47), 22319–22328. doi:10.1039/c8nr07566b
Li, Z., Lin, L., Feng, Z., Huang, L., Wang, Z., and Zheng, Z. (2021). Wide-range Temperature Sensing of NaYF4: Ho3+ Nanoparticles by Multi-Emissions in Dual Spectral Ranges. J. Lumin. 232, 117873. doi:10.1016/j.jlumin.2020.117873
Liu, S., Cui, J., Jia, J., Fu, J., You, W., Zeng, Q., et al. (2019a). High Sensitive Ln3+/Tm3+/Yb3+ (Ln3+ = Ho3+, Er3+) Tri-doped Ba3Y4O9 Upconverting Optical Thermometric Materials Based on Diverse thermal Response from Non-thermally Coupled Energy Levels. Ceramics Int. 45 (1), 1–10. doi:10.1016/j.ceramint.2018.09.162
Liu, X., Lei, R., Li, Y., and Xu, S. (2019b). Tm3+/Yb3+: BaMoO4 Phosphor for High-Performance Thermometry Operating in the First Biological Window. Opt. Lett. 44 (15), 3633–3636. doi:10.1364/ol.44.003633
Lu, H., Hao, H., Zhu, H., Shi, G., Fan, Q., Song, Y., et al. (2017). Enhancing Temperature Sensing Behavior of NaLuF4:Yb3+/Er3 via Incorporation of Mn2+ Ions Resulting in a Closed Energy Transfer. J. Alloys Compd. 728, 971–975. doi:10.1016/j.jallcom.2017.09.080
Luo, L., Ran, W., Du, P., Li, W., and Wang, D. (2020). Photocatalytic and Thermometric Characteristics of Er 3+ ‐Activated Bi 5 IO 7 Upconverting Microparticles. Adv. Mater. Inter. 7 (11), 1902208. doi:10.1002/admi.201902208
Nexha, A., Carvajal, J. J., Pujol, M. C., Díaz, F., and Aguiló, M. (2021). Lanthanide Doped Luminescence Nanothermometers in the Biological Windows: Strategies and Applications. Nanoscale 13 (17), 7913–7987. doi:10.1039/d0nr09150b
Peng, Y., Cheng, Z., Khan, W. U., Liu, T., Shen, M., Yang, S., et al. (2021). Enhancing Upconversion Emissions and Temperature Sensing Properties by Incorporating Mn2+ for KLu2F7:Yb3+/Er3+ Nanocrystals Based on Thermally and Non-thermally Coupled Levels. New J. Chem. 45 (8), 3876–3885. doi:10.1039/d0nj06195f
Pollnau, M., Gamelin, D. R., Lüthi, S. R., Güdel, H. U., and Hehlen, M. P. (2000). Power Dependence of Upconversion Luminescence in Lanthanide and Transition-Metal-Ion Systems. Phys. Rev. B 61 (5), 3337–3346. doi:10.1103/physrevb.61.3337
Qiu, X., Zhou, Q., Zhu, X., Wu, Z., Feng, W., and Li, F. (2020). Ratiometric Upconversion Nanothermometry with Dual Emission at the Same Wavelength Decoded via a Time-Resolved Technique. Nat. Commun. 11 (1), 4–9. doi:10.1038/s41467-019-13796-w
Runowski, M., Stopikowska, N., Szeremeta, D., Goderski, S., Skwierczyńska, M., and Lis, S. (2019). Upconverting Lanthanide Fluoride Core@Shell Nanorods for Luminescent Thermometry in the First and Second Biological Windows: β-NaYF4:Yb3+- Er3+@SiO2 Temperature Sensor. ACS Appl. Mater. Inter. 11 (14), 13389–13396. doi:10.1021/acsami.9b00445
Savchuk, O. A., Carvajal, J. J., Brites, C. D. S., Carlos, L. D., Aguilo, M., and Diaz, F. (2018). Upconversion Thermometry: A New Tool to Measure the thermal Resistance of Nanoparticles. Nanoscale 10 (14), 6602–6610. doi:10.1039/c7nr08758f
Skripka, A., Benayas, A., Marin, R., Canton, P., Hemmer, E., and Vetrone, F. (2017). Double Rare-Earth Nanothermometer in Aqueous media: Opening the Third Optical Transparency Window to Temperature Sensing. Nanoscale 9 (9), 3079–3085. doi:10.1039/c6nr08472a
Suo, H., Zhao, X., Zhang, Z., Shi, R., Wu, Y., Xiang, J., et al. (2018). Local Symmetric Distortion Boosted Photon Up-Conversion and Thermometric Sensitivity in Lanthanum Oxide Nanospheres. Nanoscale 10 (19), 9245–9251. doi:10.1039/c8nr01734d
Vlaskin, V. A., Janssen, N., van Rijssel, J., Beaulac, R., and Gamelin, D. R. (2010). Tunable Dual Emission in Doped Semiconductor Nanocrystals. Nano Lett. 10 (9), 3670–3674. doi:10.1021/nl102135k
Wang, D., Zhang, P., Ma, Q., Zhang, J., and Wang, Y. (2018). Synthesis, Optical Properties and Application of Y7O6F9:Er3+ for Sensing the Chip Temperature of a Light Emitting Diode. J. Mater. Chem. C 6 (48), 13352–13358. doi:10.1039/c8tc05307c
Wang, L., Qin, W., Liu, Z., Zhao, D., Qin, G., Di, W., et al. (2012). Improved 800 Nm Emission of Tm^3+ Sensitized by Yb^3+ and Ho^3+ in β-NaYF_4 Nanocrystals under 980 Nm Excitation. Opt. Express 20 (7), 7602–7607. doi:10.1364/oe.20.007602
Wang, Z., Jiao, H., and Fu, Z. (2018). Investigating the Luminescence Behaviors and Temperature Sensing Properties of Rare-Earth-Doped Ba2In2O5 Phosphors. Inorg. Chem. 57 (15), 8841–8849. doi:10.1021/acs.inorgchem.8b00739
Xiang, G., Liu, X., Liu, W., Wang, B., Liu, Z., Jiang, S., et al. (2020b). Multifunctional Optical Thermometry Based on the Stark Sublevels of Er 3+ in CaO‐Y 2 O 3 : Yb 3+/Er 3 +. J. Am. Ceram. Soc. 103 (4), 2540–2547. doi:10.1111/jace.16939
Xiang, G., Xia, Q., Liu, X., and Wang, X. (2020a). Optical Thermometry Based on the Thermally Coupled Energy Levels of Er3+ in Upconversion Materials. Dalton Trans. 49 (47), 17115–17120. doi:10.1039/d0dt03100c
Ximendes, E. C., Santos, W. Q., Rocha, U., Kagola, U. K., Sanz-Rodríguez, F., Fernández, N., et al. (2016). Unveiling In Vivo Subcutaneous thermal Dynamics by Infrared Luminescent Nanothermometers. Nano Lett. 16 (3), 1695–1703. doi:10.1021/acs.nanolett.5b04611
Xu, W., Zhao, D., Zhu, X., Zheng, L., Zhang, Z., and Cao, W. (2020). NIR to NIR Luminescence Thermometry in Core/multishells-Structured Nanoparticles Operating in the Biological Window. J. Lumin. 225, 117358. doi:10.1016/j.jlumin.2020.117358
Yan, Q., Yuan, J., Kang, Y., Cai, Z., Zhou, L., and Yin, Y. (2010). Dual-sensing Porphyrin-Containing Copolymer Nanosensor as Full-Spectrum Colorimeter and Ultra-sensitive Thermometer. Chem. Commun. 46 (16), 2781–2783. doi:10.1039/b926882k
Keywords: rare earth doped, up-conversion luminescent materials, fluorescence intensity ratio, temperature sensing sensitivity, first biological window
Citation: Li L and Hao H (2021) Florescence Intensity Ratio Thermometer in the First Biological Window Based on Non-Thermally Coupled Energy Levels of Tm3+ and Ho3+ Ions. Front. Mater. 8:767812. doi: 10.3389/fmats.2021.767812
Received: 31 August 2021; Accepted: 16 September 2021;
Published: 22 October 2021.
Edited by:
Zhongquan Nie, Taiyuan University of Technology, ChinaCopyright © 2021 Li and Hao. This is an open-access article distributed under the terms of the Creative Commons Attribution License (CC BY). The use, distribution or reproduction in other forums is permitted, provided the original author(s) and the copyright owner(s) are credited and that the original publication in this journal is cited, in accordance with accepted academic practice. No use, distribution or reproduction is permitted which does not comply with these terms.
*Correspondence: Haoyue Hao, aGFvaGFvX3l1ZUAxNjMuY29t