 Ricardo Pimenta
 Hugo Antunes
 João Ribeiro1,5,†
 Fábio Yuzo Nakamura
- 1Research Center in Sports Sciences, Health Sciences and Human Development (CIDESD), University of Maia, Maia, Portugal
- 2Research Center of the Polytechnic Institute of Maia (N2i), Maia Polytechnic Institute (IPMAIA),Castêlo da Maia, Maia, Portugal
- 3Department of Rehabilitation and Performance Optimization (DROP), Futebol Clube Famalicão - Futebol SAD, Famalicão, Portugal
- 4FSI Lab, Football Science Institute, Granada, Spain
- 5Department of Performance Optimization (GOD), Sporting Clube de Braga SAD, Braga, Portugal
High-speed running (HSR) is one of the performance metrics of interest, as the volume of HSR during matches has been increasing over the last decade, which suggests that weekly training loads should be adjusted to align with this trend, enabling players to cope with match demands. However, the use of HSR thresholds lacks a solid rationale for their application and fails to account for individual player capacities, likely not reflecting their actual HSR efforts. As such, this theoretical-discussion provides important implications for training prescription, aiming to optimize performance and minimize fatigue. It emphasizes the significant differences in the conceptualization of HSR and highlights the advantages of adopting a normalized approach that reflects the physiological, mechanical and neuromuscular aspects related to HSR, as well as the intermittent profile of football matches. Practical HSR threshold definitions tailored to the capacities of each athlete are proposed, enabling a more evidence-based approach for the interpretation of training loads and game/player profiling. More specifically, within our proposal, HSR can be subdivided into two types: (1) HSR-1, characterized by an entry threshold based on a normalized critical speed, and (2) HSR-2, defined by an entry threshold corresponding to 75% of the athlete's maximum speed.
Introduction
The Global Positioning System (GPS) was first used for athlete tracking in 1997 (1). Since then, its utilization has spread across various sports, including soccer, enabling real-time analysis of players’ on-field activity profiles during training and competition (2). The activity profile includes various metrics related to various aspects of the athlete's physical performance, such as running performance. It has been observed that match intensity in male soccer, in terms of high-speed running (HSR) metrics, has increased over the last decade (3, 4). Such increases suggest that players probably require training adjustments to align with the evolving physical demands of soccer matches (5). Indeed, previous studies has focused on examining the effects of various game-based formats (e.g., small-sided and large-sided games) on both external and internal load metrics, owing to the widespread implementation of such formats in training sessions across the microcycle and their relevance to soccer-specific demands (6–8). However, adequate adjustments warrant appropriate data analysis and interpretation, which are fundamental steps preceding the operationalization of the training stimulus. In this context, a problem arises when considering what constitutes realistic efforts in terms of the actual workloads experienced by the athletes. The fixed thresholds for HSR are set between 14.4 km/h and 21.1 km/h for males, and between 12.2 km/h and 15.6 km/h for females, with the most common thresholds being 19.8–25.2 km/h for males and 12.5–22.5 km/h for females which results in approximately 1,000 m and 760 m for professional female and male players, respectively (9). However, the rationale behind the conceptualization of these thresholds remains unknown. The use of such thresholds may hinder coaches from providing tailored training stimuli to players, thereby failing to achieve the desired adaptations and potentially increasing the risk of injuries (10, 11). Considering the principle of individualization, the creation of relative thresholds would address this issue. This review substantiates the importance of considering the normalization of HSR data for an adequate load management in male soccer players.
The problematic applicability
Erroneous interpretations of the external load imposed on the athletes might lead to inadequate training exposure, resulting in insufficient or excessive stimulation for optimal training adaptations or overtraining (10, 11). In theory, the use of normalized speed thresholds should contribute to better approximating the workload applied to individual athletes in relation to the intended physiological stimulus. With training individualization being one of the fundamental principles of exercise training, it is expected that normalization of the threshold values according to the individual's maximum or relative capacities would be an approach that more closely resembles the real physiological impact experienced by the athletes. Previous studies linked the second ventilatory threshold (VT2) (point at which occurs a shift in the ventilation strategy with an exponential increase in ventilations per minute relative to oxygen uptake) to the corresponding speed attained at that specific moment, using it as the reference value for HSR entry (12, 13). This speed was approximately 15 km/h, which was 4.8 km/h lower than the 19.8 km/h absolute threshold. In those studies, HSR distance > 15 km/h (normalized value) was 2,258 m, compared to 845 m covered using the 19.8 km/h absolute threshold value, representing a 167% increase in HSR distance when using a normalized approach. This example is illustrated in Figure 1.
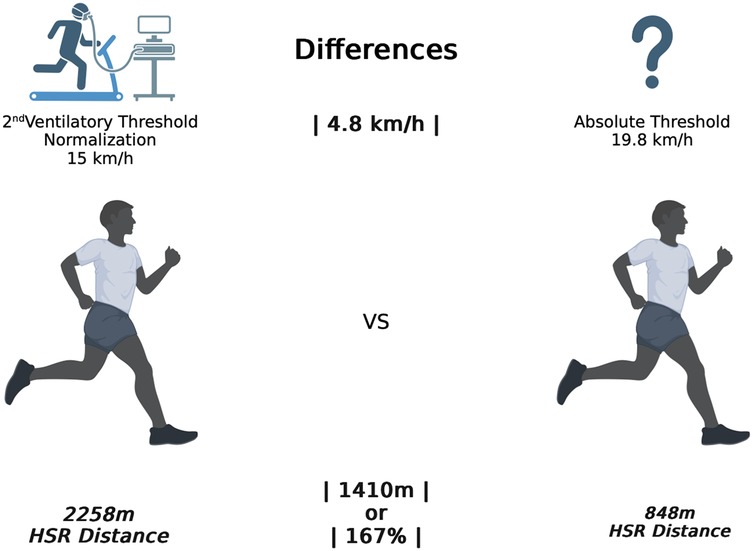
Figure 1. Comparison between HSR distances using the second ventilatory threshold (15 km/h) and the absolute threshold of 19.8 km/h in soccer male athletes.
In addition, utilizing the VT2 as reference for the lower HSR threshold signifies that a speed amplitude of 10.2 km/h from 15 to 25.2 km/h, within this HSR range will reflect substantially different kinematic patterns experienced by the athletes (14, 15).
A proper definition of running intensity would encompass the physiological, mechanical, and neuromuscular domains of physical exertion. As running speed increases, the changes in the running pattern (16), VO2 kinetics (17) and neuromuscular activation of specific muscle groups (18) become more noticeable. Considering these responses collectively provides a more nuanced perspective on how to establish an HSR threshold that accurately reflects the effort experienced by the athlete.
Substantial differences arise between the application of absolute and normalized threshold values in defining HSR entry probably leading to misinterpretations of the athletes’ exertion further compromise the accuracy of training prescriptions and the validity of game and training analyses (13, 19). Moreover, there remains a lack of conclusive evidence supporting the superiority of normalized over absolute thresholds for HSR efforts in soccer. Further investigations are required to identify the most appropriate method for assessing and establishing normalized thresholds.
Physiological domain
The player's aerobic capacity is frequently evaluated as it is recognized as a key physical attribute for success in team sports (20). Various protocols have been used to assess this physical capacity in team sports; however, they may capture subtle yet significantly distinct physical characteristics (21), which can prevent coaches from making direct comparisons between results obtained from different protocols, even when used for the same purpose.
Researchers have considered the HSR definition as the speed corresponding to maximal oxygen consumption (VO2max) (22), reporting running speeds of approximately 16.2–16.5 km/h at VO2max in professional soccer players (23). A higher VO2max has been related to the player's capacity to cope with match demands (24) and a faster recovery between high-intensity actions (25). Furthermore, VO2max may be similar between players with distinct running performance capacities (26). To differentiate athletes with similar VO2max values, physiological cut-points may be utilized, serving as running-intensity thresholds and representing key speed markers attained by the athlete, such as maximal aerobic speed (minimum running speed at which maximum oxygen uptake occurs) or the maximum lactate steady state (highest exercise intensity where a balance is observed between the rate of production and removal of blood lactate).
Typically, three physiological domains are used to characterize training intensities from moderate, heavy and severe (27). Nevertheless, the assessment of physiological cut-points commonly encompasses logistical and methodological limitations. Commonly, these physiological cut-points are assessed during a laboratory treadmill test (28), which are considered non-ecologically valid since soccer is profiled as an intermittent sport (20). Moreover, running kinematics and kinetics are affected by increasing speed, which has repercussions at the neuromuscular and mechanical levels, and their relationship with the physiological cut-points remains unclear. Tests considered more ecological, such as the 30-15 Intermittent Fitness Test (30-15IFT), have been conducted to assess aerobic fitness and intermittent exercise capacity related to gameplay (29) incorporating speed and change of direction abilities, along with lower-limb power and inter-effort recovery (29). Although the final speed of the 30-15IFT appears more appropriate as a threshold for HSR due to its specificity and its closer alignment with the locomotor profile observed in soccer, it must be acknowledged that there is currently no established method to validate it for this purpose. Since locomotion at varying intensities in soccer does not occur over standardized distances and trajectories, it is not feasible to establish a field test that accurately determines the onset of high-intensity running. Consequently, selecting a test to define the cut-off point will inevitably involve an inherent degree of arbitrariness. Partially solving these issues, validation of soccer match GPS-derived critical speed (CS) estimates between 13.7 and 14.4 km/h have been reported (30) recurring to a mathematical time-based modeling of competition games and CS field tests for posterior correlation analysis, withdrawing the necessity of conduction specific and time consuming tests. This may also apply for the assessment of other running performance metrics such as maximal speed (31). Therefore, CS could be a plausible cut-point of a physiological-based lower HSR threshold since it is intimately associated with each player's running capacity.
Kinematic and mechanical domain
The progressive increase in running speed is associated with an evolving running pattern marked by significant kinematic differences (14). It has been suggested that HSR may be more accurately described as velocities near 75% of the maximum speed, as this better reflects relative speeds associated with individual striding patterns (16). Given that HSR (considering speeds between 19.8 km/h and 25.1 km/h) accounts for approximately 7%–11% of the total distance covered during a soccer match (3), the majority of the distance covered is associated with lower-intensity movement patterns, such as running, jogging, or walking. However, while 75% of maximum speed represents a striding pattern for the sample observed in that study, it is possible that this finding may not be generalizable to professional soccer players. At a neuromuscular and mechanical level, this could have significant implications. Indeed, previous studies report neuromuscular and mechanical repercussions of increasing running at the hamstrings muscle group. The peak musculotendinous stretch of the hamstrings was observed to occur at 80% of the peak speed (32), while further increases in speed were related to a higher negative work of the hamstrings (33, 34) and a peak neuromuscular activation of the hamstrings at 90% peak speed (35). However, it is important to note that these observations are specific to the hamstrings and may differ for other muscle groups, such as quadriceps and calf musculature (15). Altogether, current data regarding neuromuscular, mechanical and kinematic parameters of running speed, abet the idea that 75% peak speed might be an adequate starting point to observe a HSR mechanical-oriented stimulus with an upper ceiling of 90% peak speed, from which the players will adopt maximal sprinting kinematics (16). Indeed, a recent study developed the rationale regarding the normalization of maximal sprinting speed >90%, when compared to absolute thresholds (36). Furthermore, 75% and 90% peak speed represent mean values of a given sample, as so, it is expected to prognosticate variations according to the peak speed values of each athlete. Even so, since they were obtained through an individualization procedure, these peak speed mean values probably provide a better approximation to the real HSR efforts compared to the commonly used arbitrary thresholds, reinforcing the need to assess HSR kinematics of each individual.
Practical application—refining speed thresholds in soccer
Different studies have used different physiological approaches to relate speed thresholds (12, 37). Nevertheless, the protocols applied fail to adequately represent the intermittent and repeated acceleration associated with soccer games (38), and therefore, can be deemed as inaccurate tests to generate tailored speed thresholds. The use of speed thresholds that do not adequately fit the real physiological and mechanical effort exerted by athletes leads coaches and sport scientists to erroneous interpretations, which will likely result in inappropriate training monitoring, potentially impacting fatigue management of the squad and increasing the injury risk, not only in healthy players but also in those undergoing rehabilitation processes (10, 11).
Due to the aforementioned variables, justifying the generation of a proper normalized HSR threshold is a very complex task. Still, we do consider that some variables could give us insights into, or at least, define the boundaries of HSR intensities. The CS corresponds to the highest running speed value that an athlete can sustain without a significant fatigue accumulation (39) closely related to the second lactate threshold or to the severe intensity exercise domain, since running beyond the CS will result in a rapid accumulation of lactate, making it impossible for the athlete to maintain that running speed for long. Regardless of the running mechanics associated with the CS, we can be confident that above this threshold, the athletes will develop significant levels of fatigue, as has been observed elsewhere (40).
As HSR speed continues to increase above the CS, not only will fatigue develop more rapidly, but the running patterns will progressively approximate into a sprinting pattern, from running to striding and near maximal sprinting. Since all patterns comprise speeds above CS, a kinematic-based approach to define the upper limit could eventually be considered as an eventual solution. The altered running kinematics approximating the sprint kinematics will be associated with neuromuscular activation and mechanical strains experienced by the muscles that are significantly superior compared to running speeds closer to the lower HSR threshold. Since maximum neuromuscular hamstrings activation occurs at 90% maximum sprint speed (35), this could be applied as the maximal HSR threshold. Unfortunately, there is not sufficient evidence to justify an intermediate threshold between the upper and lower limits of HSR intensities, besides the observations of 75% of maximum speed representing a striding pattern in a group of amateur field-sports athletes (16). This rationale of a two-zone HSR intensity, separating a more cardiometabolic type (intensities closer to the CS) to 75% of maximal speed and a more mechanical type (intensities between 75% of maximal speed and 90% of maximum sprint speed), paves the way for an HSR spectrum construct that will aid in the analysis of the running load profile of the soccer players (Figure 2). Considering the actual thresholds, if a player covers a certain number of meters in HSR, using the arbitrary threshold of >19.8 km/h, we will likely miss a great cardiometabolic component that is already present at lower running speeds, since these speeds already elicit significant cardiorespiratory stress (13). On the superior portion of the spectrum, some athletes may actually present an individual level of HSR intensity corresponding to speeds greater than the commonly used arbitrary thresholds (16), resulting in an overestimation of the external workload, and thereby overlooking the actual training load, which could have significant consequences for performance and fatigue monitoring. Further research is needed to understand what variables might help identify the transition between lower HSR intensities and higher HSR intensities. Since both intensities are situated above the CS, variables related to HSR kinematics could provide valuable insights into this complex phenomenon, given that running kinematics are associated with neuromuscular and mechanical demands experienced by muscle groups such as the hamstrings.
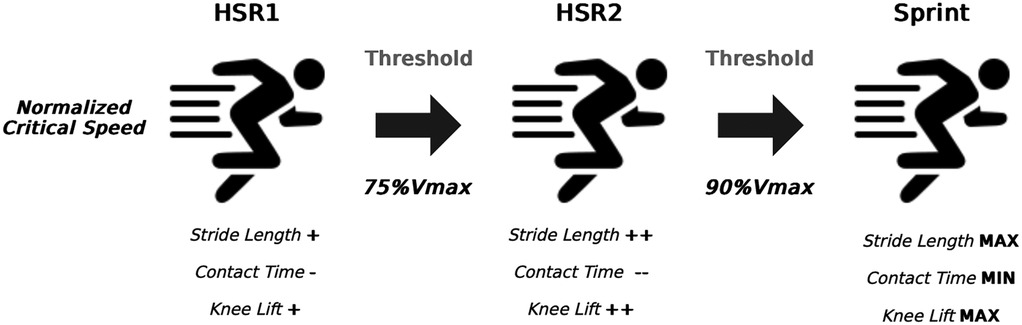
Figure 2. Kinematic differences between different high-speed running types (1 and 2) and sprint and their respective thresholds. HSR1 (metabolic) intensity initiates above the normalized critical velocity, HSR2 (mechanical) intensity initiates above the 75% maximum velocity and sprint intensity initiates above 90% maximum velocity. (+) and (-) signs, represent an arbitrary emphasis regarding the quantity of the observed variable.
Discussion
Male soccer players of elite status have been observed to cover a total mean distance between 10 and 12 km (41). The majority of the distance is covered below the anaerobic threshold in elite soccer players, with an accepted corresponding running speed of 14.4 km/h (42) which is substantially inferior compared to the absolute threshold (19.8 km/h) commonly characterizing HSR (9). Thus, whenever players cover HSR distances, whether normalized or not, a greater rate of fatigue is expected to develop compared to lower-intensity running speeds especially for slower players whose HSR thresholds are relatively closer to their maximum speed capacity. As running speeds come closer to the upper limit of HSR intensity, a greater effect of fatigue is observed, due to an increased neuromuscular (18) and mechanical effort in muscles of the lower limbs. As running speed increases, eccentric contractions at higher velocities become more frequent (43), particularly in the hamstrings, leading to increased muscle damage (18) and an elevated neuromuscular demand, which likely contributes to reduced neuromuscular performance. As previously reported in the literature, load management might be crucial for performance optimization and/or injury prevention (44). However, the differences between using normalized or absolute threshold are likely to result in disparate load management metrics, ultimately leading to different interpretations of their practical applications. It should be noted that 10% of the total distance covered per match is performed at high-intensity (45) with significant match-to-match variations and player (46). Values reported regarding HSR variables between studies including teams from the same or different competitive leagues should not be generalized or applied in different contexts (47) since tactics, predominant style of play, and players’ quality (in terms of technical-tactical skills) may be significantly distinct (48). For instance, considering a player with a maximum speed capacity of 36 km/h, the absolute HSR threshold of 19.8 km/h represents 55% of their maximum capacity, while for an athlete with a maximum speed capacity of 30 km/h, the same threshold represents 66% of their maximum capacity. Therefore, this suggests that game profiling should consider reporting HSR distances according to their proximity to the lower (CS to75% maximum speed) and upper limits (75%–90%maximum speed) of normalized HSR intensities, as they will reflect different mechanical and neuromuscular impacts.
Moreover, ideal training adaptations require the repeated application of appropriate training stimulus which is compliant with fundamental training principles such as individualization and progressive overload. In order to consummate such principles, coaches need to identify the athlete's maximal capacities and subsequently prescribe training intensities and volumes according to those maximal references. However, external load monitoring recurring to arbitrary speed thresholds precludes coaches not only from properly interpreting external load produced by the athletes but also to prescribe training loads in an individualized manner. In other words, coaches may be erroneously applying training intensities for half of the squad, likely increasing the injury risk occurrence while minimizing the promotion of positive training adaptations. Indeed, appropriate running intensity exposure as is the case for intensities superior to 90% of maximum speed capacity (49), has been reported to enhance sprint performance and simultaneously provide a prophylactic effect for soft-tissue injury (50).
Normalized HSR values for performance and fatigue monitoring could be an advantage for prescribing training loads for each athlete, but it does not facilitate the comparison between athletes. The comparison between athletes requires the use of absolute HSR thresholds to benchmark players’ performance in game or training sessions, providing a collective measure for the team or specific positions, which allows for ranking the athletes. Even if each player's individual capacities are assessed accurately, they may still fall well below the average absolute capacity expected for their field position or team standards. Such inter-athlete comparisons must rely on an HSR threshold value that aligns as closely with the average (albeit unknown) mean of HSR speeds, so as to capture the majority of HSR efforts experienced by players. This approach requires further investigation.
This perspective discussion article substantiates the importance of considering the normalization of HSR data for an adequate load management in soccer players. A two-dimensional conceptualization of HSR is proposed, based on the physiological, neuromuscular, mechanical and kinematic parameters, (1) a metabolic HSR, composed of running speeds between critical velocity threshold and 75% of maximal speed; (2) a mechanical HSR initiating at 75% peak speed with an upper threshold of 90% peak speed, with expected variation according to the peak speed of each player. In practical terms, the current proposal also enables strength and conditioning coaches for a better understanding of the real HSR consequences on fatigue development will contribute to minimizing fatigue and enhancing performance, concomitantly having a possible beneficial impact over the injury risk.
Data availability statement
The original contributions presented in the study are included in the article/Supplementary Material, further inquiries can be directed to the corresponding author.
Author contributions
RP: Conceptualization, Data curation, Formal analysis, Investigation, Methodology, Project administration, Resources, Software, Supervision, Validation, Visualization, Writing – original draft, Writing – review & editing. HA: Writing – original draft. JR: Conceptualization, Formal analysis, Methodology, Project administration, Supervision, Writing – review & editing. FN: Conceptualization, Formal analysis, Methodology, Project administration, Supervision, Writing – review & editing.
Funding
The author(s) declare that financial support was received for the research and/or publication of this article. This work was funded by National Funds by FCT - Foundation for Science and Technology under the following project UID/04045: Research Center in Sports Sciences, Health Sciences, and Human Development.
Conflict of interest
The authors declare that the research was conducted in the absence of any commercial or financial relationships that could be construed as a potential conflict of interest.
Generative AI statement
The author(s) declare that no Generative AI was used in the creation of this manuscript.
Publisher's note
All claims expressed in this article are solely those of the authors and do not necessarily represent those of their affiliated organizations, or those of the publisher, the editors and the reviewers. Any product that may be evaluated in this article, or claim that may be made by its manufacturer, is not guaranteed or endorsed by the publisher.
References
1. Schutz Y, Chambaz A. Could a satellite-based navigation system (GPS) be used to assess the physical activity of individuals on earth? Eur J Clin Nutr. (1997) 51(5):338–9. doi: 10.1038/sj.ejcn.1600403
2. Bradley PS, Carling C, Gomez Diaz A, Hood P, Barnes C, Ade J, et al. Match performance and physical capacity of players in the top three competitive standards of English professional soccer. Hum Mov Sci. (2013) 32(4):808–21. doi: 10.1016/j.humov.2013.06.002
3. Reynolds J, Connor M, Jamil M, Beato M. Quantifying and comparing the match demands of U18, U23, and 1ST team English professional soccer players. Front Physiol. (2021) 12:706451. doi: 10.3389/fphys.2021.706451
4. Lago-Peñas C, Lorenzo-Martinez M, López-Del Campo R, Resta R, Rey E. Evolution of physical and technical parameters in the Spanish 2012–2019. Sci Med Footb. (2023) 7(1):41–6. doi: 10.1080/24733938.2022.2049980
5. Hostrup M, Bangsbo J. Performance adaptations to intensified training in top-level football. Sports Med. (2023) 53(3):577–94. doi: 10.1007/s40279-022-01791-z
6. Zlojutro N, Eler S, Joksimovic M, Eler N, Marković S, Kukrić A, et al. Kinematic parameters and metabolic power in elite soccer players: a small sided a large sided games comparison. Front Physiol. (2023) 14:1150713. doi: 10.3389/fphys.2023.1150713
7. Cofano G, D’Elia F, Piccinno A, Sannicandro I. Analysis of the external and internal load in 5vs5 large sided games: differences between different sized fields. Teor ta Metod fìz Vihov. (2021) 21(4):337–42. doi: 10.17309/tmfv.2021.4.08
8. Sannicandro I, Cofano G. Large-sided games and sport-specific training: parameters of high intensity in professional soccer players. Teor ta Metod fìz Vihov. (2023) 23(1):124–32. doi: 10.17309/tmfv.2023.1.18
9. Gualtieri A, Rampinini E, Dello Iacono A, Beato M. High-speed running and sprinting in professional adult soccer: current thresholds definition, match demands and training strategies. A systematic review. Front Sports Act Living. (2023) 5:1116293. doi: 10.3389/fspor.2023.1116293
10. van den Tillaar R, Solheim JAB, Bencke J. Comparison of hamstring muscle activation during high-speed running and various hamstring strengthening exercises. Int J Sports Phys Ther. (2017) 12(5):718–27. doi: 10.26603/ijspt20170718
11. McGrath TM, Hulin BT, Pickworth N, Clarke A, Timmins RG. Determinants of hamstring fascicle length in professional rugby league athletes. J Sci Med Sport. (2020) 23(5):524–8. doi: 10.1016/j.jsams.2019.12.006
12. Scott D, Lovell R. Individualisation of speed thresholds does not enhance the dose-response determination in football training. J Sports Sci. (2018) 36(13):1523–32. doi: 10.1080/02640414.2017.1398894
13. Abt G, Lovell R. The use of individualized speed and intensity thresholds for determining the distance run at high-intensity in professional soccer. J Sports Sci. (2009) 27(9):893–8. doi: 10.1080/02640410902998239
14. Orendurff MS, Kobayashi T, Tulchin-Francis K, Tullock AMH, Villarosa C, Chan C, et al. A little bit faster: lower extremity joint kinematics and kinetics as recreational runners achieve faster speeds. J Biomech. (2018) 71:167–75. doi: 10.1016/j.jbiomech.2018.02.010
15. Schache AG, Dorn TW, Williams GP, Brown NAT, Pandy MG. Lower-limb muscular strategies for increasing running speed. J Orthop Sports Phys Ther. (2014) 44(10):813–24. doi: 10.2519/jospt.2014.5433
16. Freeman BW, Talpey SW, James LP, Opar DA, Young WB. Common high-speed running thresholds likely do not correspond to high-speed running in field sports. J Strength Cond Res. (2023) 37(7):1411–8. doi: 10.1519/JSC.0000000000004421
17. Gaesser GA, Poole DC. The slow component of oxygen uptake kinetics in humans. Exerc Sport Sci Rev. (1996) 24:35–71. doi: 10.1249/00003677-199600240-00004
18. Cerone GL, Nicola R, Caruso M, Rossanigo R, Cereatti A, Vieira TM. Running speed changes the distribution of excitation within the biceps femoris muscle in 80 m sprints. Scand J Med Sci Sports. (2023) 33(7):1104–15. doi: 10.1111/sms.14341
19. Gualtieri A, Rampinini E, Sassi R, Beato M. Workload monitoring in top-level soccer players during congested fixture periods. Int J Sports Med. (2020) 41(10):677–81. doi: 10.1055/a-1171-1865
20. Bangsbo J, Mohr M, Krustrup P. Physical and metabolic demands of training and match-play in the elite football player. J Sports Sci. (2006) 24(7):665–74. doi: 10.1080/02640410500482529
21. Buchheit M, Rabbani A. The 30-15 intermittent fitness test versus the yo-yo intermittent recovery test level 1: relationship and sensitivity to training. Int J Sports Physiol Perform. (2014) 9(3):522–4. doi: 10.1123/ijspp.2012-0335
22. Castagna C, Impellizzeri FM, Chamari K, Carlomagno D, Rampinini E. Aerobic fitness and yo-yo continuous and intermittent tests performances in soccer players: a correlation study. J Strength Cond Res. (2006) 20(2):320–5.16689621
23. Tønnessen E, Hem E, Leirstein S, Haugen T, Seiler S. Maximal aerobic power characteristics of male professional soccer players, 1989–2012. Int J Sports Physiol Perform. (2013) 8(3):323–9. doi: 10.1123/ijspp.8.3.323
24. Impellizzeri FM, Rampinini E, Marcora SM. Physiological assessment of aerobic training in soccer. J Sports Sci. (2005) 23(6):583–92. doi: 10.1080/02640410400021278
25. Brown PI, Hughes MG, Tong RJ. Relationship between VO(2max) and repeated sprint ability using non-motorised treadmill ergometry. J Sports Med Phys Fitness. (2007) 47(2):186–90.17557056
26. Nilsson J, Cardinale D. Aerobic and anaerobic test performance among elite male football players in different team positions. LASE J Sport Sci. (2015) 6(1):71–90. doi: 10.1515/ljss-2016-0007
27. Kalva-Filho CA, Andrade VL, Garcia CG, Barbieri RA, da Silva HS, Dos-Santos JW, et al. 3-min All-out test to evaluate aerobic and anaerobic indexes in court team sports. Int J Sports Med. (2024) 45(4):316–22. doi: 10.1055/a-2205-9108
28. Bentley DJ, Newell J, Bishop D. Incremental exercise test design and analysis: implications for performance diagnostics in endurance athletes. Sports Med. (2007) 37(7):575–86. doi: 10.2165/00007256-200737070-00002
29. Buchheit M. The 30-15 intermittent fitness test: accuracy for individualizing interval training of young intermittent sport players. J Strength Cond Res. (2008) 22(2):365–74. doi: 10.1519/JSC.0b013e3181635b2e
30. Lord C, Blazevich AJ, Abbiss CR, Ma’ayah F. Reliability and validity of maximal mean and critical speed and metabolic power in Australian youth soccer players. J Hum Kinet. (2020) 73:93–102. doi: 10.2478/hukin-2019-0135
31. Alphin KL, Sisson OM, Hudgins BL, Noonan CD, Bunn JA. Accuracy assessment of a GPS device for maximum sprint speed. Int J Exerc Sci. (2020) 13(4):273–80. doi: 10.70252/ALLQ3142
32. Schache AG, Dorn TW, Wrigley TV, Brown NAT, Pandy MG. Stretch and activation of the human biarticular hamstrings across a range of running speeds. Eur J Appl Physiol. (2013) 113(11):2813–28. doi: 10.1007/s00421-013-2713-9
33. Chumanov ES, Heiderscheit BC, Thelen DG. Hamstring musculotendon dynamics during stance and swing phases of high-speed running. Med Sci Sports Exerc. (2011) 43(3):525–32. doi: 10.1249/MSS.0b013e3181f23fe8
34. Chumanov ES, Heiderscheit BC, Thelen DG. The effect of speed and influence of individual muscles on hamstring mechanics during the swing phase of sprinting. J Biomech. (2007) 40(16):3555–62. doi: 10.1016/j.jbiomech.2007.05.026
35. McNally T, Edwards S, Halaki M, O’Dwyer N, Pizzari T, Blyton S. Quantifying demands on the hamstrings during high-speed running: a systematic review and meta-analysis. Scand J Med Sci Sports. (2023) 33(12):2423–43. doi: 10.1111/sms.14478
36. Pimenta R, Antunes H, Ribeiro J, Yuzo Nakamura F. Should GPS data be normalized for performance and fatigue monitoring in soccer? A theoretical–practical discussion on sprinting. Ger J Exerc Sport Res. (2025). doi: 10.1007/s12662-025-01048-7
37. Rago V, Brito J, Figueiredo P, Krustrup P, Rebelo A. Relationship between external load and perceptual responses to training in professional football: effects of quantification method. Sports. (2019) 7(3):68. doi: 10.3390/sports7030068
38. Schimpchen J, Gopaladesikan S, Meyer T. The intermittent nature of player physical output in professional football matches: an analysis of sequences of peak intensity and associated fatigue responses. EJSS. (2021) 21(6):793–802. doi: 10.1080/17461391.2020.1776400
39. Jones AM, Vanhatalo A. The “critical power” concept: applications to sports performance with a focus on intermittent high-intensity exercise. Sports Med. (2017) 47(Suppl 1):65–78. doi: 10.1007/s40279-017-0688-0
40. Denadai BS, Gomide EBG, Greco CC. The relationship between onset of blood lactate accumulation, critical velocity, and maximal lactate steady state in soccer players. J Strength Cond Res. (2005) 19(2):364–8.15903376
41. Strøyer J, Hansen L, Klausen K. Physiological profile and activity pattern of young soccer players during match play. Med Sci Sports Exerc. (2004) 36(1):168–74. doi: 10.1249/01.MSS.0000106187.05259.96
42. Andrzejewski M, Chmura J, Chmura P, Konefał M, Kowalczuk E, Rokita A. Distances covered above and below the anaerobic threshold by professional football players in different competitive conditions. Cent Eur J Sport Sci Med. (2015) 10:25–31. Available at: https://doaj.org/article/e4905ddbed1e4467b264245d32d501b7 (Accessed March 10, 2025).
43. Sun Y, Wei S, Zhong Y, Fu W, Li L, Liu Y. How joint torques affect hamstring injury risk in sprinting swing-stance transition. Med Sci Sports Exerc. (2015) 47(2):373–80. doi: 10.1249/MSS.0000000000000404
44. Soligard T, Schwellnus M, Alonso JM, Bahr R, Clarsen B, Dijkstra HP, et al. How much is too much? (part 1) international Olympic committee consensus statement on load in sport and risk of injury. Br J Sports Med. (2016) 50(17):1030–41. doi: 10.1136/bjsports-2016-096581
45. Rampinini E, Coutts AJ, Castagna C, Sassi R, Impellizzeri FM. Variation in top level soccer match performance. Int J Sports Med. (2007) 28(12):1018–24. doi: 10.1055/s-2007-965158
46. Teixeira JE, Branquinho L, Leal M, Morgans R, Sortwell A, Barbosa TM, et al. Match-to-match variation on high-intensity demands in a Portuguese professional football team. J Funct Morphol Kinesiol. (2024) 9(3):120. doi: 10.3390/jfmk9030120
47. Baptista I, Johansen D, Seabra A, Pettersen SA. Position specific player load during match-play in a professional football club. PLoS One. (2018) 13(5):e0198115. doi: 10.1371/journal.pone.0198115
48. Miguel M, Oliveira R, Brito JP, Loureiro N, García-Rubio J, Ibáñez SJ. External match load in amateur soccer: the influence of match location and championship phase. Healthcare. (2022) 10(4):594. doi: 10.3390/healthcare10040594
49. Skoglund A, Strand MF, Haugen TA. The effect of flying sprints at 90% to 95% of maximal velocity on sprint performance. Int J Sports Physiol Perform. (2023) 18(3):248–54. doi: 10.1123/ijspp.2022-0244
Keywords: high-speed running, soccer, load monitoring, GPS, speed thresholds
Citation: Pimenta R, Antunes H, Ribeiro J and Nakamura FY (2025) Should GPS data be normalized for performance and fatigue monitoring in soccer? A theoretical-practical discussion on high-speed running. Front. Sports Act. Living 7:1603767. doi: 10.3389/fspor.2025.1603767
Received: 31 March 2025; Accepted: 5 June 2025;
Published: 25 June 2025.
Edited by:
Daniel Castillo, University of Valladolid, SpainReviewed by:
Italo Sannicandro, University of Foggia, ItalyCopyright: © 2025 Pimenta, Antunes, Ribeiro and Nakamura. This is an open-access article distributed under the terms of the Creative Commons Attribution License (CC BY). The use, distribution or reproduction in other forums is permitted, provided the original author(s) and the copyright owner(s) are credited and that the original publication in this journal is cited, in accordance with accepted academic practice. No use, distribution or reproduction is permitted which does not comply with these terms.
*Correspondence: Ricardo Pimenta, cmpsLnBpbWVudGFAZ21haWwuY29t
†ORCID:
Ricardo Pimenta
orcid.org/0000-0003-0134-5038
Hugo Antunes
orcid.org/0009-0005-3451-3079
João Ribeiro
orcid.org/0000-0002-7658-4837
Fábio Yuzo Nakamura
orcid.org/0000-0002-5336-3652