 Kun Yang
 Wenduo Liu
 Zhengxue Song3*
- 1Liaoning Institute of Basic Medical Sciences, Shenyang, China
- 2Department of Sports Science, College of Natural Science, Jeonbuk National University, Jeonju, Republic of Korea
- 3College of Sports Science, Shenyang Normal University, Shenyang, China
Background: People who maintain regular outdoor exercise in winter face many environmental and climatic challenges. Therefore, it is crucial to clearly prioritize the attributes of consumer demand for winter sportswear.
Purpose: This study aims to identify the ranking of attributes that Chinese consumers of outdoor sports products value in their demand for winter sportswear.
Participants and methods: This study collected data from sports enthusiasts in China's cold winter regions through an online questionnaire (the final effective data set contains 483). The scale collected attribute data on consumer needs for sportswear functions, pricing, service, design, and brand. Each survey includes consumer evaluations of the importance and performance of demand attributes. Demographic surveys include information on age, purchasing experience, and recent requirements. Finally, the results are statistically analyzed using t-test, IPA, Borich needs, and LF.
Results: Top Priority includes color, ergonomics, logo and accuracy (shown as priority in IPA, Need and FL results). Second Priority includes logistics, packaging, return & exchange policy (shown as priority in Need and FL results). Third Priority includes technical cost, fabrics cost and quality control cost (only shown as priority in IPA result).
Conclusion: The top three attributes that consumers care about most in the Chinese winter sportswear market are, in order of priority: design, service and pricing.
1 Introduction
The winter climate poses significant challenges to outdoor sports enthusiasts in maintaining their exercise habits. Advances in sportswear technology have further promoted the diversification and refinement of consumer demand for winter product functions (1). At the same time, the global sportswear market is slowing down (2), and the effective use of corporate resources has become the key to competition. Since the production cost of winter sportswear is generally higher than that of spring and summer models (such as high-insulation materials and complex processes) (3, 4), extensive operations will magnify the risk of resource waste. Decision-making theories indicate that consumer decision-making is a continuous process (5), while understanding and satisfying consumer needs is widely regarded as a key factor for products or services to achieve market success (6). If companies are unable to accurately position demand, it will lead to rising production costs, inventory backlogs, and ultimately a loss of market share under pressure from high-performing competitors (7). To resolve this conflict, companies should achieve precise matching through a collaborative mechanism for demand analysis and resource allocation (8). The Kano model proposes that analyzing consumer needs should follow three sequential steps: identifying attributes, determining priorities, and classifying attributes (9, 10). The attributes here are defined as tangible or intangible characteristics of a product or service perceived by consumers (11), directly reflecting their genuine needs. Means-end chain theory also emphasizes that attributes can lead to positive or negative consequences in consumer decision-making (12). By precisely targeting sets of positive attributes, companies can proactively avoid disconnects between business operations and consumer needs, reduce wasteful resource allocation, and build sustainable competitive advantages and market success.
Based on the theoretical framework, this study focuses on the needs of Chinese winter sportswear consumers and defines attributes as tangible and intangible characteristics that Chinese winter sportswear consumers can directly perceive, including function, pricing, design, service, and brand (13–17). For instance, to build sustainable competitive advantages in the fiercely competitive sportswear market, some premium athletic apparel companies are developing a synergistic, multi-dimensional strategy: collaborating with renowned designers to enhance the aesthetic appeal of their brand logos; maintaining market exclusivity through high-tech functionality and strategic pricing; and complementing these efforts with luxury services to precisely respond to and lead increasingly diverse consumer demands (17). By conducting a structured analysis of the demand attributes and employing a composite evaluation model to achieve precise prioritization (18), we extract high-priority attribute groups as the core demands driving the market.
The four prioritization models commonly used in business research currently include the importance-performance analysis model (IPA), the Locus for Focus model (LF), the Borich needs assessment model, and the independent sample t-test model (t-test) (19). It should be noted that each model has specific application scenarios and methodological limitations. The t-test can only verify the statistical significance of differences in importance (I value) and expressiveness (P value), but cannot directly show the priority ranking of attributes. IPA divides the area into “Sustain Resources”, “Increase Resources” and “No change in Resources”, “Curtail Resources” areas through a two-dimensional matrix, which can be used to initially locate the required attributes (20). LF uses an incremental analysis method and is particularly good at identifying key improvement areas of “High importance—High discrepancy”, and can generate improvement recommendations with a level of 1–4 (21). LF is superior to IPA in terms of improvement direction assessment, but lacks IPA's regional positioning function (22). It is worth noting that the above three models cannot quantify the contribution value of demand attributes. However, the Borich demand assessment model can accurately measure the contribution of each attribute through importance-expressiveness weighting (23). Therefore, it is recommended to integrate the t-test, IPA, LF, and Borich Needs model to balance the natural limitations of each model through Redundancy analysis (24).
There is currently a significant seasonal research gap in the study of sportswear consumption (25). Existing research has focused on general functional attributes, often investigating conflicting seasonal needs such as perspiration resistance and wind resistance together, lacking a precise analysis of the matching of sports scenarios and consumer needs in different seasons (26). Researchers generally fail to recognize the importance of seasonal pricing strategies, ignoring the difference in the cost of clothing between winter and spring and summer and the impact of winter service elements on consumer demand (27, 28). The lack of these studies weakens the practical value of existing studies in guiding companies in making precise strategic decisions.
This study aims to identify the attributes of consumer demand for winter sportswear and make up for the lack of the existing seasonal dimension. Furthermore, it uses the composite model redundancy analysis method to accurately screen the decisive factors for Chinese consumers when purchasing winter sportswear. It provides a scientific basis for enterprises to achieve intensive production, improve marketing efficiency and optimize consumer decision-making.
2 Materials and methods
2.1 Research design and process
The design and process of this study are shown in Figure 1. This study employs purposive sampling, primarily targeting sports enthusiasts in cold winter regions such as Northeast China, North China, and Northwest China. All respondents must be consumers aged 16 or older who have purchased winter sports apparel within the past year. First, based on previous research, core indicators of consumer demand for winter sportswear were selected, and a scale was designed to pre-test 100 target consumers. Exploratory factor analysis (EFA) was used to optimize the item structure and reliability and validity. Subsequently, the researchers distributed the official online scale to 500 Chinese sports enthusiasts and standardized the subjects’ understanding and operational procedures through explanatory materials before filling in the scale to reduce data bias. After the scale was returned, the researchers eliminated invalid samples with duplicate options or missing information, and verified the stability of the data through formal EFA testing to confirm a valid dataset of 483.
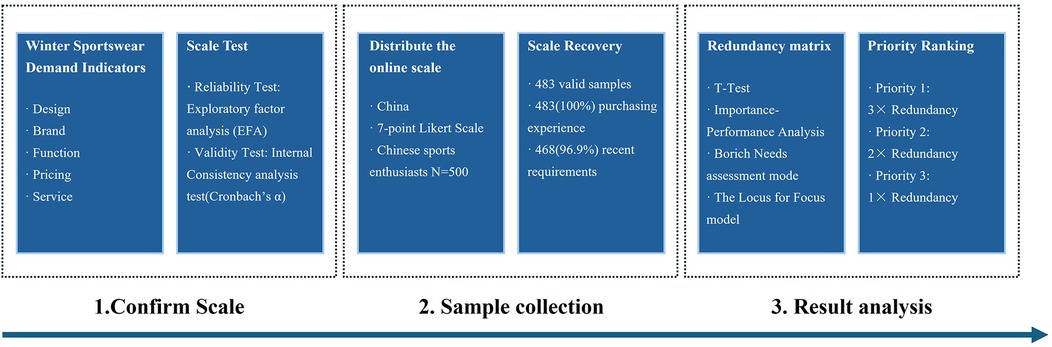
Figure 1. Design and process.
On this basis, the study then proceeds to a multi-dimensional analysis: demographic statistics (describing the attributes of the sample base), t-test matrix (comparing differences in consumer demand), IPA matrix diagram (locating the improved attributes in the second quadrant; The intersection of the abscissa P and ordinate I is determined using the average of the respective axes) (20), LF matrix diagram (locates the improvement attributes in the first quadrant; The intersection of the abscissa I-P and ordinate I is determined using the average of the respective axes) (21), and Borich demand value (measures the priority of consumer demand; Borich requirement degree ) (23).
Ultimately, the priority-redundancy matrix clarifies the resource allocation strategy and achieves the research objective of demand mining to priority ranking and decision support.
2.2 Research tools and testing
The measurement tool used in this study is based on Table 1, with modifications and additions. The scale uses a Likert-7 point scale, with 7 indicating strong agreement and 1 indicating strong disagreement. During pre-testing, the potential relationship between the scale variables and the data structure was tested using EFA. The default value is to delete items with a factor load <0.6. One item was deleted from the pre-survey (n = 100). After the formal scale was recovered, the reliability and validity of the scale were confirmed using Cronbach's Alpha, principal component analysis (PCA), and EFA. Based on the valid data (n = 483), the scale is divided into five first-level indicators: functions, pricing, service, design, and brands. The 25 secondary indicators are as follows: Functions (7 indicators, nos. 1–7), Pricing (3 indicators, nos. 8–10), Service (4 indicators, nos. 11–14), Design (4 indicators, nos. 15–18), Brands (7 indicators, nos. 19–25). The results are shown in Table 1.
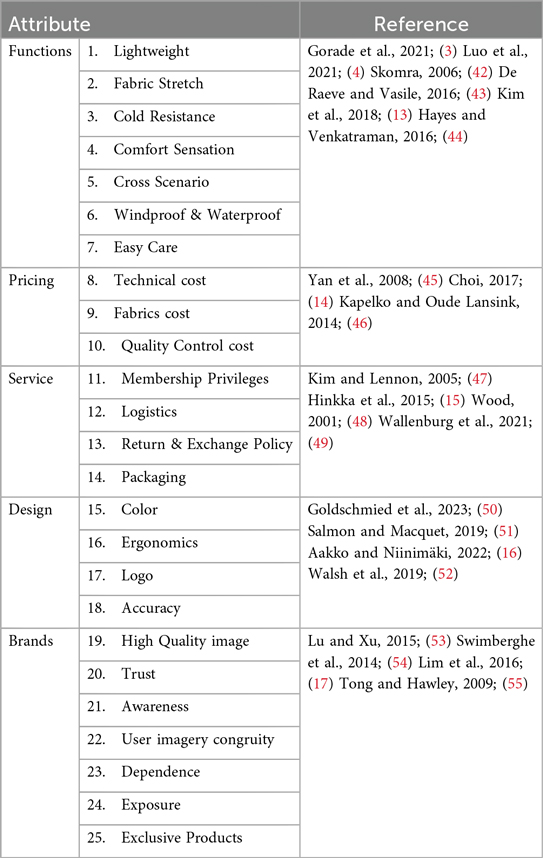
Table 1. Source of core indicators.
Reliability is measured using Cronbach's alpha. The validity test uses EFA to measure the factors and factor loadings contained in each attribute. In the EFA test, this study uses a factor load ≥0.6 as a reference value, which is higher than the international standard. Items with factor loads below the standard are deleted, and the next exploratory factor analysis is performed again until all factors reach the reference value. After three rounds of exploration factor analysis, all 7 items of brand equity were retained; 2 of the 9 items of functionality were deleted, leaving 7 items; all 4 items of design were retained; all 4 items of after-sales service were retained; and 1 of the 4 items of price was deleted, leaving 3 items.
In the end, the sportswear selection attributes were reduced from 28 items to 25 items. The reliability test found that the Cronbach's α values of all secondary variables ranged from .879 to .928, all of which were greater than 0.7. The KMO value was 0.917, which met the preconditions for exploration factor analysis. The validity test found that the factor loadings within the five secondary variables were all greater than the standard value of 0.6. The above results prove that the questionnaire has good reliability and validity. The specific parameters are shown in Table 2; Figure 2.
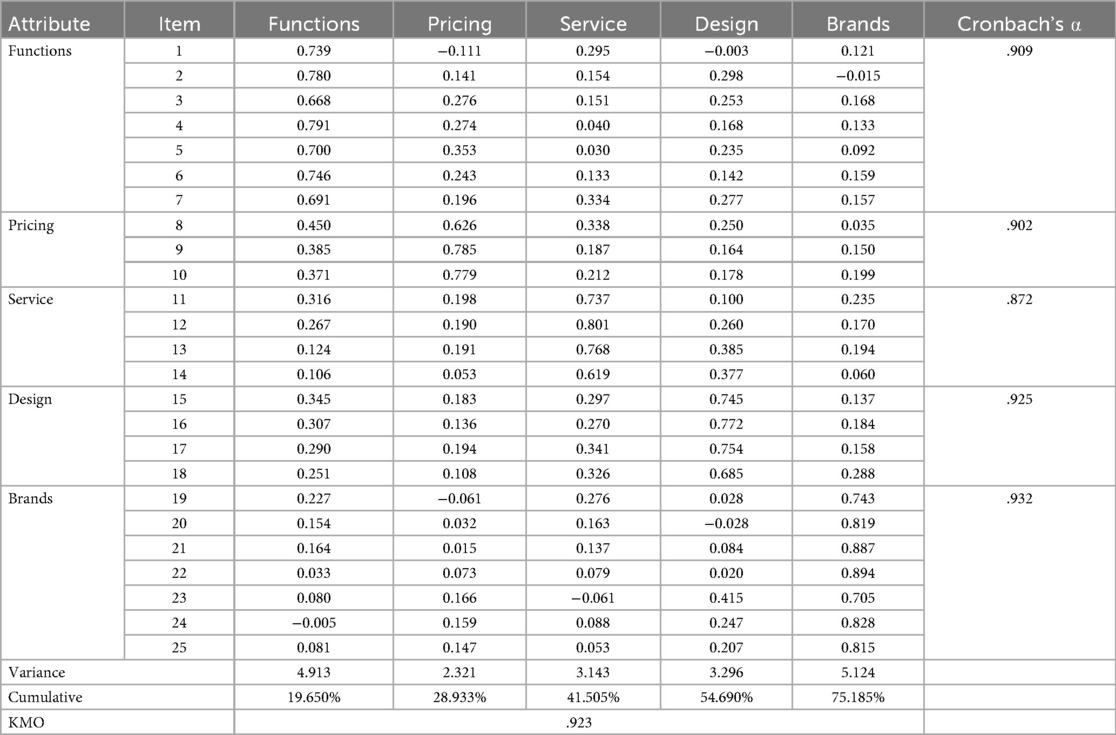
Table 2. Reliability and validity test.
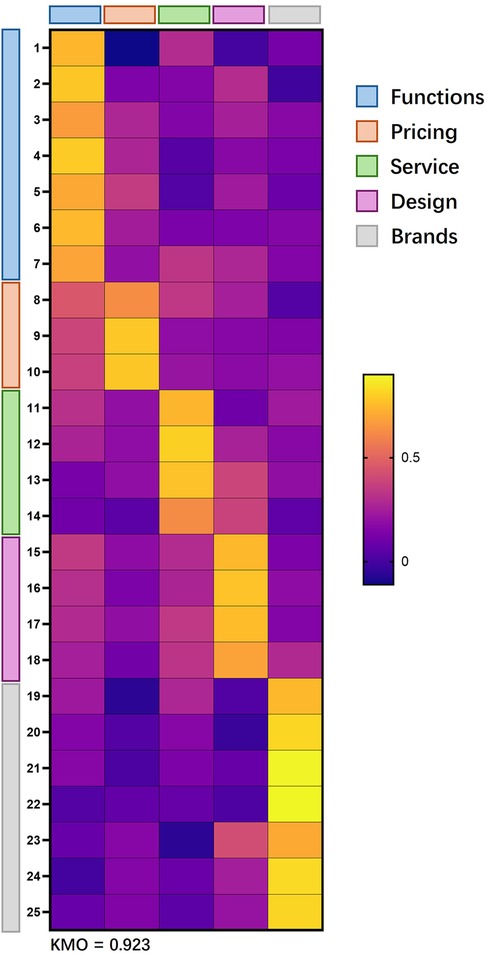
Figure 2. Results of reliability and validity test.
2.3 Participants and sample
A total of 483 valid scale data were collected in this study, and data collection was completed by participants using their mobile phones to scan QR codes. All participants met the following criteria: 1) they had the consumption experience of purchasing Winter sportswear; 2) they volunteered to participate in this study. Before entering the questionnaire system, participants first needed to sign an informed consent form online before they could start filling out the scale. In addition, this research proposal has been formally approved after the ethical review by the institutional review board.
2.4 Data analysis
After preprocessing the data collected, SPSS27 was used for statistics (IPA, LF, Borich needs values and priorities–redundancy matrix). Descriptive statistics were used for demographic variables. The significance of the importance and expressiveness of the demand attributes was tested using an independent sample t-test with a significance level of p < 0.05.
3 Results
3.1 Demographic characteristics
All subjects had experience buying sportswear, and 96.9% (468) of them said they had a recent need to buy. The specific demographic characteristics are shown in Table 3. The power analysis (G Power 3.1, Germany) showed that a minimum of 105 participants were required to detect a medium effect size (d = 0.5) with an alpha of 0.05 and a statistical power of 95%. Thus, the sample size of this study fully meets the statistical power requirements.
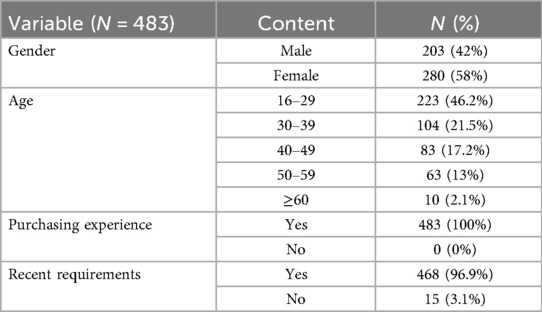
Table 3. General characteristics of the participants.
3.2 The importance and performance of winter sportswear
This study used the t-test to evaluate the differences between importance and performance (Table 4; Figure 3). The results showed that there were differences between importance and performance for all 25 items (reference value P < 0.05). In addition, it was found that the GAP value for brands (19–25) was <0; the Gap values for function (1–7), pricing (8–10), service (11–14), and design (15–18) were >0.
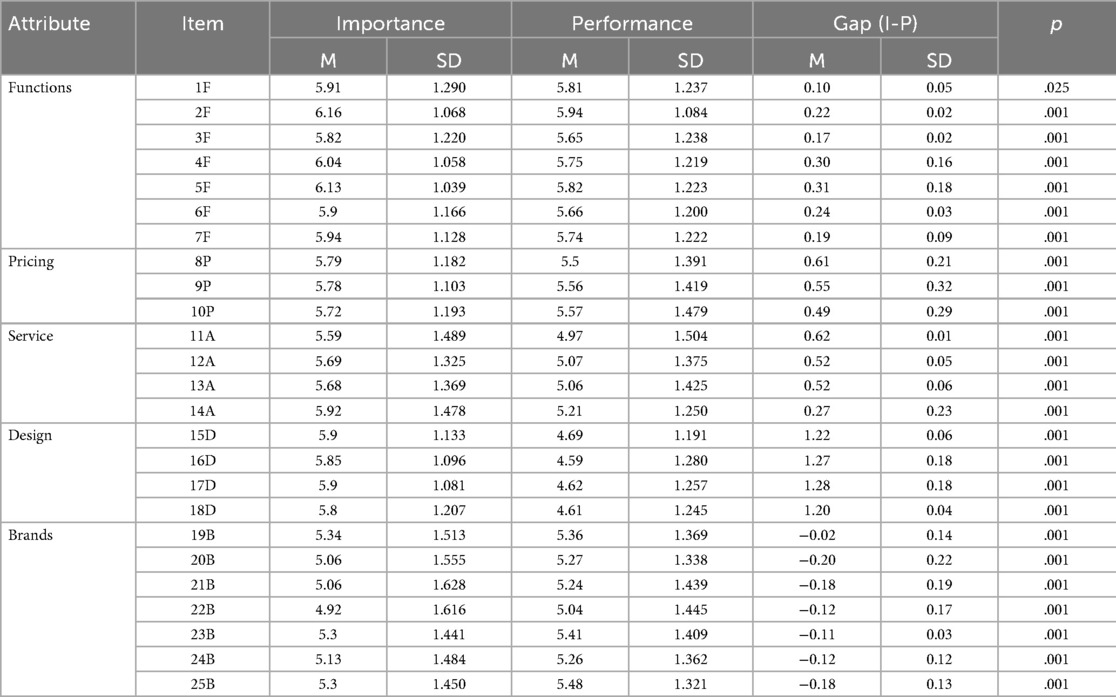
Table 4. Results of importance and performance T-test.
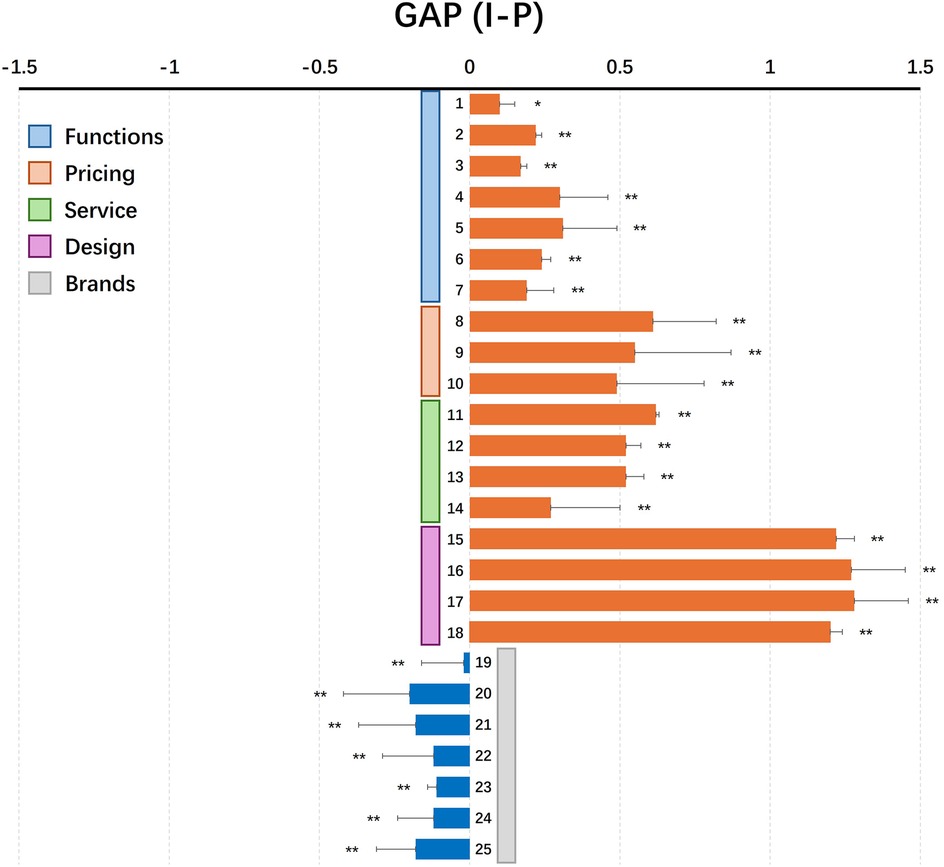
Figure 3. Results of the Gap level (importance and performance). Data was analyzed by t-test (*p < 0.05; **p < 0.01; ***p < 0.001).
3.3 Results of the IPA
The results of the IPA matrix are shown in Figure 4; Table 5. The second quadrant is the area of highest priority, where the price attributes (8–10) and design (15–18) appear. The seven attributes of price and design go into the priority-redundancy analysis.
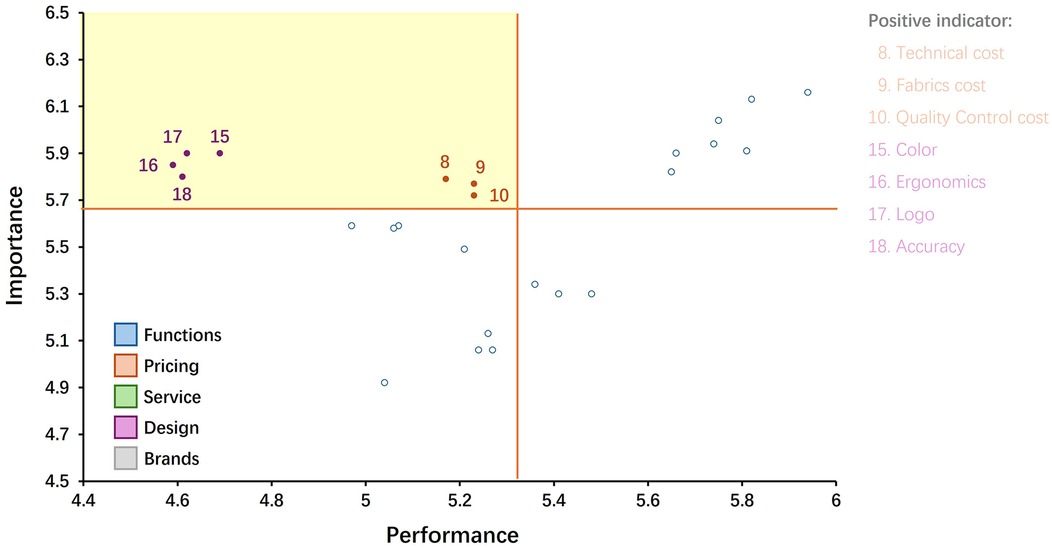
Figure 4. Results of the IPA.
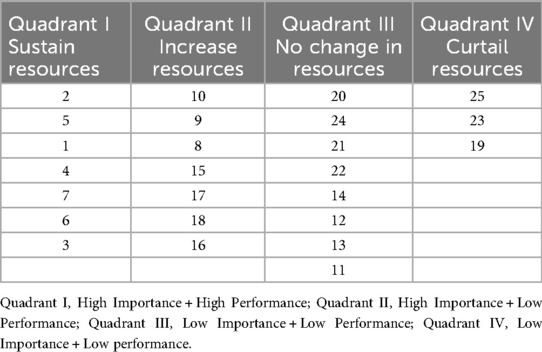
Table 5. Four-Quadrant results of IPA.
3.4 Results of the FL
The results of the IPA matrix are shown in Figure 5; Table 6. The first quadrant is the area of highest priority, where services (12–14) and design (15–18) appear. The seven attributes of services and design enter into a priority-redundancy analysis.
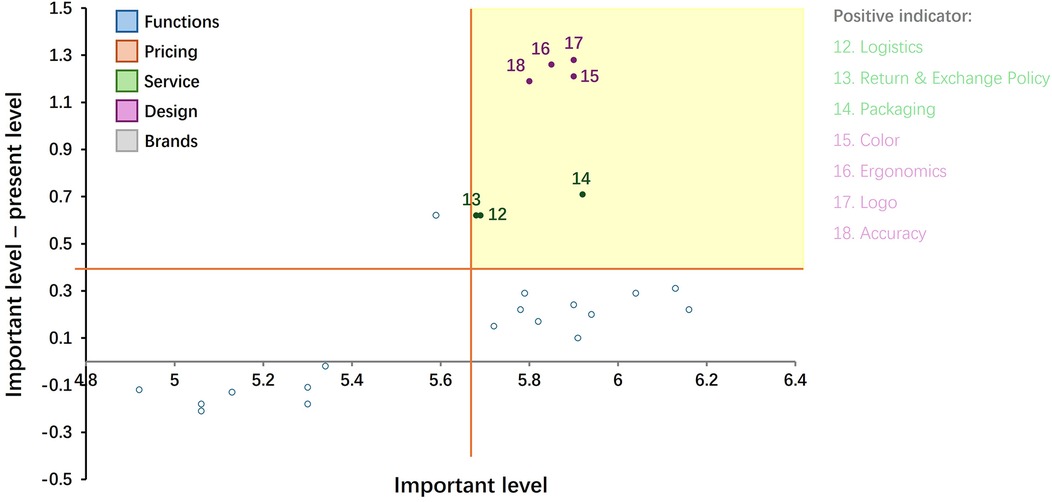
Figure 5. Results of the FL.
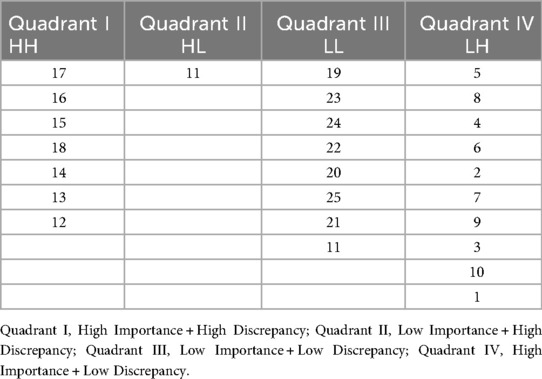
Table 6. Four-Quadrant results of LF.
3.5 Results of the borich needs assessment
The results of the Borich needs assessment are shown in Table 7. The second quadrant of IPA and the first quadrant of FL are both high priority areas, with seven overlapping items. Therefore, the need analysis determines that the top seven values are of the highest priority. Design (15–18) and service (12–14) appear.
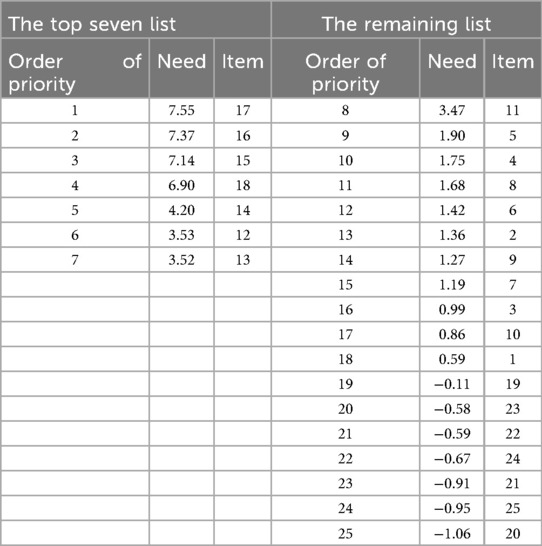
Table 7. Priority results of borich needs assessment mode.
3.6 Results of the priority-redundancy analysis
The results of the Borich needs assessment are shown in Table 8. The seven highest priority items in the second quadrant of IPA 8, 9, 10, 15, 16, 17, 18 (Figure 4; Table 5); the seven highest priority items in the first quadrant of FL 12, 13, 14, 15, 16, 17, 18 (Figure 5; Table 6); and the seven items with the highest priority in the Need analysis 12, 13, 14, 15, 16, 17, 18 are included in the redundancy analysis (Table 7). It was found that the design items (15–18) were redundant three times, and the first priority improvement area was finally determined. The service items (12–14) were redundant twice, and the second priority improvement area was finally determined. The price (8–10) was redundant once, and the third priority improvement area was finally determined.
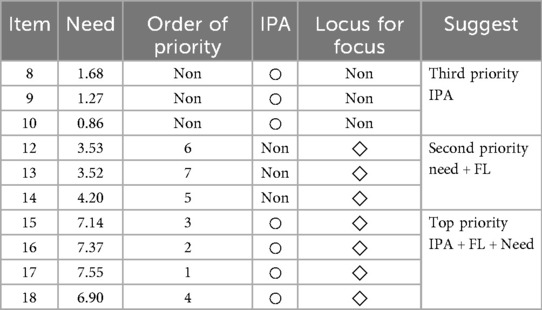
Table 8. Results of redundancy analysis.
4 Discussion
Research data shows that all respondents have purchased sportswear before, and 96.9% of them have a recent demand for winter sportswear. Analysis of the 25 items shows that there are significant differences in the dimensions of importance and performance. Specifically, in the dimension of design attributes, items 15, 16, 17, and 18 were identified as the top priority areas for improvement; items 12, 13, and 14 in the service attribute dimension were ranked as the second priority for improvement; and items 8, 9, and 10 in the price attribute dimension were ranked as the third priority for improvement (Table 8). This hierarchical result provides a clear direction for the optimal allocation of resources for winter sportswear companies.
Redundancy (×3) analysis: Based on comprehensive analysis results, color design, ergonomic design, brand logo design, and detail design should be ranked as the attributes with the highest priority for improvement (Table 8). The IPA analysis (Figure 4; Table 5) shows that these attributes have high importance and low performance characteristics. Consumers attach the greatest importance to unmet needs and urgently need improvement. At the same time, the LF analysis (Figure 5; Table 6) confirms that these needs are not only prominent in importance, but also highly controllable, which means that companies can achieve efficient improvement through reasonable resource allocation. The Need analysis (Table 7) further verifies the key position of these attributes. They rank among the top 4 out of 25 needs and are core attributes of consumer demand. These design attributes not only have a decisive impact on purchasing decisions, but they are also attributes over which companies have the best control. Prioritizing improvements in these areas will bring significant revenue growth. In the sportswear industry, these design elements are mainly concentrated in the production process, which directly affects the competitiveness of the product in the market. Therefore, it is recommended that companies focus on increasing investment in the design process, including measures such as introducing high-end design talent and increasing R&D budgets. In this way, companies can quickly respond to changes in market demand within controllable resources and accurately meet consumer expectations, thereby gaining the greatest competitive advantage.
The results of the research design attributes echo with the existing literature in multiple dimensions. In terms of color design, an empirical study by Roberts et al. revealed that the color design of sportswear not only significantly affects the choice preferences of male and female consumers, but also has a positive effect on competitive sports performance, which partially supports the results of this study (29). It is worth noting that the design requirements for winter sportswear are higher than those for ordinary clothing, as it needs to meet the dual needs of high-intensity sports scenarios and keeping warm. This characteristic is further explained in an ergonomic study, where consumers’ need for the ergonomic design of sportswear to improve sports comfort and performance is driving ergonomic design as a core manufacturing attribute of products (30). In addition, Oliveira et al. found that 79.6% of respondents found it difficult to move their bodies in cold environments, and that the ergonomics of clothing still needs further improvement, which partially supports the results of this study (31). In terms of brand logo design, the team logo creates a sustained driving force for consumption through emotional connections, and is demonstrating the value of consumption through the mass media (32). At the level of fine design, Li et al. quantified the positive impact of fine design on corporate cost control. Increasing design fineness can reduce operating costs and improve consumer satisfaction, which partially supports the results of this study (33). By cross-checking existing literature, this study extends the theory in three ways: First, it clarifies that color, ergonomics, brand logos, and detailed design constitute the core dimensions of consumer demand; second, it reveals a direct correlation between specific design solutions and the efficiency of enterprise resource allocation; and third, it matches the design attributes of sportswear with consumer usage scenarios through an analysis of winter scenes. These findings provide a decision-making basis for precise research and development in the sportswear industry that combines theoretical depth with practical value.
Redundancy (×2) analysis: According to the LF analysis, logistics, return policies and packaging should be given the highest priority for improvement. The Need analysis shows that these attributes rank 5th to 7th out of 25 indicators, indicating that they are important but not the most urgent. The IPA analysis further confirms that the current service performance is basically in line with consumer expectations and does not need to be improved for the time being. Redundant analysis confirms the significance of LF and Need results, while IPA results are meaningless. It can be determined that these service attributes, although they will affect consumers’ purchase decisions, have a relatively limited scope of influence. For service-sensitive consumers, companies should optimize these service links appropriately to remain competitive. For example, businesses that allow consumers to implement different interaction policies across physical and online channels, and logistics and distribution significantly increase the willingness to buy (34). While a lenient return policy meets consumer expectations, it also greatly increases operating costs. To control operating costs, companies should formulate differentiated return policies for clearance products and full-price products (35). In the context of homogeneous product quality, exquisite packaging can immediately stimulate consumer desire and increase willingness to pay. This effect has been verified in both the Chinese and American markets (36, 37) Given that winter sportswear sales highly overlap with the holiday season, companies need to accurately target gift consumers and adjust their marketing strategies in a timely manner. For non-service-oriented enterprises, it is recommended to set improvement priority to the second sequence. Accurately positioning consumer groups requires further in-depth measurement by the enterprise.
Redundancy (×1) analysis: Through a comprehensive analysis of process costs, fabric costs, and quality control costs, these attributes were found to be significant in the IPA analysis, but did not reach a significant level in the LF and demand analysis. As lower-level attributes of price, they mainly affect the pricing strategy of the enterprise. It should be emphasized that these cost elements are the key foundation for ensuring the quality of sportswear. Any reduction in related inputs to reduce prices will inevitably lead to a reduction in the profit margin or a decline in product quality, which in turn will quickly cause the enterprise to lose its competitive advantage in the market (38). Based on these attributes being in the third sequence of improvement priority, it is recommended that these price-related attributes avoid over-allocating the company's limited resources. Combined with the seasonal characteristics of the winter sportswear market, demand usually shows a rapid increase followed by a stable trend as the temperature changes (39, 40). Therefore, management strategies with low resource consumption, such as dynamic pricing mechanisms, on-demand production models, and accurate grasp of consumers’ psychological price thresholds, are recommended in order to achieve the optimal balance of maximizing corporate profits and price competitiveness (41).
In summary, the top three attributes that consumers care about most in the China winter sportswear market are, in order of priority: design, service and pricing. Comprehensive analysis shows that process cost, fabric cost and quality control cost are significant in IPA analysis, but not in LF and demand analysis. As lower-level attributes of price, these factors mainly affect the pricing strategy of enterprises. It should be noted that they form the key basis for quality assurance of sportswear. At the same time, the market demand for winter sportswear shows obvious seasonal characteristics, which will rapidly increase with temperature changes and then tend to stabilize. Therefore, it is recommended that companies adopt management strategies with low resource consumption, such as dynamic pricing mechanisms, on-demand production models, and accurate grasp of consumers’ psychological price thresholds, in order to achieve the optimal balance of profit maximization and price competitiveness. Given that these attributes are in the third sequence of improvement priorities, it is recommended that companies avoid over-allocating limited resources.
This study has certain geographical limitations. There is a significant temperature disparity between southern and northern China during winter, with southern regions even allowing outdoor exercise without the need for winter sportswear. The findings of this study are primarily based on survey data from colder regions of China (Northeast, North, Northwest, etc.). Due to geographical differences, the results may have limitations or lag in applying to areas like South China and Southwest China. Based on this, future research can be furthered in three directions: First, the market should be divided according to climate zones to conduct a more accurate analysis of demand prioritization; Second, more cross-scenario research is needed, especially an analysis of consumer demand prioritization when switching between indoor and outdoor sports in winter. Finally, it is recommended to expand to other seasons of sportswear demand prioritization research to establish a more comprehensive consumer demand prioritization system. In variable selection, the current model primarily focuses on core attributes such as design, service, and price, without fully incorporating emerging demand attributes like social recognition. Future research could expand the attribute scope to more comprehensively reflect market dynamics. Future studies may explore differences in demand structures across distinct consumer segments (e.g., professional sports, fitness, leisure) to enhance the explanatory power of winter sportswear attribute priorities.
5 Conclusions
In the China winter sports apparel market, the three attributes that consumers care about most are design, service, and pricing, in that order. Among these, design is an attribute of consumer needs that are unmet and urgently require improvement, and it is highly controllable. Companies can efficiently improve this attribute by adjusting design resource allocation, so it should be the primary focus for improvement. Although service attributes have a certain impact on purchasing decisions, their scope of influence is relatively limited. Companies can maintain their competitive advantage by targeting service-sensitive consumer groups with targeted optimizations. Service dimension ranks in the secondary improvement sequence. In contrast, improvements in pricing factors have the lowest priority, and companies are advised to avoid overemphasizing this area to ensure consistency between resource allocation efficiency and strategic priorities.
Data availability statement
The raw data supporting the conclusions of this article will be made available by the authors, without undue reservation.
Ethics statement
The studies involving humans were approved by the Ethics Committee of Jeonbuk National University. The studies were conducted in accordance with the local legislation and institutional requirements. The participants provided their written informed consent to participate in this study.
Author contributions
KY: Conceptualization, Data curation, Investigation, Methodology, Writing – original draft, Writing – review & editing. WL: Methodology, Visualization, Writing – original draft, Writing – review & editing. ZS: Writing – original draft, Writing – review & editing, Funding acquisition, Supervision.
Funding
The author(s) declare that financial support was received for the research and/or publication of this article. This work was supported by the Liaoning Provincial Federation of Social Sciences and the Foundation of Social Science Planning Foundation of Liaoning Province (L24BTY006).
Conflict of interest
The authors declare that the research was conducted in the absence of any commercial or financial relationships that could be construed as a potential conflict of interest.
Generative AI statement
The author(s) declare that no Generative AI was used in the creation of this manuscript.
Any alternative text (alt text) provided alongside figures in this article has been generated by Frontiers with the support of artificial intelligence and reasonable efforts have been made to ensure accuracy, including review by the authors wherever possible. If you identify any issues, please contact us.
Publisher's note
All claims expressed in this article are solely those of the authors and do not necessarily represent those of their affiliated organizations, or those of the publisher, the editors and the reviewers. Any product that may be evaluated in this article, or claim that may be made by its manufacturer, is not guaranteed or endorsed by the publisher.
References
1. Wagner AL, Keusch F, Yan T, Clarke PJ. The impact of weather on summer and winter exercise behaviors. J Sport Health Sci. (2019) 8(1):39–45. doi: 10.1016/j.jshs.2016.07.007
2. Mckinsey. Sporting Goods 2025—The New Balancing Act: Turning Uncertainty into Opportunity. Copenhagen: McKinsey & Company (2025). Available online at: https://www.mckinsey.com/industries/retail/our-insights/sporting-goods-industry-trends (Accessed March 4, 2025).
3. Gorade VG, Chaudhary BU, Kale RD. Polyester fabric with moisture management properties using a sol–gel technique for activewear. J Polym Res. (2021) 28(8):296. doi: 10.1007/s10965-021-02650-7
4. Luo X, Cheng P, Wang W, Fu J, Gao W. Established an eco-friendly cotton fabric treating process with enhancing anti-wrinkle performance. J Eng Fiber Fabr. (2021) 16:15589250211003454. doi: 10.1177/15589250211003454
5. Karimi S, Holland CP, Papamichail KN. The impact of consumer archetypes on online purchase decision-making processes and outcomes: a behavioural process perspective. J Bus Res. (2018) 91:71–82. doi: 10.1016/j.jbusres.2018.05.038
6. McKay A, de Pennington A, Baxter J. Requirements management: a representation scheme for product specifications. Computer Aided Design. (2001) 33(7):511–20. doi: 10.1016/s0010-4485(01)00050-1
7. Chen H, Hsu CW. Internationalization, resource allocation and firm performance. Ind Mark Manag. (2010) 39(7):1103–10. doi: 10.1016/j.indmarman.2009.10.001
8. Bradley J. Management based critical success factors in the implementation of enterprise resource planning systems. Int J Account Inform Syst. (2008) 9(3):175–200. doi: 10.1016/j.accinf.2008.04.001
9. Kano N, Seraku N, Takahashi F, Tsuji S. Attractive quality and must-be quality. J Jpn Soc Qual Control. (1984) 14:39–48.
10. Xu Q, Jiao RJ, Yang X, Helander M, Khalid HM, Opperud A. An analytical kano model for customer need analysis. Design Stud. (2009) 30(1):87–110. doi: 10.1016/j.destud.2008.07.001
11. Hsiao CC, Yen HJR, Eldon YL. Exploring consumer value of multi-channel shopping: a perspective of means-end theory. Int Res. (2012) 22(3):318–39. doi: 10.1108/10662241211235671
12. Gutman J. A means-end chain model based on consumer categorization processes. J Mark. (1982) 46(2):60–72. doi: 10.1177/002224298204600207
13. Kim S, Kim E, Park Y. Thermal insulation and morphology of natural and synthetic filled outdoor sportswear by repeated water washing and dry cleaning. Int J Cloth Sci Technol. (2018) 30(3):428–43. doi: 10.1108/IJCST-09-2017-0149
14. Choi SC. Defensive strategy against a private label: building brand premium for retailer cooperation. J Retail Consum Serv. (2017) 34:335–9. doi: 10.1016/j.jretconser.2016.07.011
15. Hinkka V, Häkkinen M, Holmström J, Främling K. Supply chain typology for configuring cost-efficient tracking in fashion logistics. Int J Logist Manag. (2015) 26(1):42–60. doi: 10.1108/IJLM-03-2011-0016
16. Aakko M, Niinimäki K. Quality matters: reviewing the connections between perceived quality and clothing use time. J Fash Mark Manag Int J. (2022) 26(1):107–25. doi: 10.1108/JFMM-09-2020-0192
17. Lim CH, Kim K, Cheong Y. Factors affecting sportswear buying behavior: a comparative analysis of luxury sportswear. J Bus Res. (2016) 69(12):5793–800. doi: 10.1016/j.jbusres.2016.04.176
18. Ha J, Park D. Educational needs related to elder abuse among undergraduate nursing students in Korea: an importance-performance analysis. Nurse Educ Today. (2021) 104:104975. doi: 10.1016/j.nedt.2021.104975
19. Wang CH, Fong HY. Integrating fuzzy kano model with importance-performance analysis to identify the key determinants of customer retention for airline services. J Ind Prod Eng. (2016) 33(7):450–8. doi: 10.1080/21681015.2016.1155668
20. Murali S, Pugazhendhi S, Muralidharan C. Integration of IPA and QFD to assess the service quality and to identify after sales service strategies to improve customer satisfaction–a case study. Prod Plan Control. (2016) 27(5):394–407. doi: 10.1080/09537287.2015.1129463
21. Kim H, Choi D, Shim H, Sohng KY, Choi MJ. Educational needs of community visiting nurses for infection prevention and control: application of the borich needs assessment and the locus for focus models. Public Health Nurs. (2024) 41(4):643–52. doi: 10.1111/phn.13328
22. Azzopardi E, Nash R. A critical evaluation of importance–performance analysis. Tour Manag. (2013) 35:222–33. doi: 10.1016/j.tourman.2012.07.007
23. Lee Y, Jeong S, Cho D. Assessing adult and continuing education needs in South Korea metropolitan areas using borich’s needs assessment model. Eur J Train Dev. (2021) 45(8/9):832–44. doi: 10.1108/EJTD-08-2020-0133
24. Ziwei K, Mengjiao C, Yongjie Z, Mengqi Z, Yeqin Y. Optimizing palliative care education through undergraduate nursing students’ perceptions: application of importance-performance analysis and borich needs assessment model. Nurse Educ Today. (2023) 122:105719. doi: 10.1016/j.nedt.2023.105719
25. Saricam C. Analysing service quality and its relation to customer satisfaction and loyalty in sportswear retail market. Autex Res J. (2022) 22(2):184–93. doi: 10.2478/aut-2021-0014
26. Xu J, Zhou Y, Zhang L, Wang J, Lefloch D. Sportswear retailing forecast model based on the combination of multi-layer perceptron and convolutional neural network. Text Res J. (2021) 91(23-24):2980–94. doi: 10.1177/00405175211020518
27. Chi T. The effects of contingency factors on perceived values of casual sportswear: an empirical study of US consumers. Asia Pac J Mark Logist. (2013) 25(2):249–62. doi: 10.1108/13555851311314040
28. Siomkos G, Vasiliadis C, Lathiras P. Measuring customer preferences in the winter sports market: the case of Greece. J Target Measure Anal Mark. (2006) 14:129–40. doi: 10.1057/palgrave.jt.5740175
29. Roberts SC, Owen RC, Havlicek J. Distinguishing between perceiver and wearer effects in clothing color-associated attributions. Evol Psychol. (2010) 8(3):350–64. doi: 10.1177/147470491000800304
30. Varadaraju R, Srinivasan J. Design of sports clothing for hot environments. Appl Ergon. (2019) 80:248–55. doi: 10.1016/j.apergo.2018.02.013
31. Oliveira AVM, Gaspar AR, André JS, Quintela DA. Subjective analysis of cold thermal environments. Appl Ergon. (2014) 45(3):534–43. doi: 10.1016/j.apergo.2013.07.013
32. Bishop R. Stealing the signs: a semiotic analysis of the changing nature of professional sports logos. Soc Sem. (2001) 11(1):23–41. doi: 10.1080/10350330125030
33. Li J, Xia S, West AJ, Istook CL. Fashionable sportswear working as a body measurement collecting tool. Int J Cloth Sci Technol. (2022) 34(4):589–604. doi: 10.1108/IJCST-07-2021-0090
34. Swoboda B, Winters A. Effects of the most useful offline-online and online-offline channel integration services for consumers. Decis Support Syst. (2021) 145:113522. doi: 10.1016/j.dss.2021.113522
35. Altug MS, Aydinliyim T. Counteracting strategic purchase deferrals: the impact of online retailers’ return policy decisions. Manuf Serv Oper Manag. (2016) 18(3):376–92. doi: 10.1287/msom.2015.0570
36. Reimann M, Zaichkowsky J, Neuhaus C, Bender T, Weber B. Aesthetic package design: a behavioral, neural, and psychological investigation. J Consum Psychol. (2010) 20(4):431–41. doi: 10.1016/j.jcps.2010.06.009
37. Zhang M, Teng L, Huang X, Foti L, Sun C, Yang X. Face consciousness: the impact of gift packaging shape on consumer perception. Eur J Mark. (2025) 59(2):241–85. doi: 10.1108/EJM-08-2023-0658
38. Liozu S, Hinterhuber A. Pricing as a driver of profitable growth: an agenda for CEOs and senior executives. Bus Horiz. (2022) 65(4):457–67. doi: 10.1016/j.bushor.2021.06.002
39. Oh J, Ha KJ, Jo YH. A predictive model of seasonal clothing demand with weather factors. Asia Pac J Atmos Sci. (2022) 58(5):667–78. doi: 10.1007/s13143-022-00284-3
40. Oh J, Jo YH, Ha KJ. The effect of anomalous weather on the seasonal clothing market in New York. Meteorol Appl. (2021) 28(2):e1982. doi: 10.1002/met.1982
41. Levy M, Grewal D, Kopalle PK, Hess JD. Emerging trends in retail pricing practice: implications for research. J Retail. (2004) 80(3):13–21. doi: 10.1016/j.jretai.2004.08.003
42. Skomra E. A Comparative Study of Athletic Apparel Made from Cotton/flax, Cotton/polyester, and Polyester/flax Blends. Ypsilanti, MI: Eastern Michigan University (2006).
43. De Raeve A, Vasile S. Adapted performance sportswear. Proceedings of the 7th International Conference on 3D Body Scanning Technology; Lugano, Switzerland (2016) 30. p. 9–15
44. Hayes SG, Venkatraman P. Materials and Technology for Sportswear and Performance Apparel. Boca Raton, FL: CRC Press (2016).
45. Yan H, Tang SL, Yen G. Quick response procurement cost control strategy for fabric manufacturing. Int J Prod Res. (2008) 46(17):4769–84. doi: 10.1080/00207540701210037
46. Kapelko M, Oude Lansink A. Examining the relation between intangible assets and technical efficiency in the international textile and clothing industry. J Text Inst. (2014) 105(5):491–501. doi: 10.1080/00405000.2013.826417
47. Kim M, Lennon SJ. The effects of customers’ dress on salesperson’s service in large-sized clothing specialty stores. Clothing and Textiles Research Journal. (2005) 23(2):78–87. doi: 10.1177/0887302X0502300202
48. Wood SL. Remote purchase environments: the influence of return policy leniency on two-stage decision processes. J Mark Res. (2001) 38(2):157–69. doi: 10.1509/jmkr.38.2.157.18847
49. Wallenburg CM, Einmahl L, Lee KB, Rao S. On packaging and product returns in online retail—mailing boxes or sending signals? J Bus Logist. (2021) 42(2):291–308. doi: 10.1111/jbl.12273
50. Goldschmied N, Furley P, Bush R. Critical review of uniform color effects in sports. Int Rev Sport Exerc Psychol. (2020) 16(1):311–36. doi: 10.1080/1750984X.2020.1855668
51. Salmon PM, Macquet AC. Human factors and ergonomics in sport and outdoor recreation: from individuals and their equipment to complex sociotechnical systems and their frailties. Appl Ergon. (2019) 80:209–13. doi: 10.1016/j.apergo.2018.08.027
52. Walsh MF, Cui AP, MacInnis DJ. How to successfully introduce logo redesigns. J Brand Manag. (2019) 26:365–75. doi: 10.1057/s41262-018-0141-1
53. Lu J, Xu Y. Chinese young consumers’ brand loyalty toward sportswear products: a perspective of self-congruity. J Prod Brand Manag. (2015) 24(4):365–76. doi: 10.1108/JPBM-05-2014-0593
54. Swimberghe KR, Astakhova M, Wooldridge BR. A new dualistic approach to brand passion: harmonious and obsessive. J Bus Res. (2014) 67(12):2657–65. doi: 10.1016/j.jbusres.2014.04.003
Keywords: winter sportswear, requirement attributes, priority, IPA, borich, LF
Citation: Yang K, Liu W and Song Z (2025) Optimizing winter sportswear design and service priorities in China: a multi-model assessment. Front. Sports Act. Living 7:1627600. doi: 10.3389/fspor.2025.1627600
Received: 13 May 2025; Accepted: 6 October 2025;
Published: 21 October 2025.
Edited by:
Ekaterina Glebova, Université Paris-Saclay, FranceReviewed by:
Detak Prapanca, Universitas Muhammadiyah Sidoarjo, IndonesiaRaquel Nunes, Federal University of Rio de Janeiro, Brazil
Copyright: © 2025 Yang, Liu and Song. This is an open-access article distributed under the terms of the Creative Commons Attribution License (CC BY). The use, distribution or reproduction in other forums is permitted, provided the original author(s) and the copyright owner(s) are credited and that the original publication in this journal is cited, in accordance with accepted academic practice. No use, distribution or reproduction is permitted which does not comply with these terms.
*Correspondence: Wenduo Liu, bHdkMTIwNEBqYm51LmFjLmty; Zhengxue Song, a251c29uZ0BzeW51LmVkdS5jbg==