 Rohan G. T. Lowe*
 Owen McCorkelle
 Mark BleackleyChristine Collins
 Pierre Faou
 Suresh Mathivanan
 Marilyn Anderson
- Department of Biochemistry and Genetics, La Trobe Institute for Molecular Science, La Trobe University, Melbourne, VIC, Australia
The plant pathogenic fungus Fusarium graminearum (Fgr) creates economic and health risks in cereals agriculture. Fgr causes head blight (or scab) of wheat and stalk rot of corn, reducing yield, degrading grain quality, and polluting downstream food products with mycotoxins. Fungal plant pathogens must secrete proteases to access nutrition and to breakdown the structural protein component of the plant cell wall. Research into the proteolytic activity of Fgr is hindered by the complex nature of the suite of proteases secreted. We used a systems biology approach comprising genome analysis, transcriptomics and label-free quantitative proteomics to characterize the peptidases deployed by Fgr during growth. A combined analysis of published microarray transcriptome datasets revealed seven transcriptional groupings of peptidases based on in vitro growth, in planta growth, and sporulation behaviors. A high resolution mass spectrometry-based proteomics analysis defined the extracellular proteases secreted by F. graminearum. A meta-classification based on sequence characters and transcriptional/translational activity in planta and in vitro provides a platform to develop control strategies that target Fgr peptidases.
Introduction
The first stages of the plant fungal-pathogen interaction occur on epidermal cells, followed by intercellular spaces such as the apoplastic space (Jones and Dangl, 2006). Proteins secreted by pathogens may dictate the interaction on several levels: (1) Degrading enzymes breakdown host macromolecules to provide nutrition for the pathogen (Brunner et al., 2013). (2) Toxin proteins actively disrupt cellular function of the host and kill cells (Ciuffetti et al., 2010). (3) Immune modulator proteins may inadvertently alert the host to pathogen attack preventing colonization, or conversely they may camouflage non-protein elicitors such as chitin to allow continued growth (Dodds and Rathjen, 2010). Indeed, the size and complexity of a fungal secretome is shaped by their lifestyle and ecological niche (Lowe and Howlett, 2012).
Plant pathogens must extract nutrition from the host plant during colonization, and this aspect of the interaction will be the basis of our study. Two of the key nutrients for fungal growth are carbon and nitrogen. Carbon, most often in the form of carbohydrate, is required as a source of cellular energy as well as for growth and remodeling. Nitrogen is required for synthesis of proteins and nucleic acids. Host-derived protein provides a major source of both carbon and nitrogen. These host proteins must be digested into short peptide fragments before import, and this digestion is performed by a suite of proteases that are secreted into the environment. Therefore, a key aspect of the host-pathogen interaction is this interplay between peptidases secreted by the pathogen and the host substrates.
The host is not a passive partner. It actively responds to signs of infection, such as damage-associated molecular patterns (DAMPS). These DAMPS may be created by the action of secreted proteins, for example when peptidase activity releases hydrophobic peptides that are normally sequestered in the native protein (Seong and Matzinger, 2004). Responses include deployment of a range of defense molecules that have evolved to prevent the fungus from establishing an infection. Defense strategies in the plant have been studied from a number of different aspects and there is an abundance of literature on the subject (Jones and Dangl, 2006). Less is known about the proteins that the fungus produces to invade the plant tissue, evade the immune response and utilize plant material as a source of carbon, nitrogen and other essential nutrients.
Research on the proteins secreted by the fungus as virulence factors has focused on small proteins described as fungal effectors, for example, avirulence proteins reviewed in Stergiopoulos and de Wit (2009). The role of peptidases in plant-pathogen interactions has been dominated by classical nutrient acquisition, or catabolic activities, but there are instances of peptidases determining the outcome of a plant-pathogen interaction by other mechanisms. The bacterial effector HopN1, from Pseudomonas syringae, is a cysteine peptidase that once secreted into the plant cell will cleave PsbQ, an essential photosynthesis enzyme, and block programmed cell death (Rodríguez-Herva et al., 2012). In addition, the AvrPphB, ORF4 and NopT effectors also from P. syringae cleave themselves following delivery into plant cells to expose peptides containing fatty acid acylation motifs (Dowen et al., 2009). Acylation of these sites controls targeting to the plant plasma membrane and their avirulence activity. Among the oomycetes, the soybean pathogen, Phytophthora sojae, secretes a class of endoglucanase inhibitor proteins (GIPs) (Rose et al., 2002). These proteins share sequence similarity with serine peptidases, yet lack proteolytic activity due to mutation of the catalytic triad. A final example is the Avr-Pita avirulence protein from the rice blast fungus Magnaporthe oryzae, which has sequence similarity to metallopeptidases in the M35 clan. This peptidase-like protein is secreted and subsequently detected by the rice receptor protein Pi-ta (Jia et al., 2000). This interaction triggers a host defense response and leads to host resistance. Studies on the human pathogen Candida albicans have revealed that proteomic analysis leads to the identification of secreted proteins that were not identified by other methods (Gil-Bona et al., 2015). Similarly, studies in the model fungus Saccharomyces cerevisiae revealed that many of the proteins present in the secretome lacked the typical signal sequences required for annotation as secreted molecules (Giardina et al., 2014). From this evidence, it is clear that a multi-faceted approach is needed to describe the full secretome of a fungal pathogen and define the role it plays in plant-pathogen interactions.
Fusarium graminearum (aka Gibberella zeae) is a widespread pathogen of cereals such as wheat, barley, and corn, which infects the floral tissues and stems of plants and causes major economic losses to growers (Goswami and Kistler, 2004). As well as reducing grain yields, F. graminearum produces mycotoxins such as deoxynivalenol in the infected grain that pollute food and feed supplies (Sobrova et al., 2010). Mycotoxin levels in grain are strictly monitored and the presence of mycotoxins severely restricts market options for growers. The burden of this disease was made starkly apparent by an epidemic of Fusarium head blight in the northern great plains and central USA region over the 1998–2000 seasons, which caused an estimated 2.7 billion dollars of economic impact (Nganje et al., 2002).
For nutrition to be accessible, high molecular weight molecules must be degraded with a variety of extracellular hydrolases to produce low molecular weight products for import into the cell. A full understanding of the proteins secreted by F. graminearum will provide key targets for control of this fungus. Indeed, peptidase inhibitors have already been reported to be upregulated in two wheat cultivars that are resistant to Fusarium head blight (Gottwald et al., 2012). Specifically, a Bowman-Birk type peptidase inhibitor (gene ID Ta.21350.2.S1, MEROPS family I12) was reported that is predicted to inhibit serine peptidases of the MEROPS S1 family. In addition, a gene encoding a subtilisin-like serine protease inhibitor (Ta.22614.1.S1) was specifically upregulated in the resistant cultivars “Dream” and “Sumai-3” during head blight infection. Knowledge of the fungal peptidase targets for these inhibitors may improve the selection of resistant wheat cultivars.
Over 20 studies have identified proteins from Fusarium as well as proteins of Triticum species and barley produced during infection of floral tissues, as reviewed by Yang et al. (2013). Among these, the most exhaustive range of conditions for protein production was reported by Paper et al. (2007). They identified 289 secreted F. graminearum proteins using a linear ion-trap quadrupole mass-spectrometer analysis of in vitro secreted proteins as well as extracts from infected plant tissues (Paper et al., 2007). Many studies were limited by either low protein abundance in planta, low sensitivity of 2D-gel formats, or low sample replication.
We set out to use a systems biology approach to define the extracellular proteome of F. graminearum to facilitate discovery of critical targets for control of diseases such as Gibberella stalk rot of corn, or Fusarium head blight of wheat. Here, we combined public gene expression data for F. graminearum with our own high sensitivity LTQ Orbitrap MS/MS analysis to extend the known secretome of this agriculturally important pathogen. As nitrogen is one of the key nutrients the fungus must release from the host plant, three different nitrogen sources were compared to reveal an extended range of secreted peptidases tailored to each condition.
Methods
Growth and Maintenance of Fungal Cultures
F. graminearum 73B1A (kindly provided by Dr Gusui Wu, Pioneer Dupont, USA), was routinely cultured on synthetic nutrient poor agar (SNA) at 25°C with a 14 h light:dark cycle.
Culture Media for Proteomics
F. graminearum 73B1A was grown in four different culture media for proteomics studies. Half-strength Difco potato dextrose broth (1/2 PDB) was used as a complex medium, and three defined media were prepared with differing nitrogen sources. The defined media are derivatives of Czapek-dox medium (Czapek, 1902, 1903; Dox, 1910) with varied nitrogen sources. The basal composition was glucose (10 g/L), di-potassium phosphate (1 g/L), magnesium sulfate (0.5 g/L), potassium chloride (0.5 g/L), and ferrous sulfate (0.01 g/L) at pH 5.1. Nitrogen was added to ensure a molar carbon:nitrogen ratio of 20:1, nitrate medium (NO3) contained sodium nitrate (16.5 mM, 1.4 g/L), glutamine medium contained glutamine (9 mM, 1.31 g/L), minus N medium had no nitrogen. 1/2 PDB was sterilized by autoclaving, while defined media were filter sterilized and used within 2 days.
Culture Conditions for Proteomics
Samples for secreted proteomics analysis were created as follows. F. graminearum 73B1A conidia were added to 1/2 PDB (500 mL at 1.5 × 10⁴ spores/mL) and grown at 20°C and 85 rpm for 1 day. This master culture was split into 12 aliquots of 40 mL. The hyphae were collected by centrifugation (3220 g, 15 min), and were washed three times with the growth medium. Washed hyphae were resuspended in 50 mL of medium and grown for 1 day at 20°C, 85 rpm. The culture was filtered with a 0.22 μM low-bind VWSP filter disc (Millipore) to separate hyphae from culture medium. The filtrate was concentrated down to 4 mL with a 3 kDa ultrafiltration column (Amicon ultra, Millipore) prior to protein precipitation. Three biological replicates were prepared in parallel. A single cellular proteome control sample was prepared in the same way as the secreted proteome samples, except that hyphae were retained from the 1 day 1/2 PDB culture and were washed 3× with sterile water before they were snap frozen in liquid nitrogen and freeze-dried. Dried hyphae (20 mg) were added to 400 μL of urea extraction buffer (1% SDS, 8 M urea, 10%glycerol, 25 mM Tris HCl pH6.8, 1 mM EDTA, 0.7 M mercapto-ethanol) and glass beads (0.5 mm dia.) equal to 1/4 the hyphal volume before homogenization at 30 Hz for 30 s in a mixer mill (Qiagen). The sample was boiled for 2 min and then cooled on ice. The recovered supernatant formed the cellular proteome crude extract.
Precipitation of Secreted Proteins
Trichloroacetic acid (1 mL of 6.1 N) was added to 4 mL of crude secretome filtrate, mixed, and incubated at 4°C overnight. It was then centrifuged at 13,000 g for 20 min at 4°C to pellet the proteins. The supernatant was removed and the pellet was washed with 800 μL of ice-cold acetone, by vortexing, centrifugation (13,000 g, 20 min) and removal of the acetone. The acetone wash was repeated twice. Each acetone-washed pellet was agitated in 100 μL resuspension buffer (8 M urea, 10 mM dithiothreitol) at 30°C until fully dissolved, before protein levels were compared by image analysis after SDS-PAGE and SYPRO ruby staining. The cellular proteome was processed with the same method as the secretome except acetone was used in the initial precipitation instead of trichloroacetic acid.
In Solution Trypsin Digest for Proteomics
Protein was precipitated from extracts with 5 volumes of acetone, washed in acetone, and resuspended in digest buffer (8 M urea, 50 mM ammonium bicarbonate, 10 mM DTT) before incubation at 37°C for 30 min. Iodoacetamide was then added to 55 mM to alkylate thiol groups (45 min, dark, and 20°C). The alkylated preparation was diluted to 1 M urea with 25 mM ammonium biocarbonate (pH 8.5) before sequencing grade trypsin (Promega) was added to 5 μM final concentration. Digests were performed overnight (37°C) with shaking to produce tryptic peptides. Tryptic peptides were acidified with 1% formic acid (v/v).
Solid Phase Extraction Clean-up of Tryptic Peptides
Tryptic peptides in 1% (v/v) formic acid were centrifuged at 18,000 rcf for 2 min before application to a solid phase extraction column (1cc Oasis HLB, Waters) that had been conditioned with 800 μL of buffer A [80% (v/v) acetonitrile, 0.1% (w/v) trifluroacetic acid], followed by 1000 μL of buffer B (0.1%trifluroacetic acid). After application of the tryptic peptides, the column was washedin buffer B, before the peptides were eluted in 800 μL of buffer A, and concentrated to 100 μL final volume for mass spectrometry analysis.
ESI–LC–MS/MS
Peptides (2 μL) were diluted to 30 μL in 0.1% trifluroacetic acid and 2% acetonitrile (buffer A) were loaded onto a trap column (C18 PepMap 100 μm i.d. × 2 cm trapping column, Thermo-Fisher Scientific) at 5 μL/min for 6 min and washed for 6 min before switching the precolumn in line with the analytical column (Easy-Spray 75 μm i.d. × 50 cm, Thermo-Fisher Scientific). The separation of peptides was performed at 250 nL/min using a linear acetonitrile gradient of buffer A and buffer B (0.1% formic acid, 80% acetonitrile), starting from 5% buffer B to 60% over 300 min. Data were collected on an Orbitrap Elite (Thermo-Fisher Scientific) in Data Dependent Acquisition mode using m/z 300–1500 as MS scan range. CID MS/MS spectra were collected for the 20 most intense ions. Dynamic exclusion parameters were set as follows; repeat count 1, duration 90 s, the exclusion list size was set at 500 with early expiration disabled.
Other instrument parameters for the Orbitrap were as follows: MS scan at 120,000 resolution, maximum injection time 150 ms, AGC target 1 × 10⁶, CID at 35% energy for a maximum injection time of 150 ms with AGT target of 5000. The Orbitrap Elite was operated in dual analyser mode with the Orbitrap analyser being used for MS and the linear trap being used for MS/MS.
Proteomics Database Searches
All searches were made against the F. graminearum PH-1 (FG3) predicted proteome annotation from the Broad institute (“Fusarium Comparative Sequencing Project, Broad Institute of Harvard and MIT”)1. Protein sequences from the cRAP database of common lab contaminants (www.thegpm.org/crap) were added to the database. Decoy sequences were included for all searches.
Label-free quantitation (LFQ) of protein abundance was performed with MaxQuant software and the Andromeda search engine (Cox et al., 2011, 2014). Default settings were used, with “Match between runs” and “requantify” turned on. Both PSM and Protein false discovery rates were set to 0.01. Search engine variable modifications parameters were: oxidized methionine, N-terminal acetylation. The fixed modifications used were: carbamidomethylation of cysteine, precursor ion mass tolerance of 20 ppm (initial search), 10 ppm (second search) and fragment ion mass tolerance of 0.5 Da.
High sensitivity qualitative searches of the cellular control MS/MS spectra were performed using Search GUI and Peptide shaker (Vaudel et al., 2015) within the Galaxy environment (Boekel et al., 2015). Input mgf peak lists were processed by X!Tandem, MS-GF+, and OMSSA using the same parameters as described above for MaxQuant. Searches were performed and combined with SearchGUI before being passed to Peptide shaker to process the output and produce a single combined analysis. Peptide shaker was run with a false discovery rate of 1% at the protein, peptide and PSM level. MzidentML files were created and protein reports exported from Peptide Shaker with the final protein identifications. Proteomics spectra files and protein identifications were deposited at the EBI PRIDE archive (http://www.ebi.ac.uk/pride/archive/) under project accessions PXD002786 and PXD002840.
Bioinformatics
Microarray transcriptome datasets were downloaded from the PLexDB database (www.plexdb.org), experiments FG01, FG02, FG05, FG06, FG07, FG10, FG11, FG12, FG13, FG14, FG15, FG16, FG18, FG19 were used in this analysis, see Table 1 for a summary of the microarray details. RMA gene expression values were log base10 transformed and imported to the R statistical software environment. Clustering and heat map plots were performed using the heat.map.2 R module. Euclidean-distance complete-linkage trees were produced for each axis of the heat map.
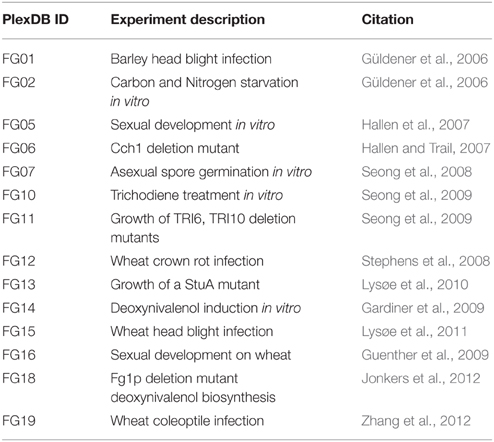
Table 1. F. graminearum microarray transcriptomics resources.
Sequence-based prediction of secretion was performed using a three stage process similar to a previously published example (Brown et al., 2012). Firstly, SignalP4.1 (Petersen et al., 2011) was used to predict signal peptide presence, secondly TmHMM2.0 (Krogh et al., 2001) was used to identify trans-membrane regions, and thirdly WolfPsort (Horton et al., 2007) was used to predict likely cellular location. To be included in our “high confidence secretion” cohort a sequence had to include a signal peptide, have no trans-membrane regions outside of the signal peptide, and score 17 or more for the “extracellular” classification on WolfPsort.
Principal components analysis (PCA) was performed using R software and the prcomp function. Briefly, MaxQuant label-free quantitation abundances (LFQ) for each replicate of the four secretome treatments were extracted from the MaxQuant proteinGroups.txt output file and used as input data. The input data matrix was Log(2) transformed and quantile normalized in R before PCA was performed on only the 134 protein high-confidence secretome. Missing values were substituted with the minimum value for that sample prior to PCA. Optional settings were left as the default settings, including: rotated variables, zero centered, no scaling.
Significance testing was performed using the limma package (Linear Models for Microarray data) within R (Ritchie et al., 2015). Briefly, MaxQuant LFQ abundance values for each protein were log2 transformed, then quantile normalized, before a limma model was fitted. All possible treatment contrasts were performed and the eBayes function was used to calculate a moderated F-statistic of overall significance for each protein. P-values were also calculated and Benjamini–Hochberg correction for multiple-testing applied.
Results and Discussion
The MEROPS peptidase catalog for the Fusarium genome was utilized to provide the potential complement of peptidase genes. Four hundred peptidase-encoding genes were recorded in the F. graminearum genome by MEROPS (Rawlings et al., 2013). The majority of peptidases had serine (43%), metallo (28%), or cysteine (17%) nucleophiles. Threonine (6%), aspartic acid (5%), and glutamic acid (<1%) nucleophiles comprised the remainder of the peptidases (Table 2).
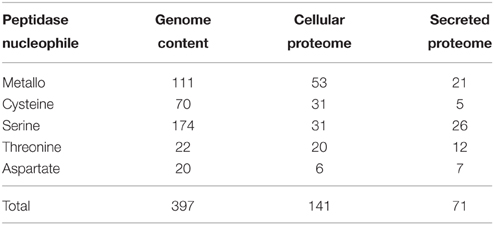
Table 2. Peptidases identified from cellular and secreted proteomics data.
An Aggregated Transcriptome Profile for Peptidases
The F. graminearum affymetrix microarray platform and associated expression data were mined for a range of conditions capturing in planta disease, in vitro growth, sporulation, or mycotoxin production. Fourteen different experiments including 183 microarrays were combined to produce a transcriptomic profile for a total of 389 peptidases present on the array. A heatmap and dendrogram were calculated to group peptidases on the basis of their transcriptional expression profile (Figure 1, Table S1).
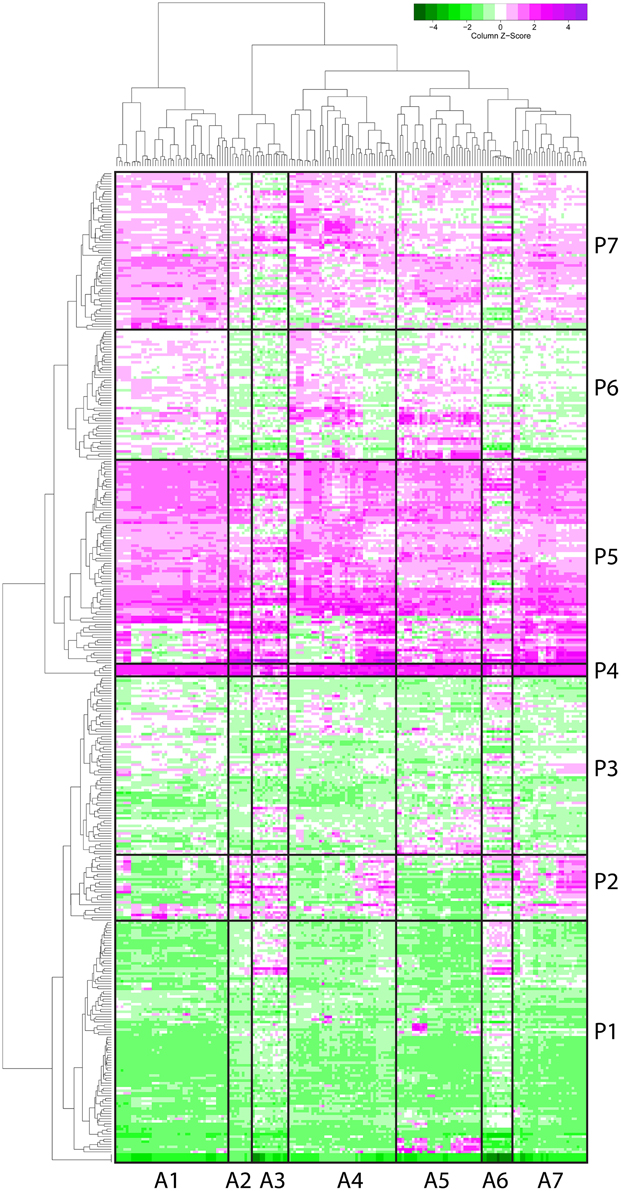
Figure 1. Microarray heat map separates 389 peptidases into seven clusters based on their gene expression. Gene expression profiles of proteases (by microarray) were clustered and a heat map built (magenta for above average expression, green for below average expression). A protease dendrogram is shown on the y axis, and a microarray dendrogram on the x axis. Clusters were generated from the dendrogram with manual refinement to produce seven clusters of arrays (A1–A7) and seven clusters of peptidases (P1–P7).
Seven clusters of microarrays and seven clusters of peptidases were formed and average expression values calculated (Figure 2). The microarray experiments clustered largely as expected: array cluster A1 contained only in vitro mycelial growth arrays, A2 contained only barley floral infection arrays from 3 to 6 dpi, A3 contained mock inoculated controls and early stage floral infections for wheat and barley, A4 captured conidia germination in vitro and wheat head blight (2–8 dpi) and all wheat coleoptile infection arrays, A5 contained entirely in vitro growth arrays including sexual development on carrot agar and CMC medium, plus carbon starvation. A6 contained all of the wheat crown rot arrays, A7 contained only wheat floral infection arrays, including those tracking sexual development and all 4 dpi time points. These groupings were biologically relevant and distinguished growth on wheat vs. growth on barley, as well as sporulation and mycelial stages of growth, and growth during infections of crown and flowers.
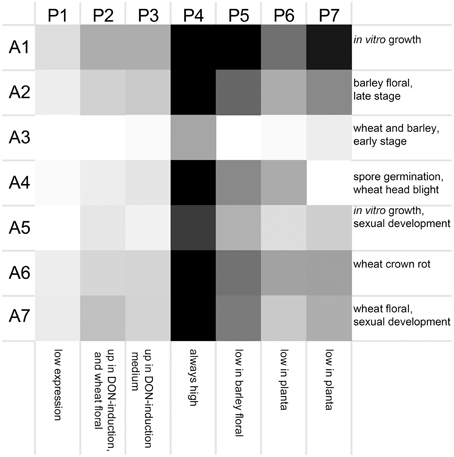
Figure 2. Averaged gene expression profiles for seven clusters of peptidases. Average values for peptidase (P1–P7) and microarray (A1–A7) clusters are plotted as a heat map (black, high expression; white, low expression). Characteristic treatments used in each array cluster are listed for each row, and characteristics of each peptidase expression profile are listed for each column.
The transcriptome profiles revealed two major groups of peptidases, high expression and low expression groups. Within those major types more refined clustering revealed peptidase genes that were regulated by environmental conditions, such as repression during in planta growth and those induced during mycotoxin biosynthesis. Peptidase cluster P1 had generally low expression, cluster P2 had higher expression during infection of flowers, and cluster P3 contained peptidases with medium-low expression. Cluster P4 and P5 had high expression. Expression in cluster P6 was generally low during growth in planta, and cluster P7 was high in both in vitro and in some in planta studies.
Peptidase nucleophile abundance varied between clusters (Table 3). Serine peptidases were overly represented in cluster P3 and to a lesser extent in clusters P1 and P2. Cysteine peptidases were enriched in cluster P6 and P7, while threonine and metallo peptidases were enriched in cluster P5. Aspartic peptidases were found in the smallest cluster, P4. Enrichment was not calculated for other rare nucleophiles due to insufficient numbers of peptidases in these categories. Serine peptidases were most commonly expressed at low to medium levels, while aspartic peptidases were generally transcribed constitutively at a high level.
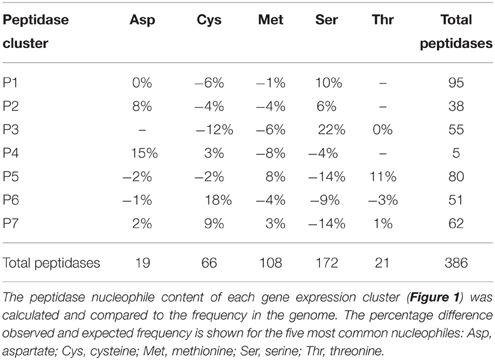
Table 3. Peptidase nucleophile type is enriched according to gene expression profile.
The microarray analysis revealed that there was regulation of peptidase expression in response to growth in planta. We sought to further refine our analysis with proteomics analysis of the secreted proteome to determine the most abundant peptidases used for nutrient acquisition.
A Shotgun Proteomics Approach to Identify Secreted Peptidases
A shotgun proteomics approach was used to identify extracellular peptidases of F. graminearum in culture. Using an ultra-high resolution linear ion-trap Orbitrap mass spectrometer an initial control sample of cellular proteins from a PDB culture produced over 2000 protein identifications via Peptide shaker software. This number reduced to 1743 robust identifications, with the requirement that each protein was matched with at least two validated peptides (Table 4, Table S2). The secretome was then queried through replicated analysis of four in vitro culture conditions: one complex plant-derived medium consisting of half-strength PDB and three defined media based on Czapek dox medium. A complete medium using peptone or tryptone was not included because we wanted to avoid pre-hydrolysis of proteins in the test medium. The defined media were identical except for substitution of the nitrogen source to one of nitrate (NO3), glutamine, or a nitrogen-free (Minus N) composition. These three sole nitrogen sources were chosen to examine an inorganic N source (NO3), an amino nitrogen source (glutamine) that provided both carbon and nitrogen, and a nitrogen-free medium to induce a nitrogen starvation response. An early-growth stage was selected to minimize cellular auto-lysis and mimic initial infection processes.
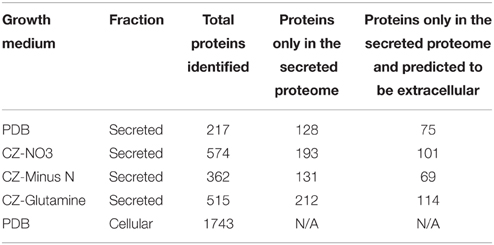
Table 4. Proteins discovered in cellular and secreted treatments.
LFQ of the secretome samples revealed large changes in protein abundance between treatments, which would have been unrecognized using more traditional qualitative assessments. MaxQuant LFQ identified 874 unique proteins across all secretome samples, with 676 present in a minimum of 2 of 3 replicates (Tables S3, S4). A further 261 of those were absent from the cellular control sample. We used a three-stage bioinformatics prediction to identify protein sequences with the correct signatures of secretion, a signal-peptide, lack of trans-membrane regions, and an extracellular location. Our bioinformatics prediction identified 668 proteins as likely to be secreted (Table S5). This number is higher than the 574 previously reported (Brown et al., 2012) due to our omission of a GPI-anchor prediction. The presence of a GPI anchor was considered insufficient evidence to exclude a protein from the secretome for two reasons. Firstly, the entirety of a GPI-anchored protein would still be external to the plasma membrane under our criteria, and secondly, GPI anchors may be cleaved to fully release proteins to the environment. When we added the bioinformatics filter to our 261 secretome proteins, just 134 remained (Figure 3A).
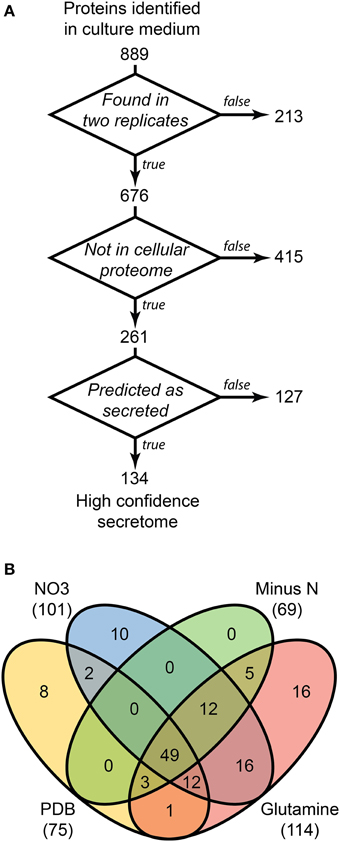
Figure 3. Distribution of 134 proteins detected in secretome samples and absent from the cellular proteome. An overview of the three-step selection process for the high-confidence secretome is shown in (A). The distribution of protein identifications in the high-confidence secretome across the four in vitro conditions is shown in (B).
A 134 Protein High-confidence Secretome
This strict filtering process should almost eliminate false positive secretome identifications. These 134 proteins formed the high-confidence secretome set. In total, 2025 unique proteins were found with high confidence in either the cellular sample or secretome samples. A previous study of a wide range of in vitro conditions and in planta apoplastic fluid identified 289 proteins (Paper et al., 2007). We have identified 153 of those 289 proteins including 43 previously considered in planta-only. By sampling the in vitro proteome to a deeper level, we have captured a significant proportion of proteins previously reported as in planta-specific.
The cellular proteome cohort had relatively fewer serine peptidases then the full genome prediction (22 vs. 44%), there were more metallo peptidases identified (38 vs. 28%) in the cellular proteome, and roughly the same percentage of cysteine peptidases in both groups (Table 2). The complement of exclusively secreted peptidases contained a high proportion of metallo peptidases. It is likely that some low abundance peptidases are missing from the proteomics datasets, which could influence the apparent cellular localization.
The PDB culture medium is complex and was likely to contain peptides of potato origin. An additional database search on a PDB culture filtrate was performed including the Solanum tuberosum predicted protein set v1.0.1 (The Potato Genome Sequencing Consortium, 2011), with the specific aim of assessing the residual potato peptide content in PDB medium. We identified three potato proteins in PDB grown samples, a starch synthase, a lipid transfer protein and a cytochrome b5 protein. We estimated that approximately 1% of the total detected peptides were of potato origin, and did not affect our analyses of F. graminearum.
Most of the secretome proteins were produced in more than one condition and 49 proteins were produced under all four conditions (Figure 3B). The defined medium with glutamine as the nitrogen source had the most proteins that were unique to one condition, whereas the Minus N condition had no exclusive proteins. Peptidases comprised 19 of the 134 protein high-confidence secretome, including five subtilizes, three aspartyl peptidases, three metallo-peptidases, and a trypsin peptidase.
Nitrogen-responsive Peptidases
To determine how protein secretion adapted in response to environmental nitrogen the high confidence secretome cohort of 134 proteins was subjected to PCA (Figure 4). Principal components 3 and 4 (PC3, PC4) captured 19.2 and 10.6%of the total variance, respectively, and resolved the four culture conditions tested. The loadings for PC3 and PC4 were examined to extract the most influential proteins for each culture condition, beginning with PDB. FGSG_08196 and FGSG_03072 were highly influential for the PDB treatment. FGSG_08196 is an example of the MEROPS scytalidoglutamic peptidase, an acid-active peptidase found throughout the ascomycete fungi. Inhibition of related glutamic acid peptidases of the thermophilic fungus Talaromyces emersonii significantly retarded hyphal growth on the complex nitrogen source peptone (O'Donoghue et al., 2008). We believe this is the first identification of FGSG_08196 in a proteomics study. A specific inhibitor of this peptidase may provide excellent control of F. graminearum and head blight disease.
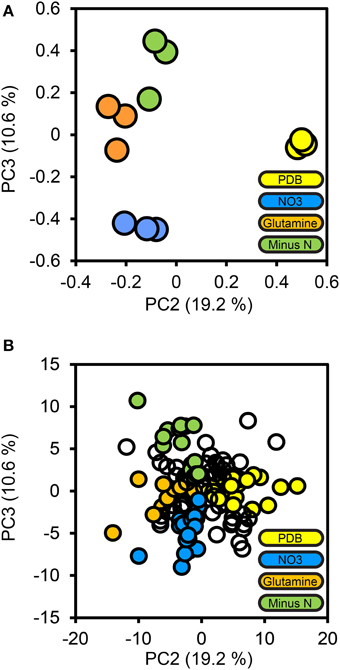
Figure 4. Principal components analysis of the high confidence secretome. Protein LFQ abundances for the 134 protein high confidence secretome subset were subjected to principal components analysis. The PCA scores plot for PC2 and PC3 are shown in (A), with one marker drawn per biological replicate. The percentage of the total variance explained by each principal component is shown in brackets on each axis. Individual protein loadings for PC2 and PC3 are shown in (B), with one marker per protein, proteins we considered to be most influential for each treatment medium are colored according to that medium, the remainder are drawn as empty markers.
FGSG_03072 a sedolisin, a part of the MEROPS S53 family of unassigned peptidases, a group containing both acid active endopeptidases and tripeptidyl-peptidases. FGSG_03072 aligned most closely (49% identity) with SedD, an acidic exopeptidase, and one of four characterized Aspergillus fumigatus sedolisins (Reichard et al., 2006). Blast searches for additional F. graminearum homologs of all the A. fumigatus Sed proteins revealed a SedA endopeptidase homolog (FGSG_10343) that was not detectable in the proteome, but a second SedB/C/D exopeptidase (FGSG_12142) was found in the high confidence secretome at high abundance in all four treatments. Interestingly, FGSG_12142 was not reported in previous proteomics studies on F. graminearum grown in vitro, in planta, during mycotoxin induction (Paper et al., 2007; Taylor et al., 2008; Rampitsch et al., 2010, 2012).
The minus-N culture medium contained four serine and one metallo peptidase in its influential set of proteins. FGSG_11164 (a Trypsin homolog), FGSG_10982 (dipeptidyl-peptidase), FGSG_03315 and FGSG_00806 (subtilisin-like peptidases), and FGSG_01818 (Ap1-like metallo-peptidase). All five of these peptidases were reported by Paper et al. (2007) from in vitro samples and only FGSG_10982 was not reported in planta.
The glutamine culture medium contained two influential peptidases. FGSG_03954, a metallo-endopeptidase, and FGSG_06572 a subtilisin-like serine peptidase. No peptidases were identified as being specific to the NO3 treatment; this is consistent with nitrogen catabolite repression during growth on a favorable inorganic nitrogen source. We expected equal repression of peptidases for all treatments containing favored nitrogen sources (NO3 and glutamine) this was the case for these two peptidases, as they were absent from the PDB treatment, where nitrogen catabolism should be de-repressed.
Cross-referenced Transcriptome and Proteomics Datasets
The peptidase transcriptome data and the proteome were cross-referenced. Cluster P2 of the transcriptome heat map was enriched with peptidases containing extracellular secretion signals. Twenty-nine per cent of P2 peptidases were predicted to be secreted, which was 14% more than the average for the genome. We did not observe enrichment of P2 peptidases in the actual secretome, which was probably due to their expression level falling below the limit of detection for our proteomics analysis. Peptidases in cluster P1 had the lowest average gene expression and this was again reflected in a very low number of identifications with only 7 of 97 P1 peptidases identified in the secretome or cellular proteome. This could be due to presence of pseudogenes that are not translated or more likely to low abundance proteins that fell below the limit of detection of MS/MS identification. The highly expressed clusters P4 and P5 were both enriched for peptidases that were identified in either the secretome or cellular proteome.
We hypothesized that peptidases upregulated during in planta growth would be enriched for signal-peptides and extracellular sequence signatures. Peptidases expressed during in planta growth were mostly found in clusters P2, P4, P5, while P6 contained peptidases that were mostly down regulated during growth in planta. We examined the peptidase gene expression heat map for clusters of peptidases that were likely to be secreted and also had similar gene expression profiles (Figure 5). Cluster P2 was almost uniformly predicted as secreted, while only a small subset of P5 was predicted to be secreted in planta. P2 peptidases were up-regulated during infection of barley and wheat flowers, crown rot of wheat, and sexual sporulation in wheat.
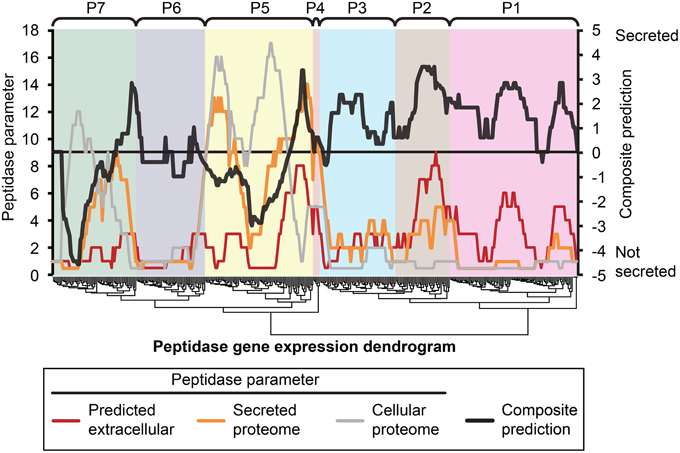
Figure 5. Composite analysis of peptidase secretion and in planta expression. Peptidase secretion parameters were calculated for each peptidase shown in Figure 1. Peptidases are ordered by their gene expression profile, as in Figure 1. The peptidase frequency for three peptidase parameters, (1) bioinformatic prediction of secretion “Predicted extracellular,” (2) presence in the “Secreted proteome,” and (3) presence in the “Cellular proteome” was plotted on the leftmost Y-axis axis as a moving window (window size = 16), for example, if the value is 10, that means 10 out of 16 peptidases in the window were predicted to be secreted based on sequence characters. The right-most Y-axis shows the resultant “Composite prediction” of secretion (black trace), Composite prediction was calculated as Log2[mean[(1),(2)]/(3)], where a positive result indicates more likely secretion, a negative result less likely secretion. The gene expression clusters of peptidases determined in Figure 1 are shown above the plot.
Virulence Factors for Head Blight of Wheat and Barley
The five peptidases influential for minus-N treatment were all classified within cluster P5 on the basis of their microarray profiles, which indicated generally high gene expression. The FGSG_08196 and FGSG_03072 peptidases identified in the PDB treatment were present in cluster P1, indicating low expression on average. Closer inspection of the arrays for each gene revealed a few conditions with elevated expression. FGSG_03072 was only highly expressed during growth on mycotoxin-inducing medium with agmatine or putrescine as a nitrogen source (FG7, FG14), and during sexual development in planta (FG16). FGSG_08196 was similar with selective high expression during nitrogen starvation, and during in vitro growth in mycotoxin-inducing media, although there was an additional peak in expression during barley floral infection at 72 h that was not repeated during infection of wheat flowers. Both peptidase types are active at acidic pH therefore we hypothesize their gene expression peaks in acidic environments. Mycotoxin-induction is known to occur during floral infections in planta and only at acidic pH in vitro (Merhej et al., 2011). The wheat floral tissue may develop a more acidic pH faster than barley, explaining why expression of these two acidic peptidases is higher during wheat infections. The pH of PDB culture medium is 5.1; this mildly acidic environment induced additional acidic peptidases compared to the NO3, minus N, and glutamine conditions. The three defined media were based on Czapek dox and have a neutral pH of 7.3. This may be sufficient to explain the increase in abundance of acid peptidases in the PDB treatment, and affirms the selection of PDB as an in vitro condition to approximate in planta growth.
Comparison of Head Blight of Wheat and Barley
F. graminearum is a floral pathogen of both wheat and barley. Although this study did not collect in planta secretome data, we considered relationships between the in vitro secretome and the in planta transcriptomics datasets. Transcriptome data for both wheat and barley was examined for differential expression of proteases. Expression group A7 contained exclusively wheat infection samples, indicating there may be co-regulation of peptidases specifically in planta.
We compared peptidase gene expression in barley and wheat microarrays to determine if peptidase expression was regulated by the species of host plant (Figure 6). A range of expression levels was identified, but in the vast majority of cases average peptidase expression was consistent between the two host plants with a correlation coefficient (R2) of 0.8672 (Figure 6A). Such high correlation is impressive considering the independent nature of the experiments. To confirm that peptidase gene expression can be modulated to suit the environment, we compared wheat infection to in vitro growth on complete medium (Figure 6B). We observed large changes in peptidase expression when comparing in vitro with in planta growth, with a correspondingly weak correlation coefficient of 0.2218. This confirmed that peptidase transcription is responsive to the growth environment. Peptidases identified in either the cellular proteome, secreted proteome or both cellular and secreted proteomics samples were mapped onto the correlation charts. No overall patterns of secretion were revealed in relation of gene expression level on barley or wheat, however, secretome peptidases tended to be transcribed more during growth on complete medium than on wheat. The secreted peptidases FGSG_08196, and FGSG_10086 were revealed as slightly up-regulated during barley infection compared to wheat infection. FGSG_8196 was identified in the 134 protein high confidence secretome, and was exclusively detected in the PDB medium secretome. FGSG_10086 is a serine peptidase in the MEROP S33 family in gene expression group P3, most highly expressed in mycotoxin induction medium.
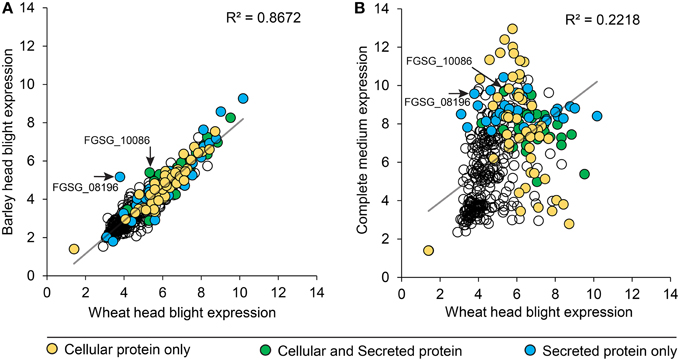
Figure 6. Peptidase gene expression in wheat, barley and complete medium. F. graminearum peptidase gene expression (RMA values) from microarrays of barley and wheat head blight disease (A) were plotted to reveal the degree of transcriptional gene co-regulation on the two different host plants. Two peptidases that were differentially reguated between the two in planta conditions are indicated with an arrow and label. For comparison, gene expression (RMA values) from in vitro growth on complete medium were compared to wheat head blight (B). The secretion status determined from proteomics analyses is displayed in the shading of each peptidase value: yellow for cellular proteins, green for proteins found in both the cellular and secreted proteomes, and blue for proteins only found in the secreted proteome.
Non-canonical Secretion
Non-canonical secretion mechanisms may account for unexpected extracellular location of proteins. This study focussed on secreted peptidases, some of which may have been incorrectly regarded as cellular proteins due to non-canonical secretion. We identified 127 proteins that are candidates for non-canonical secretion as they were only found in the secreted proteome but lacked the expected bioinformatic prediction of secretion (Figure 3A). This figure is likely an overestimate as our bioinformatics methodology was biased toward false-negative error when assigning classical secretion, but 47 of those 127 proteins have a SignalP score of less than 0.15 (the threshold for secretion is 0.45), comprising a more representative list for non-canonical secretion. Superoxide dismutase is a good candidate for non-canonical secretion as it has been reported to be released into culture medium by gentle washing of Claviceps purpurea hyphae, yet lacks a classical signal peptide (Moore et al., 2002). Non-canonical secretion of proteins via extracellular microvesicles, or exosomes, is gaining attention for its potential role in cell-to-cell communication and pathogenesis (Samuel et al., 2015). We identified three homologs of superoxide dismutase in the culture medium proteome, FGSG_02051, FGSG_04454, FGSG_08721. All three were absent from PDB medium and were present in the other three treatments. None contained recognizable signal peptide sequences and two were also found in the cellular proteome, FGSG_08721 has been previously reported as secreted both in vitro and in planta (Paper et al., 2007). Nine of the 127 candidates for non-canonical secretion were peptidases, including four metallo-peptidases of the M28 family. Of these, FGSG_01095 and FGSG_11411 had extremely low signalP scores of 0.131 and 0.103, respectively. Interestingly, the FGSG_01095 sequence scored higher using the prokaryotic SignalP algorithms, raising the question of whether proteins originating from mitochondria have retained aspects of prokaryotic protein transport.
Mycotoxin Biosynthesis and Protein Secretion
Brown et al. (2012) suggested that there may be a link between symptomless growth in planta and the co-secretion of trichotheces (including deoxynivalenol, or DON) and virulence proteins. Both their study and this one identified the deoxynivalenol biosynthetic enzyme TRI8 (trichothecene 3-O esterase, FGSG_03532) as a predicted secreted protein on the basis of its sequence characters. However, we did not identify it in our proteomics survey. This was unsurprising, as deoxynivalenol biosynthesis by F. graminearum requires a low pH, a permissive nitrogen source such as a polyamine or N-starvation. The transcriptional regulator AREA governs genes required for nitrogen metabolism and is also required for full DON biosynthesis in F. graminearum (Hou et al., 2015). The key biosynthetic and regulatory genes, TRI5 and TRI6, respectively, are induced under nitrogen starvation conditions, and supressed by a preferred nitrogen source, such as ammonia. The culture period of our study was very short and would not have resulted in significant DON induction under permissive conditions. Taylor et al. (2008) specifically targeted mycotoxin-induction for their ITRAC proteomics analysis of cellular proteins, and identified three TRI proteins, FGSG_03534, FGSG_03535, and FGSG_03543. We did not find any of the TRI proteins in our cellular controls, nor our secreted protein samples, which may have been due to our early-stage sampling of cultures. We expect that there may have been low levels of TRI proteins in our MinusN sample but they were insufficient for MS/MS detection from culture medium. Deoxynivalenol permissive conditions would also result in vigorous expression of secreted peptidases, which we observed in the MinusN proteomics samples. It may be possible to use the presence of certain secreted peptidases as a highly sensitive enzymatic reporter of deoxynivaleol risk in cereal grains.
Conclusion
This is the first proteomics study to focus on the peptidases of F. graminearum. Degrading enzymes are considered diverse and redundant, and therefore unlikely targets for control of plant pathogens. However, our characterization of the secreted peptidases of F. graminearum revealed deployment of a greatly reduced peptidase subset of limited diversity. We identified a Fusarium homolog of a peptidase required for hyphal growth of a thermophilic fungus, this homolog presents a target for further study to determine its contribution to overall fitness of F. graminearum, and a possible control target.
We have brought together public transcriptomics resources and an in vitro secreted proteomics dataset to extend our knowledge of peptidase production of F. graminearum both in planta and in vitro. A focussed peptidase gene expression analysis revealed seven clusters of peptidases with similar expression profiles during in vitro and in planta conditions. Over 2000 proteins were identified with 890 of those released into culture medium. A high-confidence secretome cohort of 134 proteins was derived that satisfied a three-stage selection process: firstly, presence in the culture medium, secondly, absence from the cellular proteome, and thirdly, satisfaction of three bioinformatics analyses for secretion characters. High sensitivity mass-spectrometry analysis of in vitro extracts allowed extension of the known proteome of F. graminearum. The majority of the high confidence secretome had not been reported in previous proteomics studies and includes proteins previously thought to be restricted to in planta growth. We anticipate this dataset will also allow future refinement of the F. graminearum genome annotation, confirming post-transcriptional processing, and N-termini of mature proteins.
Author Contributions
RL, MB, MA drafted the manuscript. OM, CC, PF, RL performed experiments. MB, RL, MA, SM conceived the experiments. All authors edited and reviewed the manuscript.
Funding
This work was supported by the Australian Research Council with Discovery Projects to MA (DP150104386), and SM (DP130100535), plus a Discovery Early Career Researcher Award (DE150101777) to SM, and a La Trobe University Understanding Disease Research Focus Area Grant to MB.
Conflict of Interest Statement
The authors declare that the research was conducted in the absence of any commercial or financial relationships that could be construed as a potential conflict of interest.
Acknowledgments
We thank Ira Cooke for discussions and assistance with the proteomics label-free quantitation methodology.
Supplementary Material
The Supplementary Material for this article can be found online at: http://journal.frontiersin.org/article/10.3389/fpls.2015.00962
Table S1. Peptidase microarray data.
Table S2. Cellular proteome identifications.
Table S3. Label-free quantitation.
Table S4. Limma statistical analysis.
Table S5. Signal peptide predictions.
Footnotes
1. ^Fusarium Comparative Sequencing Project, Broad Institute of Harvard and MIT [WWW Document], n.d. URL http://www.broadinstitute.org/.
References
Boekel, J., Chilton, J. M., Cooke, I. R., Horvatovich, P. L., Jagtap, P. D., Käll, L., et al. (2015). Multi-omic data analysis using Galaxy. Nat. Biotechnol. 33, 137–139. doi: 10.1038/nbt.3134
Brown, N. A., Antoniw, J., and Hammond-Kosack, K. E. (2012). The predicted secretome of the plant pathogenic fungus Fusarium graminearum: a refined comparative analysis. PLoS ONE 7:e33731. doi: 10.1371/journal.pone.0033731
Brunner, P. C., Torriani, S. F. F., Croll, D., Stukenbrock, E. H., and McDonald, B. A. (2013). Coevolution and life cycle specialization of plant cell wall degrading enzymes in a hemibiotrophic pathogen. Mol. Biol. Evol. 30, 1337–1347. doi: 10.1093/molbev/mst041
Ciuffetti, L. M., Manning, V. A., Pandelova, I., Betts, M. F., and Martinez, J. P. (2010). Host-selective toxins, Ptr ToxA and Ptr ToxB, as necrotrophic effectors in the Pyrenophora tritici-repentis–wheat interaction. New Phytol. 187, 911–919. doi: 10.1111/j.1469-8137.2010.03362.x
Cox, J., Hein, M. Y., Luber, C. A., Paron, I., Nagaraj, N., and Mann, M. (2014). Accurate proteome-wide label-free quantification by delayed normalization and maximal peptide ratio extraction, termed MaxLFQ. Mol. Cell. Proteomics 13, 2513–2526. doi: 10.1074/mcp.M113.031591
Cox, J., Neuhauser, N., Michalski, A., Scheltema, R. A., Olsen, J. V., and Mann, M. (2011). Andromeda: a peptide search engine integrated into the MaxQuant environment. J. Proteome Res. 10, 1794–1805. doi: 10.1021/pr101065j
Czapek, F. (1902). Untersuchungen über die stickstoffgewinnung und eiweissbildung der pflanzen. Beitr. Chem. Physiol. Pathol. 1, 538–560.
Czapek, F. (1903). Untersuchungen über die stickstoffgewinnung und eiweifsbildung der schimmelpilze. Beitr. Chem. Physiol. Pathol. 3, 47–66.
Dodds, P. N., and Rathjen, J. P. (2010). Plant immunity: towards an integrated view of plant-pathogen interactions. Nat. Rev. Genet. 11, 539–548. doi: 10.1038/nrg2812
Dowen, R. H., Engel, J. L., Shao, F., Ecker, J. R., and Dixon, J. E. (2009). A family of bacterial cysteine protease type III effectors utilizes acylation-dependent and -independent strategies to localize to plasma membranes. J. Biol. Chem. 284, 15867–15879. doi: 10.1074/jbc.M900519200
Dox, A. W. (1910). The Intracellular Enzymes of Penicillium and Aspergillus: With Special Reference to those of Penicillium camemberti. Washington, DC: U S Department of Agriculture, Bureau of Animal Industry. Retrieved from: http://hdl.handle.net/2027/uiug.30112104109134
Gardiner, D. M., Kazan, K., and Manners, J. M. (2009). Novel genes of Fusarium graminearum that negatively regulate deoxynivalenol production and virulence. Mol. Plant. Microbe. Interact. 22, 1588–1600. doi: 10.1094/MPMI-22-12-1588
Giardina, B. J., Stanley, B. A., and Chiang, H.-L. (2014). Glucose induces rapid changes in the secretome of Saccharomyces cerevisiae. Proteome Sci. 12:9. doi: 10.1186/1477-5956-12-9
Gil-Bona, A., Parra-Giraldo, C. M., Hernáez, M. L., Reales-Calderon, J. A., Solis, N. V., Filler, S. G., et al. (2015). Candida albicans cell shaving uncovers new proteins involved in cell wall integrity, yeast to hypha transition, stress response and host-pathogen interaction. J. Proteomics. 127, 340–351. doi: 10.1016/j.jprot.2015.06.006
Goswami, R. S., and Kistler, H. C. (2004). Heading for disaster: Fusarium graminearum on cereal crops. Mol. Plant Pathol. 5, 515–525. doi: 10.1111/j.1364-3703.2004.00252.x
Gottwald, S., Samans, B., Lück, S., and Friedt, W. (2012). Jasmonate and ethylene dependent defence gene expression and suppression of fungal virulence factors: two essential mechanisms of Fusarium head blight resistance in wheat? BMC Genomics 13:369. doi: 10.1186/1471-2164-13-369
Guenther, J. C., Hallen-Adams, H. E., Bücking, H., Shachar-Hill, Y., and Trail, F. (2009). Triacylglyceride metabolism by Fusarium graminearum during colonization and sexual development on wheat. Mol. Plant Microbe Interact. 22, 1492–1503. doi: 10.1094/MPMI-22-12-1492
Güldener, U., Seong, K.-Y., Boddu, J., Cho, S., Trail, F., Xu, J.-R., et al. (2006). Development of a Fusarium graminearum affymetrix genechip for profiling fungal gene expression in vitro and in planta. Fungal Genet. Biol. 43, 316–325. doi: 10.1016/j.fgb.2006.01.005
Hallen, H. E., Huebner, M., Shiu, S.-H., Güldener, U., and Trail, F. (2007). Gene expression shifts during perithecium development in Gibberella zeae (anamorph Fusarium graminearum), with particular emphasis on ion transport proteins. Fungal Genet. Biol. 44, 1146–1156. doi: 10.1016/j.fgb.2007.04.007
Hallen, H. E., and Trail, F. (2007). The L-type calcium ion channel Cch1 affects ascospore discharge and mycelial growth in the filamentous fungus Gibberella zeae (Anamorph Fusarium graminearum). Eukaryot. Cell 7, 415–424. doi: 10.1128/EC.00248-07
Horton, P., Park, K.-J., Obayashi, T., Fujita, N., Harada, H., Adams-Collier, C. J., et al. (2007). WoLF PSORT: protein localization predictor. Nucleic Acids Res. 35, W585–W587. doi: 10.1093/nar/gkm259
Hou, R., Jiang, C., Zheng, Q., Wang, C., and Xu, J.-R. (2015). The AreA transcription factor mediates the regulation of deoxynivalenol (DON) synthesis by ammonium and cyclic adenosine monophosphate (cAMP) signalling in Fusarium graminearum. Mol. Plant Pathol. 16, 987–999. doi: 10.1111/mpp.12254
Jia, Y., McAdams, S. A., Bryan, G. T., Hershey, H. P., and Valent, B. (2000). Direct interaction of resistance gene and avirulence gene products confers rice blast resistance. EMBO J. 19, 4004–4014. doi: 10.1093/emboj/19.15.4004
Jones, J. D. G., and Dangl, J. L. (2006). The plant immune system. Nature 444, 323–329. doi: 10.1038/nature05286
Jonkers, W., Dong, Y., Broz, K., and Kistler, H. C. (2012). The Wor1-like protein Fgp1 regulates pathogenicity, toxin synthesis and reproduction in the phytopathogenic fungus Fusarium graminearum. PLoS Pathog. 8:e1002724. doi: 10.1371/journal.ppat.1002724
Krogh, A., Larsson, B., von Heijne, G., and Sonnhammer, E. L. (2001). Predicting transmembrane protein topology with a hidden Markov model: application to complete genomes. J. Mol. Biol. 305, 567–580. doi: 10.1006/jmbi.2000.4315
Lowe, R. G. T., and Howlett, B. J. (2012). Indifferent, affectionate, or deceitful: lifestyles and secretomes of fungi. PLoS Pathog. 8:e1002515. doi: 10.1371/journal.ppat.1002515
Lysøe, E., Pasquali, M., Breakspear, A., and Kistler, H. C. (2010). The transcription factor FgStuAp influences spore development, pathogenicity, and secondary metabolism in Fusarium graminearum. Mol. Plant Microbe Interact. 24, 54–67. doi: 10.1094/MPMI-03-10-0075
Lysøe, E., Seong, K.-Y., and Kistler, H. C. (2011). The transcriptome of Fusarium graminearum during the infection of wheat. Mol. Plant Microbe Interact. 24, 995–1000. doi: 10.1094/MPMI-02-11-0038
Merhej, J., Richard-Forget, F., and Barreau, C. (2011). The pH regulatory factor Pac1 regulates Tri gene expression and trichothecene production in Fusarium graminearum. Fungal Genet. Biol. 48, 275–284. doi: 10.1016/j.fgb.2010.11.008
Moore, S., De Vries, O. M. H., and Tudzynski, P. (2002). The major Cu,Zn SOD of the phytopathogen Claviceps purpurea is not essential for pathogenicity. Mol. Plant Pathol. 3, 9–22. doi: 10.1046/j.1464-6722.2001.00088.x
Nganje, W. E., Bangsund, D. A., Leistritz, F. L., Wilson, W. W., and Tiapo, N. M. (2002). “Estimating the economic impact of a crop disease: the case of fusarium head blight in the wheat and barley,” in 2002 National Fusarium Head Blight Forum Proceedings, Vol. 275 (Okemos, MI), 275–281.
O'Donoghue, A. J., Mahon, C. S., Goetz, D. H., O'Malley, J. M., Gallagher, D. M., Zhou, M., et al. (2008). Inhibition of a secreted glutamic peptidase prevents growth of the fungus Talaromyces emersonii. J. Biol. Chem. 283, 29186–29195. doi: 10.1074/jbc.M802366200
Paper, J. M., Scott-Craig, J. S., Adhikari, N. D., Cuomo, C. A., and Walton, J. D. (2007). Comparative proteomics of extracellular proteins in vitro and in planta from the pathogenic fungus Fusarium graminearum. Proteomics 7, 3171–3183. doi: 10.1002/pmic.200700184
Petersen, T. N., Brunak, S., von Heijne, G., and Nielsen, H. (2011). SignalP 4.0: discriminating signal peptides from transmembrane regions. Nat. Methods 8, 785–786. doi: 10.1038/nmeth.1701
Rampitsch, C., Subramaniam, R., Djuric-Ciganovic, S., and Bykova, N. V. (2010). The phosphoproteome of Fusarium graminearum at the onset of nitrogen starvation. Proteomics 10, 124–140. doi: 10.1002/pmic.200800399
Rampitsch, C., Tinker, N. A., Subramaniam, R., Barkow-Oesterreicher, S., and Laczko, E. (2012). Phosphoproteome profile of Fusarium graminearum grown in vitro under nonlimiting conditions. Proteomics 12, 1002–1005. doi: 10.1002/pmic.201100065
Rawlings, N. D., Waller, M., Barrett, A. J., and Bateman, A. (2013). MEROPS: the database of proteolytic enzymes, their substrates and inhibitors. Nucleic Acids Res. 42, D503–D509. doi: 10.1093/nar/gkt953
Reichard, U., Léchenne, B., Asif, A. R., Streit, F., Grouzmann, E., Jousson, O., et al. (2006). Sedolisins, a new class of secreted proteases from Aspergillus fumigatus with endoprotease or tripeptidyl-peptidase activity at acidic pHs. Appl. Environ. Microbiol. 72, 1739–1748. doi: 10.1128/AEM.72.3.1739-1748.2006
Ritchie, M. E., Phipson, B., Wu, D., Hu, Y., Law, C. W., Shi, W., et al. (2015). Limma powers differential expression analyses for RNA-sequencing and microarray studies. Nucl. Acids Res. 43, e47. doi: 10.1093/nar/gkv007
Rodríguez-Herva, J. J., González-Melendi, P., Cuartas-Lanza, R., Antúnez-Lamas, M., Río-Alvarez, I., Li, Z., et al. (2012). A bacterial cysteine protease effector protein interferes with photosynthesis to suppress plant innate immune responses. Cell. Microbiol. 14, 669–681. doi: 10.1111/j.1462-5822.2012.01749.x
Rose, J. K. C., Ham, K.-S., Darvill, A. G., and Albersheim, P. (2002). Molecular cloning and characterization of glucanase inhibitor proteins: coevolution of a counterdefense mechanism by plant pathogens. Plant Cell 14, 1329–1345. doi: 10.1105/tpc.002253
Samuel, M., Bleackley, M., Anderson, M., and Mathivanan, S. (2015). Extracellular vesicles including exosomes in cross kingdom regulation: a viewpoint from plant-fungal interactions. Front. Plant Sci. 6:766. doi: 10.3389/fpls.2015.00766
Seong, K.-Y., Pasquali, M., Zhou, X., Song, J., Hilburn, K., McCormick, S., et al. (2009). Global gene regulation by Fusarium transcription factors Tri6 and Tri10 reveals adaptations for toxin biosynthesis. Mol. Microbiol. 72, 354–367. doi: 10.1111/j.1365-2958.2009.06649.x
Seong, K.-Y., Zhao, X., Xu, J.-R., Güldener, U., and Kistler, H. C. (2008). Conidial germination in the filamentous fungus Fusarium graminearum. Fungal Genet. Biol. 45, 389–399. doi: 10.1016/j.fgb.2007.09.002
Seong, S.-T., and Matzinger, P. (2004). Hydrophobicity: an ancient damage-associated molecular pattern that initiates innate immune responses. Nat. Rev. Immun. 4, 469–478. doi: 10.1038/nri1372
Sobrova, P., Adam, V., Vasatkova, A., Beklova, M., Zeman, L., and Kizek, R. (2010). Deoxynivalenol and its toxicity. Interdiscip. Toxicol. 3, 94–99. doi: 10.2478/v10102-010-0019-x
Stephens, A. E., Gardiner, D. M., White, R. G., Munn, A. L., and Manners, J. M. (2008). Phases of infection and gene expression of Fusarium graminearum during crown rot disease of wheat. Mol. Plant Microbe Interact. 21, 1571–1581. doi: 10.1094/MPMI-21-12-1571
Stergiopoulos, I., and de Wit, P. J. G. M. (2009). Fungal effector proteins. Annu. Rev. Phytopathol. 47, 233–263. doi: 10.1146/annurev.phyto.112408.132637
Taylor, R. D., Saparno, A., Blackwell, B., Anoop, V., Gleddie, S., Tinker, N., et al. (2008). Proteomic analyses of Fusarium graminearum grown under mycotoxin-inducing conditions. Proteomics 8, 2256–2265. doi: 10.1002/pmic.200700610
The Potato Genome Sequencing Consortium (2011). Genome sequence and analysis of the tuber crop potato. Nature 475, 189–195. doi: 10.1038/nature10158
Vaudel, M., Burkhart, J. M., Zahedi, R. P., Oveland, E., Berven, F. S., Sickmann, A., et al. (2015). PeptideShaker enables reanalysis of MS-derived proteomics data sets. Nat. Biotechnol. 33, 22–24. doi: 10.1038/nbt.3109
Yang, F., Jacobsen, S., Jørgensen, H. J. L., Collinge, D. B., Svensson, B., and Finnie, C. (2013). Fusarium graminearum and its interactions with cereal heads: studies in the proteomics era. Front. Plant Sci. 4:37. doi: 10.3389/fpls.2013.00037
Keywords: Fusarium graminearum, peptidase, protease, orbi-trap, proteomics, secretome, fungi, plant-pathogen
Citation: Lowe RGT, McCorkelle O, Bleackley M, Collins C, Faou P, Mathivanan S and Anderson M (2015) Extracellular peptidases of the cereal pathogen Fusarium graminearum. Front. Plant Sci. 6:962. doi: 10.3389/fpls.2015.00962
Received: 17 August 2015; Accepted: 22 October 2015;
Published: 06 November 2015.
Edited by:
Delphine Vincent, Department of Environment and Primary Industries, AustraliaReviewed by:
Roger W. Innes, Indiana University Bloomington, USAZonghua Wang, Fujian Agriculture and Forestry University, China
Copyright © 2015 Lowe, McCorkelle, Bleackley, Collins, Faou, Mathivanan and Anderson. This is an open-access article distributed under the terms of the Creative Commons Attribution License (CC BY). The use, distribution or reproduction in other forums is permitted, provided the original author(s) or licensor are credited and that the original publication in this journal is cited, in accordance with accepted academic practice. No use, distribution or reproduction is permitted which does not comply with these terms.
*Correspondence: Rohan G. T. Lowe, ci5sb3dlQGxhdHJvYmUuZWR1LmF1