- 1State Key Laboratory of Tree Genetics and Breeding, Northeast Forestry University, Harbin, China
- 2Department of Crop Molecular Breeding, Crop Breeding Institute, Heilongjiang Academy of Agricultural Sciences, Harbin, China
- 3Medical Plant Research Center, Economic Crop Institute, Heilongjiang Academy of Agricultural Sciences, Harbin, China
- 4Biotechnology Research Center, Institute of Natural Resources and Ecology, Heilongjiang Academy of Sciences, Harbin, China
Pollen tubes are an ideal model for the study of cell growth and morphogenesis because of their extreme elongation without cell division; however, the genetic basis of pollen germination and tube growth remains largely unknown. Using the Illumina/Solexa digital gene expression system, we identified 13,017 genes (representing 28.3% of the unigenes on the reference genes) at three stages, including mature pollen, hydrated pollen, and pollen tubes of Populus simonii × P. nigra. Comprehensive analysis of P. simonii × P. nigra pollen revealed dynamic changes in the transcriptome during pollen germination and pollen tube growth (PTG). Gene ontology analysis of differentially expressed genes showed that genes involved in functional categories such as catalytic activity, binding, transporter activity, and enzyme regulator activity were overrepresented during pollen germination and PTG. Some highly dynamic genes involved in pollen germination and PTG were detected by clustering analysis. Genes related to some key pathways such as the mitogen-activated protein kinase signaling pathway, regulation of the actin cytoskeleton, calcium signaling, and ubiquitin-mediated proteolysis were significantly changed during pollen germination and PTG. These data provide comprehensive molecular information toward further understanding molecular mechanisms underlying pollen germination and PTG.
Introduction
The primary function of pollen is to produce two sperm cells and transport them into the embryo sac to initiate double fertilization (Mascarenhas, 1993). In addition to their intrinsic function in sexual reproduction, the pollen tubes (PTs) have served as an ideal model for the study of cell growth and morphogenesis (Feijó et al., 2001, 2004).
Until 2002, gene-by-gene characterization had identified ~150 pollen-expressed genes from different species (reviewed in Troppmair et al., 2002), including only 23 pollen-expressed genes in Arabidopsis thaliana. New high-throughput technologies have enabled the analysis of male gametophyte gene expression on a global scale. SAGE (Serial analysis of gene expression) technology (Lee and Lee, 2003) and 8K Affymetrix AG microarrays (Becker et al., 2003; Honys and Twell, 2003) have allowed analysis of the pollen based on ~30% of the Arabidopsis genome. The application of 23K GeneChip ATH1 arrays (representing ~80% of the Arabidopsis genome) has enabled transcriptome analysis of pollen on a much larger scale (Pina et al., 2005). Genes in the functional categories of signaling, vesicle trafficking, cytoskeleton, and membrane transport are proportionally overrepresented in pollen (Pina et al., 2005). “Affymetrix GeneChip Rice Genome array data showed that the number of stage-enriched transcripts displays a “U-type” change during pollen development, with the lowest number at the bicellular pollen stage (Wei et al., 2010). This feature is conserved in rice (Oryza sativa) and Arabidopsis (Wei et al., 2010).” These studies revealed that mature pollen (MP) has a smaller and more unique transcriptome with a higher proportion of selectively expressed genes than vegetative tissues. Combining the three available Arabidopsis data resources (Honys and Twell, 2004; Zimmermann et al., 2004; Pina et al., 2005), it is estimated that the total number of genes expressed in MP is between 5000 and 7000. If the analysis is extended to cover the developmental series of pollen, the expression of ~14,000 genes is detected (Honys and Twell, 2004; Twell et al., 2006). Using Affymetrix ATH1 arrays, Borges et al. (2008) revealed that the expression of 11% of sperm cell–expressed genes is enriched in sperm cells. These sperm cell–enriched transcripts are preferentially involved in DNA repair, ubiquitin-mediated proteolysis, and cell cycle progression. The high levels of expression of ubiquitin pathway–related genes in generative cells suggests that ubiquitin proteolysis plays a critical role in the male gametogenesis of higher plants (Singh and Bhalla, 2007). Although greater emphasis has been put on model systems such as Arabidopsis, there is still a place for non-model systems in these studies.
In contrast to the abundance of molecular information available about pollen development and maturation, little is known about the genome-wide events underlying pollen germination (PG) and pollen tube growth (PTG), which is essential for understanding the molecular mechanisms of polar tube growth and invasion into pistils (Wei et al., 2010). Many low-abundance transcripts cannot be analyzed by microarrays (McCormick, 2004). Guyon et al. (2000) identified ~20 cDNAs related to PG, many of which corresponded to low-abundance mRNAs. Thus, it is difficult to identify genes that are transcribed only upon PG or to identify mRNAs that are essentially not translated until the end of PG (Wittink et al., 2000). However, Solexa deep-sequencing approaches overcome many of the inherent limitations of traditional sequencing systems and thus make it possible to detect low-abundance transcripts and alternative splicing events. For Arabidopsis, Wang et al. (2008) reported that, compared with MP, hydrated pollen (HP) and PTs have a larger number of newly transcribed genes. Inhibition experiments demonstrated that PG and polar tube growth strictly depend on protein synthesis but are relatively independent of transcription in many plant species (Mascarenhas, 1993; Honys and Twell, 2004; Wang et al., 2004; Hao et al., 2005). Thus, de novo synthesis of transcripts in germinating pollen might not be crucial for PG and early tube growth, although this issue needs to be addressed by sequential comparison of transcriptomes between developing and germinated pollen (Wei et al., 2010). To investigate the transcriptome changes of pollinated pollen tubes, a semi—in vivo approach was used, identifying 383 genes enriched in pollen tubes emerging from cut pistils compared with in vitro—cultured ones (Qin et al., 2009). Recently, a study by Lin et al. (2014) revealed over 500 transcripts specifically enriched in in vivo–grown pollen tubes. Surprisingly, there was only one gene overlap in these two studies.
Populus simonii × P. nigra is widely cultivated in the plains of Heilongjiang province in China and has many useful features such as cold and drought resistance, relatively high salinity tolerance, and fast growth. P. simonii × P. nigra pollen is easily accessible and has longevity under in vitro conditions. The MP grain is bicellular. Until recently, the bicellular pollen transcriptome of only two plants, soybean (Glycine max) and tobacco (Nicotiana tabacum cv. Samsun), had been analyzed (Haerizadeh et al., 2009; Hafidh et al., 2012). Our present study is the first study to integrate gene expression analysis for poplar pollen and PTs. To better understand the molecular regulation mechanism of PG and rapid tube growth, we constructed three libraries using the Illumina Solexa digital gene expression (DGE) system and compared the gene expression profiles at three developmental stages of P. simonii × P. nigra pollen. We also discovered a large number of differentially expressed genes (DEGs) involved in crucial functional categories and pathways during PG and PTG. These genes may play important roles in regulating PG and PTG and thus are attractive candidates for further analysis. These results also lay the theoretical foundation for tree crossbreeding and overcoming self-incompatibility.
Materials and Methods
Plant Material
Budding male-flower branches of P. simonii × P. nigra were collected from five different trees growing on the Northeast Forestry University campus. The branches were cultured in water at room temperature (17 ± 1°C). MP grains were obtained after 5 days. These pollen grains were dried overnight at room temperature and filtered using a stainless steel mesh (50 μm). The desiccated MP grains were stored at −80°C until use. The purity of MP was determined under a light microscope using 4′,6-diamimophenylindole (DAPI) staining.
In vitro PG and Collection of HP and PT
P. simonii × P. nigra pollen grains stored at −80°C were resuscitated at 5°C for 2 h, and 10 mg of the resuscitated pollen was evenly scattered in 10 mL liquid medium using a stainless steel mesh (50 μm). The liquid medium for PG and PTG consisted of 15% sucrose, 40 mg L−1 CaCl2, 20 mg L−1H3BO3 (pH 6.0–6.3). Pollen grains were incubated in a 100 mL flask at 21°C in darkness for ~7 h, which resulted in ~75% germination and an average PT length of ~250 μm. The PTs were filtered using a 50-μm nylon mesh to remove the ungerminated pollen grains and collected from the nylon mesh for total RNA extraction. HP samples were collected and centrifuged at 27 (× g) rcf after resuscitated pollen grains were incubated for 1.5 h. HP viability was assessed with FDA staining. Resuscitated pollen grains were incubated for 1.5 h in liquid medium with 2 μg mL−1 fluorescein diacetate (FDA). After washing out the FDA with liquid medium, the fluorescence of pollen grains was observed using a Zeiss SteREO Lumar. V12 fluorescence microscope.
RNA Extraction, Tag Library Construction, and Sequencing
Total RNA was isolated separately from the three samples (MP, HP, PT) using Trizol Reagent (Invitrogen, USA) and treated with DNase I (Fermentas, USA). RNA quality and purity were assessed with the OD 260:230 ratio and RNA integrity number using a 2100 Bioanalyzer (Agilent Technologies, Boblingen, Germany). To obtain comprehensive gene expression information, the pooled RNA from the MP, HP, and PT samples from five different trees were used for expression profiles analysis.
Next, a DGE library was prepared using the Digital Gene Expression Tag Profile kit (Illumina). The detailed procedure referred Sun et al.'s method (2012). Sequencing was performed by HuaDa Gene (http://www.genomics.cn/index) using the sequencing-by-synthesis method to produce the raw tag data. Raw data (MP, HP, and PT) have been deposited in Sequence Read Archive (SRA) of NCBI and can be accessed from (http://trace.ncbi.nlm.nih.gov/Traces/sra_sub/sub.cgi?subid=605060&from=list&action=show:submission) using the accession number PRJNA312293.
Analysis of Sequencing Data and Tag Mapping
We sequenced the DGE libraries for stages MP, HP, and PT using the Illumina massively parallel sequencing platform. Raw sequences were filtered as described (Sun et al., 2012). A preprocessed database of all possible CATG+17-nt tag sequences was created using Populus trichocarpa (http://genome.jgi-psf.org/Poptr1_1/Poptr1_1) as a reference gene sequence. To monitor the mapping of the two strands, both the sense and the complementary antisense sequences were included in the data collection. All clean tags were mapped to the reference sequence, with = 1 nt mismatch allowed. Clean tags mapped to the reference sequence from multiple genes were excluded. The remaining clean tags were considered unambiguous clean tags and were annotated. The number of unambiguous clean tags for each gene was calculated and then normalized to the total number of transcripts per million clean tags (t Hoen et al., 2008; Morrissy et al., 2009). A gene detected only in one stage (MP, HP, or PT) was defined as a specifically expressed gene in that stage.
Analysis of DEGs
DEGs between two samples were identified according to the method of Audic and Claverie (1997). P-value was used to test differential transcript accumulation. False Discovery Rate (FDR) was used to determine the threshold P-value in multiple testing and analysis. Assuming that R differentially expressed genes have been selected, S genes really show differential expression, whereas the other V genes are false positives. If the error ratio “Q = V/R” must remain below a cutoff (5%), FDR should not exceed 0.05 (Benjamini and Yekutieli, 2001). To gain the global transcriptional changes that were associated with PG and PTG and to assess the molecular basis of PG and PTG, we used FDR ≤ 0.001, P < 0.0005, and ∣log2 ratio∣ ≥ 1 as the threshold to judge the significance of gene expression difference. The DEGs were then subjected to gene ontology (GO) and Kyoto Encyclopedia of Genes and Genomes (KEGG) ontology enrichment analysis. Enriched P-values were calculated according to the hypergeometric test of Sun et al. (2012). A corrected P < 0.05 was selected as the threshold for significant enrichment of the gene sets. Annotations of the GO and pathways of the reference sequences were obtained using BLAST v2.2.21 software (ftp://ftp.ncbi.nlm.nih.gov/blast/executables/blast+/2.2.21/). Cluster analysis of gene expression patterns was performed with Cluster (Eisen et al., 1998) and Java Treeview software (Saldanha, 2004). We performed the cluster analysis of the intersection (expressed in the three stages and corresponding FDR ≤ 0.001 and |log2 ratio|≥ 1) of DEGs.
Quantitative Reverse Transcription (qRT)-PCR
We used qRT-PCR to verify the DGE results. The RNA samples (MP, PT) used for qRT-PCR were the same as those for the DGE experiments. Primers were designed using Primer Premier 5.0 (Premier, Canada). Actin, 18S rDNA, and GAPDH were used as the internal controls to normalize the data. The PCR primers are shown in Supplementary Table S1. The qRT-PCR was performed using the DNA Engine Opticon TM2 fluorescence detection system (MJ Research, USA) with SYBR-Green (SYBR PrimeScript RT-PCR kit, TaKaRa Biotechnology Co., Ltd., Dalian, China). Each reaction (25 μL) contained 0.5 μL of each primer, 2 μL cDNA, 12.5 μL SYBR Premix Ex TaqTM, and 9.5 μL double-distilled H2O. All runs included a negative control without template cDNA that produced no detectable fluorescence signal. The amplification reactions were initiated with pre-denaturing at 94°C for 30 s, followed by 45 cycles of denaturing (94°C for 12 s), annealing (54°C for 30 s), and extension (72°C for 45 s; 78.5°C for 1 s), and a final step of 55–99°C to plot a dissociation curve for each amplified product. All reactions were performed with at least three replicates. Relative expression was calculated with the 2−ΔΔCt method (Livak and Schmittgen, 2001).
Results
Cytological Observation and In vitro Germination of P. simonii × P. nigra Pollen
P. simonii × P. nigra MP grains were stained with DAPI and examined by fluorescence microscopy. The vast majority of them were bicellular, consisting of a large vegetative cell and a small generative cell. A very small proportion of tricellular pollen (containing one large vegetative cell and two sperm cells) was also observed (Figure 1A). Of the >1500 pollen grains counted, tricellular pollen accounted for only ~0.089%. The germinating pollen could transport an entire germ unit into the pollen tube (Figures 1B,B′). For the bicellular pollen, the vegetative nucleus was transferred into the pollen tube first, followed by the generative cell, and then the generative cell was divided into two sperm cells in the pollen tube. For the tricellular pollen, the two sperm cells were transferred into the pollen tube first, followed by the vegetative nucleus (Figures 1C,C′,D,D′). It was not clear why the tricellular pollen appeared in our experiments. The germination rate was ~75% when the pollen was cultured in the liquid medium for 7 h >90% of the HP grains were positive for FDA staining, indicating high-level viability of the cultured pollen grains (Figure 2). We proposed that the pollen grains might enter the germination process along with the emergence of the pollen tube. Given that transcriptional changes can be extremely rapid, they should appear before any morphological change is observed (Wang et al., 2008). Approximately 15% of HP grains showed emergence of PTs, suggesting that RNA extracted at this stage would provide transcriptional information about PG.
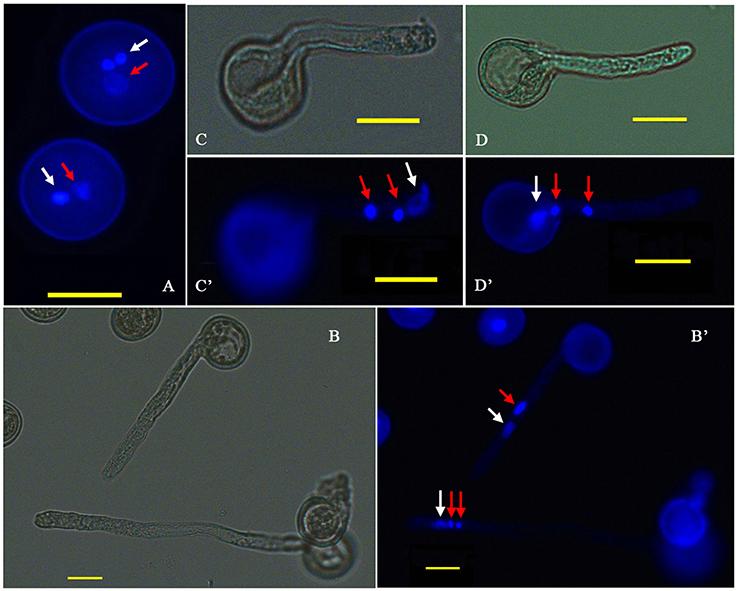
Figure 1. Cytological observation of P. simonii × P. nigra PG and PTG. (A) DAPI fluorescence image of two-celled and three-celled pollen. (B,B′) Bright-field and DAPI fluorescence images of the two and three nuclei states in the tube; red arrows show generative nuclei or two sperm nuclei, and white arrows show vegetative nuclei. (C,C′) Bright-field and DAPI fluorescence images, respectively, of the vegetative nucleus leading the sperm nucleus into the PT. (D,D′) Bright-field and DAPI fluorescence images, respectively, of two sperm nuclei moving into the tube before the vegetative nucleus.
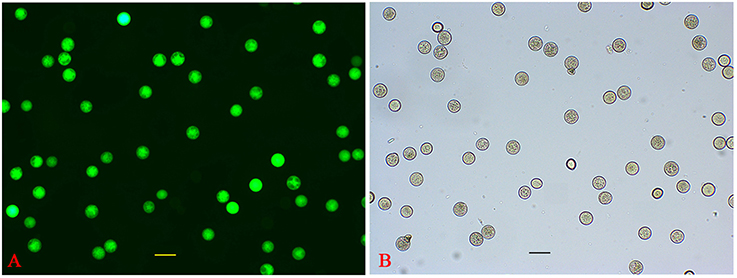
Figure 2. Evaluation of HP viability. (A) FDA fluorescence image of HP. (B) Bright-field image of HP.
Analysis of the Digital Gene Expression Libraries
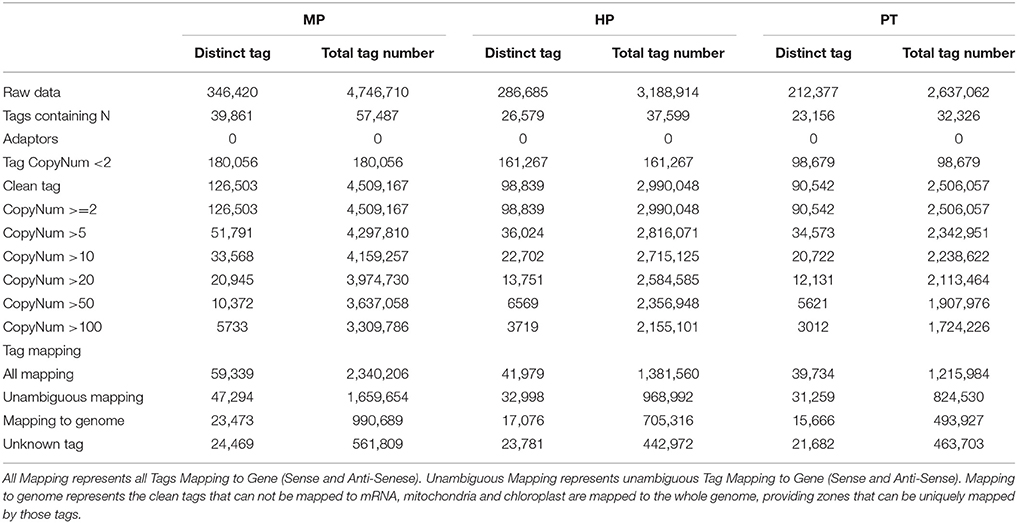
The major characteristics of three libraries are summarized in Table 1. We obtained ~3.5 million total sequence tags per library, with 281,827 distinct tag sequences. We filtered raw sequence, leaving ~3.3 million total clean sequence tags per library, 105,295 of which were distinct. The MP library showed the highest numbers for both total and distinct sequence tags, followed by the HP and the PT libraries. Moreover, the MP library exhibited the highest percentage of distinct clean, high-copy-number tags and the lowest ratio of distinct to total tags. As shown in Table 1, the read copy numbers ranged from 2 to ≥100. The majority of the distinct clean tags (~63% from each library) had low copy number (< 20 copies), and ~22% of the tags from each library had a copy number between 11 and 100. Only ~4% of the tags were detected >100 times.
Saturation analysis of the libraries showed that the number of newly emerging distinct tags gradually decreased with the increase in total sequence tags. Furthermore, when the number of sequencing tags reached 2.0, 1.5, and 1.0 million for the MP, HP, and PT libraries, respectively, the libraries became saturated (Supplementary Figure S1).
Analysis of Tag Mapping
For reference gene sequences from P. trichocarpa, altogether, 41,404 genes (90.1%) had the CATG site, resulting in a total of 1,192,383 reference tags with 167,529 (81.1%) unambiguous tags. In the present study, we were able to map ~70.6% of the total clean tags to genes or genome positions, demonstrating the feasibility of using this approach to investigate PG and PTG in P. simonii × P. nigra. 46.9, 42.5, and 43.9% of the distinct clean tags in the MP, HP and PT libraries, respectively, mapped to the reference tag database, 37.4, 33.4, and 34.5% of the distinct clean tags of the three libraries mapped unambiguously to the unigenes, and 18.6, 17.3, and 17.3% of the distinct clean tags matched genomic sequences within each library (Table 1). The percentage of total clean tags that matched to the genome was the highest for HP (23.6%). As a result of the considerable sequencing depth of Illumina/Solexa technology and incomplete annotation of the P. trichocarpa genome, 19.3, 24.1, and 24.0% of the tags in the MP, HP, and PT libraries were unmatched (Table 1). It perhaps indicates that most of the genes involved in PG and PTG had not yet been identified. But these collections of tags will be highly useful as more P. trichocarpa genomic sequences become available.
In addition, ~16% of the distinct tags in the three libraries mapped to the antisense strand, suggesting that these regions might be bi-directionally transcribed (Supplementary Table S2). Approximately 2421 antisense-stand transcripts were detected in each library, and the ratio of sense to antisense strand transcripts was ~4.2:1 for all libraries (Supplementary Table S3). This result suggested that the transcriptional regulation during PG and PTG is mostly directed at the sense strand.
Genes Expressed in MP, HP, and PT
More genes were detected in the MP library than the HP and PT libraries. Specifically, 11,751 (25.6% of reference genes), 9348 (20.3%), and 9644 (21.0%) unambiguous tag-mapped genes were detected in MP, HP, and PT, respectively (Table 2). In total, 13,017 genes (representing 28.3% of the unigenes in the reference) were present in at least one of MP, HP, or PT (Table 2, Supplementary Table S4). The numbers of transcripts detected were higher than reported in previous microarray-based studies (Honys and Twell, 2004; Pina et al., 2005; Wang et al., 2008). Among these genes, 6996 (15.2%) were consistently expressed in all three stages (Table 2, Supplementary Table S5), and another 6021 genes were preferentially expressed in one or two stages. Further analysis of these 6021 genes showed that 2006 were specifically expressed in MP (17.1% of the expressed genes in MP), 450 were specifically expressed in HP (4.8% of the expressed genes in HP), and 958 were specifically expressed in PT (9.9% of the expressed genes in PT; Table 2).
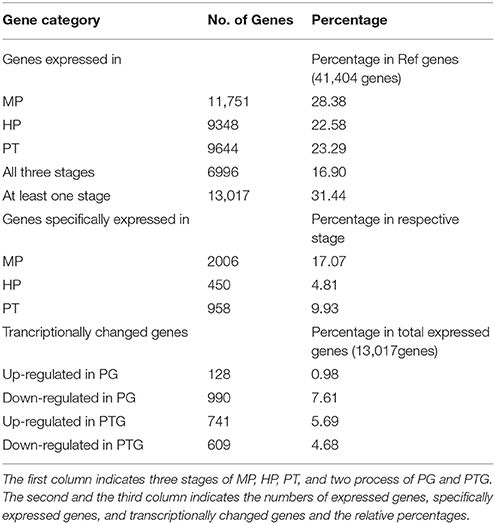
Table 2. Numbers of expressed genes, specifically expressed genes, and transcriptionally changed genes during PG and PTG.
Identification of DEGs and GO Analysis during PG and PTG
The distribution of fold-changes in tag number among the three libraries is shown in Supplementary Figure S2. The great majority of transcripts were expressed at similar levels in the three libraries: approximately 96.7% tags showed a < five-fold difference in expression. 1118 and 1350 DEGs were identified during PG and PTG, respectively. There were 128 up-regulated and 990 down-regulated transcripts during PG and 741 up-regulated and 609 down-regulated transcripts during PTG (Table 2, Supplementary Table S6). Except for the unknown transcripts (~54%), predicted or known genes were categorized according to their functions, cellular component, and biological process. Altogether, 60 up-regulated and 462 down-regulated genes during PG and 306 up-regulated and 306 down-regulated genes during PTG were classified into 10 main functional categories (Figure 3, Supplementary Table S7). The categories, catalytic activity, binding, transporter activity, and enzyme regulator activity were overrepresented during PG and PTG. The percentage of up-regulated genes in the categories of antioxidant activity, structural molecule activity, molecular transducer activity, nutrient reservoir activity, and translation regulator activity were greatly different during PG and PTG (Figure 3). In PG, Go analysis showed that 25 terms (GO cellular component) were significantly enriched, including those asscociated with protein complex, endomembrane system, membrane part, vesicle membrane, and cytoplasmic membrane-bounded vesicle (Supplementary Table S8). Significantly enriched “cellular component” was not found during PTG. Eight terms (GO biological process) included those associated with transport, establishment of localization, localization, ion transport, and cation transport were significantly enriched during PG (Supplementary Table S8). But we identified three terms (GO biological process) different from PG, including those associated with sphingolipid metabolic process, membrane lipid metabolic process and alcohol metabolic process during PTG (Supplementary Table S8).
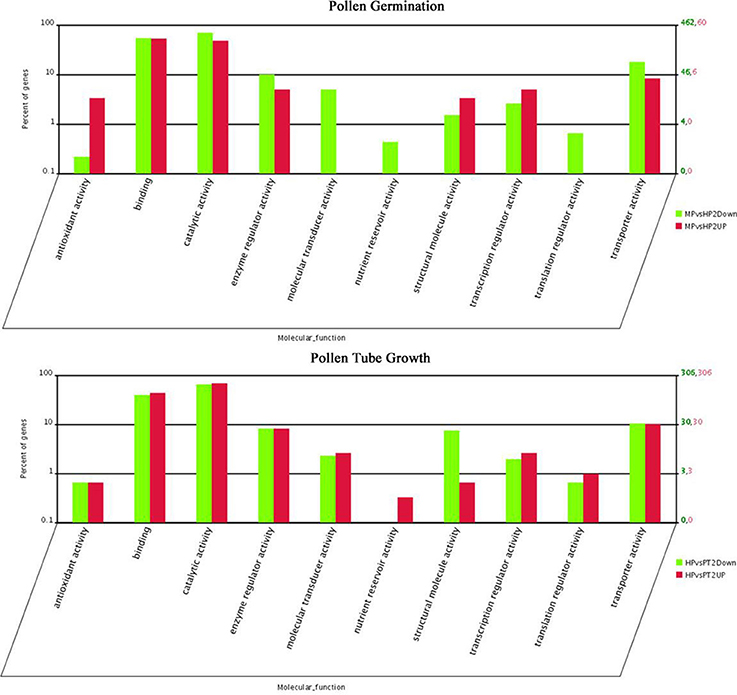
Figure 3. Functional category distribution of DEGs in PG and PTG. MPvsHP2UP and HPvsPT2UP indicate genes showing ≥two-fold increase in expression during PG and PTG; MPvsHP2Down and HPvsPT2Down indicate genes showing a ≥two-fold decrease in expression during PG and PTG.
Clustering Analysis of DEGs
Clustering analysis showed that some highly dynamic genes were detected. Two genes—one involved in peroxidase activity (POPTRDRAFT_822482) and the other in ATP binding (POPTRDRAFT_563887)—were significantly up-regulated during PG but markedly down-regulated during PTG. A gene of unknown function (POPTRDRAFT_760210) and a gene involved in protein kinase activity (POPTRDRAFT_809614) were significantly up-regulated during PTG but significantly down-regulated during PG (Figure 4). Another seven genes followed a similar trend. Among these are genes involved in the microtubule-associated complex or microtubule motor activity (POPTRDRAFT_551661), catalytic activity (POPTRDRAFT_570778), and the ubiquitin ligase complex or protein ubiquitination (POPTRDRAFT_554844). The molecular functions of the other four genes (POPTRDRAFT_549110, POPTRDRAFT_422674, POPTRDRAFT_427160, and POPT RDRAFT_872186) remain unknown (Figure 4). The DEG clustering analysis also showed that some genes were up-regulated during both PG and PTG, including genes involved in pectinesterase activity (POPTRDRAFT_555333), membrane or transport activity (POPTRDRAFT_262485, POPTRDRAFT_751961, and POPTRDRAF T_830825), regulation of transcription (POPTRDRAFT_564400), protein nuclear import (POPTRDRAFT_ 554771), protein modification (POPTRDRAFT_738036), and calcium ion binding (POPTRDRAFT_576061; Figure 4). The functions of more than half of the genes that were up-regulated during PG and PTG remain unknown.
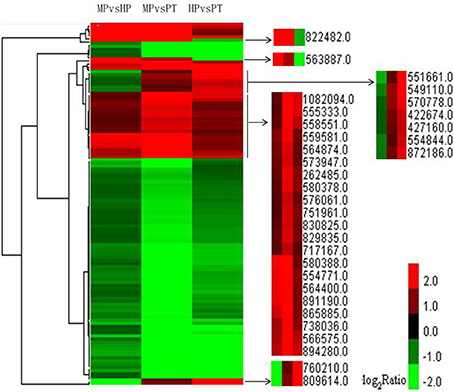
Figure 4. Clustering analysis of DEGs from the three stages with FDR ≤ 0.001 and |log2 ratio| ≥ 1 within each group of DEGs. Altogether 115 genes were used in the clustering analysis. Red represents up-regulated expression; green represents down-regulated expression.
Pathway Enrichment Analysis of DEGs
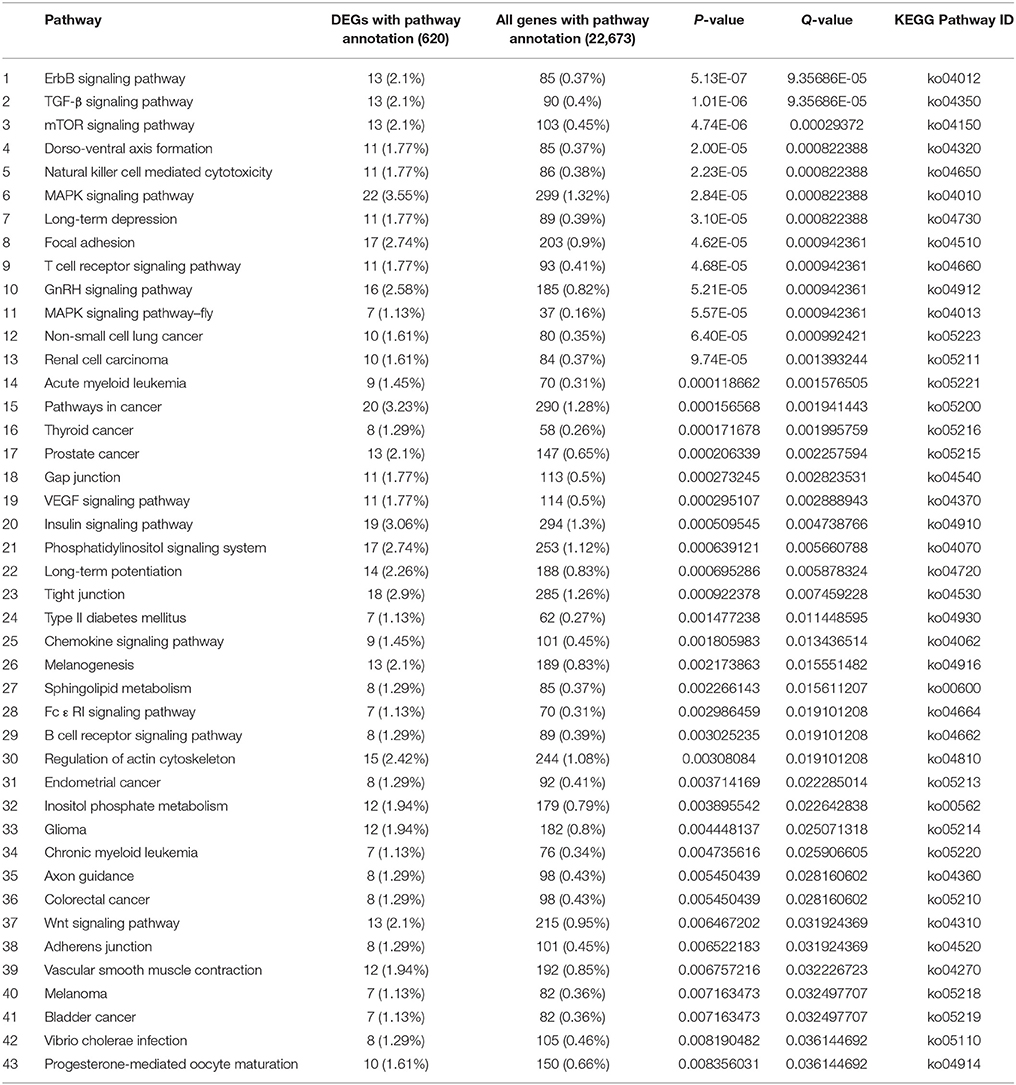
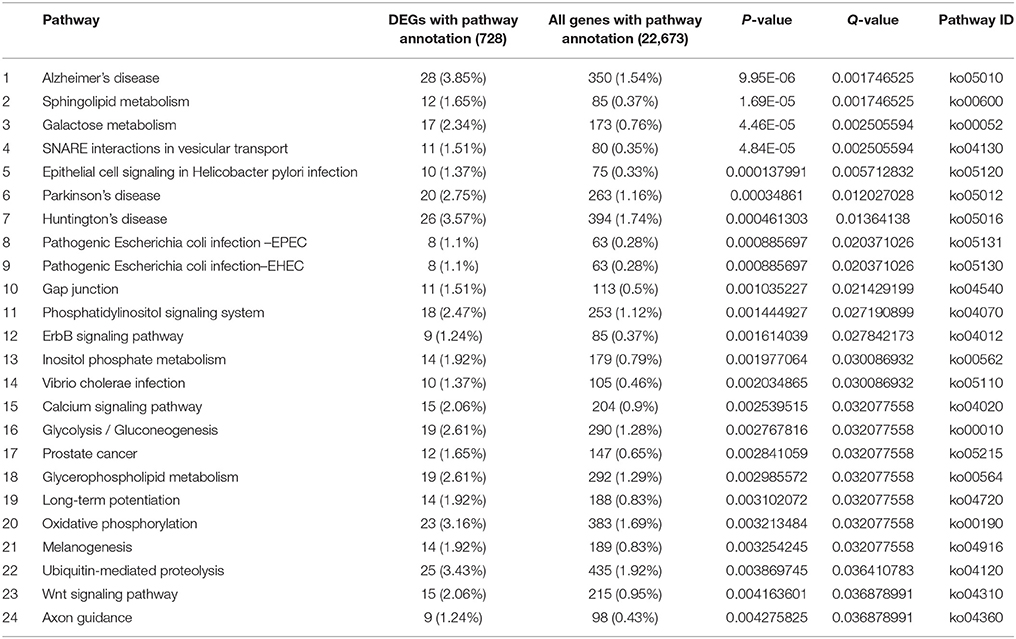
There were 620 and 728 DEGs with pathway annotations during PG and PTG, respectively. A total of 186 pathways were enriched during PG (Supplementary Table S9), the first 43 of which are significantly enriched (Table 3). There were 207 enriched pathways during PTG (Supplementary Table S10), the first 24 of which are significantly enriched (Table 4).
The first 43 significantly enriched pathways during PG included some critical pathways, such as the mitogen-activated protein kinase (MAPK) signaling pathway, the phosphatidylinositol signaling system, sphingolipid metabolism, regulation of the actin cytoskeleton, and inositol phosphate metabolism (Table 3). In PG, the top three most enriched pathways were the ErbB, TGF-β, and mTOR signaling pathways often associated with various cancers (Modjtahedi et al., 2014; Azad et al., 2015). This group also included other pathways such as the gap, tight and adherens junctions pathways, insulin signaling pathways, and a pathway associated with type II diabetes mellitus (Table 3). Although most of the latter pathways have been well studied in animals and humans, their functions in plants remain unclear. The first 24 significantly enriched pathways during PTG mainly included sphingolipid metabolism, galactose metabolism, SNARE interactions in vesicular transport, the calcium signaling pathway, the phosphatidylinositol signaling system, inositol phosphate metabolism, glycerophospholipid metabolism, oxidative phosphorylation, ubiquitin-mediated proteolysis, and some pathways related to human diseases (Table 4).
qRT-PCR Confirmation
To evaluate the validity of the Illumina/Solexa analysis and to further assess the patterns of differential gene expression, 13 candidate genes were selected from the two developmental stages used for Illumina/Solexa analysis (MP and PT) and examined by qRT-PCR. Of these genes, nine were up-regulated and four were down-regulated (Figure 5). The expression profile trends of the qRT-PCR for these selected genes were similar to those detected by the Illumina/Solexa sequencing–based method, further confirming the Illumina/Solexa data.
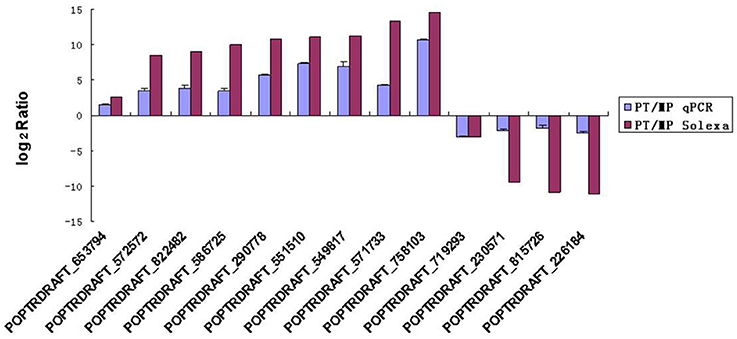
Figure 5. qRT-PCR validation of Solax digital gene expression data. PT:MP ratios of 13 tested genes determined by Illumina/Solexa compared with ratios determined by qRT-PCR. The expression profile trends of the two methods were similar. Error bars represent SE.
Discussion
Transcriptional Level Analysis during PG and PTG in P. simonii × P. nigra
Our data showed that the total number and diversity of transcribed genes greatly decreased from MP to HP and slightly increased from HP to PT. Stage-specifically expressed genes followed the same trend. Down-regulated genes were dominant during PG, whereas up-regulated genes were dominant during PTG. These results suggest a shift in the gene expression program in PG and PTG and that the HP stage may be crucial for the regulation of this shift. Wang et al. (2008) however, reported that the numbers of transcribed and specifically expressed genes gradually increase from MP to HP and further to PT, and that up-regulated genes are dominant during PG and PTG compared with down-regulated genes in Arabidopsis. Similar results have been seen in tobacco gene expression (Hafidh et al., 2012), but that study only compared two time points (MP grains and in vitro–germinated PTs grown for 4 h), and the gene expression differences between the two points are marginal. The contradiction between our results and these previous two studies might be due to differences in species, sample preparation, or sequencing platforms. P. simonii × P. nigra and tobacco have bicellular pollen, whereas Arabidopsis has tricellular pollen. As shown in several plant studies, PG and early PTG are not dependent on new RNA synthesis. In most plants that shed bicellular pollen, the later PTG and division of the generative cell into two sperm cells are dependent on new mRNA synthesis after the pollen tube forms (reviewed in Mascarenhas, 1975). During the first hour of PTG, ~50% of the protein synthesis utilizes previously existing mRNAs, and the remaining 50% utilizes newly synthesized mRNAs (Mascarenhas and Mermelstein, 1981). These studies are consistent with our findings. Our results showed that the proportion of specifically expressed genes and the number of up-regulated genes significantly increased from HP to PT (Table 2), suggesting that these genes might play critical roles during PTG and sperm cell formation.
Functional Categories and Genes Involved in PG and PTG
The up-regulated genes involved in antioxidant, structural molecule, and transcription regulator activity were dominant during PG compared with the down-regulated genes. And the percentage of up-regulated genes involved in antioxidant activity and structural molecule activity categories was significantly higher than PTG (Figure 3, Supplementary Table S7). Reactive oxygen species (ROS) played a key role in pollen grain activation and pollen tube initiation in kiwifruit (Speranza et al., 2012). Increased levels of ROS lead to the activation of the antioxidant system, possibly through a direct effect of ROS on signaling pathways (Rodriguez Milla et al., 2003; Richards et al., 2015). One gene (POPTRDRAFT_822482) involved in peroxidase activity was detected from clustering analysis. Peoxidases are a group of enzymes that protect cells against oxidative damage. The other gene (POPTRDRAFT_563887) involved in ATP-binding was also detected (Figure 4). These types of highly dynamic genes might play key roles in PG. Wang et al. (2008) reported that rescue- and transcription-related genes are overrepresented or markedly up-regulated during PG in Arabidopsis. The GO categories related to transport (Go biologycal process) and protein complex (Go cellular component) were both most significantly enriched in PG. The categories associated with transporter activities and macromolecular complex were reported to be the most over-represented in mature pollen compared with pollen tubes (Hafidh et al., 2012). The enrichments of GO categories may provide important hints about pollen biology.
PTG had a distinct gene function distribution from PG. The percentage of up-regulated genes involved in catalysis, enzyme regulation, molecular transduction, translation regulation, nutrient reservoir, and transporter activity was increased during PTG, especially those in the categories of molecular transducer, translation regulator, and nutrient reservoir. Moreover, the three types of genes were down-regulated during PG (Figure 3, Supplementary Table S7). These findings agree with the two major functional categories found to be up-regulated in Arabidopsis during PTG, signaling and transporter-related activity (Wang et al., 2008). Molecular transducer- and transporter-related genes are involved in the regulation of the polarized tip growth of PTs (Hepler et al., 2001). This process is regulated by complex signal crosstalk and requires a large number of transporters to supply sufficient materials for the rapid growth of PTs (Hepler et al., 2001; Holdaway-Clarke and Hepler, 2003). The categories or subcategories related to nutrient reservoir activity, translation, protein transport, and turnover and signal transduction are highly over-represented in the subset of 104 pollen-tube/root-hair overlapping genes (Hafidh et al., 2012). In particular, genes associated with chromatin remodeling and transcription, signal transduction, and transport previously are over-represented in pollen tubes that has grown semi-in vivo through the pistil and can thus mediate pollen-tube growth and guidance through the style (Qin et al., 2009). Nine genes identified from clustering analysis are significantly up-regulated during PTG but significantly down-regulated during PG (Figure 4). Four genes are involved in protein kinase activity, microtubule motor activity, catalytic activity, and protein ubiquitination. Ubiquitin-mediated proteolysis is reportedly involved in spermatogenesis in Arabidopsis (Borges et al., 2008). The molecular functions of the other five genes remain unknown. The molecular functions of these four characterized genes are very consistent with the physiological characteristics of PTG and spermatogenesis.
In addition, clustering analysis also showed that some genes were up-regulated during both PG and PTG (Figure 4), including genes involved in pectinesterase activity, membrane or transport activity, regulation of transcription, protein nuclear import, protein modification, and calcium ion binding. These functions are closely associated with polarized PTG (Pina et al., 2005; Wang et al., 2008; Qin et al., 2009). The functions of more than half of the genes that were up-regulated during PG and PTG remain unknown.
Pathways Closely Associated with PG and PTG
The MAPK signaling pathway, regulation of the actin cytoskeleton, focal adhesion, GnRH signaling, and chemokine signaling were only significantly enriched in PG (Table 3, Supplementary Table S9). MAPK cascades are essential for many signaling pathways in plants, and there is often crosstalk between members of different signaling pathways (Mishra et al., 2006). We identified encode classical MAPK pathway–related proteins such as CACN, PKC, MEK1, MEK2, ERK. Genes encoding MEKK1, PAK1/2, MEKK2/3, MUK, MLTK, and TAK1 were found to be significantly down-regulated, whereas genes encoding HSP72 and PPP3C were significantly up-regulated in the pathway. CACN-1 was reported that it was required cell-autonomously to control distal tip cells migration (Tannoury et al., 2010). Wang et al. (2008) proposed that Hsps may function as molecular chaperones (for review, see Miernyk, 1999) involved in the regulation of protein modification during PG and PTG, which is associated with the rapid protein synthesis and high physiological activity in germinating pollen and pollen tubes. Here there is crosstalk among GnRH signaling, focal adhesion, the MAPK signaling pathway. There is also crosstalk between regulation of the actin cytoskeleton and focal adhesion. These crosstalks were mainly linked by genes encoding PAK, MEK, and ERK. They were found to be significantly down-regulated in above pathways (Supplementary Figures S3–S7). The common function of PAK is the activation of MAPK cascades and the regulation of cytoskeletal structure through effects on the actin and tubulin cytoskeletons (Hofmann et al., 2004). ERK1,2 activation has also been shown to be required for cell proliferation and transformation in mice (Troppmair et al., 1994). It is well known that the dynamic organization of the actin cytoskeleton plays a fundamental role in PG and PTG. Genes encoding proteins involved in the regulation of the actin cytoskeleton, such as GIT1, PI4P5K, mDia, and gelsolin (GSN), were significantly down-regulated during PG (Supplementary Figure S4). GIT1 is a multidomain protein that is thought to function as an integrator of signaling pathways controlling vesicle trafficking, adhesion, and cytoskeletal organization (Manabe et al., 2002). The poppy (Papaver rhoeas) GSN, in addition to Ca2+-regulated severing, can nucleate new actin filaments during assembly and also cap the barbed end of actin filaments (Huang et al., 2004). These five pathways were also closely related to PG.
Different pathways were significantly enriched during PTG and sperm cell formation compared with PG. Some metabolic and signaling pathways, such as sphingolipid metabolism, galactose metabolism, glycolysis, glycerophospholipid metabolism, oxidative phosphorylation, and calcium signaling, provide large quantities of material and energy for the extremely rapid PTG (Table 4, Supplementary Table S10). The vesicle transport–associated SNARE pathway, which is presumably required for material transport during PTG, was also enriched in PTG. Another significantly enriched pathway, ubiquitin-mediated proteolysis (Table 4), plays an essential role in male gametogenesis in mice and humans (Baarends et al., 1999a,b). Ubiquitin-mediated proteolysis is also one of the overrepresented GO categories in Arabidopsis sperm cells (Borges et al., 2008). The majority of the 25 known genes that encode ubiquitin pathway–related proteins, such as ubiquitin-conjugating enzyme and ubiquitin ligase, were up-regulated in the PTG samples. For example, four genes encoding E2-related proteins (UBE2I, UBE2J1, UBE2N, and UBE2W) and three genes encoding HECT-type E3-related proteins (NEDD4, HERC2, and HERC3) were up-regulated. Genes encoding the multisubunit RING-finger-type E3-related proteins (Skip1, F-box, DDB1, and DCAF) were all significantly differential expressed during PTG (Supplementary Figure S8). Skp1/Cullin1/F-box complexes are involved in the ubiquitination of proteins targeted for proteasome-dependent degradation and are also known to control the cell cycle and diversified developmental processes (Cardozo and Pagano, 2004; Lechner et al., 2006; Hafidh et al., 2012). The Cullin4/DDB1/DCAF complex may play important roles in multiple developmental processes including plant embryogenesis (Zhang et al., 2008). These pathways, other than sphingolipid metabolism, were only significantly enriched in PTG. There is also crosstalk among galactose metabolism, glycerophospholipid metabolism and glycolysis.
The pathway enrichment analysis revealed that 12 biological pathways were significantly enriched in both PG and PTG (Tables 3, 4; Supplementary Tables S9, 10), even though the expression levels of some of the genes within those pathways showed differences in PG and PTG. Although the role of some pathways or genes in pollen germination and PTG is not clear. DEGs in the above pathways will be the attractive candidates for further analysis.
Author Contributions
CY designed experiment. LZ carried out experiments, analyzed experimental results, and wrote the manuscript. HY assisted with results analysis. WG assisted with organizing figures and tables.
Conflict of Interest Statement
The authors declare that the research was conducted in the absence of any commercial or financial relationships that could be construed as a potential conflict of interest.
Acknowledgments
This work was supported by the National Program for Key Basic Research Projects of China (No. 2009CB119102), National Natural Science Foundation of China (31370662), and Open Foundation Project of State Key Laboratory of Tree Genetics and Breeding (Northeast Forestry University) (201203). It was also supported by Natural Science Foundation project of Heilongjiang Province (C201316), Applied Technology Research and Development Projects of Harbin (2014RFQYJ138).
Supplementary Material
The Supplementary Material for this article can be found online at: http://journal.frontiersin.org/article/10.3389/fpls.2016.00825
Supplementary Table S1. Genes and primer sequences selected for qRT-PCR.
Supplementary Table S2. Summary of Illumina/Solexa clean tags mapping to sense or antisense genes.
Supplementary Table S3. Summary of sense or antisense-strand transcripts (these genes are all unigenes).
Supplementary Table S4. Total genes expressed in at least one of MP, HP, and PT.
Supplementary Table S5. Genes expressed in the three stages.
Supplementary Table S6. DEGs during PG and PTG.
Supplementary Table S7. DEGs classified into 10 functional categories during PG.
Supplementary Table S8. Significantly enriched GO terms and DEGs in the terms of PG and PTG.
Supplementary Table S9. Enriched pathways and DEGs in the pathways of MPvsHP.
Supplementary Table S10. Enriched pathways and DEGs in the pathways of HPvsPT.
Supplementary Figure S1. Saturation evaluation of differential expression in the three samples. When sequencing reached ≥2, 1.5, and 1.0 million reads for MP, HP, and PT, respectively, the number of newly detected genes essentially stopped increasing.
Supplementary Figure S2. Distribution of fold-change in tag number among the three libraries.
Supplementary Figure S3. Overview of the MAPK signaling pathway taken from KEGG database—one of the pathways that was significantly enriched during PG (proteins outlined in red were up-regulated, and proteins outlined in green were down-regulated).
Supplementary Figure S4. Overview of actin cytoskeleton regulation pathway taken from KEGG database—one of the pathways that was significantly enriched during PG (proteins outlined in green were down-regulated).
Supplementary Figure S5. Overview of focal adhension pathway taken from KEGG database—one of the pathways that was significantly enriched during PG (proteins outlined in green were down-regulated).
Supplementary Figure S6. Overview of GnRH signaling pathway taken from KEGG database—one of the pathways that was significantly enriched during PG (proteins outlined in green were down-regulated).
Supplementary Figure S7. Overview of chemokine signaling pathway taken from KEGG database—one of the pathways that was significantly enriched during PG (proteins outlined in green were down-regulated).
Supplementary Figure S8. Overview of the ubiquitin (Ub)-mediated proteolysis pathway taken from KEGG database—one of the pathways that was significantly enriched during PTG (proteins outlined in red were up-regulated, and proteins outlined in green were down-regulated).
References
Audic, S., and Claverie, J. M. (1997). The significance of digital gene expression profiles. Genome Res. 7, 986–995.
Azad, A. K. M., Lawen, A., and Keith, J. M. (2015). Prediction of signaling cross-talks contributing to acquired drug resistance in breast cancer cells by Bayesian statistical modeling. BMC Syst. Biol. 2:9. doi: 10.1186/s12918-014-0135-x
Baarends, W. M., Hoogerbrugge, J. W., Roest, H. P., Oom, M., Vreeburg, J., and Hoeijimakers, J. H. J. (1999a). Histone ubiquitination and chromatin remodeling in mouse spermatogenesis. Dev. Biol. 207, 322–333. doi: 10.1006/dbio.1998.9155
Baarends, W. M., Roest, H. P., and Grootegoed, J. A. (1999b). The ubiquitin system in gametogenesis. Mol. Cell. Endocrinol. 25, 5–16. doi: 10.1016/S0303-7207(99)00060-X
Becker, J. D., Boavida, L. C., Carneiro, J., Haury, M., and Feijó, J. A. (2003). Transcriptional profiling of Arabidopsis tissues reveals the unique characteristics of the pollen transcriptome. Plant Physiol. 133, 713–725. doi: 10.1104/pp.103.028241
Benjamini, Y., and Yekutieli, D. (2001). The control of the false discovery rate in multiple testing under dependency. Ann. Stat. 29, 1165–1188.
Borges, F., Gomes, G., Gardner, R., Moreno, N., McCormick, S., Feijó, J. A., et al. (2008). Comparative transcriptomics of Arabidopsis sperm cells. Plant Physiol. 148, 1168–1181. doi: 10.1104/pp.108.125229
Cardozo, T., and Pagano, M. (2004). The SCF ubquitin ligase: insights into a molecular machine. Nat. Rev. Mol. Cell Biol. 5, 739–751. doi: 10.1038/nrm1471
Eisen, M. B., Spellman, P. T., Brown, P. O., and Botstein, D. (1998). Cluster analysis and display of genome-wide expression patterns. Proc. Natl. Acad. Sci. U.S.A. 95, 14863–14868. doi: 10.1073/pnas.95.25.14863
Feijó, J. A., Costa, S. S., Prado, A. M., Becker, J. D., and Certal, A. C. (2004). Signalling by tips. Curr. Opin. Plant Biol. 7, 589–598. doi: 10.1016/j.pbi.2004.07.014
Feijó, J. A., Sainhas, J., Holdaway-Clarke, T., Cordeiro, M. S., Kunkel, J. G., and Hepler, P. K. (2001). Cellular oscillations and the regulation of growth: the pollen tube paradigm. Bioessays 23, 86–94. doi: 10.1002/1521-1878(200101)23:1<86::AID-BIES1011>3.0.CO;2-D
Guyon, V. N., Astwood, J. D., Garner, E. C., Dunker, A. K., and Taylor, L. P. (2000). Isolation and characterization of cDNAs expressed in the early stages of flavonol-induced pollen germination in petunia. Plant Physiol. 123, 699–710. doi: 10.1104/pp.123.2.699
Haerizadeh, F., Wong, C., Bhalla, P., Gresshoff, P., and Singh, M. (2009). Genomic expression profiling of mature soybean (Glycine max) pollen. BMC Plant Biol. 9:25. doi: 10.1186/1471-2229-9-25
Hafidh, S., Breznenová, K., RùŽièka, P., Feciková, J., Èapková, V., and Honys, D. (2012). Comprehensive analysis of tobacco pollen transcriptome unveils common pathways in polar cell expansion and underlying heterochronic shift during spermatogenesis. BMC Plant Biol. 12:24. doi: 10.1186/1471-2229-12-24
Hao, H., Li, Y., Hu, Y., and Lin, J. (2005). Inhibition of RNA and protein synthesis in pollen tube development of pinus bungeana by actinomycin D and cycloheximide. New Phytol. 165, 721–729. doi: 10.1111/j.1469-8137.2004.01290.x
Hepler, P. K., Vidali, L., and Cheung, A. Y. (2001). Polarized cell growth in higher plants. Annu. Rev. Cell Dev. Biol. 17, 159–187. doi: 10.1146/annurev.cellbio.17.1.159
t Hoen, P. A. C., Ariyurek, Y., Thygesen, H. H., Vreugdenhil, E., Vossen, R. H. A. M., de Menezes, R. X., et al. (2008). Deep sequencing -based expression analysis shows major advances in robustness, resolution and inter-lab portability over five microarray platforms. Nucleic Acids Res. 36:e141. doi: 10.1093/nar/gkn705
Hofmann, C., Shepelev, M., and Chernoff, J. (2004). The genetics of Pak. J. Cell Sci. 117, 4343–4354. doi: 10.1242/jcs.01392
Holdaway-Clarke, T. L., and Hepler, P. K. (2003). Control of pollen tube growth: role of ion gradients and fluxes. New Phytol. 159, 539–563. doi: 10.1046/j.1469-8137.2003.00847.x
Honys, D., and Twell, D. (2003). Comparative analysis of the Arabidopsis pollen transcriptome. Plant Physiol. 132, 640–652. doi: 10.1104/pp.103.020925
Honys, D., and Twell, D. (2004). Transcriptome analysis of haploid male gametophyte development in Arabidopsis. Genome Biol. 5:R85. doi: 10.1186/gb-2004-5-11-r85
Huang, S., Blanchoin, L., Chaudhry, F., Franklin-Tong, V. E., and Staiger, C. J. (2004). A gelsolin-like protein from Papaver rhoeas pollen (PrABP80) stimulates calcium-regulated severing and depolymerization of actin filaments. J. Biol. Chem. 279, 23364–23375. doi: 10.1074/jbc.M312973200
Lechner, E., Achard, P., Vansiri, A., Potuschak, T., and Genschik, P. (2006). F-box proteins everywhere. Curr. Opin. Plant Biol. 9, 631–638. doi: 10.1016/j.pbi.2006.09.003
Lee, J. Y., and Lee, D. H. (2003). Use of serial analysis of gene expression technology to reveal changes in gene expression in Arabidopsis pollen undergoing cold stress. Plant Physiol. 132, 517–529. doi: 10.1104/pp.103.020511
Lin, S. Y., Chen, P. W., Chuang, M. H., Juntawong, P., Bailey-Serres, J., and Jauh, G. Y. (2014). Profiling of translatomes of in vivo–grown pollen tubes reveals genes with roles in micropylar guidance during pollination in Arabidopsis. Plant Cell 26, 602–618. doi: 10.1105/tpc.113.121335
Livak, K. J., and Schmittgen, T. D. (2001). Analysis of relative gene expression data using real-time quantitative PCR and the 2(-Delta Delta C(T)) Method. Methods 25, 402–408. doi: 10.1006/meth.2001.1262
Manabe, R., Kovalenko, M., Webb, D. J., and Horwitz, A. R. (2002). GIT1 functions in a motile, multi-molecular signaling complex that regulates protrusive activity and cell migration. J. Cell Sci. 115, 1497–1510.
Mascarenhas, J. P. (1975). The biochemistry of angiosperm pollen development. Bot. Rev. 41, 259–314. doi: 10.1007/BF02860839
Mascarenhas, J. P. (1993). Molecular mechanisms of pollen tube growth and differentiation. Plant Cell 5, 1303–1314. doi: 10.1105/tpc.5.10.1303
Mascarenhas, J. P., and Mermelstein, J. (1981). Messenger RNAs: their utilization and degradation during pollen germination and tube growth. Acta Soc. Bot. Pol. 50, 13–20. doi: 10.5586/asbp.1981.002
McCormick, S. (2004). Control of male gametophyte development. Plant Cell 16, S142–S153. doi: 10.1105/tpc.016659
Miernyk, J. A. (1999). Protein folding in the plant cell. Plant Physiol. 121, 695–703. doi: 10.1104/pp.121.3.695
Mishra, G., Zhang, W. H., Deng, F., Zhao, J., and Wang, X. M. (2006). A bifurcating pathway directs abscisic acid effects on stomatal closure and opening in Arabidopsis. Science 312, 264–266. doi: 10.1126/science.1123769
Modjtahedi, H., Cho, B. C., Michel, M. C., and Solca, F. (2014). A comprehensive review of the preclinical efficacy profile of the ErbB family blocker afatinib in cancer. Naunyn Schmiedebergs Arch Pharmacol. 387, 505–521. doi: 10.1007/s00210-014-0967-3
Morrissy, A. S., Morin, R. D., Delaney, A., Zeng, T., McDonald, H., Jones, S. J., et al. (2009). Next-generation tag sequencing for cancer gene expression profiling. Genome Res. 19, 1825–1835. doi: 10.1101/gr.094482.109
Pina, C., Pinto, F., Feijó, J. A., and Becker, J. D. (2005). Gene family analysis of the Arabidopsis pollen transcriptome reveals biological implications for cell growth, division control, and gene expression regulation. Plant Physiol. 138, 744–756. doi: 10.1104/pp.104.057935
Qin, Y., Leydon, A. R., Manziello, A., Pandey, R., Mount, D., Denic, S., et al. (2009). Penetration of the stigma and style elicits a novel transcriptome in pollen tubes, pointing to genes critical for growth in a pistil. PLoS Genet. 5:e1000621. doi: 10.1371/journal.pgen.1000621
Richards, S. L., Wilkins, K. A., Swarbreck, S. M., Anderson, A. A., Habib, N., Smith, A. G., et al. (2015). The hydroxyl radical in plants: from seed to seed. J. Exp. Bot. 66, 37–46. doi: 10.1093/jxb/eru398
Rodriguez Milla, M. A., Maurer, A., Rodriguez Huete, A., and Gustafson, J. P. (2003). Glutathione peroxidase genes in Arabidopsis are ubiquitous and regulated by abiotic stresses through diverse signaling pathways. Plant J. 36, 602–615. doi: 10.1046/j.1365-313X.2003.01901.x
Saldanha, A. J. (2004). Java treeview–extensible visualization of microarray data. Bioinformatics 20, 3246–3248. doi: 10.1093/bioinformatics/bth349
Singh, M. B., and Bhalla, P. L. (2007). Control of male germ-cell development in flowering plants. Bioessays 29, 1124–1132. doi: 10.1002/bies.20660
Speranza, A., Crinelli, R., Scoccianti, V., and Geitmann, A. (2012). Reactive oxygen species are involved in pollen tube initiation in kiwifruit. Plant Biol. (Stuttg). 4, 64–76. doi: 10.1111/j.1438-8677.2011.00479.x
Sun, Q., Zhou, G. F., Cai, Y. F., Fan, Y. H., Zhu, X. Y., Liu, Y., et al. (2012). Transcriptome analysis of stem development in the tumourous stem mustard Brassica juncea var. tumida Tsen et Lee by RNA sequencing. BMC Plant Biol. 12:53. doi: 10.1186/1471-2229-12-53
Tannoury, H., Rodriguez, V., Kovacevic, I., Ibourk, M., Lee, M., and Cram, E. J. (2010). CACN-1/Cactin interacts genetically with MIG-2 GTPase signaling to control distal tip cell migration in C. elegans. Dev. Biol. 341, 176–185. doi: 10.1016/j.ydbio.2010.02.025
Troppmair, J., Bruder, J. T., Munoz, H., Lloyd, P. A., Kyriakis, J., Banerjee, P., et al. (1994). Mitogen-activated protein kinase/extracellular signal-regulated protein kinase activation by oncogenes, serum, and 12-O-tetradecanoylphorbol-13-acetate requires Raf and is necessary for transformation. J. Biol. Chem. 269, 7030–7035.
Troppmair, J., Bruder, J. T., Munoz, H., Lloyd, P. A., Kyriakis, J., Banerjee, P., et al. (2002). “Pollen developmental biology,” in Plant Reproduction, Annual Plant Reviews, Vol. 6, eds S. D. O'Neill and J. A. Roberts (Sheffield: Sheffield Academic Press), 83–135.
Twell, D., Oh, S. A., and Honys, D. (2006). Pollen development, a genetic and transcriptomic view. Plant Cell Monogr. 3, 15–45. doi: 10.1007/7089_042
Wang, M. L., Hsu, C. M., Chang, L. C., Wang, C. S., Su, T. H., and Huang, Y. J. (2004). Gene expression profiles of cold-stored and fresh pollen to investigate pollen germination and growth. Plant Cell Physiol. 45, 1519–1528. doi: 10.1093/pcp/pch174
Wang, Y., Zhang, W. Z., Song, L. F., Zou, J. J., Su, Z., and Wu, W. H. (2008). Transcriptome analyses show changes in gene expression to accompany pollen germination and tube growth in Arabidopsis. Plant Physiol. 148, 1201–1211. doi: 10.1104/pp.108.126375
Wei, L. Q., Xu, W. Y., Deng, Z. Y., Su, Z., Xue, Y. B., and Wang, T. (2010). Genome-scale analysis and comparison of gene expression profiles in developing and germinated pollen in Oryza sativa. BMC Genomics 11:338. doi: 10.1186/1471-2164-11-338
Wittink, F. R. A., Knuiman, B., Derksen, J., Capkova, V., Twell, D., and Schrauwen, J. A. M. (2000). Immunochemical identification of gelsolin by western blotting in maize pollen. Chinese Sci. Bull. 45, 256–258. doi: 10.1007/BF02884686
Zhang, Y., Feng, S. H., Chen, F. F., Chen, H. D., Wang, J., McCall, C., et al. (2008). Arabidopsis DDB1-Cul4 associated factor1 forms a nuclear E3 ubiquitin ligase with DDB1 and Cul4 that is involved in multiple plant developmental processes. Plant Cell 20, 1437–1455. doi: 10.1105/tpc.108.058891
Keywords: Populus simonii × P. nigra pollen, pollen germination, pollen tube growth, transcription, DGE, differentially expressed genes
Citation: Zhao L-J, Yuan H-M, Guo W-D and Yang C-P (2016) Digital Gene Expression Analysis of Populus simonii × P. nigra Pollen Germination and Tube Growth. Front. Plant Sci. 7:825. doi: 10.3389/fpls.2016.00825
Received: 13 November 2015; Accepted: 26 May 2016;
Published: 15 June 2016.
Edited by:
Ramin Yadegari, The University of Arizona, USAReviewed by:
Ana Elena Dorantes-Acosta, Universidad Veracruzana, MexicoCaiguo Zhang, University of Colorado, Denver, USA
Copyright © 2016 Zhao, Yuan, Guo and Yang. This is an open-access article distributed under the terms of the Creative Commons Attribution License (CC BY). The use, distribution or reproduction in other forums is permitted, provided the original author(s) or licensor are credited and that the original publication in this journal is cited, in accordance with accepted academic practice. No use, distribution or reproduction is permitted which does not comply with these terms.
*Correspondence: Chuan-Ping Yang, eWFuZ2NwMDFAMTYzLmNvbQ==
 Li-Juan Zhao
 Hong-Mei Yuan
 Wen-Dong Guo
 Chuan-Ping Yang